Embed Size (px)
Citation preview
Lucia Monteoliva
is currently a visiting scientist
(postdoctoral researcher) at
the proteomics facility of the
National Center for
Biotechnology, Madrid, Spain.
Juan Pablo Albar
is a senior research scientist at
the Spanish Council for
Scientific Research (CSIC) and
Head of the proteomics facility
at the National Center for
Biotechnology, Madrid, Spain.
Keywords: Differentialproteomics, quantitativeproteomics, DIGE, SILAC,ICAT, SELDI-TOF
Juan Pablo Albar,
Proteomics Facility,
Centro Nacional de Biotecnologia
(CSIC),
UAM Campus Cantoblanco,
Darwin, 3,
Madrid, E-28049, Spain
Tel: +34 91 585 4696
Fax: +34 91 585 4506
Differential proteomics:An overview of gel and non-gel based approachesLucia Monteoliva and Juan Pablo AlbarDate received (in revised form): 18th October 2004
AbstractThe comprehensive analysis of gene expression in complex biological systems has demanded
the development of new technologies to study the cell transcriptome and the cell proteome.
Each approach has advantages and disadvantages from both the conceptual and the
methodological viewpoints. Differential proteomics, the comparison of distinct proteomes
(eg normal versus diseased cells, diseased versus treated cells etc) is of paramount importance.
Several approaches can be used and these typically involve electrophoresis and/or
chromatography combined with chemical or metabolic labelling and mass spectrometry. These
approaches aim to identify molecular targets, namely proteins, involved in different
physiopathological states. Incorporating this knowledge with knowledge from other
technologies lays the foundations of active principles at the molecular level. Here, the various
gel- and non-gel-based approaches that are used in a wide range of biological systems for the
study of differentially expressed proteins will be reviewed.
INTRODUCTIONThe science of proteomics, one of the
most important areas of research in the
post-genomic era, is not new in terms of
its experimental foundations. It has,
nonetheless, profited from unprecedented
advances in genome sequencing,
bioinformatics and the development of
robust, sensitive, reliable and reproducible
analytical techniques.
Genomics projects have produced a
large number of DNA sequences from a
wide range of organisms, including
humans and mammals. The complete
genomes for 215 organisms were available
by August 2004; of these, 28 were
eukaryotes. Together with the study of
RNA expression levels, proteomics is
associated with the analysis of global
protein expression in cells, organisms,
tissues and organelles.1,2 Proteomics is a
research field that gathers environmental
and genetic factors, and the ‘proteome’
represents the functional status of a
biological compartment.
In view of the vast amount of
information generated by genome
sequencing projects, and the need for
deciphering this information, the focus is
now on proteins, their structure, function,
interactions and modifications. Functional
genomics focuses on the characterisation
of subcellular interactions between
proteins, as well as the assessment of
macromolecular complex components.
Elucidation of protein function is
approached by characterising the
interactions that take place within cells;
this approach helps to clarify the concept
that proteins tend to form large
complexes rather than acting
independently.
Classical proteomics work involves a
separation step — usually two-
dimensional gel electrophoresis (2-DE) —
followed by an identification step, usually
mass spectrometry (MS).3 Proteins
resolved by 2-DE can be identified by in-
gel trypsin digestion via peptide mass
fingerprinting (PMF) using MS or tandem
mass spectrometry (MS/MS).4 Alternative
strategies currently involve the use of: (1)
in-solution protein extract digestion; (2)
peptide fractionation by liquid
2 2 0 & HENRY STEWART PUBLICATIONS 1473-9550. BRIEF INGS IN FUNCTIONAL GENOMICS AND PROTEOMICS . VOL 3. NO 3. 220–239. NOVEMBER 2004

chromatography or multidimensional
liquid chromatography (Mud-LC)
coupled to electrospray ionisation ion trap
tandem mass spectrometry (ESI-MS/MS);
and (3) peptide sequencing obtained
through analysis of fragmentation spectra
(MS/MS) — proteins are then identified
using computer algorithms and database
searches.5 Other recent approaches
compare different proteomes (‘differential
expression proteomics’) and involve
electrophoresis and/or chromatography
combined with metabolic or chemical
labelling.
2-DE is a relatively simple visual
method for mapping differences in
protein expression. There are certain
limitations to the universal use of this
technology, such as low detection
sensitivity and linearity, poor solubility of
membrane proteins, limited loading
capacity of gradient pH strips,
reproducibility of gels, relatively low
throughput and low linear range of
visualisation procedures.6 It is,
nevertheless, currently the most rapid
method for direct targeting of protein
expression differences. Some of the
drawbacks can be circumvented using the
differential in-gel electrophoresis (DIGE)
system developed by Amersham
Biosciences;7,8 with this technology,
fluorescent labelling of cell extracts with
one of three fluorescent dyes (Cy2, Cy3
or Cy5) is done prior to gel separation
and cellular protein levels can be
compared within a single gel.
Another approach, multidimensional
(ionic exchange, affinity and reverse-
phase) nano- or capillary chromatography
in conjunction with MS/MS, provides
unprecedented tools that enable
comparison of differentially expressed
proteins. Labelling techniques such as
isotope-coded affinity tags (ICATs),9,10
which combine differential chemical
isotope tagging of cell lysates,
multidimensional capillary
chromatography and MS/MS, have been
used extensively for differential display
analysis. Surface-enhanced laser
desorption/ionisation (SELDI) time-of-
flight mass spectrometry (TOF-MS)
enables differential protein expression
profiling of complex protein mixtures
separated by on-chip retentate
chromatography. In this paper, the use of
these and other related alternative
approaches for the differential protein
expression analysis will be discussed.11
GEL-BASED APPROACHESDifferential display via two-dimensional gel electrophoresisClassical proteomics work involves: (1) a
separation step in which proteins of
interest are separated by 2-DE (isoelectric
focusing [IEF] followed by separation as a
function of molecular mass); (2) protein
visualisation and image analysis; (3)
excising the spots to be analysed; (4) in-
gel digestion of proteins and pooling of
the released peptides; (5) analysis of the
peptide mass fingerprint (PMF) for every
digested protein through matrix-assisted
laser desorption/ionisation TOF-MS
(MALDI-TOF MS); (6) matching peptide
masses against protein databases to obtain
candidate proteins;3 and (7) validating
identification by acquisition of MS/MS
spectra of selected peptides to confirm
their sequences (Figure 1).4,12 Since
immobilised pH gradient strips (IPG)
were developed (for a review, see refs. 13
and 14), variability in experimental
conditions has decreased; this is now
undoubtedly the most widespread strategy
for comparing distinct states of two
proteomes.
Different protein visualisation methods
are available. Radiolabelling is very
sensitive, but is hazardous and expensive.
Colloidal Coomassie blue is an easy to
use, low-cost staining agent, but has poor
detectability and sensitivity and a small
linear dynamic range. Silver staining is
the most commonly used technique, as it
detects as small a quantity as a single
nanogram, but its dynamic range is also
restricted to a single order of magnitude
scale; in addition, silver staining is not
quantitative, as different proteins tend to
interact with silver ions differently.
Finally, despite of its high cost,
2-DE, LC-ESI-MS andSELDI MS as tools fordifferential proteomics
Differential proteindisplay has traditionallybeen based on 2-DEsilver-stained gels
& HENRY STEWART PUBLICATIONS 1473-9550. BRIEF INGS IN FUNCTIONAL GENOMICS AND PROTEOMICS . VOL 3. NO 3. 220–239. NOVEMBER 2004 2 2 1
Differential proteomics

fluorescent detection is gaining in
popularity because of its sensitivity and
wider linear dynamic range.15 After
protein separation and staining, further
computer-based analysis is needed to
detect differentially expressed proteins.
Computer programs are continuously
being developed and improved — eg
Progenesis (Nonlinear Dynamics), Image
Master 2D Platinum and Melanie
Software (Amersham Biosciences) or
PDQuest (Bio-Rad) — but image
Deep into visualisationmethods and imageanalysis
Figure 1: Differentialdisplay via 2-DE: classicalworkflow. Samples Aand B are resolved by 2-DE in replicate gels andsilver stained. 2-Dimages are analysed byspecific software anddifferentially expressedprotein spots areproteolytically digestedand analysed by MALDI-TOF MS. The peptidemass fingerprint (PMF) ismatched against genomicor protein databases toobtain candidateproteins. Tandem massspectrometry (MS/MS)and peptide sequencingby analysis offragmentation spectracan assist in identifyingpeptides when ambiguityremains after MALDI-TOF analysis
2 2 2 & HENRY STEWART PUBLICATIONS 1473-9550. BRIEF INGS IN FUNCTIONAL GENOMICS AND PROTEOMICS . VOL 3. NO 3. 220–239. NOVEMBER 2004
Monteoliva and Albar

analysis remains a time-consuming
process.
Protein identification is based on
matching peptide experimental masses of
proteolytically digested proteins (PMF)
versus the theoretical masses obtained in
the in silico digestion of all proteins in a
specific database. The result is a list of
candidate proteins with different
confidence levels. Despite its limitations,
for years this proteomic strategy has
proved to be very useful in the
identification of differentially expressed
proteins in all areas of biological research.
In cancer research, it was implemented
for the detection of tumour-associated
proteins in liver carcinoma,16 lung
adenocarcinoma,17 fibrosarcoma,18
lymphoma,19 breast cancer20 and prostate
cancer.21 Several putative tumour markers
have been reported, although validation
for clinical purposes — one step further
on — was not always fully accomplished.
This technology has also been applied to
the study of such organ-specific human
pathologies as thrombosis22 or heart
failure, sometimes studied in animal
models,23,24 and to address a variety of
new biological challenges such as the cell
biology of symbiotic, opportunistic or
pathogenic bacteria25–29 and fungi,30 or
virus–host cell interactions.31
Toxicological studies and drug-induced
differential protein expression are also
among the important application areas.32
This is just a short description of the work
published using so-called classical
expression proteomics.
Despite the potential and resolution of
2-DE, it remains a labour-intensive
technique that requires qualified personal
to obtain reproducible results. To
overcome gel to gel or intrinsic biological
sample variations, it is considered that, for
this type of expression proteomics study,
at least nine different gels are required for
each cell state (three different gels of three
different samples of the same biological
state). In any case, total proteome
coverage by 2-DE is experimentally
limited to proteins with molecular
weights in the 10�120 kilodalton (kD)
range, with neutral�acidic isoelectric
points. Basic or very basic proteins (above
pH 9.5) are rather difficult to focus. 2-D
gels also rarely display hydrophobic
proteins, and only highly abundant
proteins from total cell lysates are
currently visualised. Low abundance
proteins of physiological relevance, such
as regulators or signalling proteins, are
difficult to detect (for review, see ref. 33).
Due to these drawbacks, a further protein
fractionation step is needed prior to IEF
to reduce complexity. This pre-
fractionation can be achieved using
protocols based on differential solubility
or by established procedures such as liquid
chromatography or free flow
electrophoresis. Organelle enrichment or
membrane fraction preparations also
reduce complexity and allow assessment
of protein location in the cell. The use of
narrow, overlapping pH gradient strips
also increases the amount of protein
loaded, detection of low abundance
facilitating the proteins.6
Fluorescent two-dimensionaldifference gel electrophoresis:2-D DIGEClassical experimental design:
Cy3 versus Cy5
As mentioned above, an important
shortcoming of classical 2-DE approaches
is the intrinsic gel to gel variation that
requires several replicate gels of each
sample that are not directly overlapped.
This can be circumvented using
multiplexing methods such as fluorescent
two-dimensional difference in-gel
electrophoresis (2-D DIGE),7 which
substantially reduces variability by
displaying two or more complex protein
mixtures labelled with different
fluorescent dyes in a single 2D gel.
Fluorescent labelling also renders 2-D
DIGE much more quantitative than
colorimetric methods. It has a linear
dynamic range of four or five orders of
magnitude, by contrast with the
approximately one- or two-order range of
colloidal Coomassie and silver stains.34 As
regards sensitivity, 1 ng of standard
Use of 2-DE silver-stained gels in differentbiological systems
2-DE workflowdrawbacks
2-DE DIGE overcomesgel-to-gel variation andimproves quantitation
& HENRY STEWART PUBLICATIONS 1473-9550. BRIEF INGS IN FUNCTIONAL GENOMICS AND PROTEOMICS . VOL 3. NO 3. 220–239. NOVEMBER 2004 2 2 3
Differential proteomics

protein is detected with Cy3/Cy5
fluorescent labelling.35
2-D DIGE (marketed by Amersham
Biosciences) is based on the use of the
different, spectrally resolvables N-
hydroxysuccinimide derivative
fluorescent dyes Cy3 and Cy5 (for a
review, see ref. 36). These dyes label the
�-amine groups of protein lysines
specifically and covalently to form an
amide. Control and treated protein
mixtures are labelled independently with
Cy3 or Cy5 derivatives. The dyes are
designed to have the same molecular
weight and charge to ensure that proteins
common to both samples have the same
relative 2-DE mobility, regardless of the
dye used to tag them. Samples are
minimally labelled (only about 3 per cent
of the total amount of each protein is
tagged), then mixed and resolved in a
single 2-D gel. The protein spot patterns
are visualised by alternately illuminating
the gel with the excitation wavelengths
for each of the two fluorescent dyes. The
2-D images can be analysed by specific
software, such as DeCyder (Amersham
Biosciences), to detect differentially
expressed protein spots. The nature of the
minimal labelling method results in
populations of labelled and unlabelled
species for each protein. At the low
molecular weight ranges, some positional
discrepancy (shifts) between the low levels
of the labelled protein and the bulk of
unlabelled protein has been observed. In
order to maximise the amount of protein
available for MS, the total protein should
be visualised using a post-staining method
(SYPRO ruby or silver staining). Selected
spots are then robotically excised from the
gel (a preparative scale gel, if necessary)
and subjected to MS for identification.
This 2-D DIGE workflow is outlined in
Figure 2A.
The reproducibility and sensitivity of
2-D DIGE were initially established by
Unlu et al.7 using protein extracts from
two different Drosophila embryo samples.
Validation of 2-D DIGE as a tool for
toxicological applications (paracetamol
hepatotoxicity in mouse liver
homogenates, control versus treated)
determined the quantitative variation of
the process. In this study, inter-animal
response variability was about nine times
that contributed by the 2-D DIGE
process.34
Several reports have been published in
different fields using the two-dye 2-D
DIGE technology. Differential gel
electrophoresis combined with other
techniques has thus been used to analyse
insect resistance to Bacillus thuringiensis
(Bt) Cry toxins. Changes were examined
in gut proteins from the larvae of an
Indian meal moth (IMM; Plodia
interpunctella) colony showing resistance to
Bt. This study revealed a number of
changes in the levels of specific mid-gut
proteins that indicate increased
glutathione utilisation, elevation in
oxidative metabolism and differential
maintenance of energy balance within the
mid-gut epithelial cells of the resistant
larva model.37
Borner et al.38 reported proteomic (2-
D DIGE-based) and genomic analysis of
glycosylphosphatidylinositol-anchored
proteins (GAP) extracted with
phospholipase C (PLC) from Arabidopsis.
The Pi (phosphatidylinositol-specific)-
PLC-treated and control aqueous phases
were labelled with different fluorescent
Cy dyes. This revealed 30 proteins
specifically enriched in the Pi-PLC-
treated fraction and some background
proteins present in both fractions.
2-D DIGE has also been applied to
biomedical studies. In a study of renal
physiology, it was used to identify inner
medullary collecting duct proteins with
different expression in cortical or outer
cells.39 In addition, proteomic analysis of
long-term vasopressin action in the inner
medullary collecting duct of the
Brattleboro rat showed 43 proteins that
differ in abundance or in mobility; these
results were confirmed by semi-
quantitative immunoblotting and
immunohistochemical approaches.40
2-D DIGE has also been used in the
search for cancer-specific protein markers
— eg to quantify differences in protein
2-DE DIGE minimallabelling features andworkflow
Use of two fluorescentdyes in 2-DE DIGEapplications
2 2 4 & HENRY STEWART PUBLICATIONS 1473-9550. BRIEF INGS IN FUNCTIONAL GENOMICS AND PROTEOMICS . VOL 3. NO 3. 220–239. NOVEMBER 2004
Monteoliva and Albar
expression between laser capture
microdissection-procured oesophageal
carcinoma cells and normal epithelial
cells.41 A preliminary study of human
infiltrating ductal breast carcinoma
demonstrated that 2-D DIGE portraits
might be a reflection of histological and
pathological status.42
Figure 2: Schematic overview of 2-D fluorescent difference in-gel electrophoresis (2-DDIGE) technology. (A) Two fluorescent dyes design. Samples A and B are fluorescently labelledwith either Cy3 or Cy5. The labelled samples are mixed and resolved in a single 2-D gel. Theprotein spot patterns are visualised by alternately illuminating the gel with Cy3 and Cy5excitation wavelengths. The 2-D images are analysed by specific software. Differentiallyexpressed protein spots, visualised with SYPRO ruby or silver post-staining, can be identifiedby mass spectrometry. (B) Three fluorescent dyes design with pooled internal standard.Samples A and B are fluorescently labelled with either Cy3 or Cy5, and a pooled internalstandard (with equal amounts of all the samples in the experiment) is labelled with Cy2.Samples are mixed and resolved in a single 2-DE gel. Protein spot patterns are visualised byalternately illuminating the gel at the excitation wavelengths of each dye. 2-D images areanalysed by specific software and the internal standard is used for normalisation. Statisticalanalysis is performed and differentially expressed protein spots can be identified by MS
& HENRY STEWART PUBLICATIONS 1473-9550. BRIEF INGS IN FUNCTIONAL GENOMICS AND PROTEOMICS . VOL 3. NO 3. 220–239. NOVEMBER 2004 2 2 5
Differential proteomics

Among neuroscience-related
applications, identification of proteins
with age-related expression in cat primary
visual cortex has been reported. Protein
extracts from the visual cortical area of 17
adult cats and 30-day-old kittens were
compared.43 Analysis of the brain
proteome of genetically altered mice
revealed alterations of stress-related
proteins.44
Only three protein changes were
detected in the mitochondrial proteome
from mouse heart when double knockout
mice for two isoforms of creatine kinase
and C57BL/6 mouse heart mitochondria
were compared.45 In another study, six
protein changes were implicated in
ischaemia reperfusion injury when 2-D
DIGE was used to compare normal,
ischaemic and ischaemia-reperfused rat
hearts.46
2-D DIGE has also been applied to the
study of D. melanogaster immune
responses. Comparative analysis of the
haemolymph proteome of 2,000 third-
instar Drosophila larvae showed ten
different proteins that appear very soon
after an immune challenge with
lipopolysaccharides.47
Internal standard: Cy3 versus Cy5
versus Cy2
A novel 2-D DIGE experimental design
includes the use of a special ‘internal
standard’ created by ‘pooling aliquots’ of
all samples in the experiment labelled
with a third spectrally resolvable dye,
Cy2. This pooled internal standard is run
in the same gel as control and treated
samples previously labelled with Cy3 and
Cy5. The Cy2-labelled internal standard
is composed of equal amounts of each
control and treated sample, and is
included in all gels to normalise protein
abundance measurements across multiple
gel experiments. The use of this internal
standard reduces gel to gel variation over
conventional 2-D DIGE and facilitates
the use of image analysis software
(DeCyder) for automated and accurate
spot quantitation, gel to gel matching and
statistical analysis. This improvement,
together with randomised criss-cross
experimental design in which control and
treated samples are each tagged with Cy3
or Cy5, provides statistical confidence in
the detection and quantitation of subtle
variations in protein expression.48
This three-dye internal standard
technique, outlined in Figure 2B, has
been applied in a wide range of biological
areas. Liver toxicity in model animals has
been analysed in two studies: paracetamol
toxicity49 and hydrazine toxicity as a
model of multivariate data analysis.50
Using a genetic neurokinin 1 receptor
knockout mouse model system, eight
differentially expressed proteins were
identified in cerebral cortex tissues.51 The
three-dye method has also been applied in
cancer research, using a breast cancer cell
model system, to identify differentially
expressed proteins in a growth factor
stimulation time course.35 It has also been
used to identify 52 unique proteins with
altered abundance in the proteome of
human colorectal tumour cells relative to
the adjacent normal mucosa of six
different patients.52
In microbiology, Gade et al.53
evaluated the use of 2-D DIGE, including
an internal standard, to detect and
quantify proteins specific for glucose or
N-acetylglucosamine metabolism in the
marine bacterium Pirellula sp.; 24 proteins
differing in abundance were identified
with high statistical confidence.
Saturated labelling approach
Although 2-DDIGE enables increased
confidence in the detection of protein
differences, only 3�5 per cent of a given
protein is tagged by the minimal labelling
method. To increase sensitivity,
Amersham Pharmacia developed a new set
of DIGECy3 and Cy5 fluorescent dyes.
Protein cysteine residues are fully labelled
with these newmaleimide cyanine dyes,
enhancing sensitivity for low abundance
samples. In addition, protein spots are
excised directly from the saturation-
labelled gel, eliminating the need for post-
stained preparative gels.54 Nevertheless,
only two dyes are currently commercially
The internationalstandard andappropriateexperimental designallow normalisation andstatistical analysis in2-DE DIGE experiments
Application of 2-DEDIGE using threefluorescent dyes
2 2 6 & HENRY STEWART PUBLICATIONS 1473-9550. BRIEF INGS IN FUNCTIONAL GENOMICS AND PROTEOMICS . VOL 3. NO 3. 220–239. NOVEMBER 2004
Monteoliva and Albar

available, and the 2D-spot pattern is
modified. Expression differences in
motility-regulating proteins frommurine
primitive haematopoietic cell populations
have been identified using this approach.55
Other gel-based approachesFew reports have been published
describing the use of alternative
multiplexing methods for differential
expression studies. In 1983, Goldman et
al.56 described a method that made use of
metabolic labelling of proteins using
radioactive isotope-labelled amino acids,
2-DE and recording on colour negative
film by radiographic exposure. A sub-
proteome differential display method that
uses radiolabelled proteins from one
source and silver-stained proteins from a
second source, mixed in a gel in a 1:100
ratio, allowed precise discrimination
between members of each sub-proteome
(chromatographic fractions) using
commonly available software.57
Combination of radiolabelling and
SYPRO ruby staining of the same gels
allows precise quantitation of the protein
amount as well as of the 35S incorporated.
This quantitative proteome profiling was
developed by Gerner and co-workers to
determine absolute values of cell protein
amounts, as well as synthesis and turnover
rates.58 The same method was recently
used to compare quiescent human T cells,
phytohaemagglutinin-stimulated T cells
and Jurkat cells, and to study human
umbilical vein endothelial cells treated for
6 hours with vascular endothelial growth
factor.59
Because in vivo radioactive protein
labelling is not always feasible, the
fluorescence-based methods are more
widely distributed.
NON-GEL APPROACHES:MS-BASED APPROACHESQuantitative proteomics basedon stable isotope taggingand MSBecause of the limitations that arise from
classical proteomics approaches (2-DE
followed by MS), other methods have
gained popularity, such as Mud-LC on-
line with ESI-MS/MS.5,60 In these
approaches, complex mixtures of proteins
are digested in solution. The resulting
peptide mixture is fractionated by one or
several steps of capillary chromatography
and analysed in a data-dependent manner
by MS/MS. These techniques share the
limitations of 2-DE for a dynamic range
of analysis (usually 103–105) and
identification of low concentration
proteins is achieved through pre-
fractionation techniques in a similar
manner to pre-fractionation methods used
in 2-DE gel analysis. Although classically
one of the limitations of LC/MS-based
methods is the difficulty in performing
differential display analysis, several reports
have recently appeared showing the
feasibility of relative peptide
quantification with these strategies.61–64
Alternative or complementary MS-
based approaches have been developed for
differential protein expression
measurements and are currently being
improved. They are based on the
differential labelling of perturbed and
non-perturbed protein extracts with
different stable isotopes (12C/13C,14N/15N and 1H/2H). In this way, the same
peptide from two different samples will
show the same chemical behaviour, with
a difference in mass detectable by MS
techniques. Peptide peak intensities can
be used for relative quantification of these
peptides. The workflow for this
methodology (outlined in Figure 3) is as
follows: (1) differential isotopic labelling;
(2) digestion of combined protein samples
to obtain peptide mixtures; (3)
chromatographic fractionation of mixed
peptide samples; (4) analysis of the
separated peptides by MS/MS; and (5)
processing of the MS results to obtain
relative protein abundance as well as
protein identification by database
searching.
Several recent papers have reviewed in
detail the different chemical, metabolic
and enzymatic labelling techniques used
to date. The basis of these strategies, the
Less frequently usedmultiplexing methods
Isotope tagging allowsdifferential proteomicsbased on LC-MS
& HENRY STEWART PUBLICATIONS 1473-9550. BRIEF INGS IN FUNCTIONAL GENOMICS AND PROTEOMICS . VOL 3. NO 3. 220–239. NOVEMBER 2004 2 2 7
Differential proteomics
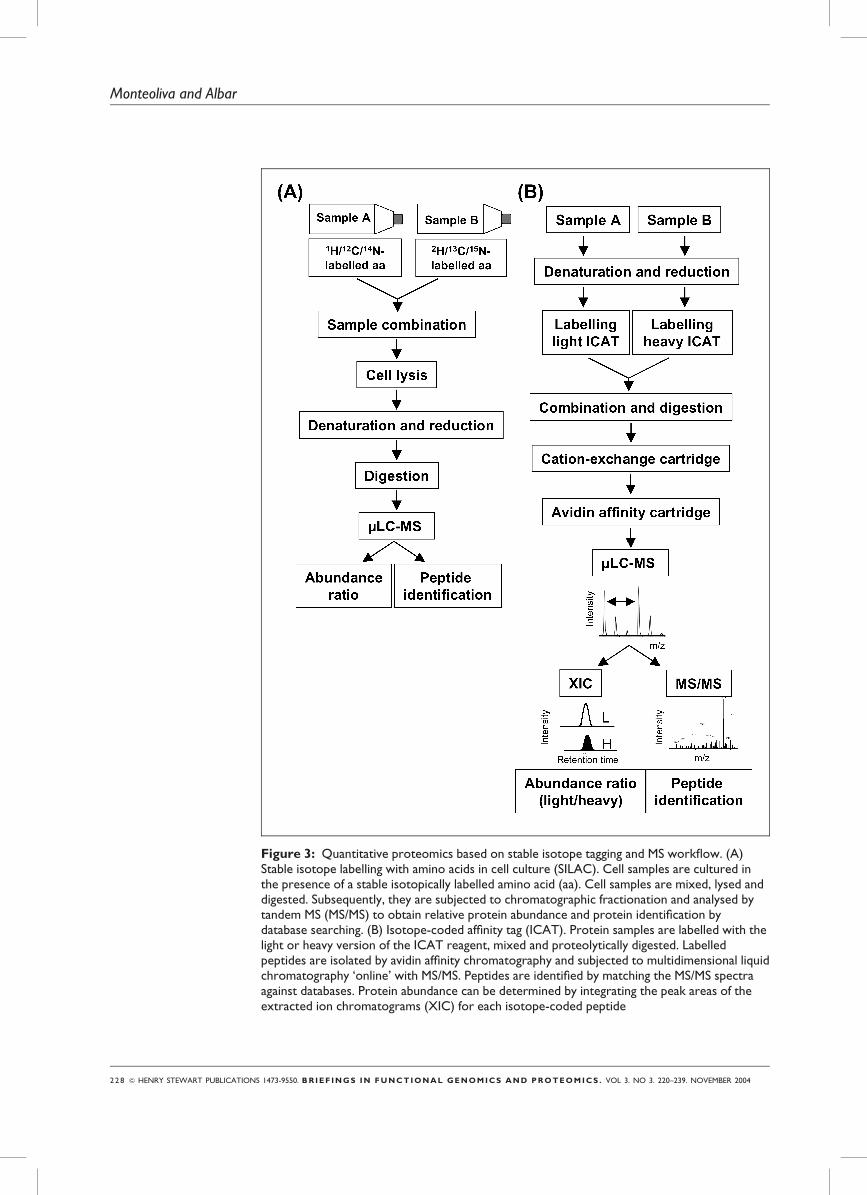
Figure 3: Quantitative proteomics based on stable isotope tagging and MS workflow. (A)Stable isotope labelling with amino acids in cell culture (SILAC). Cell samples are cultured inthe presence of a stable isotopically labelled amino acid (aa). Cell samples are mixed, lysed anddigested. Subsequently, they are subjected to chromatographic fractionation and analysed bytandem MS (MS/MS) to obtain relative protein abundance and protein identification bydatabase searching. (B) Isotope-coded affinity tag (ICAT). Protein samples are labelled with thelight or heavy version of the ICAT reagent, mixed and proteolytically digested. Labelledpeptides are isolated by avidin affinity chromatography and subjected to multidimensional liquidchromatography ‘online’ with MS/MS. Peptides are identified by matching the MS/MS spectraagainst databases. Protein abundance can be determined by integrating the peak areas of theextracted ion chromatograms (XIC) for each isotope-coded peptide
2 2 8 & HENRY STEWART PUBLICATIONS 1473-9550. BRIEF INGS IN FUNCTIONAL GENOMICS AND PROTEOMICS . VOL 3. NO 3. 220–239. NOVEMBER 2004
Monteoliva and Albar

specific characteristics of each kind of
labelling, as well as advantages and
limitations have been discussed
extensively.65–69 Here, the focus will be
on two of the most used non-gel MS-
based quantitative proteomic approaches
and some of their recent applications will
be described.
Metabolic isotopic labelling: SILAC
Addition of stable isotope labels to culture
media during cell growth yields isotope-
labelled proteins. This approach was first
described using Saccharomyces cerevisiae
grown in either 14N minimal media or15N-enriched minimal media to
quantitate protein expression.70
The use of a specific isotopic amino
acid (eg deuterated L-leucine or 13C-
labelled arginine), rather than the entire
pool of amino acids described above, was
termed stable isotope labelling by amino
acids in cell culture (SILAC) by Mann
and colleagues (Figure 3A).65,71 In this
case, the mass difference between labelled
and unlabelled peptides is predictable, and
MS/MS spectra interpretation becomes
easier. The technique was first applied to
the relative quantitation of changes in
protein expression during the process of
muscle cell differentiation, and was
described as a simple, inexpensive and
accurate method. Pratt et al.72,73 found the
use of isotope-labelled amino acids useful
as an aid to protein identification in
peptide mass fingerprinting and for the
study of protein turnover in yeast.
SILAC has also been applied, in very
elegant approaches, to the characterisation
of protein–protein interactions in the
study of the epidermal growth factor
(EGF) pathway74 and of proteins that
participate in early stages of cell spreading
by interacting with focal adhesion
proteins.75 RNA and RNA-binding
protein involvement in cell spreading
through the spreading initiation centre
(SIC), a previously undescribed structure,
were identified. Peptide�protein
interactions in the EGF pathway were
also screened using a SILAC approach.76
Synthetic peptides in ‘active’ (tyrosine-
phosphorylated peptide of the EGF
receptor) and ‘control’ (non-
phosphorylated) forms were used as bait
in affinity pull-down experiments.
SILAC differential labelling was also
used before membrane disorganisation to
identify lipid raft proteins, to distinguish
real raft components from non-raft
contamination. A set of 241 authentic
lipid raft proteins was obtained, including
a large proportion of signalling molecules
(kinases and phosphatases or G
proteins).77 SILAC application to clinical
studies includes a recent prostate cancer
study.78 Sixty proteins were found with a
>3-fold increase in basal levels in the
highly metastatic cells, whereas levels of
22 other proteins were reduced. Western
blot experiments confirmed the results
obtained using the SILAC approach.
Chemical labelling: ICAT
Metabolic approaches based on the
biological incorporation of isotope-
labelled amino acids are not practical for
any kind of biological sample, as only
proteins extracted from growing cells can
be used. Chemical incorporation of
isotopic tags after protein extraction is
thus the best protein-tagging alternative
when metabolic labelling is not feasible.
The most commonly used method in
quantitative proteomics is based on the
use of isotope-coded affinity tag (ICAT)
reagents developed by the Aebersold
group.9
The ICAT reagent-based analysis
workflow (Figure 3B) comprises the
following steps: (1) protein extraction and
reduction of control and treated samples;
(2) chemical labelling of protein sulph-
hydryl groups with the ‘light’ and ‘heavy’
versions of the ICAT reagent; (3) mixing
of both samples and digestion by an
endoprotease; (4) isolation of labelled
peptides; (5) peptide fractionation usually
usingMud-LC— strong-cation exchange
(SCX) liquid chromatography followed by
reversed-phase (RP) microcapillary liquid
chromatography; (6) MS/MS analysis with
an ESI-tandemmass spectrometer; (7)
automated database searching to identify
SILACmetaboliclabelling has beenapplied to identifydifferentially expressedproteins as well asprotein-interactions(with proteins, peptidesor RNA)
ICAT chemical labellingis useful for all kinds ofprotein samples
& HENRY STEWART PUBLICATIONS 1473-9550. BRIEF INGS IN FUNCTIONAL GENOMICS AND PROTEOMICS . VOL 3. NO 3. 220–239. NOVEMBER 2004 2 2 9
Differential proteomics

peptide sequences (and, thus, the proteins
fromwhich they are derived); and (8)
determination of relative protein
abundance from theMS data. The peak
areas of the extracted ion chromatograms
(representing total ion currents for each
peptide eluted from the column at a given
time) for each isotope-coded peptide are
used to determine relative peptide (and,
hence, protein) abundance.
Strategies in which peptides eluted
from the chromatography column are
spotted directly onto a MALDI target
have also been used (see refs. 65, 66 and
68 for detailed reviews).
The first ICAT reagent, reported by
Aebersold and colleagues, was composed
of three parts: a reactive group specific for
thiol groups, a linker and a biotin moiety
for affinity chromatography purification
using immobilised avidin. The linker has
either eight deuterium atoms in the heavy
(d8) form or is undeuterated in the light
(d0) form.9 Use (or not) of deuterium
causes differential chromatographic
elution profiles of the heavy and light
forms of a given differentially labelled
peptide, yielding inaccurate
measurements of abundance. The
relatively large size of the biotin tag makes
interpretation of the MS/MS spectra
difficult; a new generation of ICAT
reagents was thus developed with nine13C or 12C atoms at the linker moiety and
a cleavable spacer to allow biotin removal
(Applied Biosystems).
Several applications have been reported
using the ICAT technology. The use of
cleavable ICAT led to development of a
method to determine the subcellular
location of membrane proteins through a
series of pairwise comparisons of gradient
fractions. This method allows assignment
of proteins to a specific compartment in
Arabidopsis thaliana without the need to
obtain pure organelles.79 Shiio and co-
workers, besides using (d0/d8) ICAT
reagents to compare the global protein
expression pattern in rat myc-null cells
versus myc-plus cells,80 developed a
method to identify and quantify
chromatin-associated proteins induced by
Myc oncoprotein expression in human B
lymphocytes.81
Two other very informative studies of
macromolecular complexes using the
ICAT reagent-based technology are the
study of Ste12 protein complexes from
yeast cells in different states82 and the
dynamic changes in transcription factor
complexes during erythroid
differentiation.83 In the former study,
(d0/d8)-ICAT was useful not only to
determine relative abundance changes in
the composition of isolated complexes,
but also to distinguish specific complex
components from co-purified proteins.
Based on ICAT strategy, Brand et al.83
reported an interesting model of
activation and repression of �-globin gene
expression during erythroid
differentiation.
Cleavable (C12/C13) ICAT has shown
its potential in other biological
applications, such as the study of the
redox state of proteins84 and identification
of metalloproteinase substrates in breast
carcinoma cells.85
ICAT reagent-based quantitative
proteomics analysis for differential
expression studies of total proteomes are
also reported. The study of whole
proteome changes in the opportunistic
bacterial pathogen, Pseudomonas aeruginosa,
cultured under conditions that induce
expression of virulence factors, identified
several conserved Gram-negative proteins
involved in that process. The comparative
ICAT analyses of membrane versus whole
cell proteins allowed the detection of
protein changes in subcellular
compartmentalisation.86 ICAT
technology was applied to the study of
changes in the global proteome of yeast as
a model eukaryotic system in two studies:
protein changes as a consequence of salt
stress87 and the comparison with an upf1
mutant.88 Eukaryotic samples of higher
complexity were analysed using ICAT
reagent and Mud-LC. Examples include
the analysis of protein expression changes
induced in murine MC3T3 osteoblast
cells,89 mouse neurones (in the analysis of
DNA damage-induced neuronal death),90
First and secondgeneration ICATreagent features
ICAT applications insubcellular proteinlocation,macromolecularcomplexes and redoxstate of proteins
2 3 0 & HENRY STEWART PUBLICATIONS 1473-9550. BRIEF INGS IN FUNCTIONAL GENOMICS AND PROTEOMICS . VOL 3. NO 3. 220–239. NOVEMBER 2004
Monteoliva and Albar
cystic fibrosis,91 androgen-stimulated and
unstimulated LNcap prostate cancer
cells92 and intestinal epithelial cells in
response to an enteropathogenic
Escherichia coli strain.93
Taken together, these studies show
that, despite the enormous potential of
this technology developed for the
simultaneous analysis of complex
proteomes, we are far from being able to
generate a picture of a whole proteome.
In yeast, for example, between 56087 and
70088 proteins have been identified,
which represents about 10 per cent of the
yeast genome; 2,501 were found (about 9
per cent) in murine osteoblast cells89 and
over 2,000 in human polarised intestinal
epithelial monolayers.93 An important
disadvantage of the ICAT method is that
proteins lacking cysteines are not
detected.
A new ICAT variant based on the use
of ICAT reagent to tag samples from two
cell types, combination of the two
samples and separation by 2-DE in a
single gel, protein detection by MS-
compatible stains and identification and
quantification by MS has been reported.
The abundance ratio of the proteins in the
spot is determined by the signal intensity
ratio for the two isotopic forms of the
label peptide.94 A similar approach
requiring metabolic labelling has been
described for Plasmodium falciparum,95 rat
hepatocytes,96 the multicellular organisms
Caenorhabditis elegans and D. melanogaster97
and for the quantitation of protein
expression and site-specific
phosphorylation in yeast.98
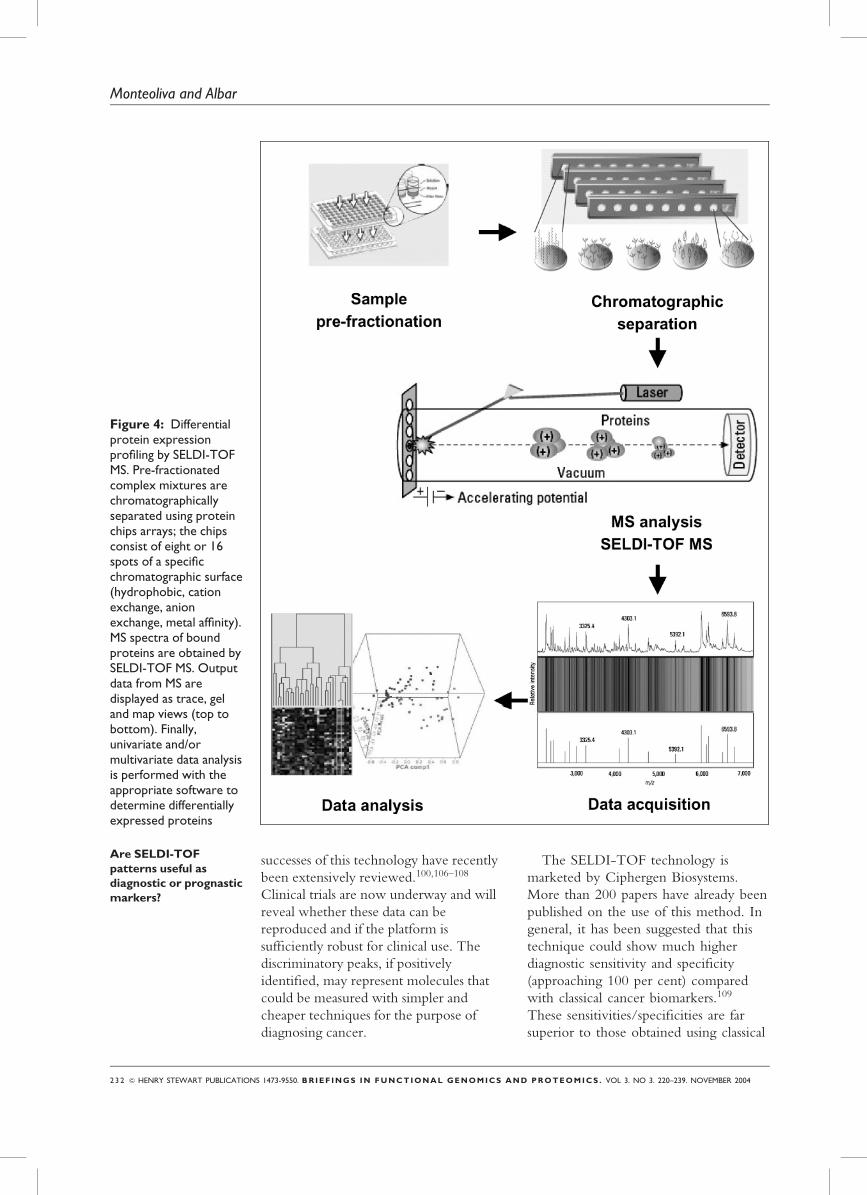
SELDI-TOF: protein profilingSELDI-TOF MS enables analysis of
complex protein mixtures separated by
on-chip retentate chromatography.11 The
analytical procedure involves a few
common steps, beginning with
chromatographic separation. The
biological fluid of interest is pre-
fractionated or loaded directly onto
several chemically treated supports —
protein chip arrays — with specific
chromatographic features (cationic,
anionic, hydrophobic, hydrophilic, ion
metal chelating). Each surface is designed
to retain proteins according to a general
or specific physicochemical property of
the protein, yielding an on-surface
chromatographic protein separation. The
second step is MS spectra acquisition —
after washing, the immobilised proteins
are co-crystallised with a matrix on a
target surface and MS spectra are acquired
by a specific mass analyser, eg a SELDI-
TOF mass spectrometer. Low-resolution
protein patterns or retentate maps of the
proteins bound to each chromatographic
surface are thus generated. Unlike LC-
MS, which is based on elution, SELDI-
TOF MS combines retention with MS. In
most instances, it does not allow direct
identification of proteins that may be
potential disease biomarkers. Finally, in
data analysis and interpretation/
evaluation, peak comparisons are made
using multifactorial bioinformatic
software (tree classifiers, neural networks,
cluster analysis, test statistics) (Figure 4).
The technique is best for relatively small
(,20 kD) proteins and protein fragments.
This method constitutes a rapid,
reproducible analytical tool that enables
the comparative analysis of protein
expression profiles in the low fmol range,
although it has the same dynamic range
limitations as other MS technologies.
Proteins from complex biological
specimens such as serum, plasma,
intestinal fluid, urine, cell lysates and cell
secretion products have been profiled
using SELDI-TOF MS. Serum proteomic
profiling using SELDI-TOF MS is a
promising new approach for cancer
diagnostics.99 The central hypothesis is as
follows: protein or protein fragments
produced by cancer cells or their
microenvironment may eventually enter
the general circulation. The different
protein/fragment patterns could then be
analysed by MS and used for diagnostic
purposes, in combination with a
bioinformatic algorithm.100 The cancer
types that have been examined include
ovarian,101 prostate,102 breast,103
bladder104 and renal.105 Apparent
ICAT studies ofcomplex proteomes:only a small percentageof the total proteome isidentified
ICAT labellingcombined with 2-DE
SELDI-TOF combineschromatographicdifferential proteinretention and TOF MS
SELDI and detection ofcancer biomarkers
& HENRY STEWART PUBLICATIONS 1473-9550. BRIEF INGS IN FUNCTIONAL GENOMICS AND PROTEOMICS . VOL 3. NO 3. 220–239. NOVEMBER 2004 2 3 1
Differential proteomics
successes of this technology have recently
been extensively reviewed.100,106–108
Clinical trials are now underway and will
reveal whether these data can be
reproduced and if the platform is
sufficiently robust for clinical use. The
discriminatory peaks, if positively
identified, may represent molecules that
could be measured with simpler and
cheaper techniques for the purpose of
diagnosing cancer.
The SELDI-TOF technology is
marketed by Ciphergen Biosystems.
More than 200 papers have already been
published on the use of this method. In
general, it has been suggested that this
technique could show much higher
diagnostic sensitivity and specificity
(approaching 100 per cent) compared
with classical cancer biomarkers.109
These sensitivities/specificities are far
superior to those obtained using classical
Are SELDI-TOFpatterns useful asdiagnostic or prognasticmarkers?
Figure 4: Differentialprotein expressionprofiling by SELDI-TOFMS. Pre-fractionatedcomplex mixtures arechromatographicallyseparated using proteinchips arrays; the chipsconsist of eight or 16spots of a specificchromatographic surface(hydrophobic, cationexchange, anionexchange, metal affinity).MS spectra of boundproteins are obtained bySELDI-TOF MS. Outputdata from MS aredisplayed as trace, geland map views (top tobottom). Finally,univariate and/ormultivariate data analysisis performed with theappropriate software todetermine differentiallyexpressed proteins
2 3 2 & HENRY STEWART PUBLICATIONS 1473-9550. BRIEF INGS IN FUNCTIONAL GENOMICS AND PROTEOMICS . VOL 3. NO 3. 220–239. NOVEMBER 2004
Monteoliva and Albar

techniques to detect cancer biomarkers.
Some papers110,111 have questioned the
validity of the results obtained with this
technology and propose experiments to
investigate these questions in detail
before clinical use of the technique.
Several statistical analyses have been
performed on the original ovarian cancer
work. This analysis uncovered numerous
problems with study designs and sample
collection and handling.112,113 This calls
into question the original claims of
SELDI patterns as diagnostic or
prognostic markers. Nevertheless, Zhang
et al.114 have recently reported a
coordinated multicentre study, using 503
serum samples from ovarian cancer
patients at stages I/II and III/IV of the
disease and 142 healthy women,
specifically designed to alleviate the
impact of these factors and to show the
validity of this technological platform as
well as the potential of the identified
biomarkers to improve the detection of
early-stage ovarian cancer.114 The
method must clearly be thoroughly
validated before clinical implementation
is warranted. The most important
criticism of the use of this methodology
is based on the fact that, since proteins
are not usually identified, it is difficult to
support the central hypothesis that these
differential protein features come from
cancer cells or their microenvironment.
Without identification, it cannot be
known whether a protein peak is related
to a disease state or not.
The potential of this method has been
extended to conditions such as
Alzheimer’s disease, Creutzfeldt-Jakob
disease and renal allograft rejection.115,116
It has also been used in targeted studies to
characterise protein–protein and protein–
DNA interactions,117,118 as well as to
characterise phosphorylated and
glycosylated proteins119,120 or
transcription factors.121
CONCLUDING REMARKSIn studying a biological system, both
genomics and proteomics approaches are
being implemented with increasing
frequency to obtain an integrated view of
cell physiology; genomic and proteomic
data have proven to be
complementary.122,123
The wide dynamic range of
intracellular or serum protein
concentration, the much more reduced
range detectable by bioanalytical
techniques and the lack of protein
amplification procedures are issues that
proteomics strategies must address. To
improve global proteome coverage, cell
fractionation is a mandatory step in
overcoming these important drawbacks.
Traditional approaches for differential
display protein analysis based on 2-DE
and colourimetric staining are still very
useful, and have produced many
contributions even considering their
intrinsic sensitivity- and reproducibility-
associated limitations. Nevertheless, the
uniqueness of 2-DE for easy visualisation
of protein isoforms, using two physical
parameters such as isoelectric point and
molecular weight, renders this technology
itself extremely informative.
Quantitative differential proteomics has
required the use of alternative approaches
to expand the analytical range offered by
classical 2-DE. Among them, gel- and
non-gel-based methods such as 2-D
DIGE, ICAT reagent-based methods,
SILAC and SELDI-TOF are notable. The
introduction of fluorescent 2-D DIGE
with the use of pooled internal standards,
together with sample pre-fractionation
approaches, has greatly improved the
efficiency of 2-DE methods as a truly
quantitative differential display
technology. Stable isotope tagging
strategies and MS/MS have also allowed
quantitative differential proteomics by
focusing on peptide comparison as a
‘reflection/image’ of the proteins from
which they are derived and, hence, their
proteomes. Gel- and non-gel-based
approaches provide closely related but
distinct information about proteins,
suggesting that they are complementary,
or at least supplementary, methods.
The recent introduction of SELDI-
TOF MS has allowed the acquisition of
SELDI applicationsother than cancer
Gel- and non-gel-basedapproaches arecomplementary indifferential proteomics
& HENRY STEWART PUBLICATIONS 1473-9550. BRIEF INGS IN FUNCTIONAL GENOMICS AND PROTEOMICS . VOL 3. NO 3. 220–239. NOVEMBER 2004 2 3 3
Differential proteomics

protein patterns from complex protein
mixtures, mainly body fluids such as
plasma or serum associated with many
human diseases. Before this technique can
be applied to clinical use, it must be
validated extensively, but it may,
nonetheless, be the most promising
approach for biomarker discovery in
clinical proteomics.
ACKNOWLEDGMENTS
We gratefully acknowledge Dr Alberto Paradela for
critical reading of the manuscript and Cathy Mark
for editorial assistance.
References
1. Anderson, N. G. and Anderson, N. L.(1996), ‘Twenty years of two-dimensionalelectrophoresis: past, present and future’,Electrophoresis, Vol. 17, pp. 443–453.
2. Pandey, A. and Mann, M. (2000),‘Proteomics to study genes and genomes’,Nature, Vol. 405, pp. 837–846.
3. Andersen, J. S. and Mann, M. (2000),‘Functional genomics by mass spectrometry’,FEBS Lett., Vol. 480, pp. 25–31.
4. Corthals, G. L., Gygi, S. P., Aebersold, R.and Patterson, S. P. (1999), ‘Identification ofproteins by mass spectrometry’, in RabilloudT. (Ed.), ‘Proteome Research: Two–DimensionalGel Electrophoresis and Identification Methods’,Springer Verlag, New York, NY,pp. 197–231.
5. Link, A. J., Eng, J., Schieltz, D. M. et al.(1999), ‘Direct analysis of protein complexesusing mass spectrometry’, Nat. Biotechnol.,Vol. 17, pp. 676–682.
6. Lopez, J.A., Bernard, A. and Albar, J. P.(2004), ‘Protein expression profiling analysisin hematopoietic stem cells: phenotypiccharacterization of mesenchymal stem cells’,in Sanchez, J. C., Corthals, G. andHochstrasser, D. F. (Eds), ‘BiomedicalApplications of Proteomics’, WILEY-VCHVerlag, Weinheim, Germany, pp. 155–171.
7. Unlu, M., Morgan, M. E. and Minden, J. S.(1997), ‘Difference gel electrophoresis: asingle gel method for detecting changes inprotein extracts’, Electrophoresis, Vol. 18, pp.2071–2077.
8. URL:http://www.amershambiosciences.com.
9. Gygi, S. P., Rist, B., Gerber, S. A. et al.(1999), ‘Quantitative analysis of complexprotein mixtures using isotope-coded affinitytags’, Nat. Biotechnol., Vol. 17, pp. 994–999.
10. Gygi, S. P. and Aebersold, R. (2000), ‘Mass
spectrometry and proteomics’, Curr. Opin.Chem. Biol., Vol. 4, pp. 489–494.
11. Merchant, M. and Weinberger, S. R. (2000),‘Recent advancements in surface-enhancedlaser desorption/ionization-time of flight-mass spectrometry’, Electrophoresis, Vol. 21,pp. 1164–1177.
12. Molloy, M. P. and Witzmann, F. A. (2002),‘Proteomics: technologies and applications’,Brief. Funct. Genom. Proteom., Vol. 1,pp. 23–39.
13. Gorg, A., Obermaier, C., Boguth, G. et al.(2000), ‘The current state of two-dimensionalelectrophoresis with immobilized pHgradients’, Electrophoresis, Vol. 21, pp.1037–1053.
14. Lilley, K. S., Razzaq, A. and Dupree, P.(2002), ‘Two-dimensional gelelectrophoresis: recent advances in samplepreparation, detection and quantitation’,Curr. Opin. Chem. Biol., Vol. 6, pp. 46–50.
15. Patton, W. F. (2002), ‘Detectiontechnologies in proteome analysis’, J.Chromatogr. B Analyt. Technol. Biomed. LifeSci., Vol. 771, pp. 3–31.
16. Jungblut, P. R., Zimny-Arndt, U., Zeindl-Eberhart, E. et al. (1999), ‘Proteomics inhuman disease: cancer, heart and infectiousdiseases’, Electrophoresis, Vol. 20, pp.2100–2110.
17. Chen, G., Gharib, T. G., Wang, H. et al.(2003), ‘Protein profiles associated withsurvival in lung adenocarcinoma’, Proc. Natl.Acad. Sci. USA, Vol. 100, pp. 13537–13542.
18. Sinha, P., Hutter, G., Kottgen, E. et al.(1999), ‘Search for novel proteins involved inthe development of chemoresistance incolorectal cancer and fibrosarcoma cells invitro using two-dimensional electrophoresis,mass spectrometry and microsequencing’,Electrophoresis, Vol. 20, pp. 2961–2969.
19. Antonucci, F., Chilosi, M., Parolini, C. et al.(2003), ‘Two-dimensional molecularprofiling of mantle cell lymphoma’,Electrophoresis, Vol. 24, pp. 2376–2385.
20. Giometti, C. S., Williams, K. and Tollaksen,S. L. (1997), ‘A two-dimensionalelectrophoresis database of human breastepithelial cell proteins’, Electrophoresis, Vol.18, pp. 573–581.
21. Ahram, M., Best, C. J., Flaig, M. J. et al.(2002), ‘Proteomic analysis of human prostatecancer’,Mol. Carcinogen., Vol. 33, pp. 9–15.
22. Gelfi, C., Vigano, A., Ripamonti, M. et al.(2004), ‘A proteomic analysis of changes inprothrombin and plasma proteins associatedwith the G20210A mutation’, Proteomics, Vol.4, pp. 2151–2159.
23. Sawicki, G. and Jugdutt, B. I. (2004),‘Detection of regional changes in protein
2 3 4 & HENRY STEWART PUBLICATIONS 1473-9550. BRIEF INGS IN FUNCTIONAL GENOMICS AND PROTEOMICS . VOL 3. NO 3. 220–239. NOVEMBER 2004
Monteoliva and Albar

levels in the in vivo canine model of acuteheart failure following ischemia-reperfusioninjury: functional proteomics studies’,Proteomics, Vol. 4, pp. 2195–2202.
24. Schwertz, H., Langin, T., Platsch, H. et al.(2002), ‘Two-dimensional analysis ofmyocardial protein expression followingmyocardial ischemia and reperfusion inrabbits’, Proteomics, Vol. 2, pp. 988–995.
25. Djordjevic, M. A. (2004), ‘Sinorhizobiummeliloti metabolism in the root nodule: aproteomic perspective’, Proteomics, Vol. 4, pp.1859–1872.
26. Arevalo-Ferro, C., Hentzer, M., Reil, G. etal. (2003), ‘Identification of quorum-sensingregulated proteins in the opportunisticpathogen Pseudomonas aeruginosa byproteomics’, Environ. Microbiol., Vol. 5, pp.1350–1369.
27. Morales, G., Linares, J. F., Beloso, A. et al.(2004), ‘The Pseudomonas putida Crc globalregulator controls the expression of genesfrom several chromosomal catabolic pathwaysfor aromatic compounds’, J. Bacteriol., Vol.186, pp. 1337–1344.
28. Cases, I., Lopez, J. A., Albar, J. P. andde Lorenzo, V. (2001), ‘Evidence of multipleregulatory functions for the PtsN (IIANtr)protein of Pseudomonas putida’, J. Bacteriol.,Vol. 183, pp. 1032�1037.
29. Agudo, D., Mendoza, M. T., Castanares, C.et al. (2004), ‘A proteomic approach to studySalmonella typhi periplasmic proteins alteredby a lack of the DsbA thiol:disulfideisomerase’, Proteomics, Vol. 4, pp. 355–363.
30. Pitarch, A., Sanchez, M., Nombela, C. andGil, C. (2002), ‘Sequential fractionation andtwo-dimensional gel analysis unravels thecomplexity of the dimorphic fungus Candidaalbicans cell wall proteome’, Mol. Cell.Proteom., Vol. 1, pp. 967–982.
31. Alfonso, P., Rivera, J., Hernaez, B. et al.(2004), ‘Identification of cellular proteinsmodified in response to African swine fevervirus infection by proteomics’, Proteomics,Vol. 4, pp. 2037–2046.
32. Cecconi, D., Astner, H., Donadelli, M. et al.(2003), ‘Proteomic analysis of pancreaticductal carcinoma cells treated with 5-aza-29-deoxycytidine’, Electrophoresis, Vol. 24, pp.4291–4303.
33. Corthals, G. L., Wasinger, V. C.,Hochstrasser, D. F. and Sanchez, J. C. (2000),‘The dynamic range of protein expression: achallenge for proteomic research’,Electrophoresis, Vol. 21, pp. 1104�1115.
34. Tonge, R., Shaw, J., Middleton, B. et al.(2001), ‘Validation and development offluorescence two-dimensional differential gelelectrophoresis proteomics technology’,Proteomics, Vol. 1, pp. 377–396.
35. Gharbi, S., Gaffney, P., Yang, A. et al. (2002),‘Evaluation of two-dimensional differentialgel electrophoresis for proteomic expressionanalysis of a model breast cancer cell system’,Mol. Cell. Proteom., Vol. 1, pp. 91–98.
36. Van den Bergh, G. and Arckens, L. (2004),‘Fluorescent two-dimensional difference gelelectrophoresis unveils the potential of gel-based proteomics’, Curr. Opin. Biotechnol.,Vol. 15, pp. 38–43.
37. Candas, M., Loseva, O., Oppert, B. et al.(2003), ‘Insect resistance to Bacillusthuringiensis: alterations in the indianmealmoth larval gut proteome’, Mol. Cell.Proteom., Vol. 2, pp. 19–28.
38. Borner, G. H., Lilley, K. S., Stevens, T. J.and Dupree, P. (2003), ‘Identification ofglycosylphosphatidylinositol-anchoredproteins in Arabidopsis. A proteomic andgenomic analysis’, Plant Physiol., Vol. 132,pp. 568–577.
39. Hoffert, J. D., van Balkom, B. W., Chou,C. L. and Knepper, M. A. (2004),‘Application of difference gel electrophoresisto the identification of inner medullarycollecting duct proteins’, Am. J. Physiol. Ren.Physiol., Vol. 286, pp. F170–F179.
40. van Balkom, B. W., Hoffert, J. D., Chou,C. L. and Knepper, M. A. (2004), ‘Proteomicanalysis of long-term vasopressin action in theinner medullary collecting duct of theBrattleboro rat’, Am. J. Physiol. Ren. Physiol.,Vol. 286, pp. F216–F224.
41. Zhou, G., Li, H., DeCamp, D. et al. (2002),‘2D differential in-gel electrophoresis for theidentification of esophageal scans cell cancer-specific protein markers’, Mol. Cell. Proteom.,Vol. 1, pp. 117–124.
42. Somiari, R. I., Sullivan, A., Russell, S. et al.(2003), ‘High-throughput proteomic analysisof human infiltrating ductal carcinoma of thebreast’, Proteomics, Vol. 3, pp. 1863–1873.
43. Van den Bergh, G., Clerens, S., Cnops, L.et al. (2003), ‘Fluorescent two-dimensionaldifference gel electrophoresis and massspectrometry identify age-related proteinexpression differences for the primary visualcortex of kitten and adult cat’, J. Neurochem.,Vol. 85, pp. 193–205.
44. Skynner, H. A., Rosahl, T. W., Knowles,M. R. et al. (2002), ‘Alterations of stressrelated proteins in genetically altered micerevealed by two-dimensional differential in-gel electrophoresis analysis’, Proteomics, Vol.2, pp. 1018–1025.
45. Kernec, F., Unlu, M., Labeikovsky, W. et al.(2001), ‘Changes in the mitochondrialproteome from mouse hearts deficient increatine kinase’, Physiol. Genomics, Vol. 6,pp. 117–128.
46. Sakai, J., Ishikawa, H., Kojima, S. et al.
& HENRY STEWART PUBLICATIONS 1473-9550. BRIEF INGS IN FUNCTIONAL GENOMICS AND PROTEOMICS . VOL 3. NO 3. 220–239. NOVEMBER 2004 2 3 5
Differential proteomics

(2003), ‘Proteomic analysis of rat heart inischemia and ischemia-reperfusion usingfluorescence two-dimensional difference gelelectrophoresis’, Proteomics, Vol. 3, pp.1318–1324.
47. Vierstraete, E., Verleyen, P., Baggerman, G.et al. (2004), ‘A proteomic approach for theanalysis of instantly released wound andimmune proteins in Drosophila melanogasterhemolymph’, Proc. Natl. Acad. Sci. USA, Vol.101, pp. 470–475.
48. Alban, A., David, S. O., Bjorkesten, L. et al.(2003), ‘A novel experimental design forcomparative two-dimensional gel analysis:two-dimensional difference gelelectrophoresis incorporating a pooledinternal standard’, Proteomics, Vol. 3,pp. 36–44.
49. Ruepp, S. U., Tonge, R. P., Shaw, J. et al.(2002), ‘Genomics and proteomics analysis ofacetaminophen toxicity in mouse liver’,Toxicol. Sci., Vol. 65, pp. 135–150.
50. Kleno, T. G., Leonardsen, L. R., Kjeldal, H.O. et al. (2004), ‘Mechanisms of hydrazinetoxicity in rat liver investigated by proteomicsand multivariate data analysis’, Proteomics, Vol.4, pp. 868–880.
51. Knowles, M. R., Cervino, S., Skynner, H. A.et al. (2003), ‘Multiplex proteomic analysis bytwo-dimensional differential in-gelelectrophoresis’, Proteomics, Vol. 3, pp.1162–1171.
52. Friedman, D. B., Hill, S., Keller, J. W. et al.(2004), ‘Proteome analysis of human coloncancer by two-dimensional difference gelelectrophoresis and mass spectrometry’,Proteomics, Vol. 4, pp. 793–811.
53. Gade, D., Thiermann, J., Markowsky, D. andRabus, R. (2003), ‘Evaluation of two-dimensional difference gel electrophoresis forprotein profiling. Soluble proteins of themarine bacterium Pirellula sp. strain 1’, J. Mol.Microbiol. Biotechnol., Vol. 5, pp. 240–251.
54. Shaw, J., Rowlinson, R., Nickson, J. et al.(2003), ‘Evaluation of saturation labellingtwo-dimensional difference gelelectrophoresis fluorescent dyes’, Proteomics,Vol. 3, pp. 1181–1195.
55. Evans, C. A., Tonge, R., Blinco, D. et al.(2004), ‘Comparative proteomics of primitivehematopoietic cell populations revealsdifferences in expression of proteinsregulating motility’, Blood, Vol. 103, pp.3751–3759.
56. Goldman, R. C., Trus, B. L. and Leive, L.(1983), ‘Quantitative double-labelradiography of two-dimensional protein gelsusing colour negative film and computeranalysis’, Eur. J. Biochem., Vol. 131, pp.473–480.
57. Spandidos, A. O. and Rabbitts, T. H. (2002),
‘Sub-proteome differential display: single gelcomparison by 2D electrophoresis and massspectrometry’, J. Mol. Biol., Vol. 318, pp.21–31.
58. Gerner, C., Vejda, S., Gelbmann, D. et al.(2002), ‘Concomitant determination ofabsolute values of cellular protein amounts,synthesis rates, and turnover rates byquantitative proteome profiling’, Mol. Cell.Proteom., Vol. 1, pp. 528–537.
59. Traxler, E., Bayer, E., Stockl, J. et al. (2004),‘Towards a standardized human proteomedatabase: quantitative proteome profiling ofliving cells’, Proteomics, Vol. 4, pp.1314–1323.
60. Washburn, M. P., Wolters, D. and Yates III,J. R. (2001), ‘Large-scale analysis of the yeastproteome by multidimensional proteinidentification technology’, Nat. Biotechnol.,Vol. 19, pp. 242–247.
61. Bondarenko, P. V., Chelius, D. and Shaler,T. A. (2002), ‘Identification and relativequantitation of protein mixtures by enzymaticdigestion followed by capillary reversed-phaseliquid chromatography-tandem massspectrometry’, Anal. Chem., Vol. 74, pp.4741–4749.
62. Wang, W., Zhou, H., Lin, H. et al. (2003),‘Quantification of proteins and metabolitesby mass spectrometry without isotopiclabeling or spiked standards’, Anal. Chem.,Vol. 75, pp. 4818–4826.
63. Stewart, I. I., Zhao, L., Le Bihan, T. et al.(2004), ‘The reproducible acquisition ofcomparative liquid chromatography/tandemmass spectrometry data from complexbiological samples’, Rapid Comm. MassSpectrom., Vol. 18, pp. 1697–1710.
64. Liu, H., Sadygov, R. G. and Yates III, J. R.(2004), ‘A model for random sampling andestimation of relative protein abundance inshotgun proteomics’, Anal. Chem., Vol. 76,pp. 4193–4201.
65. Ong, S. E., Foster, L. J. and Mann, M.(2003), ‘Mass spectrometric-based approachesin quantitative proteomics’, Methods, Vol. 29,pp. 124–130.
66. Flory, M. R., Griffin, T. J., Martin, D. andAebersold, R. (2002), ‘Advances inquantitative proteomics using stable isotopetags’, Trends Biotechnol., Vol. 20, pp.S23–S29.
67. Lill, J. (2003), ‘Proteomic tools forquantitation by mass spectrometry’, MassSpectrom. Rev., Vol. 22, pp. 182–194.
68. Goshe, M. B. and Smith, R. D. (2003),‘Stable isotope-coded proteomic massspectrometry’, Curr. Opin. Biotechnol., Vol.14, pp. 101–109.
69. Aebersold, R. and Mann, M. (2003), ‘Mass
2 3 6 & HENRY STEWART PUBLICATIONS 1473-9550. BRIEF INGS IN FUNCTIONAL GENOMICS AND PROTEOMICS . VOL 3. NO 3. 220–239. NOVEMBER 2004
Monteoliva and Albar

spectrometry-based proteomics’, Nature, Vol.422, pp. 198–207.
70. Washburn, M. P., Ulaszek, R., Deciu, C.et al. (2002), ‘Analysis of quantitativeproteomic data generated viamultidimensional protein identificationtechnology’, Anal. Chem., Vol. 74, pp.1650–1657.
71. Ong, S. E., Blagoev, B., Kratchmarova, I. etal. (2002), ‘Stable isotope labeling by aminoacids in cell culture, SILAC, as a simple andaccurate approach to expression proteomics’,Mol. Cell. Proteomics, Vol. 1, pp. 376–386.
72. Pratt, J. M., Robertson, D. H., Gaskell, S. J.,et al. (2002), ‘Stable isotope labelling in vivo asan aid to protein identification in peptidemass fingerprinting’, Proteomics, Vol. 2, pp.157–163.
73. Pratt, J. M., Petty, J., Riba-Garcia, I. et al.(2002), ‘Dynamics of protein turnover, amissing dimension in proteomics’, Mol. Cell.Proteomics, Vol. 1, pp. 579–591.
74. Blagoev, B., Kratchmarova, I., Ong, S. E.et al. (2003), ‘A proteomics strategy toelucidate functional protein-proteininteractions applied to EGF signaling’, Nat.Biotechnol., Vol. 21, pp. 315–318.
75. De Hoog, C. L., Foster, L. J. and Mann, M.(2004), ‘RNA and RNA binding proteinsparticipate in early stages of cell spreadingthrough spreading initiation centers’, Cell,Vol. 117, pp. 649–662.
76. Schulze, W. X. and Mann, M. (2004), ‘Anovel proteomic screen for peptide–proteininteractions’, J. Biol. Chem., Vol. 279, pp.10756–10764.
77. Foster, L. J., De Hoog, C. L. and Mann, M.(2003), ‘Unbiased quantitative proteomics oflipid rafts reveals high specificity for signalingfactors’, Proc. Natl. Acad. Sci. USA, Vol. 100,pp. 5813–5818.
78. Everley, P. A., Krijgsveld, J., Zetter, B. R.and Gygi, S. P. (2004), ‘Quantitative cancerproteomics: stable isotope labeling withamino acids in cell culture (SILAC) as a toolfor prostate cancer research’,Mol. Cell.Proteomics, Vol. 3, pp. 729–735.
79. Dunkley, T. P., Dupree, P., Watson, R. B.and Lilley, K. S. (2004), ‘The use of isotope-coded affinity tags (ICAT) to study organelleproteomes in Arabidopsis thaliana’, Biochem.Soc. Trans., Vol. 32, pp. 520–523.
80. Shiio, Y., Donohoe, S., Yi, E. C. et al.(2002), ‘Quantitative proteomic analysis ofMyc oncoprotein function’, EMBO J., Vol.21, pp. 5088–5096.
81. Shiio, Y., Eisenman, R. N., Yi, E. C. et al.(2003), ‘Quantitative proteomic analysis ofchromatin-associated factors’, J. Am. Soc.Mass Spectrom., Vol. 14, pp. 696–703.
82. Ranish, J. A., Yi, E. C., Leslie, D. M. et al.(2003), ‘The study of macromolecularcomplexes by quantitative proteomics’, Nat.Genet., Vol. 33, pp. 349�355.
83. Brand, M., Ranish, J. A., Kummer, N. T.et al. (2004), ‘Dynamic changes intranscription factor complexes duringerythroid differentiation revealed byquantitative proteomics’, Nat. Struct. Mol.Biol., Vol. 11, pp. 73–80.
84. Sethuraman, M., McComb, M. E., Heibeck,T. et al. (2004), ‘Isotope-coded affinity tagapproach to identify and quantify oxidant-sensitive protein thiols’, Mol. Cell. Proteomics,Vol. 3, pp. 273–278.
85. Tam, E. M., Morrison, C. J., Wu, Y. I. et al.(2004), ‘Membrane protease proteomics:isotope-coded affinity tag MS identificationof undescribed MT1-matrixmetalloproteinase substrates’, Proc. Natl. Acad.Sci. USA, Vol. 101, pp. 6917–6922.
86. Guina, T., Wu, M., Miller, S. I. et al. (2003),‘Proteomic analysis of Pseudomonas aeruginosagrown under magnesium limitation’, J. Am.Soc. Mass Spectrom., Vol. 14, pp. 742–751.
87. Li, J., Steen, H. and Gygi, S. P. (2003),‘Protein profiling with cleavable isotope-coded affinity tag (cICAT) reagents: the yeastsalinity stress response’, Mol. Cell. Proteomics,Vol. 2, pp. 1198–1204.
88. Parker, K. C., Patterson, D., Williamson, B.et al. (2004), ‘Depth of proteome issues: ayeast isotope-coded affinity tag reagentstudy’, Mol. Cell. Proteomics, Vol. 3, pp.625–659.
89. Conrads, K. A., Yu, L. R., Lucas, D. A. et al.(2004), ‘Quantitative proteomic analysis ofinorganic phosphate-induced murineMC3T3-E1 osteoblast cells’, Electrophoresis,Vol. 25, pp. 1342–1352.
90. Johnson, M. D., Yu, L. R., Conrads, T. P.et al. (2004), ‘Proteome analysis of DNAdamage-induced neuronal death using highthroughput mass spectrometry’, J. Biol.Chem., Vol. 279, pp. 26685–26697.
91. Hansen, K. C., Schmitt-Ulms, G., Chalkley,R. J. et al. (2003), ‘Mass spectrometricanalysis of protein mixtures at low levelsusing cleavable 13C-isotope-coded affinity tagand multidimensional chromatography’, Mol.Cell. Proteomics, Vol. 2, pp. 299–314.
92. Meehan, K. L. and Sadar, M. D. (2004),‘Quantitative profiling of LNCaP prostatecancer cells using isotope-coded affinity tagsand mass spectrometry’, Proteomics., Vol. 4,pp. 1116–1134.
93. Hardwidge, P. R., Rodriguez-Escudero, I.,Goode, D. et al. (2004), ‘Proteomic analysisof the intestinal epithelial cell response toenteropathogenic Escherichia coli’, J. Biol.Chem., Vol. 279, pp. 20127–20136.
& HENRY STEWART PUBLICATIONS 1473-9550. BRIEF INGS IN FUNCTIONAL GENOMICS AND PROTEOMICS . VOL 3. NO 3. 220–239. NOVEMBER 2004 2 3 7
Differential proteomics
94. Smolka, M., Zhou, H. and Aebersold, R.(2002), ‘Quantitative protein profiling usingtwo-dimensional gel electrophoresis, isotope-coded affinity tag labeling, and massspectrometry’, Mol. Cell. Proteomics, Vol. 1,pp. 19–29.
95. Nirmalan, N., Sims, P. F. and Hyde, J. E.(2004), ‘Quantitative proteomics of thehuman malaria parasite Plasmodium falciparumand its application to studies of developmentand inhibition’, Mol. Microbiol., Vol. 52, pp.1187�1199.
96. Jaleel, A. and Nair, K. S. (2004),‘Identification of multiple proteins whosesynthetic rates are enhanced by high aminoacid levels in rat hepatocytes’, Am. J. Physiol.Endocrinol. Metab., Vol. 286, pp. E950–E957.
97. Krijgsveld, J., Ketting, R. F., Mahmoudi, T.et al. (2003), ‘Metabolic labeling of C. elegansand D. melanogaster for quantitativeproteomics’, Nat. Biotechnol., Vol. 21, pp.927–931.
98. Oda, Y., Huang, K., Cross, F. R. et al.(1999), ‘Accurate quantitation of proteinexpression and site-specific phosphorylation’,Proc. Natl. Acad. Sci. USA, Vol. 96, pp.6591–6596.
99. Service, R. F. (2003), ‘Genetics andmedicine. Recruiting genes, proteins for arevolution in diagnostics’, Science, Vol. 300,pp. 236–239.
100. Petricoin, E. F., Zoon, K. C., Kohn, E. C.et al. (2002), ‘Clinical proteomics: translatingbenchside promise into bedside reality’, Nat.Rev. Drug Discov., Vol. 1, pp. 683–695.
101. Petricoin, E. F., Ardekani, A. M., Hitt, B. A.et al. (2002), ‘Use of proteomic patterns inserum to identify ovarian cancer’, Lancet, Vol.359, pp. 572–577.
102. Grizzle, W. E., Adam, B. L., Bigbee, W. L.et al. (2003), ‘Serum protein expressionprofiling for cancer detection: validation of aSELDI-based approach for prostate cancer’,Dis. Markers, Vol. 19, pp. 185–195.
103. Paweletz, C. P., Trock, B., Pennanen, M.et al. (2001), ‘Proteomic patterns of nippleaspirate fluids obtained by SELDI-TOF:potential for new biomarkers to aid in thediagnosis of breast cancer’, Dis. Markers, Vol.17, pp. 301–307.
104. Zhang, Y. F., Wu, D. L., Guan, M. et al.(2004), ‘Tree analysis of mass spectral urineprofiles discriminates transitional cellcarcinoma of the bladder from noncancerpatient’, Clin. Biochem., Vol. 37, pp.772–779.
105. Won, Y., Song, H. J., Kang, T. W. et al.(2003), ‘Pattern analysis of serum proteomedistinguishes renal cell carcinoma from otherurologic diseases and healthy persons’,Proteomics, Vol. 3, pp. 2310–2316.
106. Rai, A. J., Zhang, Z., Rosenzweig, J. et al.(2002), ‘Proteomic approaches to tumormarker discovery’, Arch. Pathol. Lab. Med.,Vol. 126, pp. 1518–1526.
107. Issaq, H. J., Conrads, T. P., Prieto, D. A.et al. (2003), ‘SELDI-TOF MS for diagnosticproteomics’, Anal. Chem., Vol. 75, pp.148A–155A.
108. Wulfkuhle, J. D., Paweletz, C. P., Steeg,P. S. et al. (2003), ‘Proteomic approaches tothe diagnosis, treatment, and monitoring ofcancer’, Adv. Exp. Med. Biol., Vol. 532, pp.59–68.
109. Powell, K. (2003), ‘Proteomics delivers onpromise of cancer biomarkers’, Nat. Med.,Vol. 9, p. 980.
110. Diamandis, E. P. (2004), ‘Mass spectrometryas a diagnostic and a cancer biomarkerdiscovery tool: opportunities and potentiallimitations’, Mol. Cell. Proteomics, Vol. 3, pp.367–378.
111. Diamandis, E. P. (2004), ‘Analysis of serumproteomic patterns for early cancer diagnosis:drawing attention to potential problems’, J.Natl. Cancer Inst., Vol. 96, pp. 353–356.
112. Baggerly, K. A., Morris, J. S. and Coombes,K. R. (2004), ‘Reproducibility of SELDI-TOF protein patterns in serum: comparingdatasets from different experiments’,Bioinformatics, Vol. 20, pp. 777–785.
113. Sorace, J. M. and Zhan, M. (2003), ‘A datareview and re-assessment of ovarian cancerserum proteomic profiling’, Bioinformatics,Vol. 4, p. 24.
114. Zhang, Z., Bast Jr, R. C., Yu, Y. et al.(2004), ‘Three biomarkers identified fromserum proteomic analysis for the detection ofearly stage ovarian cancer’, Cancer Res., Vol.64, pp. 5882�5890.
115. Carrette, O., Demalte, I., Scherl, A. et al.(2003), ‘A panel of cerebrospinal fluidpotential biomarkers for the diagnosis ofAlzheimer’s disease’, Proteomics, Vol. 3, pp.1486–1494.
116. Clarke, W., Silverman, B. C., Zhang, Z. et al.(2003), ‘Characterization of renal allograftrejection by urinary proteomic analysis’, Ann.Surg., Vol. 237, pp. 660–664.
117. Forde, C. E. and McCutchen-Maloney, S. L.(2002), ‘Characterization of transcriptionfactors by mass spectrometry and the role ofSELDI-MS’, Mass Spectrom. Rev., Vol. 21, pp.419–439.
118. Bane, T. K., LeBlanc, J. F., Lee, T. D. andRiggs, A. D. (2002), ‘DNA affinity captureand protein profiling by SELDI-TOF massspectrometry: effect of DNA methylation’,Nucleic Acids Res., Vol. 30, p. e69.
119. Espina, V., Dettloff, K. A., Cowherd, S. et al.(2004), ‘Use of proteomic analysis to monitor
2 3 8 & HENRY STEWART PUBLICATIONS 1473-9550. BRIEF INGS IN FUNCTIONAL GENOMICS AND PROTEOMICS . VOL 3. NO 3. 220–239. NOVEMBER 2004
Monteoliva and Albar

responses to biological therapies’, ExpertOpin. Biol. Ther., Vol. 4, pp. 83–93.
120. Carter, D., Douglass, J. F., Cornellison, C. D.et al. (2002), ‘Purification andcharacterization of the mammaglobin/lipophilin B complex, a promising diagnosticmarker for breast cancer’, Biochemistry, Vol.41, pp. 6714–6722.
121. Forde, C. E., Gonzales, A. D., Smessaert, J.M. et al. (2002), ‘A rapid method to captureand screen for transcription factors by SELDImass spectrometry’, Biochem. Biophys. Res.
Commun., Vol. 290, pp. 1328–1335.
122. Schmidt, F., Donahoe, S., Hagens, K. et al.(2004), ‘Complementary analysis of theMycobacterium tuberculosis proteome by two-dimensional electrophoresis and isotope-coded affinity tag technology’, Mol. Cell.Proteomics, Vol. 3, pp. 24–42.
123. Tian, Q., Stepaniants, S. B., Mao, M. et al.(2004), ‘Integrated genomic and proteomicanalyses of gene expression in mammaliancells’, Mol. Cell. Proteomics, Vol. 3, pp.960–969.
& HENRY STEWART PUBLICATIONS 1473-9550. BRIEF INGS IN FUNCTIONAL GENOMICS AND PROTEOMICS . VOL 3. NO 3. 220–239. NOVEMBER 2004 2 3 9
Differential proteomics


![[8] Dipolar Couplings in Macromolecular Structure ... · [8] DIPOLAR COUPLINGS AND MACROMOLECULAR STRUCTURE 127 [8] Dipolar Couplings in Macromolecular Structure Determination By](https://img.pdfslide.us/doc/110x75/605c24b70c5494344557be4f/8-dipolar-couplings-in-macromolecular-structure-8-dipolar-couplings-and.jpg)