Embed Size (px)
Citation preview

Freely Available Online
www.openaccesspub.org | JPGR CC License DOI: 10.14302/issn.2326-0793.jpgr-12-207 Vol-1 Issue-2 Page No- 2
P R O T E O M I C S A N D G E N O M I C S R E S E A R C H P R O T E O M I C S A N D G E N O M I C S R E S E A R C H P R O T E O M I C S A N D G E N O M I C S R E S E A R C H
ISSN NO: 2326-0793
Research Article
Differences in the alveolar macrophage proteome in transgenic mice expressing
human SP-A1 and SP-A2
David S. Phelps1, Todd M. Umstead1, Patricia Silveyra1, Sanmei Hu1, Guirong Wang1, and Joanna Floros1,2,*
1Center for Host defense, Inflammation, and Lung Disease (CHILD) Research and Departments of Pediatrics, and 2Obstetrics and
Gynecology, The Pennsylvania State University College of Medicine, Hershey, PA 17033, USA.
* Corresponding author
Joanna Floros, Ph.D. ; Telephone: (717) 531-6972 ; Fax: (717) 531-0215; JF: [email protected]
Email addresses:
DSP: [email protected] ; TMU: [email protected] ; PS: [email protected] ; SH: [email protected] ;
GW: [email protected] ; JF: [email protected]
Received Jan 25, 2013; Accepted Apr 28, 2013; Published Jul 19, 2013;
ABSTRACT
Surfactant protein A (SP-A) plays a number of roles in lung host defense and innate immunity.
There are two human genes, SFTPA1 and SFTPA2, and evidence indicates that the function of SP-A1 and
SP-A2 proteins differ in several respects. To investigate the impact of SP-A1 and SP-A2 on the alveolar
macrophage (AM) phenotype, we generated humanized transgenic (hTG) mice on the SP-A knockout (KO)
background, each expressing human SP-A1 or SP-A2. Using two-dimensional difference gel electrophoresis
(2D-DIGE) we studied the AM cellular proteome. We compared mouse lines expressing high levels of SP-
A1, high levels of SP-A2, low levels of SP-A1, and low levels of SP-A2, with wild type (WT) and SP-A KO
mice. AM from mice expressing high levels of SP-A2 were the most similar to WT mice, particularly for
proteins related to actin and the cytoskeleton, as well as proteins regulated by Nrf2. The expression
patterns from mouse lines expressing higher levels of the transgenes were almost the inverse of one
another – the most highly expressed proteins in SP-A2 exhibited the lowest levels in the SP-A1 mice and
vice versa. The mouse lines where each expressed low levels of SP-A1 or SP-A2 transgene had very similar
protein expression patterns suggesting that responses to low levels of SP-A are independent of SP-A
genotype, whereas the responses to higher amounts of SP-A are genotype-dependent. Together these
observations indicate that in vivo exposure to SP-A1 or SP-A2 differentially affects the proteomic expression
of AMs, with SP-A2 being more similar to WT.
DOI: 10.14302/issn.2326-0793.jpgr-12-207
Freely Available Online
www.openaccesspub.org | JPGR CC License DOI: 10.14302/issn.2326-0793.jpgr-12-207 Vol-1 Issue-2 Page No- 3
INTRODUCTION
Surfactant protein-A (SP-A) is a member of the
collectin family with an N-terminal collagen-like domain
and a C-terminal carbohydrate recognition domain
(CRD) that binds to many macromolecules, pathogens,
and allergens [1,2]. Most mammals possess a single SP
-A gene, but humans and primates have two functional
SP-A genes (SFTPA1 and SFTPA2). The human SP-A
monomer is a 35kDa protein of 248 amino acids. In the
coding region, the gene-specific differences of SP-A1
and SP-A2 consist of four amino acids [3,4].
SP-A influences host defense function in a
variety of ways. It recognizes and binds to pathogen-
associated molecular patterns. These interactions are
complex and may involve binding sites in addition to the
CRD. Direct interaction with pathogens constitutes one
aspect of its host defense function, but SP-A also aids in
the clearance of particulates, allergens, and debris [5-
9]. SP-A also influences the alveolar macrophage (AM)
by regulating many cytokines, including TNF-α, IL-1β,
and others [10-20], and cell surface molecules, such as
CD11b (CR3), TLR2 and TLR4, the mannose receptor,
scavenger receptor A, and CD14 [21-25]. Also, SP-A
helps maintain redox balance [26-30], enhances
phagocytosis by AM [31-34], contributes to bacterial
killing [35-37], affects the development of dendritic
cells [38], and links innate and adaptive immunity [39].
Despite these diverse functions, gaps remain in our
knowledge of how SP-A influences host defense and the
cell types it affects, especially under basal or
unstimulated conditions.
Several studies have identified functional
differences between SP-A1 and SP-A2 in innate immune
functions (including many of those mentioned above),
and in several surfactant-related functions. These
included cytokine production [12,18,20], modulation of
surfactant secretion [40], phagocytosis by AM
[33,34,41], and other surfactant structural
characteristics [42-45]. Both SP-A1 and SP-A2 are
required to form tubular myelin, an extracellular form of
surfactant [46]. Differences in the structure and
posttranslational modification of SP-A1 and SP-A2 have
been observed [47], and it is likely that some of these
structural differences are responsible for functional
differences [44]. It is of interest that differences in the
SFTPA1 and SFTPA2 expression, as assessed by the
ratio of SP-A1 to total SP-A, have been reported in
human bronchoalveolar lavage (BAL) based on age and
lung health [48,49].
The AM, the primary effector cell for lung
innate immunity, exhibits a unique phenotype [50] that
is influenced by SP-A [21-25,31,32], although the
extent of this effect is not fully understood. Previously,
by administering exogenous SP-A to SP-A KO mice, we
demonstrated that SP-A significantly alters the AM
proteome, making it more like that of wild type mice
[51]. In this study we hypothesized that the AM
proteome is differentially affected by the in vivo
presence of SP-A1 or SP-A2 in the alveoli of the lungs of
SP-A humanized transgenic (hTG) mice. This
hypothesis was investigated by generating various SP-A
hTG mouse lines to use in a proteomics study with the
two-dimensional difference gel electrophoresis (2D-
DIGE) experimental design in order to study the AM
proteome among the various mouse lines.
(Continued on page 4)
Running Title: The macrophage proteome in humanized transgenic SP-A mice
Key Words: surfactant, lung, 2D-DIGE, collectin, host defense

Freely Available Online
www.openaccesspub.org | JPGR CC License DOI: 10.14302/issn.2326-0793.jpgr-12-207 Vol-1 Issue-2 Page No- 4
MATERIALS AND METHODS
Animals and Cells
For this study, we used wild-type C57BL/6 mice
obtained from the Jackson Laboratory (Bar Harbor, ME).
SP-A KO mice were propagated in the animal core
facility of the Pennsylvania State University College of
Medicine. Humanized TG SP-A1 and SP-A2 mice that
each carried an SP-A1 or SP-A2 variant were generated
on the SP-A KO C57BL/6 background as previously
described [46]. In the normal human lung SP-A1 and
SP-A2 are expressed in type 2 alveolar epithelial cells.
The transgenes contain the promoter of SP-C, which is
only expressed in type 2 cells. The inclusion of this
promoter in the transgenes assures that they too are
expressed only in type 2 cells.
All procedures involving animals used protocols
that were approved by the Institutional Animal Care and
Use Committee at the Pennsylvania State University
College of Medicine. All mice were maintained in facilities
under pathogen-free conditions or in barrier
containment facilities.
AM were obtained by BAL [51]. Cells were
washed and counted. A cytospin was prepared, stained,
and a differential cell count performed. In all cases AM
constituted at least 95% of the cells obtained. The cell-
free BAL fluid was frozen for later analysis. All groups
consisted of at least 4 mice.
Characterization of humanized TG mice
Southern Blot and Hybridization
To study the copy number of the transgenes in
the SP-A1 and SP-A2 hTG mice, total DNA was extracted
and purified from the mouse tails and human lung tissue
using the DNeasy Blood & Tissue Kit (Qiagen, Valencia,
CA). Eight μg of pure DNA from each sample were
digested overnight at 37°C with the restriction enzyme
EcoRI and the digestions were subjected to 0.7%
agarose gel electrophoresis and transferred to a Nylon
membrane for Southern blot analysis. Two DNA probes
(0.8 and 1.3 kb) amplified from human SP-A cDNA of SP
-A2 (1A3) were labeled with digoxigenin (PCR DIG Probe
Synthesis Kit, Roche, Indianapolis, IN) and used for
hybridization to detect the SP-A transgenes by Southern
blot. The 0.8kb probe was generated using primers
2058/2059 and contains the coding region of exons I-IV,
and the 1.3kb probe was generated with primers 2058
and 2060 and contains the coding region (exons I-IV)
plus a partial 3’UTR sequence which is part of exon IV.
The sequences of the probes are listed in Supplementary
Table 1. Hybridization was done overnight at 48°C in
DIG Easy Hyb Granules solution (Roche, Indianapolis,
IN). The membranes were then washed and detected
with anti-DIG AP using chemiluminescence and exposed
to X-ray film.
Quantitative Real Time PCR
Quantitative PCR (qPCR) was conducted in 10
ml reactions (384-well plates) consisting of 10 ng of
mouse genomic DNA, TaqMan SP-A1, SP-A2, or mouse
reference assays, and TaqMan master mix (Applied
Biosystems, Foster City, CA, USA). Custom-designed
TaqMan® Assays were purchased from Applied
Biosystems (Foster City, CA, USA) for human SP-A1
(assay Hs01921510) and human SP-A2 (assay
Hs00359837). The mouse Trfc TaqMan® Copy Number
Reference Assay (Applied Biosystems, Foster City, CA,
USA) was used as reference. Gene amplification was
achieved using the following protocol: denaturing for 10
min at 94°C, and 40 cycles of 94°C for 15 sec and 60°C
for 60 sec. Four replicates were run per reaction.
These were monitored with the 7700 Real-Time PCR
System (Applied Biosystems, Foster City, CA, USA). A
standard curve was also amplified using serial dilutions
of the vector used to generate the transgenic mice,
ranging from 0.1 to 1000 copies of the transgene. The

Freely Available Online
www.openaccesspub.org | JPGR CC License DOI: 10.14302/issn.2326-0793.jpgr-12-207 Vol-1 Issue-2 Page No- 5
mass of one copy of the plasmid was calculated by the
formula described by Joshi et al [52].
Copy number determination
Transgene copy number was calculated by the
standard curve method [52] as well as with the Copy
Caller software (Applied Biosystems, Foster City, CA,
USA), assuming the most frequent number of transgene
was at least one, since no calibration sample was
available [53].
Confirmation of orientation of integrated
transgene
Endpoint PCR was performed in 400 ng of
mouse genomic DNA with the Fast Start High Fidelity
PCR system (Roche Diagnostics, Indianapolis, IN) and
specific primers listed in Supplementary Table 1.
Primer pairs 1636/1634 were used to detect head to tail
concatemers, 2114/1636 to detect tail to tail, and primer
1634 was used to detect head to head concatemers.
The following protocol was used: denaturing for 2 min at
94°C, and 40 cycles of denaturing at 94°C for 30 sec,
annealing at 59°C for 30 sec, and extension at 72° C for
1 min. PCR products were resolved on 1% agarose and
confirmed by sequencing.
SP-A assessment
Initial characterization of BAL fluid was done to
confirm the presence of the expected SP-A protein.
Blots were prepared as described subsequently and
immunostained with either an antibody specific to SP-A1
[48] or an antibody specific for SP-A2 (Aviva Systems
Biology, San Diego, CA). Because these two antibodies
differed considerably in their relative affinities, these
were used for positive identification of SP-A1 and SP-A2
transgenes and not for quantitation.
To determine the amount of secreted hSP-A in
the lungs of hTG mice, lungs were lavaged and lavage
samples (25 µl of BAL/sample) were subjected to gel
electrophoresis (12.5% SDS-PAGE) under reducing
conditions. Human SP-A in the BAL fluid was detected
by Western blot analysis using a specific SP-A antibody
that recognizes both SP-A1 and SP-A2, as described
previously [40]. Briefly, proteins were then transferred
to nitrocellulose and SP-A detected using a rabbit
antibody (IgG) to human SP-A (1:20,000) and goat anti-
Supplementary Table 1. Primers used in this study
Supplementary Table 1. The sequences of the probes used for the Southern blot and hybridization (Figure 1) and their
specificities are listed.
Primer Sequence (5’- 3’) Comments
1634 CCTTGCCCCGTGCCTATGAG Human SP-C 5’-flanking region - antisense
1636 TGAGCAATCCTGGCCAAGCATAA Human SP-A 3’-UTR - sense
2058 CTGGAGGCTCTGTGTGTGGG Human SP-A 5’-UTR – sense
2059 TCAGAACTCACAGATGGTCA Human SP-A coding region - antisense
2060 CTGCCACAGAGACCTCAGAGT Human SP-A 3’ - UTR - antisense
2114 TCTTATCATGTCTGGATCCCCGG SV40 sequence – sense

Freely Available Online
www.openaccesspub.org | JPGR CC License DOI: 10.14302/issn.2326-0793.jpgr-12-207 Vol-1 Issue-2 Page No- 6
rabbit IgG (horseradish peroxidase-conjugated)
secondary antibody. Following enhanced
chemiluminescent detection, blots were exposed to X-
ray film and densitometry performed on the films using
a Bio-Rad GS-800 Densitometer and Quantity One
Software.
Proteomics
For the proteomic study we used humanized
transgenic mice expressing SP-A1 and SP-A2 at high
levels and two mouse lines that expressed SP-A1 and SP
-A2 at low levels, in addition to KO mice and WT mice.
The SP-A1 mouse lines were 6A2 T1 (subsequently
referred to as 6A2) that expressed high levels of SP-A1,
and a mouse expressing low levels of SP-A1 that is
designated 6A4-LE. The SP-A2 mice consisted of two
high expressing mouse lines, 1A0-T10 and 1A0 T13,
subsequently called 1A0 mice, and a low expressing
mouse line designated 1A0-LE. The T stands for
transgene and the number next to it indicates the
particular mouse line expressing a given SP-A variant.
To prepare AM for 2D-DIGE frozen AM pellets
were lyophilized until completely dry and resuspended in
25 µL of standard cell lysis buffer (30 mM Tris-HCl, 2 M
thiourea, 7 M urea, 4% CHAPS, pH 8.5). Protein
determinations were done using the Bio-Rad Protein
Assay (Bio-Rad, Hercules, CA) and the concentration of
protein was adjusted to 1mg/ml for labeling with either
Cy3 or Cy5. Twenty micrograms of protein was used for
each sample. These procedures and the subsequent 2D
-DIGE were performed as we have described in detail
[51]. Following electrophoresis gels were scanned using
a Typhoon scanner and Gel images were imported into
the Progenesis SameSpots v4.0 program (Nonlinear
Dynamics) for analysis. For identified proteins having
multiple isoforms, the normalized volumes of all isoforms
of a given protein were added together and statistical
analysis was performed on the totals using Microsoft
Excel.
Normalization of data from combined 2D-DIGE
experiments
Data were normalized between three
independent 2D-DIGE experiments using the KO AM
samples present in each experiment. The mean KO AM
value was determined for each protein for each of the
three experiments. These means were then used to
calculate a correction factor for each protein and used to
normalize the data for all experiments .
Generation of heat maps
Heat maps were generated in Excel (Microsoft).
Means of the normalized values for each protein were
subject to conditional formatting with the highest value
assigned a red color, middle values a yellow color,
lowest values a green color, and intermediate values
colored with the appropriate shades depending upon
where they fall within the range for that protein. All
heat maps included values for lines containing the two
highly expressed transgenes, the transgenes expressed
at low levels, the WT mice, and the KO mice. For each
analysis one group of AM was considered the index
group and its proteins were arranged so that they went
from high to low expression levels for that group.
RESULTS AND DISCUSSION
SP-A hTG mice and transgene copy number
First, we confirmed the presence of the transgene
by Southern Blot (Figure 1) as described in Materials
and Methods. Two specific probes were used for
validation purposes. The absence of the transgene in
both WT and SP-A KO mice is shown in lanes 1 and 2
(negative controls). Genomic DNA obtained from human
lung tissue was used as a positive control (lane 11). All
genomic DNA from humanized TG mice showed a

Freely Available Online
www.openaccesspub.org | JPGR CC License DOI: 10.14302/issn.2326-0793.jpgr-12-207 Vol-1 Issue-2 Page No- 7
positive signal indicating that they contained human SP-
A transgene sequences, with several bands and
differences in the band intensities being observed
among samples. Although these may indicate
differences in the copy number of the transgenes,
comparison of Southern blot band intensities does not
always give accurate and quantitative results [53].
Therefore, we next estimated the copy number by Real
Figure 1. Southern Blot analysis of transgene integration in hSP-A1 and hSP-A2 TG mice. Genomic
DNA was prepared from hSP-A TG, SP-A KO, and WT mice, as well as from human lung tissue. DNA samples
were digested with EcoRI and subjected to agarose gel electrophoresis followed by Southern blot analysis. The
hSP-A genes were detected with DIG-labeled DNA probes with sizes of 0.8kb (left panel) and 1.3kb (right panel),
as described in Materials and Methods. The sequences of the probes are listed in Supplementary Table 1. The
0.8kb probe is located within the SP-A coding region (exons I-IV) and the corresponding sequence in the
transgene does not contain an EcoRI restriction site. The 1.3kb probe contains the SP-A coding region (exons I-
IV) plus a partial 3’UTR sequence, and the corresponding sequence in the transgene contains one EcoRI re-
striction site, that results in an additional 0.5kb band that is detected with this probe (lanes 3-10). DNA from
both WT and KO was not detected with either probe (negative controls), confirming the absence of the transgene
and lack of cross hybridization with non-SP-A sequence. Genomic DNA obtained from human lung tissue was
used as a positive control (lane 11).

Freely Available Online
www.openaccesspub.org | JPGR CC License DOI: 10.14302/issn.2326-0793.jpgr-12-207 Vol-1 Issue-2 Page No- 8
Time PCR, as described in Materials and Methods,
and by absolute (standard curve) (not shown) and
relative (Copy Caller) quantification (Table 1). Both
approaches resulted in similar, if not equal, copy
number.
Next we determined transgene orientation,
and concatemer occurrence by end point PCR, with
primers described in Supplementary Table 1.
Supplementary Figure 2 shows specific
amplification of head to tail concatemers, consistent
with southern blot analysis and our previous work
[46]. These were further purified, and confirmed by
DNA sequencing. The reference numbers for the
variants on NCBI are: 6A2 (GenBank: HQ021434.1);
6A4 (GenBank: HQ021436.1); 1A0 (GenBank:
HQ021421.1); 1A3 (GenBank: HQ021430.1).
No bands were detected in negative controls of
one copy (human DNA, plasmid DNA of 1A3-T4 and
6A4-T3) or controls without the transgene (WT, KO).
The presence of head to tail concatemers appeared
to result in a band(s) of approximately 6.6kb size
shown in Figure 1. The 1A0-T13, although it was
shown to have multiple copies by PCR, these
apparently are not concatemers (Fig. 1, lane 5)
because it lacks the intense 6.6kb band. Also no
bands were obtained with specific primers to detect
head to head or tail to tail concatemers (data not
shown). TG mouse lines with a high copy number
of a given transgene tended to have a higher level of SP
-A expression, although the level of expression and the
copy number did not always have a linear relationship
(data not shown). This may reflect different sites of
integration.
We used some of these mice to study the impact of
chronic SP-A variant exposure on the AM phenotype
using a proteomic approach. SP-A expression in the
mouse lines used in the present study was first assessed
by antibodies specific to SP-A1 and SP-A2 to confirm the
presence and specificity of SP-A1 and SP-A2 expression
in each transgenic line, as described in Methods and
Materials. Because the affinities of these antibodies
were different we could not use these for quantitative
determinations. Thus, we measured total SP-A levels in
the BAL of each mouse with an SP-A antibody
recognizing both SP-A1 and SP-A2. Total SP-A levels
were then measured on 25 µl of BAL/sample. Figure 2
Table 1. Transgene copy number for SP-A1 and
SP-A2 hTG mice
Table 1. T stands for transgene and the numbers next to
the T indicate the particular mouse line that expressed a giv-
en SP-A variant. The numbers shown in the right hand col-
umn depict the copy caller values. The asterisks (*) indicate
mouse lines used in the proteomic study. Note that the 1A0
mice used in the study were obtained from two different lines
(1A0 T10 and 1A0 T13 that had high levels of expression. The
table does not include the low expressors, 1A0-LE and 6A4-LE
mouse lines used in the present study.
SP-A1 mice Copy #
*6A2 T1 2
6A4 T1 3-4
*KO 0
*WT 0
SP-A2 mice Copy #
1A0 T7 >10
*1A0 T10 >10
*1A0 T13 >10
1A3 T2 1-2
1A3 T4 1-2
*KO 0
*WT 0
Freely Available Online
www.openaccesspub.org | JPGR CC License DOI: 10.14302/issn.2326-0793.jpgr-12-207 Vol-1 Issue-2 Page No- 9
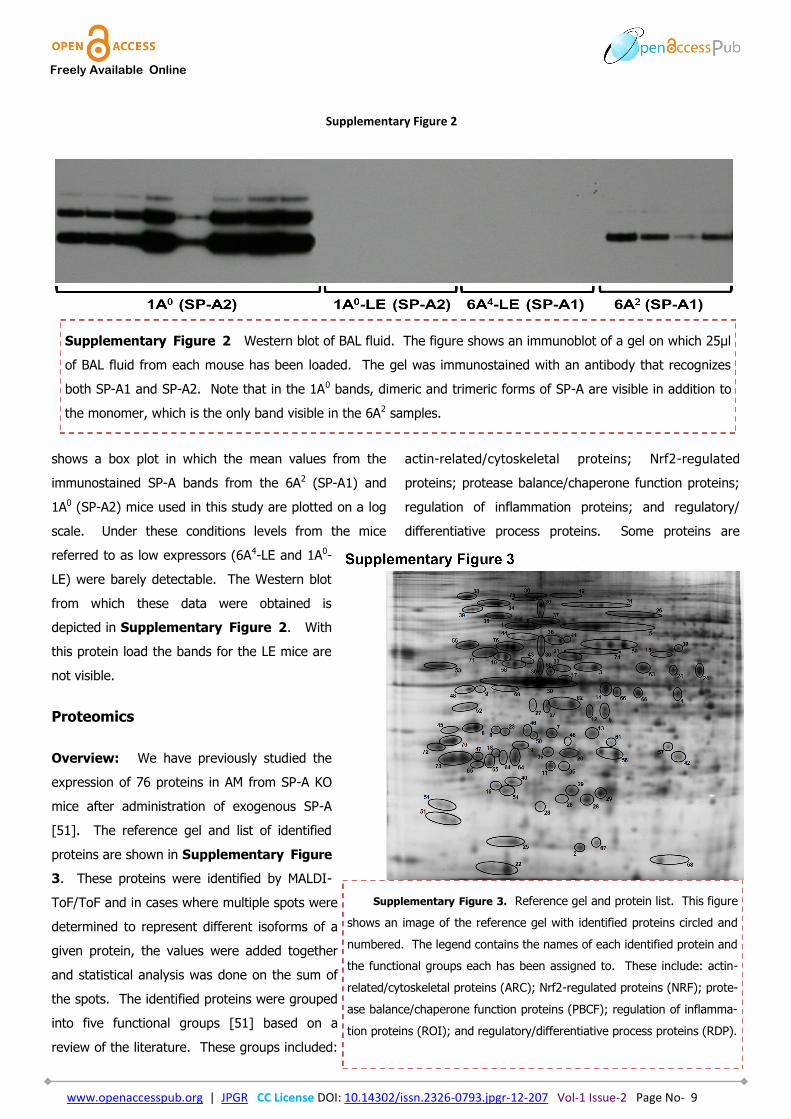
shows a box plot in which the mean values from the
immunostained SP-A bands from the 6A2 (SP-A1) and
1A0 (SP-A2) mice used in this study are plotted on a log
scale. Under these conditions levels from the mice
referred to as low expressors (6A4-LE and 1A0-
LE) were barely detectable. The Western blot
from which these data were obtained is
depicted in Supplementary Figure 2. With
this protein load the bands for the LE mice are
not visible.
Proteomics
Overview: We have previously studied the
expression of 76 proteins in AM from SP-A KO
mice after administration of exogenous SP-A
[51]. The reference gel and list of identified
proteins are shown in Supplementary Figure
3. These proteins were identified by MALDI-
ToF/ToF and in cases where multiple spots were
determined to represent different isoforms of a
given protein, the values were added together
and statistical analysis was done on the sum of
the spots. The identified proteins were grouped
into five functional groups [51] based on a
review of the literature. These groups included:
actin-related/cytoskeletal proteins; Nrf2-regulated
proteins; protease balance/chaperone function proteins;
regulation of inflammation proteins; and regulatory/
differentiative process proteins. Some proteins are
Supplementary Figure 2
Supplementary Figure 2 Western blot of BAL fluid. The figure shows an immunoblot of a gel on which 25µl
of BAL fluid from each mouse has been loaded. The gel was immunostained with an antibody that recognizes
both SP-A1 and SP-A2. Note that in the 1A0 bands, dimeric and trimeric forms of SP-A are visible in addition to
the monomer, which is the only band visible in the 6A2 samples.
Supplementary Figure 3. Reference gel and protein list. This figure
shows an image of the reference gel with identified proteins circled and
numbered. The legend contains the names of each identified protein and
the functional groups each has been assigned to. These include: actin-
related/cytoskeletal proteins (ARC); Nrf2-regulated proteins (NRF); prote-
ase balance/chaperone function proteins (PBCF); regulation of inflamma-
tion proteins (ROI); and regulatory/differentiative process proteins (RDP).

Freely Available Online
www.openaccesspub.org | JPGR CC License DOI: 10.14302/issn.2326-0793.jpgr-12-207 Vol-1 Issue-2 Page No- 10
included in more than one group and some others are
not in any group.
In this study we compared SP-A KO mice or WT
mice with several mouse lines containing human SP-A
transgenes to determine the effects of endogenous
expression of the human SP-A transgenes on the AM
proteome. The high-expressing SP-A1 (6A2) and SP-A2
(1A0) lines used in the proteomic study are marked with
an asterisk in Table 1. The two low expressors (LE) for
SP-A1 (6A4-LE) and SP-A2 (1A0-LE) are not shown in
Table 1. Mouse lines included those that expressed the
human SP-A1 gene, one expressing the 6A4 variant at
low levels and another expressing the 6A2 variant at
higher levels, and those expressing the human SP-A2
gene (1A0 variant) at low levels and at high levels. In
summary, from here on,the SP-A1 and SP-A2 variants
used in the proteomics study are referred to as 6A2, 6A4-
LE, and 1A0, 1A0-LE, respectively.
Significant changes from KO: We first compared the
transgenic mice to SP-A KO mice in order to determine
how the presence of human SP-A in the transgenics
altered the proteome of the alveolar macrophage
(Table 2). All of the proteins with significantly changed
levels are listed in Supplementary Table 2A. As one
might anticipate, both of the low expressing (LE) mouse
lines had many fewer proteins that changed significantly
from KO levels than did lines expressing higher levels.
There were 11 proteins that were significantly different
in 6A4-LE mice than in KO and 8 proteins that were
significantly different in the 1A0-LE mice. Interestingly,
in both 1A0-LE and 6A4-LE there were four proteins that
changed significantly and in similar directions (increased
or decreased) including cathepsin D precursor, chitinase
3-like 3 precursor, nucleophosmin 1, and the prolyl 4-
hydroxylase beta polypeptide precursor. The fact that
these changes occurred in both hTG lines suggests that
while these proteins may be human SP-A responsive, the
responses are not genotype-specific.
AM from mice expressing higher levels of SP-A1
and SP-A2 had many more significant differences from
KO, 27 in SP-A1 (6A2) and 19 in SP-A2 (1A0), suggesting
some degree of dose dependency as compared to the
“low expressing” lines. However, the greater number of
significant changes vs KO in the 6A2 mice as compared
to the 1A0 mice suggests that SP-A dose dependency
(based on the differences in SP-A levels between the 1A0
and 6A2 lines (Figure 2)) did not have a major
influence on the differences between these mouse lines
and that these differences were largely variant-specific
rather than dose-specific. As in the lower expressing
mouse lines, there were some proteins (n=10) that were
significantly different from KO in both lines. However, of
these ten, while five were similarly regulated in both
mouse lines (actin-related protein 2/3 complex, subunit
5; heat shock protein 5 precursor; keratin complex 2,
basic, gene 8; prolyl 4-hydroxylase, beta polypeptide
precursor; protein synthesis initiation factor 4A), there
were five significantly changed proteins that were
increased relative to KO mice in one mouse line and
decreased in the other (ferritin heavy chain; gelsolin
precursor; high mobility group 1 protein; protein
disulfide isomerase associated 6; Rab GDP dissociation
inhibitor beta). This implied that although the
expression of the nine proteins was human SP-A-
Table 2. Summary of number of proteins with
significant differences.
Table 2. The table summarizes the specific differ-
ences seen in each comparison of transgenic mice
to either KO or WT mice.
Transgenic line vs. KO vs. WT
6A4-LE (SP-A1) 11 31
1A0-LE (SP-A2) 8 34
6A2 (SP-A1) 26 47
1A0 (SP-A2) 19 17

Freely Available Online
www.openaccesspub.org | JPGR CC License DOI: 10.14302/issn.2326-0793.jpgr-12-207 Vol-1 Issue-2 Page No- 11
dependent, the directionality of the response (increase
vs decrease) was genotype-dependent.
Significant changes from WT: We also compared
the transgenics to WT mice. In these comparisons, the
greater the similarity between a transgenic mouse line
and WT, the lower the number of significant differences.
Changes may reflect differences in the effects of
endogenous mouse SP-A (in WT mice) vs those
produced by the expressed human SP-A transgene or
differences in the levels of SP-A regardless of type. The
benchmark for these analyses is the comparison
between WT and SP-A KO mice where there were 21
significant differences out of the 76 identified proteins.
SP-A2: We first compared the mice expressing the 1A0
variant to WT. The AM of mice expressing higher
amounts of SP-A expressed 17 proteins at levels
significantly different from those in WT mice. The
proteins undergoing significant changes are listed in
Supplementary Table 2B. This is in sharp contrast to
the mice expressing very low amounts of 1A0-LE. In the
1A0-LE mice there were 34 significantly different proteins
as compared to WT. These results suggested that
higher levels of expression of 1A0 resulted in an AM
phenotype that was more similar to that of WT mice
compared to that observed with low expressors. In fact,
nine of the 17 significantly different proteins in the 1A0/
Figure 2. Values from SP-A immunostained Western blots from mouse BAL. Identical aliquots from the
BAL of mice used for the proteomic study were subject to electrophoresis, immunostained with an antibody to hu-
man SP-A (both SP-A1 and SP-A2), and scanned. Means values (dark lines) from the scans are graphed on a log
scale with a box plot and individual data points are shown. The immunoblot from which these values were derived
is shown in Supplementary Figure 2.
Freely Available Online
www.openaccesspub.org | JPGR CC License DOI: 10.14302/issn.2326-0793.jpgr-12-207 Vol-1 Issue-2 Page No- 12
WT comparison were also significantly different in the
1A0-LE/WT comparison, suggesting that the threshold
levels of SP-A2 responsible for the effects on AM protein
expression were quite low.
SP-A1: We then compared each of the two mouse lines
expressing SP-A1 (6A4-LE and 6A2) to WT. AM from the
transgenic mice that had high amounts of SP-A1 (6A2)
expressed 47 proteins at levels significantly different
from WT (see Supplementary Table 2B). In the 6A4-
LE mice there were 31 significant differences from the
WT, indicating that the similarity to WT was greater with
lower levels of SP-A1. Of these changes, 24 were
present in both groups (high and low SP-A1), although 2
of the 24 were differentially expressed in the two lines.
This is in contrast to the findings with 1A0-LE and 1A0
(see above) where the degree of similarity of 1A0 to WT
was increased with higher 1A0 levels (i.e. fewer
significant differences between 1A0 and WT). This much
higher number of significant changes between SP-A1
and WT indicates the SP-A1 transgenes are far less
effective, regardless of level, than SP-A2 transgenes in
terms of restoring a WT phenotype. Alternatively, it
may be that SP-A2 regulates many macrophage proteins
in a manner similar to that of native mouse SP-A,
whereas SP-A1 may be less effective or may alter the
expression of proteins that are not affected by either
native mouse SP-A or human SP-A2.
Heat maps
Overview: In an effort to gain some insight into the
functional significance of the changes in protein
expression we generated a series of heat maps
comparing protein expression in each of the hTG mouse
lines, SP-A KO mice, and WT mice. In these maps the
highest level of expression among all mouse lines was
encoded with a bright red color, the lowest level of
expression with a bright green and intermediate levels
with yellow. All values were ranked and assigned
shades of red, yellow, or green depending on where
they fell within the spectrum of expression for each
protein.
We organized the map by arranging all 76
proteins in the WT mice on the basis of highest to
lowest levels and then compared WT to the other groups
(Figure 3). Although this map is very complex there
are a couple of interesting features. The first of these is
that the map for the 1A0 mice resembles, to some
degree, that of the WT mice. This is apparent in the
high abundance of high expressing (red) proteins in the
top half of the figure and an abundance of low
expressing (green) proteins in the bottom portion. The
second prominent feature is that the 6A2 mice are
probably the most different from WT in terms of protein
expression. In the 6A2 mice in the bottom half of the
heat map there is a large number of high expression
levels (red) corresponding to the lowest levels (green) in
the WT. A similar discordance between WT and 6A2 is
seen in the top half where highly expressed proteins
(red) in the WT correspond to the lowest expressed
(green) in the 6A2. The differences between 1A0 and
6A2 mice are further accentuated when a heat map is
generated in which expression levels are stratified
according to values obtained in the 1A0 mice
(Supplementary Figure 4). Thus the observation
from this heat map is that the 1A0 is most similar to the
WT and 6A2 is the most different.
Functional group heat maps: In an attempt to try to
simplify the complicated picture obtained following the
comparison of all 76 proteins, we studied heat maps of
proteins assigned to the 5 functional groups that we
have defined in previous studies [51,54]. The protein
names, accession numbers, and references supporting
the assignment of each protein to a particular group
have been previously published [51,54]. These groups

Freely Available Online
www.openaccesspub.org | JPGR CC License DOI: 10.14302/issn.2326-0793.jpgr-12-207 Vol-1 Issue-2 Page No- 13

Freely Available Online
www.openaccesspub.org | JPGR CC License DOI: 10.14302/issn.2326-0793.jpgr-12-207 Vol-1 Issue-2 Page No- 14
represented important macrophage functions and
included: actin-related/cytoskeletal proteins; Nrf2-
regulated proteins; protease balance/chaperone function
proteins; regulation of inflammation proteins;
regulatory/differentiative proteins. In each of these heat
maps (Figures 4-8), Panel A depicts levels of
expression in 1A0 and 6A2 that are stratified by levels in
WT mice, and Panel B depicts 1A0 and 6A2 levels
arranged by levels of expression in the 1A0 mice, making
the differences between these two hTG lines much more
evident.
The impression obtained from examining the
actin-related proteins (Figure 4A) was similar to that
when we examined all proteins. Namely, the overall
expression pattern was most similar to WT in the 1A0
mice and most different in the 6A2 mice. The difference
between the 1A0 (SP-A2) and 6A2 (SP-A1) mice was
further accentuated when we rearranged the heat map
according to the levels of expression in the 1A0 mice
(Figure 4B). The two protein expression patterns
obtained in this case are nearly the inverse of one
another. The changes in the actin-related/cytoskeletal
proteins may indicate differences in motility and
phagocytosis in the AM from the two hTG lines. Indeed,
in a study from our laboratory studying the effects of SP
-A1 and SP-A2 on phagocytosis in vitro we found that SP
-A2 enhanced phagocytosis of Pseudomonas aeruginosa
more than SP-A1 did [33,34].
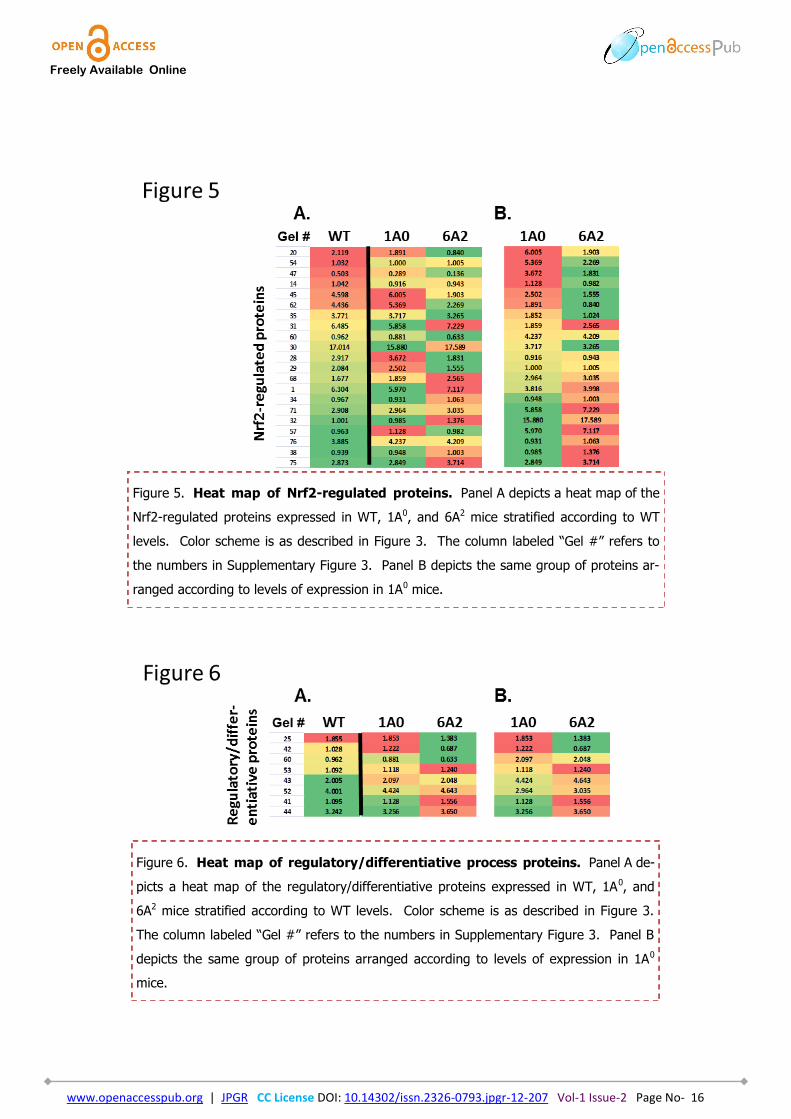
Similar patterns, where the 1A0 resembled that
of WT, were also seen among the Nrf-2 regulated
proteins (Figure 5A) and the regulatory/differentiative
proteins (Figure 6A). The 1A0 heat maps (Figures 5B
and 6B) clearly demonstrated the contrast between 1A0
and 6A2 AM. The similarity between WT and 1A0 was
less obvious in the protease balance/chaperone function
(Figure 7A) and the regulation of inflammation
(Figure 8A) groups, although in these two functional
groups the markedly different patterns between 1A0 and
6A2 remained readily apparent (Figure 5B- 8B). The
marked differences in the proteomic profile of each of
these functional groups between these two hTG lines
lends further support to the idea that these two very
similar protein variants have unique functional
capabilities and that there are definite differences in
phenotypes with respect to their associated functions.
The variation in the pattern of proteins regulated by
Nrf2 indicates that these two lines may have a very
different response to oxidative stress. Similarly, the
disparities in the two mouse lines in the protease
balance/chaperone function protein group may result in
distinctly different abilities to repair damage following
injury. This is also likely to be the case with the
differences in the proteins involved in the regulation of
inflammation that predict altered responses to
inflammatory stimuli. Indeed, when we tested the
ability of SP-A1 and SP-A2 to induce proinflammatory
cytokines in a macrophage cell line we found SP-A2 to
be more effective than SP-A1 [18,20]. Confirming these
(Continued from page 13)
Figure 3. Heat map of all proteins. A heat map is shown for WT mice and all of the hTG lines used in this
study. The protein order is arranged based on levels of expression in WT mice. Red bars have the highest levels,
yellow are in the middle of the range, and green are lowest. Intermediate levels are colored with the appropriate
shades. The column labeled “Gel#” indicates the number of a given protein in the reference gel (Supplementary
Figure 3). The numbers in each bar indicate the average normalized volume for the spot/s representing each pro-
tein.

Freely Available Online
www.openaccesspub.org | JPGR CC License DOI: 10.14302/issn.2326-0793.jpgr-12-207 Vol-1 Issue-2 Page No- 15
effects and the consequences of the above-described
proteomic changes in vivo is an important undertaking
for future studies. However, based on the distinct
proteomic differences observed in the present study, we
speculate that significant differences will be found in
vivo between SP-A1 and SP-A2 in terms of their ability to
regulate inflammatory processes, responses to oxidative
stress, and other functions.
Low expressors: It was interesting to note that
although there were many differences in protein
expression between AM from mice with higher levels of
SP-A1 and SP-A2, a high degree of similarity was
observed between mice expressing low levels of SP-A2
Figure 4. Heat map of actin-related/cytoskeletal proteins. Panel A depicts a heat map of the actin-related/
cytoskeletal proteins expressed in WT, 1A0, and 6A2 mice stratified according to WT levels. Color scheme is as
described in Figure 3. The column labeled “Gel #” refers to the numbers in Supplementary Figure 3. Panel B de-
picts the same group of proteins arranged according to levels of expression in 1A0 mice.
Freely Available Online
www.openaccesspub.org | JPGR CC License DOI: 10.14302/issn.2326-0793.jpgr-12-207 Vol-1 Issue-2 Page No- 16
Figure 5. Heat map of Nrf2-regulated proteins. Panel A depicts a heat map of the
Nrf2-regulated proteins expressed in WT, 1A0, and 6A2 mice stratified according to WT
levels. Color scheme is as described in Figure 3. The column labeled “Gel #” refers to
the numbers in Supplementary Figure 3. Panel B depicts the same group of proteins ar-
ranged according to levels of expression in 1A0 mice.
Figure 6. Heat map of regulatory/differentiative process proteins. Panel A de-
picts a heat map of the regulatory/differentiative proteins expressed in WT, 1A0, and
6A2 mice stratified according to WT levels. Color scheme is as described in Figure 3.
The column labeled “Gel #” refers to the numbers in Supplementary Figure 3. Panel B
depicts the same group of proteins arranged according to levels of expression in 1A0
mice.

Freely Available Online
www.openaccesspub.org | JPGR CC License DOI: 10.14302/issn.2326-0793.jpgr-12-207 Vol-1 Issue-2 Page No- 17
Figure 7. Heat map of protease balance/chaperone function proteins. Panel A depicts a
heat map of the protease balance/chaperone function proteins expressed in WT, 1A0, and 6A2
mice stratified according to WT levels. Color scheme is as described in Figure 3. The column
labeled “Gel #” refers to the numbers in Supplementary Figure 3. Panel B depicts the same group
of proteins arranged according to levels of expression in 1A0 mice.
Figure 8. Heat map of regulation of inflammation proteins. Panel A depicts a heat map of
the regulation of inflammation proteins expressed in WT, 1A0, and 6A2 mice stratified according to
WT levels. Color scheme is as described in Figure 3. The column labeled “Gel #” refers to the
numbers in Supplementary Figure 3. Panel B depicts the same group of proteins arranged ac-
cording to levels of expression in 1A0 mice.

Freely Available Online
www.openaccesspub.org | JPGR CC License DOI: 10.14302/issn.2326-0793.jpgr-12-207 Vol-1 Issue-2 Page No- 18
Figure 9. Heat maps of functional groups. Heat maps are shown for each functional group of proteins de-
picting the expression in KO, 1A0-LE and 6A4-LE mice stratified according to KO levels. Color scheme is as de-
scribed in Figure 3. The column labeled “Gel #” refers to the numbers in Supplementary Figure 3. Panel A shows
the heat map for actin-related/cytoskeletal proteins. Panel B shows the heat map for Nrf2-regulated proteins.
Panel C shows the heat map for protease balance/chaperone function proteins. Panel D shows the heat map for
regulation of inflammation proteins. Panel E shows the heat map for regulatory/differentiative proteins.

Freely Available Online
www.openaccesspub.org | JPGR CC License DOI: 10.14302/issn.2326-0793.jpgr-12-207 Vol-1 Issue-2 Page No- 19
(1A0-LE) and SP-A1 (6A4-LE) in the heat map stratified by
expression patterns in the WT (Figure 3). As pointed
out above, there were relatively few significant
differences between KO (Supplementary Table 2A)
and each of these two low expressing hTG mouse lines.
Both low expressing hTG lines were very different from
KO, but very similar to one another (Supplementary
Figure 5).
The similarity between these two lines is perhaps
best appreciated in heat maps of the different functional
groups after stratification of the heat maps based on
expression levels in AM from SP-A KO mice (Figure 9A-
E). As noted earlier, there were relatively few significant
differences from the KO in these low expressing lines (8
in 1A0-LE; 11 in 6A4-LE). The similarities in the heat
maps of the two low expressing hTG lines may indicate
that a relatively low level of human SP-A expression,
regardless of variant type, is adequate to produce some
changes that seem to be independent of genotype, but
that when higher levels of SP-A are expressed each
variant produces distinct phenotypes.
A potential limitation of this study is the fact that
the different SP-A variants were expressed at different
levels. However, in normal and diseased humans SP-A
levels in the BAL are quite variable as well [48,55,56].
The SP-A levels in BAL from normal healthy humans
varied over an order of magnitude, and when samples
from diseased humans were included the variation could
exceed two orders of magnitude. In addition, the use of
different antibodies and standards has resulted in
variability in reported BAL SP-A levels among different
studies [57]. Moreover, in a study involving 49 normal
human lungs we measured SP-A1/total SP-A ratios and
found a range of 0.003 to .999 (mean 0.21; SD 0.241)
[48].
In the present study we compared KO mice to
1A0 high expressing mice that had been stratified further
within this high-expressing group into a higher subgroup
and a lower subgroup, as well as the 1A0 low expressors.
When this was done, although in some instances protein
expression levels varied proportionally with SP-A levels, in
most cases it did not, and only two of these cases
involved significant changes from the KO values. It was
interesting to note that in several of the examples where
protein expression varied with 1A0 levels, the protein
changes with 6A2 were in the other direction (decrease
vs. increase or vice versa). In the only case where
protein expression differences from KO in 1A0 and 6A2
mice appeared proportional to SP-A levels, the difference
vs KO was significant in both 1A0 and 6A2 mice. This
analysis led us to draw the conclusion that under these
basal conditions most, if not all, of the effects observed
occur after reaching a given threshold level rather than
varying in proportion to SP-A levels. However, the
possibility remains that in the presence of an insult (i.e
oxidative stress) the much higher levels may better
maintain the alveolar macrophage phenotype, since some
of the SP-A could be oxidized, and this can reduce its
functional activity [33,34].
It should be noted that despite the fact that the
6A2 mice had lower levels of SP-A than 1A0 mice did, they
exhibited almost 50% more significant changes vs KO,
further reinforcing that the different response patterns
reflect primarily functional differences between 1A0 and
6A2 rather than differences between absolute amounts of
SP-A. Further evaluation of the expression data for
individual proteins in this study did not show that
differences in specific protein levels between the 1A0 and
6A2 mice were due to levels of SP-A, but rather due to
the specific variant present. This was also supported by
the very different response patterns elicited by 1A0 and

Freely Available Online
www.openaccesspub.org | JPGR CC License DOI: 10.14302/issn.2326-0793.jpgr-12-207 Vol-1 Issue-2 Page No- 20
6A2. At the other end of the spectrum, with the low
expressing mouse lines, while we were unable to
measure SP-A using the same gel parameters as with the
high expressing group, the protein expression patterns in
these mice was very different from that present in the SP
-A KO group. This indicated that even very low levels of
SP-A have a profound effect on protein expression, and
this expression profile is very different from that seen
when the proteins are expressed at higher levels.
Another potential limitation is whether the effects
of human SP-A on mouse alveolar macrophages provides
a good surrogate for the human lung. While many gaps
remain in our knowledge of the mechanism of action of
SP-A and the specific receptors involved, similarities in
the effects of human SP-A on phagocytosis in human and
rat alveolar macrophages [34,41] and mouse alveolar
macrophages (our unpublished data) confirm that at least
some of the SP-A effects are SP-A-specific, rather than
species-specific. Specifically, in terms of phagocytosis,
when human, rat, and mouse alveolar macrophages were
incubated with bacteria in the presence of SP-A1 or SP-
A2, although the macrophages responded to both SP-A1
and SP-A2, in all cases SP-A2-treated macrophages
exhibited a higher phagocytic index than those treated
with SP-A1. Further evidence is provided by the many
studies we have published examining the effects of SP-A
and the functional differences between the human SP-A
variants [12,18,20,33,34,40,44] in a number of in vitro
systems.
Summary
In the present study we compared the AM
proteome of hTG mice to KO mice and were able to gain
insight into changes in protein expression resulting from
the presence of the SP-A transgenes. We studied the
expression of 76 AM proteins using a 2D-DIGE
experimental design. We found that even when SP-A
was expressed at low levels the AM proteome differed
markedly from that of SP-A KO mice. While there were
relatively few significant differences from KO, the
similarity in these responses led us to speculate that
these low amounts of SP-A might be affecting the AM by
acting through a high affinity receptor that was not
variant-specific.
On the other hand, when we studied the mice
expressing higher levels of SP-A there were more than
twice as many significant changes, with greater numbers
of changes occurring in the SP-A1 (6A2) mice. The other
difference between these mouse lines that became
apparent with the study of heat maps was that these two
mouse lines produced AM with dramatically different
phenotypes. Examining both the overall protein
expression pattern as well as the individual functional
groups, clearly showed that the patterns of expression in
the 1A0 and 6A2 mice were almost the inverse of one
another (proteins at their highest levels in 1A0 were at
their lowest levels in 6A2, and vice versa). Another very
interesting feature of the 1A0 expression pattern was its
similarity to the WT pattern. These observations led us
to speculate that when high levels of SP-A1 and SP-A2
are present they acted in a variant-specific manner,
either through different receptors or by eliciting distinctly
different responses through a single receptor.
Further studies are required to determine how
these changes in the AM proteome in various humanized
SP-A hTG mice affect AM function. On the basis of the
similarities between WT and the SP-A2 hTG mice we
would predict that SP-A2 transgenics would clear bacteria
more effectively from their lungs than SP-A1 mice and
that their AM would exhibit increased phagocytic
function, as we have previously demonstrated in vitro
with AM treated with exogenous SP-A2 [34,41].
However, both SP-A variants must be present in order for
tubular myelin to be present in the alveolar space [46]
indicating a divergence of function. Of relevance is the
fact that the ratio of SP-A1 to total SP-A in humans varies

Freely Available Online
www.openaccesspub.org | JPGR CC License DOI: 10.14302/issn.2326-0793.jpgr-12-207 Vol-1 Issue-2 Page No- 21
as a function of lung disease and age [48,49]. We
speculate that many aspects of lung function, particularly
with respect to the AM, depend on the relative amounts
of SP-A1 and SP-A2 in the alveolus.
CONCLUSIONS
1. AM protein expression patterns differed markedly
from SP-A KO in hTG mouse lines generated on
the SP-A KO background.
2. The AM protein expression patterns from mouse
lines expressing low levels of SP-A1 and SP-A2
were similar to each other but different from KO
indicating a lack of variant-specific effects at very
low levels of SP-A.
3. SP-A1 and SP-A2 at higher levels exhibited very
different AM protein expression patterns
indicating variant-specific patterns at higher
levels of expression of hSP-A.
4. AM protein expression in SP-A2 hTG mice was
similar to WT and the pattern from SP-A1 mice
was very different from WT.
ACKNOWLEDGEMENTS
The authors thank Susan DiAngelo for
genotyping. Current address for Guirong Wang:
Department of Surgery, SUNY Upstate Medical University,
Syracuse, NY 13210.
This study was supported in part by R01 ES009882 from
the National Institute of Environmental Health Sciences.
FIGURE LEGENDS
SUPPLEMENTARY MATERIALS
Supplementary Table 2A: Summary of all significant
changes versus SP-A KO AM.
Supplementary Table 2B: Summary of all significant
changes versus WT AM.
Supplementary Figure 4. Heat map of all proteins. A
heat map is shown for WT mice, KO mice, and all of the
transgenic lines used in this study. The protein order is
arranged based on levels of expression in 1A0 mice. Red
bars have the highest levels, yellow are in the middle of
the range, and green are lowest. Intermediate levels are
colored with the appropriate shades. The column labeled
“gel#” indicates the number of a given protein in the
reference gel (Supplementary Figure 3). The numbers in
each bar indicate the average normalized volume for the
spot/s representing each protein.
Supplementary Figure 5. Heat map of all proteins. A
heat map is shown for WT mice, KO mice, and all of the
transgenic lines used in this study. The protein order is
arranged based on levels of expression in KO mice. Red
bars have the highest levels, yellow are in the middle of
the range, and green are lowest. Intermediate levels are
colored with the appropriate shades. The column labeled
“gel#” indicates the number of a given protein in the
reference gel (Supplementary Figure 3). The numbers in
each bar indicate the average normalized volume for the
spot/s representing each protein.
References
1. Crouch E, Hartshorn K, Ofek I:
Collectins and pulmonary innate immunity.
Immunol Rev 2000, 173: 52-65.
2. Phelps DS: Surfactant regulation of
host defense function in the lung: A

Freely Available Online
www.openaccesspub.org | JPGR CC License DOI: 10.14302/issn.2326-0793.jpgr-12-207 Vol-1 Issue-2 Page No- 22
question of balance. Pediatr Pathol Mol Med
2001, 20: 269-292.
3. Floros J, Hoover RR: Genetics of the
hydrophilic surfactant proteins A and D.
Biochim Biophys Acta 1998, 1408: 312-322.
4. DiAngelo S, Lin Z, Wang G, Phillips S,
Ramet M, Luo J et al.: Novel, non-radioactive,
simple and multiplex PCR-cRFLP methods
for genotyping human SP-A and SP-D
marker alleles. Dis Markers 1999, 15: 269-281.
5. Hickling TP, Malhotra R, Bright H,
McDowell W, Blair ED, Sim RB: Lung surfactant
protein A provides a route of entry for
respiratory syncytial virus into host cells.
Viral Immunol 2000, 13: 125-135.
6. Madan T, Kishore U, Shah A, Eggleton P,
Strong P, Wang JY et al.: Lung surfactant
proteins A and D can inhibit specific IgE
binding to the allergens of Aspergillus
fumigatus and block allergen-induced
histamine release from human basophils.
Clin exp Immunol 1997, 110: 241-249.
7. Madan T, Kishore U, Singh M, Strong P,
Clark H, Hussain EM et al.: Surfactant proteins
A and D protect mice against pulmonary
hypersensitivity induced by Aspergillus
fumigatus antigens and allergens. J Clin
Invest 2001, 107: 467-475.
8. Madan T, Reid KB, Clark H, Singh M,
Nayak A, Sarma PU et al.: Susceptibility of
mice genetically deficient in SP-A or SP-D
gene to invasive pulmonary aspergillosis.
Mol Immunol 2010, 47: 1923-1930.
9. Malhotra R, Haurum J, Thiel S, Jensenius
JC, Sim RB: Pollen grains bind to lung
alveolar type II cells (A549) via lung
surfactant protein A (SP-A). Biosci Rep 1993,
13: 79-90.
10. Kremlev SG, Phelps DS: Surfactant
protein A stimulation of inflammatory
cytokine and immunoglobulin production.
Am J Physiol 1994, 267: L712-L719.
11. Kremlev SG, Umstead TM, Phelps DS:
Surfactant protein A regulates cytokine
production in the monocytic cell line THP-
1. Am J Physiol 1997, 272: L996-1004.
12. Wang G, Phelps DS, Umstead TM, Floros
J: Human SP-A protein variants derived
from one or both genes stimulate TNF-
alpha production in the THP-1 cell line. Am
J Physiol Lung Cell Mol Physiol 2000, 278: L946-
L954.
13. Wang H, Tracey KJ: Tumor necrosis
factor, interleukin-6, macrophage
migration inhibitory factor, and
macrophage inflammatory protein-1 in
inflammation. In Inflammation: Basic Principles
and Clinical Correlates. 3 edition. Edited by Gallin
JI, Snyderman R. Philadelphia: Lippincott
Williams & Wilkins; 1999:471-486.
14. Meloni F, Alberti A, Bulgheroni A, Lupi A,
Paschetto E, Marone BA et al.: Surfactant
apoprotein A modulates interleukin-8 and
monocyte chemotactic peptide-1
production. Eur Respir J 2002, 19: 1128-1135.
15. Borron PJ, Crouch EC, Lewis JF, Wright
JR, Possmayer F, Fraher LJ: Recombinant rat
surfactant-associated protein D inhibits
human T lymphocyte proliferation and IL-2
production. J Immunol 1998, 161: 4599-4603.

Freely Available Online
www.openaccesspub.org | JPGR CC License DOI: 10.14302/issn.2326-0793.jpgr-12-207 Vol-1 Issue-2 Page No- 23
16. Alcorn JF, Wright JR: Surfactant
protein A inhibits alveolar macrophage
cytokine production by CD14-independent
pathway. Am J Physiol Lung Cell Mol Physiol
2004, 286: L129-L136.
17. Gardai SJ, Xiao YQ, Dickinson M, Nick JA,
Voelker DR, Greene KE et al.: By binding
SIRPalpha or calreticulin/CD91, lung
collectins act as dual function surveillance
molecules to suppress or enhance
inflammation. Cell 2003, 115: 13-23.
18. Wang G, Umstead TM, Phelps DS, Al
Mondhiry H, Floros J: The effect of ozone
exposure on the ability of human
surfactant protein A variants to stimulate
cytokine production. Environ Health Perspect
2002, 110: 79-84.
19. Huang W, Wang G, Phelps DS, Al
Mondhiry H, Floros J: Combined SP-A-
bleomycin effect on cytokines by THP-1
cells: impact of surfactant lipids on this
effect. Am J Physiol Lung Cell Mol Physiol 2002,
283: L94-L102.
20. Huang W, Wang G, Phelps DS, Al
Mondhiry H, Floros J: Human SP-A genetic
variants and bleomycin-induced cytokine
production by THP-1 cells: effect of ozone-
induced SP-A oxidation. Am J Physiol Lung
Cell Mol Physiol 2004, 286: L546-L553.
21. Kuronuma K, Sano H, Kato K, Kudo K,
Hyakushima N, Yokota S et al.: Pulmonary
surfactant protein A augments the
phagocytosis of Streptococcus pneumoniae
by alveolar macrophages through a casein
kinase 2-dependent increase of cell surface
localization of scavenger receptor A. J Biol
Chem 2004, 279: 21421-21430.
22. Beharka AA, Gaynor CD, Kang BK,
Voelker DR, McCormack FX, Schlesinger LS:
Pulmonary surfactant protein A up-
regulates activity of the mannose receptor,
a pattern recognition receptor expressed
on human macrophages. J Immunol 2002,
169: 3565-3573.
23. Kremlev SG, Phelps DS: Effect of SP-A
and surfactant lipids on expression of cell
surface markers in the THP-1 monocytic
cell line. Am J Physiol 1997, 272: L1070-L1077.
24. Gil M, McCormack FX, LeVine AM:
Surfactant protein A modulates cell surface
expression of CR3 on alveolar
macrophages and enhances CR3-mediated
phagocytosis. J Biol Chem 2009, 284: 7495-
7504.
25. Henning LN, Azad AK, Parsa KV,
Crowther JE, Tridandapani S, Schlesinger LS:
Pulmonary surfactant protein A regulates
TLR expression and activity in human
macrophages. J Immunol 2008, 180: 7847-
7858.
26. Blanco O, Catala A: Surfactant protein
A inhibits the non-enzymatic lipid
peroxidation of porcine lung surfactant.
Prostaglandins Leukot Essent Fatty Acids 2001,
65: 185-190.
27. Bridges JP, Davis HW, Damodarasamy M,
Kuroki Y, Howles G, Hui DY et al.: Pulmonary
surfactant proteins A and D are potent
endogenous inhibitors of lipid peroxidation

Freely Available Online
www.openaccesspub.org | JPGR CC License DOI: 10.14302/issn.2326-0793.jpgr-12-207 Vol-1 Issue-2 Page No- 24
and oxidative cellular injury. J Biol Chem
2000, 275: 38848-38855.
28. Gil HW, Oh MH, Woo KM, Lee EY, Oh
MH, Hong SY: Relationship between
pulmonary surfactant protein and lipid
peroxidation in lung injury due to paraquat
intoxication in rats. Korean J Intern Med 2007,
22: 67-72.
29. Terrasa AM, Guajardo MH, de Armas SE,
Catala A: Pulmonary surfactant protein A
inhibits the lipid peroxidation stimulated
by linoleic acid hydroperoxide of rat lung
mitochondria and microsomes. Biochim
Biophys Acta 2005, 1735: 101-110.
30. Haque R, Umstead TM, Freeman WM,
Floros J, Phelps DS: The impact of surfactant
protein-A on ozone-induced changes in the
mouse bronchoalveolar lavage proteome.
Proteome Sci 2009, 7: 12.
31. Mikerov AN, Gan X, Umstead TM, Miller
L, Chinchilli VM, Phelps DS et al.: Sex
differences in the impact of ozone on
survival and alveolar macrophage function
of mice after Klebsiella pneumoniae
infection. Respir Res 2008, 9: 24.
32. Mikerov AN, Haque R, Gan X, Guo X,
Phelps DS, Floros J: Ablation of SP-A has a
negative impact on the susceptibility of
mice to Klebsiella pneumoniae infection
after ozone exposure: sex differences.
Respir Res 2008, 9: 77.
33. Mikerov AN, Umstead TM, Gan X, Huang
W, Guo X, Wang G et al.: Impact of ozone
exposure on the phagocytic activity of
human surfactant protein A (SP-A) and SP-
A variants. Am J Physiol Lung Cell Mol Physiol
2008, 294: L121-L130.
34. Mikerov AN, Umstead TM, Huang W, Liu
W, Phelps DS, Floros J: SP-A1 and SP-A2
variants differentially enhance association
of Pseudomonas aeruginosa with rat
alveolar macrophages. Am J Physiol Lung Cell
Mol Physiol 2005, 288: L150-L158.
35. Kuzmenko AI, Wu H, McCormack FX:
Pulmonary col lectins selectively
permeabilize model bacterial membranes
containing rough lipopolysaccharide.
Biochemistry 2006, 45: 2679-2685.
36. Kuzmenko AI, Wu H, Wan S, McCormack
FX: Surfactant protein A is a principal and
o x i d a t i o n - s e n s i t i v e m i c r o b i a l
permeabilizing factor in the alveolar lining
fluid. J Biol Chem 2005, 280: 25913-25919.
37. Hickman-Davis JM, Gibbs-Erwin J,
Lindsey JR, Matalon S: Role of surfactant
protein-a in nitric oxide production and
Mycoplasma killing in congenic C57BL/6
mice. Am J Respir Cell Mol Biol 2004, 30: 319-
325.
38. Brinker KG, Garner H, Wright JR:
Surfactant protein A modulates the
differentiation of murine bone marrow-
derived dendritic cells. Am J Physiol Lung Cell
Mol Physiol 2003, 284: L232-L241.
39. Yang S, Milla C, Panoskaltsis-Mortari A,
Ingbar DH, Blazar BR, Haddad IY: Human
surfactant protein A suppresses T cell-
dependent inflammation and attenuates
the manifestations of idiopathic pneumonia

Freely Available Online
www.openaccesspub.org | JPGR CC License DOI: 10.14302/issn.2326-0793.jpgr-12-207 Vol-1 Issue-2 Page No- 25
syndrome in mice. Am J Respir Cell Mol Biol
2001, 24: 527-536.
40. Wang G, Bates-Kenney SR, Tao JQ,
Phelps DS, Floros J: Differences in
biochemical properties and in biological
function between human SP-A1 and SP-A2
variants, and the impact of ozone-induced
oxidation. Biochemistry 2004, 43: 4227-4239.
41. Mikerov AN, Wang G, Umstead TM,
Zacharatos M, Thomas NJ, Phelps DS et al.:
Surfactant protein A2 (SP-A2) variants
expressed in CHO cells stimulate
phagocytosis of Pseudomonas aeruginosa
more than Do SP-A1 variants. Infect Immun
2007, 75: 1403-1412.
42. Garcia-Verdugo I, Wang G, Floros J,
Casals C: Structural analysis and lipid-
binding properties of recombinant human
surfactant protein a derived from one or
both genes. Biochemistry 2002, 41: 14041-
14053.
43. Oberley RE, Snyder JM: Recombinant
human SP-A1 and SP-A2 proteins have
d i f f e r e n t c a r b o h y d r a t e - b i n d i n g
characteristics. Am J Physiol Lung Cell Mol
Physiol 2003, 284: L871-L881.
44. Wang G, Myers C, Mikerov A, Floros J:
Effect of cysteine 85 on biochemical
properties and biological function of
human surfactant protein A variants.
Biochemistry 2007, 46: 8425-8435.
45. Wang G, Taneva S, Keough KM, Floros J:
Differential effects of human SP-A1 and SP
-A2 variants on phospholipid monolayers
containing surfactant protein B. Biochim
Biophys Acta 2007, 1768: 2060-2069.
46. Wang G, Guo X, DiAngelo S, Thomas NJ,
Floros J: Humanized SFTPA1 and SFTPA2
transgenic mice reveal functional
divergence of SP-A1 and SP-A2: formation
of tubular myelin in vivo requires both
gene products. J Biol Chem 2010, 285: 11998-
12010.
47. Floros J, Wang G, Mikerov AN: Genetic
complexity of the human innate host
defense molecules, surfactant protein A1
(SP-A1) and SP-A2--impact on function. Crit
Rev Eukaryot Gene Expr 2009, 19: 125-137.
48. Tagaram HR, Wang G, Umstead TM,
Mikerov AN, Thomas NJ, Graff GR et al.:
Characterization of a human surfactant
protein A1 (SP-A1) gene-specific antibody;
SP-A1 content variation among individuals
of varying age and pulmonary health. Am J
Physiol Lung Cell Mol Physiol 2007, 292: L1052-
L1063.
49. Wang Y, Voelker DR, Lugogo NL, Wang
G, Floros J, Ingram JL et al.: Surfactant
protein A is defective in abrogating
inflammation in asthma. Am J Physiol Lung
Cell Mol Physiol 2011, 301: L598-L606.
50. Guth AM, Janssen WJ, Bosio CM, Crouch
EC, Henson PM, Dow SW: Lung environment
determines unique phenotype of alveolar
macrophages. Am J Physiol Lung Cell Mol
Physiol 2009, 296: L936-L946.
51. Phelps DS, Umstead TM, Quintero OA,
Yengo CM, Floros J: In vivo rescue of alveolar
macrophages from SP-A knockout mice

Freely Available Online
www.openaccesspub.org | JPGR CC License DOI: 10.14302/issn.2326-0793.jpgr-12-207 Vol-1 Issue-2 Page No- 26
with exogenous SP-A nearly restores a wild
type intracellular proteome; actin
involvement. Proteome Sci 2011, 9: 67.
52. Joshi M, Keith PH, Haisch C, Verbanac K:
Real-time PCR to determine transgene
copy number and to quantitate the
biolocalization of adoptively transferred
cells from EGFP-transgenic mice.
Biotechniques 2008, 45: 247-258.
53. Ballester M, Castello A, Ibanez E,
Sanchez A, Folch JM: Real-time quantitative
PCR-based system for determining
transgene copy number in transgenic
animals. Biotechniques 2004, 37: 610-613.
54. Phelps DS, Umstead TM, Floros J: Sex
differences in the response of the alveolar
macrophage proteome to treatment with
exogenous surfactant protein-A. Proteome
Sci 2012, 10: 44.
55. Phelps DS, Rose RM: Increased
recovery of surfactant protein A in AIDS-
related pneumonia. Am Rev Respir Dis 1991,
143: 1072-1075.
56. Phelps DS, Umstead TM, Mejia M, Carrillo
G, Pardo A, Selman M: Increased surfactant
protein-a levels in patients with newly
diagnosed idiopathic pulmonary fibrosis.
Chest 2004, 125: 617-625.
57. Silveyra P, Floros J: Genetic variant
associations of human SP-A and SP-D with
acute and chronic lung injury. Front Biosci
2012, 17: 407-429.


![TEMPUS IRIS PROJECT · Project number 530315-TEMPUS-1-2012-1-IL-TEMPUS-JPGR This project has been funded with support from the European Commission. This publication [communication]](https://img.pdfslide.us/doc/110x75/5f411973657aae47a70b828a/tempus-iris-project-project-number-530315-tempus-1-2012-1-il-tempus-jpgr-this-project.jpg)


![M rTrNfi-]Nf~TrfC! G - p)]LAN'·, renvironmentclearance.nic.in/writereaddata/District/...MllilrTrNfi-]Nf~TrfC! p)]LAN'·, r jll_l ~G -r='_! y ~ INCLUDING PROGRESSIVE MINE CLOSURE PLAN](https://img.pdfslide.us/doc/110x75/60b729a220a87a2cf45b0dec/m-rtrnfi-nftrfc-g-plan-r-mllilrtrnfi-nftrfc-plan-r-jlll-g.jpg)