Embed Size (px)
Citation preview

DIFFERENCES IN OCULAR BLOOD FLOW BETWEEN PEOPLE OF AFRICAN AND
EUROPEAN DESCENT WITH HEALTHY EYES
Betül Kaskan, MD, Koosha Ramezani, MD, Alon Harris, PhD, Brent Siesky, PhD Carine
Olinde, Darrell WuDunn, MD, PhD, Jennifer Eikenberry, MD, Leslie A Tobe, MD, Lyne
Racette, PhD
Eugene and Marilyn Glick Eye Institute, Indiana University School of Medicine,
Department of Ophthalmology, Indianapolis, USA
Correspondence to:
Lyne Racette, PhD
Eugene and Marilyn Glick Eye Institute
Department of Ophthalmology
Indiana University School of Medicine
1160 W Michigan Street
Indianapolis, IN, 46202
Phone: 317-274-1226
Fax: 317-274-8992
Email: [email protected]
This study was supported in part by: Biomedical Research Grant from Indiana University
School of Medicine (LR); Indiana University–Purdue University Indianapolis Enhanced
Mentoring Program with Opportunities for Ways to Excel in Research (EMPOWER)
award (LR); and by an unrestricted grant from Research to Prevent Blindness.
_________________________________________________________________________________ This is the author's manuscript of the article published in final edited form as: Kaskan, B., Ramezani, K., Harris, A., Siesky, B., Olinde, C., WuDunn, D., … Racette, L. (2016). Differences in Ocular Blood Flow Between People of African and European Descent With Healthy Eyes: Journal of Glaucoma, 25(9), 709–715. https://doi.org/10.1097/IJG.0000000000000509
2
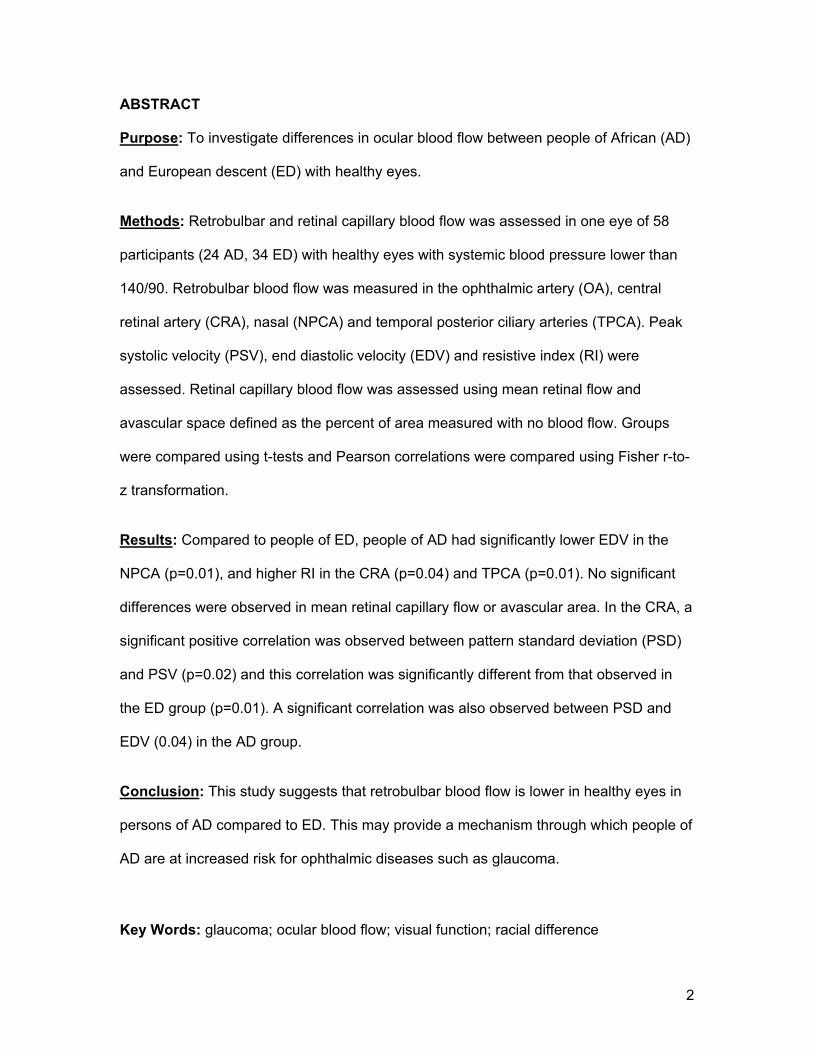
ABSTRACT
Purpose: To investigate differences in ocular blood flow between people of African (AD)
and European descent (ED) with healthy eyes.
Methods: Retrobulbar and retinal capillary blood flow was assessed in one eye of 58
participants (24 AD, 34 ED) with healthy eyes with systemic blood pressure lower than
140/90. Retrobulbar blood flow was measured in the ophthalmic artery (OA), central
retinal artery (CRA), nasal (NPCA) and temporal posterior ciliary arteries (TPCA). Peak
systolic velocity (PSV), end diastolic velocity (EDV) and resistive index (RI) were
assessed. Retinal capillary blood flow was assessed using mean retinal flow and
avascular space defined as the percent of area measured with no blood flow. Groups
were compared using t-tests and Pearson correlations were compared using Fisher r-to-
z transformation.
Results: Compared to people of ED, people of AD had significantly lower EDV in the
NPCA (p=0.01), and higher RI in the CRA (p=0.04) and TPCA (p=0.01). No significant
differences were observed in mean retinal capillary flow or avascular area. In the CRA, a
significant positive correlation was observed between pattern standard deviation (PSD)
and PSV (p=0.02) and this correlation was significantly different from that observed in
the ED group (p=0.01). A significant correlation was also observed between PSD and
EDV (0.04) in the AD group.
Conclusion: This study suggests that retrobulbar blood flow is lower in healthy eyes in
persons of AD compared to ED. This may provide a mechanism through which people of
AD are at increased risk for ophthalmic diseases such as glaucoma.
Key Words: glaucoma; ocular blood flow; visual function; racial difference

3
INTRODUCTION
Primary open-angle glaucoma (POAG) is a progressive optic neuropathy in which
damage to the retinal ganglion cells results in loss of visual function.1 POAG is the most
common form of glaucoma,2 and people of African descent (AD) are disproportionately
affected by this disease compared to people of European descent (ED).3,4 In the United
States, higher prevalence and incidence of POAG have been reported for people of AD.5
In similar age groups, African Americans have been reported to be up to six times more
likely to have POAG compared to white Americans, and POAG is the leading cause of
irreversible blindness in the African American population.6
The reasons underlying the well-documented susceptibility of people of AD to POAG
remain unclear. POAG is a multifactorial disease, and differences between people of AD
and ED could be due to a single factor or to a combination of factors. Several differences
have been reported between people of AD and ED with healthy eyes. Specifically,
people of AD have been shown to have on average larger optic discs, larger cup-to-disc
ratios, thicker retinal nerve fiber layer, and thinner corneas.7-10 People of AD have also
been shown to have slightly worse visual function.11 Racial differences associated with
some of the risk factors for glaucoma have also been reported. For example, people of
AD have been reported to have a higher prevalence of diabetes12 and systemic
hypertension.13
Vascular factors may also play a role in the racial differences observed in POAG.
Several studies have shown a relationship between POAG and both ocular blood flow
and ocular perfusion pressure (OPP).14-16 Differences in retinal,17 choroidal,18 and
retrobulbar19-22 blood flow have been shown in patients with POAG. Additionally, ocular

4
vascular markers have been shown to correlate with visual field loss.17,23-25 POAG is also
associated with other vascular conditions including systemic hypertension,25 nocturnal
arterial hypotension,26 and optic disc haemorrhages.27 Large population-based studies
have shown a relationship between OPP and the prevalence, incidence and progression
of glaucoma.14,16,28,29
Within the AD population, vascular factors may have a greater impact compared to
people of ED. For example, people of AD have higher rates of cardiovascular disease30
and AD patients with POAG have been reported to have significantly lower blood flow
values in all retrobulbar blood vessels compared to POAG patients of ED.31 Finally,
racial differences were observed in a longitudinal study of ocular blood flow in POAG.
Patients of AD, but not ED, showed a significant and positive association between
change in retinal capillary blood flow and ONH parameters over a 3-year follow-up
period.32 To the best of our knowledge, racial differences in ocular blood flow have not
been assessed in healthy eyes. The purpose of this study was to determine whether
differences in ocular blood flow exist between AD and ED individuals with healthy eyes.
MATERIALS AND METHODS
Fifty-eight eyes from 58 participants with healthy eyes were enrolled in the study. Of
these, 24 were of AD and 34 were of ED. One eye was randomly selected and tested for
each participant. Participants were recruited into the study through advertisements, from
family members of patients, or were referred to the study from primary eye care clinics.
Informed consent was obtained from all participants in the study. All methodology were
approved by the Indiana University School of Medicine institutional review board. This
study was performed in compliance with the Health Insurance Portability and
Accountability Act (HIPAA) as well as the tenets of the Declaration of Helsinki.

5
Inclusion Criteria
Both eyes of each participant were healthy based on a complete dilated ocular
examination. Healthy eyes were defined as having open angles, best-corrected visual
acuity of 20/40 or better, spherical refraction within ±5 diopters, cylinder correction within
±3 diopters, symmetric optic discs defined as an asymmetry in the vertical cup-to-disc
ratio ≤ 0.2, no hemorrhages or retinal nerve fiber layer defects, and a normal
appearance of the optic disc. All participants also had IOP of less than 22 mmHg and no
repeatable abnormalities on static automated perimetry (definition of normal results
provided in the Visual Function section below). Participants with a family history of
glaucoma were included.
Exclusion Criteria
Participants were excluded if they had a history of intraocular surgery (except for
uncomplicated cataract surgery) or if they showed evidence of other ocular diseases
including diabetic retinopathy. Participants were also excluded if they had diseases
affecting the visual field such as demyelinating diseases, diabetes, HIV positive or
diagnosed with AIDS, or pituitary lesions. In addition participants were excluded if they
were taking medications known to affect visual field sensitivity or vision color.
Participants with controlled systemic blood pressure exceeding 140/90 were excluded
from the study. Finally, participants who did not identify as being of either of AD or of ED
by self-report were excluded from the study.

6
General methodology
Participants were seen on three different visits, each performed at least one day apart.
On average, all visits were performed over a short time frame to ensure that eyes
remained healthy throughout the study (mean of 42 ± 33 days; range of 3 to 200 days).
At baseline, participants underwent a complete ocular examination and took two practice
visual field tests. The visual field and blood pressure measurements included in the
analyses were performed on the second and third visit. Ocular blood flow was measured
on the third visit. Participants were asked to avoid caffeine, smoking and alcohol prior to
the third visit on which ocular blood flow measurements were taken. IOP (average of two
consecutive measurements) was obtained using Goldmann applanation tonometry and
central corneal thickness (average of three consecutive measurements) was obtained
using the Pachette 2 ultrasonic pachymeter (DGH Technologies, Exton, Pennsylvania,
USA). Brachial systolic and diastolic blood pressures and pulse were measured after a
five-minute rest period using a calibrated automated sphygmomanometer. Mean arterial
pressure (MAP) was calculated as 2/3 diastolic blood pressure + 1/3 systolic blood
pressure. OPP was assessed and defined as 2/3 MAP – IOP.
Ocular Blood Flow
Ocular blood flow (OBF) was measured in the retrobulbar vessels using Color Doppler
Imaging (CDI) and in the retinal capillaries using the Heidelberg Retinal Flowmeter
(HRF), which are described in more details in the next sections. All measurements were
obtained by, or under the direct supervision, of one of the authors (B.S.) who has over
fifteen years of experience in obtaining ocular blood flow measurements.
Retrobulbar blood flow

7
Retrobulbar blood flow was assessed using CDI with the Philips HDI 5000 SonoCT
Ultrasound System with the microvascular small parts clinical option (Philips Medical
Systems, Bothell, Washington, USA) using a 7.5 MHz linear probe. To ensure the quality
of the measurements, the average of at least three EKG waves was used and angle
correction was applied when needed.33 CDI measurements were taken in the ophthalmic
artery (OA), central retinal artery (CRA), and nasal and temporal posterior ciliary arteries
(NPCA and TPCA, respectively). In each vessel, peak systolic (PSV) and end diastolic
(EDV) velocities were determined and the Pourcelot vascular resistive index (RI) was
calculated. RI was defined as [RI=(PSV – EDV)/PSV]. These measurements have been
previously shown to be reproducible.34
Retinal capillary blood flow
Retinal capillary blood flow was measured with confocal scanning laser Doppler
flowmetry using the HRF (Heidelberg Engineering, Heidelberg, Germany). HRF uses an
infrared laser to scan the retina and optic disc to measure vascular perfusion, and has
been show to be reproducible.35,36 Areas of perfused tissue are differentiated from
avascular tissue, allowing for a quantification of the degree of vascularity of the fundus.
To ensure quality, all measurements had a DC value (brightness sensitivity setting)
between 100 and 200.37,38 A detailed description of this method is available
elsewhere.38,39 We estimated the mean retinal flow and avascular areas defined as the
percent area with no blood flow (% zero flow pixels) in the superior and inferior
hemifields.
Visual Function

8
Visual function was assessed using standard automated perimetry (SAP) on the
Humphrey Field Analyzer II using the 24-2 program and the Swedish Interactive
Thresholding Algorithm (SITA) version 4.2 (Carl Zeiss Meditec, Dublin, CA). SAP uses a
small (0.43° of visual angle) flash of white light presented on a dim background (31.5
apostilbs) for 200 milliseconds. This test is non-selective in that all types of retinal
ganglion cells can detect the stimuli. All participants were provided with appropriate
corrections for viewing distance, had a pupil size of at least 3 millimeters and were
asked to press a response button whenever they saw a stimulus while fixating on a
central target.
Participants included in this study underwent a total of four visual field tests. Two tests
were performed at the first study visit (practice tests) and two tests were performed at
the third visit. To minimize the impact of learning effects, whenever possible, the last two
visual field tests were averaged and used for analysis. In cases where one or both of the
last two visual field tests were unreliable, we used the tests performed on the first visit.
When only one reliable test was available, we used the results of that one test without
averaging the results (this occurred only for 2 participants of ED and both had normal
results). Reliability was defined as less than ≤20% false positive and false negative
errors, as well as less than ≤20% fixation losses. Visual fields were further reviewed to
ensure that the visual fields were free of artifacts.11
Definition of visual field abnormality. In order to meet the visual field inclusion criteria,
participant had to have normal visual fields, defined as no repeatable visual field defect.
An abnormal visual field was defined as having either a mean deviation (MD) triggered
at 5% or worse, a pattern standard deviation (PSD) triggered at 5% or worse, or an
9
outcome other than “within normal limits” or “borderline” on the glaucoma hemifield test
(GHT). When two visual field tests were available, the results had to be abnormal on
both visual field tests of a given eye for the results to be considered abnormal because
confirmation of visual field defects has been shown previously to improve the specificity
of the results.
Racial difference in visual function. Racette et al11 previously reported the presence of
differences in SAP between people of AD and ED with healthy eyes with normal visual
field results. In this study, we therefore compared the AD and ED groups on the
following parameters: MD, PSD, and the number of points triggered at 5% or worse
(<5%, <2%, <1%, or <0.5%) and at 1% or worse (<1% or <0.5%) on the total deviation
(TD) and pattern deviation (PD) plots. When averaging the number of abnormal points,
the level of abnormality (<5%, <2%, <1%, and <0.5%) and the location of the points
were not considered.
Statistical Analysis
Participant-specific categorical variables were compared using the Fisher exact test, and
continuous variables were compared using the 2-tailed, unpaired t-tests. Correlations
between OBF and visual field parameters in the AD and ED groups were obtained using
the Pearson correlation coefficient. Differences in these correlations were assessed
using the Fisher r-to-z transformation using the VassarStats (http://vassarstats.net). All
other statistical analyses were performed in JMP statistical software (version 9.0.2; SAS
Institute Inc, Cary, North Carolina). P<0.05 was considered statistically significant.
Multiple testing corrections were not applied.
10
RESULTS
Table 1 shows the demographics and general health data of the participants of AD and
ED. No significant differences in age were observed between the two groups, with a
mean of 52.8 ± 7.7 years of age in the AD group compared to 53.2 ± 8.7 years in the ED
group (p=0.88). Similarly, no significant differences were observed between the groups
for sex, presence of a family history of glaucoma, IOP, MAP, OPP, central corneal
thickness, and for the presence of diabetes or heart disease (all p-values > 0.05).
The results of the retrobulbar blood flow are presented in Table 2. Significant differences
between the AD and ED groups were observed for one of three parameters of the four
arteries that were assessed (CRA, NPCA, and TPCA), while no significant differences
were observed in the OA. In the CRA, participants of AD (0.7 ± 0.08) had a significantly
higher RI value compared to those of ED (0.66 ± 0.07) (p=0.04). In the NPCA,
participants of AD (2.27 ± 063) had significantly lower EDV values compared to
participants of ED (2.91 ± 1.18) (p=0.01). Finally, in the TPCA, participants of AD had
significantly higher RI (0.69 ± 0.07) compared to participant of ED (0.65 ± 0.07) (p=0.01).
After applying Bonferroni correction for multiple comparisons, the differences in the
NPCA and TPCA remained significant, while the difference in the CRA no longer
reached statistical significance.
Table 3 shows the results obtained for retinal capillary blood flow expressed in arbitrary
units (AU) in each group. No significant differences were obtained in mean retinal flow
between participants of AD and ED in the superior and inferior hemifield (p>0.05).

11
Similarly, no significant differences were found in percent area with no blood flow in
either the superior and inferior hemifield (all p>0.05).
No significant differences in visual function were observed between the groups, with
similar results obtained for MD between the AD (-0.09 ± 1.06) and ED (-0.02 ± 1.01),
PSD between the AD (1.57 ± 0.28) and ED (1.61 ± 0.32), and the number of abnormal
point triggered on the TD and PD plots at both 5% and 1% (all p > 0.05). In the CRA,
significant correlations were observed between PSD and PSV (p=0.02) and between
PSD and EDV (p=0.04) in the AD group only (Figure 1). The difference in correlations
between AD and ED for PSD and PSV was significant (p=0.01). All other correlations
between visual function (MD and PSD) and OBF (PSV, EDV and RI) parameters were
not significant.
DISCUSSION
The mechanisms underlying the higher susceptibility of people of AD to develop POAG
are not fully understood. Several differences have been reported between people of AD
and ED with healthy eyes, including larger disc size, larger cup-to-disc ratio, thinner
corneas and slightly worse visual function. In patients with POAG, differences in both
systemic and ocular blood flow have been previously reported between patients of AD
and ED. To the best of our knowledge, this study is the first to assess differences in
ocular blood flow in healthy eyes between people of AD and ED.

12
In this study, we found significant differences between people of AD and ED in
retrobulbar parameters in two of the four arteries that were assessed after correcting for
multiple comparisons. In the TPCA, the RI was significantly higher in people of AD.
People of AD also had significantly lower EDV in the NPCA. Taken together, these
results suggest that in healthy eyes, people of AD have lower markers of ocular
circulation compared to their counterparts of ED. These differences were observed in the
absence of differences in IOP, diabetes, systemic blood pressure and heart disease
between the groups. Our results are consistent with previous studies in which reduced
ocular blood flow velocities in the retrobulbar blood vessels have been reported in
patients with POAG compared to controls; this finding has been reported in cohorts of
ED40-42 and of AD.43 In addition, Siesky et al31 reported lower blood flow values in all
retrobulbar blood vessels in POAG patients of AD compared to those of ED. Importantly,
vascular resistance in the retrobulbar blood vessels has been previously linked to visual
field loss25 and visual field progression.44 The contribution of ocular blood flow in the
retrobulbar vessels to ocular disease may therefore be different in people of AD
compared to people of ED. Specifically, the results of our study suggest that ocular
vascular health differences between people of AD and ED can also be observed in
healthy eyes and may provide a susceptibility mechanism for higher risk of certain eye
diseases including POAG for persons of AD.
In addition to ocular blood flow in the retrobulbar vessels, we assessed blood flow in the
retinal capillary beds. In this group of participants, no significant differences were
observed between the AD and ED groups for mean retinal flow velocity and for areas of
avascular space in both the superior and inferior hemifields. Reduced blood flow in the
retinal capillaries has previously been associated with the presence of visual field
13
defects,45,46 and with changes in structural parameters47 in patients with POAG. There is
also evidence of a significant positive correlation between changes in retinal capillary
blood flow and optic nerve head parameters in patients of AD, but not ED.32 In our
sample of healthy eyes, we did not observe differences within the retina between people
of AD and ED. This may suggest that the racial differences in retinal capillary blood flow
observed in POAG patients may occur secondarily to reductions in retrobulbar flow. It is
also possible, however, that alterations in retinal blood flow occur only after changes of
retinal vascular auto-regulation during the glaucomatous disease process. It is important
to note that the capillary blood flow measurements were obtained in arbitrary units.
While this is not a concern in longitudinal studies where each participant can serve as
their own control and change over time can be assessed, the use of these arbitrary units
complicates direct comparisons in cross-sectional studies such as the present study. In
this study, we also did not observe differences in OPP between the AD and ED groups.
A previous study has shown significantly higher OPP in POAG patient of AD compared
to those of ED.31 Our finding suggests that differences in OPP may not be responsible,
at least initially, for the racial differences in localized ocular blood flow previously
described in POAG.
Racette et al reported small but significant differences in visual function between people
of AD and ED with healthy eyes in the large African Descent and Glaucoma Evaluation
Study.11 This finding was observed even in participants with normal visual field tests.
While we did not replicate this finding, an interesting finding of this study is the presence
of a significant correlation between PSD and PSV in the CRA for the AD group, but not
for the ED group. In the AD group, increasingly lower PSV values were associated with
increasingly worse PSD values. A similar finding was also observed between PSD and
14
EDV in the CRA. The CRA supplies the nerve fibers that form the optic nerve and our
results suggest that blood flow in this artery may have a greater impact on visual
function in people of AD compared to people of ED, even in the absence of ophthalmic
disease. This may be a contributing pathway to the higher susceptibility of people of AD
to POAG.
While the CDI technique is widely used clinically to image several organs, it has some
limitations that need to be considered when imaging the eye. Specifically, CDI
measurements of retrobulbar vessels are generally limited to the parameters of blood
flow velocity due to a lack of reliable quantification of accurate vessels diameter. They
cannot be interpreted as blood flow values. This limitation did not influence our results
because we used the same technique in both the AD and ED groups and assessed
possible differences. Another limitation of the CDI is that measurements depend on the
position of the probe and on the Doppler angle. In this study, angle correction was
applied when needed and experienced operators obtained all measurements. Finally,
the posterior ciliary arteries are smaller than other arteries and the anatomy of these
vessels is highly variable between different individuals. Waveforms from bundles of
these vessels are used and CDI measurements in the posterior ciliary arteries have
been shown to be less reproducible than those taken in the CRA and OA. While the
racial differences we report in this study in the NPCA and TPCA may have been affected
by the anatomy of these arteries, there is no evidence to suggest racial differences in the
anatomy of these arteries and good quality measurements were obtained in both groups.

15
HRF is a safe, noninvasive technique that overall yields valid and reproducible
measurements of retinal blood flow. HRF measurements of mean retinal flow (not
percent of avascular area) are, however, affected by the pigmentation of the RPE. The
RPE pigmentation between people of AD and ED is different and this likely affected the
amount of absorption and reflectance of laser lights. This limits the comparisons of the
mean retinal flow between the AD and ED groups. In the present study, we did not
identify significant racial differences in mean retinal flow. It is possible that these
differences exist and were not observed because of the impact of different RPE
pigmentation between the two groups. It is also possible that these differences were not
observed due to the relatively small sample size. This pilot study was, to our knowledge,
the first to assess racial differences in ocular blood flow. As a result, we were not able to
obtain estimates of effect size or variability from the literature to determine the sample
size needed to detect differences between the groups. It should be noted that while our
sample size was sufficiently large to detect differences in retrobulbar blood flow between
the groups. This is particularly notable given the fact that all participants had normal
eyes, with all expected results to be in the normal range with relatively small differences
between the groups. The results of this pilot study will allow others to generate effect
size and variability estimates to design adequately powered studies in the future.
One limitation of the present study is that race was determined based on self-report,
which may be subjective. Previous studies, however, have shown that self-reported race
correlates well with racial determination based on more objective genetic admixture
techniques.48 Furthermore, a recent study has concluded that defining race with
biogeographic ancestry did not improve the associations between race and phenotypic
variations in ocular features compared to using self-report.49 A second limitation of this

16
study is that we included participants with systemic hypertension, as long as their blood
pressure was controlled to 140/90 or better. While it is possible that ocular blood flow
measurements were affected by the presence of systemic hypertension or by the
medications used to control it, a similar percentage of AD (17%) and ED (24%)
participants had hypertension (p>0.05). Systemic hypertension therefore affected both
groups similarly. A third limitation is that the participants included in this study were on
average slightly younger than what might be expected in a glaucomatous population as
a whole. Finally, while not a limitation per se, we recognize that several studies have
shown that people of AD have thinner corneas than people of ED. No significant
differences in CCT between people of AD and ED were observed in our sample. A
closer inspection of the results, however, shows a small trend towards lower CCT in
people of AD, with lower median CCT in people of AD (555.2) compared to people of ED
(558.0), as would be expected based on previous findings reported in the literature.
Overall, the results of this study suggest the presence of differences in blood flow in
retrobulbar vessels even in healthy eyes between people of AD and ED. These
differences may contribute to the susceptibility of people of AD to develop POAG
compared to people of ED. We also found that in people of AD with healthy eyes,
increasingly lower blood velocity in the artery perfusing the anterior retina correlated with
increasingly worse visual field outcomes. This suggests that changes in the retinal blood
supply may have a larger impact on visual function in people of AD compared to people
of ED. Future studies are needed to determine the impact of ocular blood flow in POAG
in people of AD and to specifically identify how vascular differences contribute to the
development and progression of glaucoma.

17
ACKNOWLEDGEMENTS
This study was supported in part by: Biomedical Research Grant from Indiana University
School of Medicine (LR); Indiana University–Purdue University Indianapolis Enhanced
Mentoring Program with Opportunities for Ways to Excel in Research (EMPOWER)
award (LR); and by an unrestricted grant from Research to Prevent Blindness.

18
REFERENCES
1. WeinrebRN,KhawPT.Primaryopen‐angleglaucoma.Lancet2004;363:1711‐1720.2. QuigleyHA.Numberofpeoplewithglaucomaworldwide.BrJOphthalmol1996;80:389‐393.3. GirkinCA.Primaryopen‐angleglaucomainAfricanAmericans.IntOphthalmolClin2004;44:43‐60.4. RacetteL,WilsonMR,ZangwillLM,etal.Primaryopen‐angleglaucomainblacks:areview.SurvOphthalmol2003;48:295‐313.5. QuigleyHA,VitaleS.Modelsofopen‐angleglaucomaprevalenceandincidenceintheUnitedStates.InvestOphthalmolVisSci1997;38:83‐91.6. SommerA,TielschJM,KatzJ,etal.Racialdifferencesinthecause‐specificprevalenceofblindnessineastBaltimore.NEnglJMed1991;325:1412‐1417.7. GirkinCA,SamplePA,LiebmannJM,etal.AfricanDescentandGlaucomaEvaluationStudy(ADAGES):II.Ancestrydifferencesinopticdisc,retinalnervefiberlayer,andmacularstructureinhealthysubjects.ArchOphthalmol2010;128:541‐550.8. RacetteL,BodenC,KleinhandlerSL,etal.Differencesinvisualfunctionandopticnervestructurebetweenhealthyeyesofblacksandwhites.ArchOphthalmol2005;123:1547‐1553.9. VarmaR,TielschJM,QuigleyHA,etal.Race‐,age‐,gender‐,andrefractiveerror‐relateddifferencesinthenormalopticdisc.ArchOphthalmol1994;112:1068‐1076.10. ZangwillLM,WeinrebRN,BerryCC,etal.Racialdifferencesinopticdisctopography:baselineresultsfromtheconfocalscanninglaserophthalmoscopyancillarystudytotheocularhypertensiontreatmentstudy.ArchOphthalmol2004;122:22‐28.11. RacetteL,LiebmannJM,GirkinCA,etal.AfricanDescentandGlaucomaEvaluationStudy(ADAGES):III.Ancestrydifferencesinvisualfunctioninhealthyeyes.ArchOphthalmol2010;128:551‐559.12. MenkeA,CasagrandeS,GeissL,etal.PrevalenceofandTrendsinDiabetesAmongAdultsintheUnitedStates,1988‐2012.JAMA2015;314:1021‐1029.13. GoAS,MozaffarianD,RogerVL,etal.Heartdiseaseandstrokestatistics‐‐2014update:areportfromtheAmericanHeartAssociation.Circulation2014;129:e28‐e292.14. BonomiL,MarchiniG,MarraffaM,etal.Vascularriskfactorsforprimaryopenangleglaucoma:theEgna‐NeumarktStudy.Ophthalmology2000;107:1287‐1293.15. MooreD,HarrisA,WudunnD,etal.Dysfunctionalregulationofocularbloodflow:Ariskfactorforglaucoma?ClinOphthalmol2008;2:849‐861.16. TielschJM,KatzJ,SommerA,etal.Hypertension,perfusionpressure,andprimaryopen‐angleglaucoma.Apopulation‐basedassessment.ArchOphthalmol1995;113:216‐221.17. ChungHS,HarrisA,KagemannL,etal.Peripapillaryretinalbloodflowinnormaltensionglaucoma.BrJOphthalmol1999;83:466‐469.

19
18. YinZQ,Vaegan,MillarTJ,etal.Widespreadchoroidalinsufficiencyinprimaryopen‐angleglaucoma.JGlaucoma1997;6:23‐32.19. ButtZ,McKillopG,O'BrienC,etal.MeasurementofocularbloodflowvelocityusingcolourDopplerimaginginlowtensionglaucoma.Eye1995;9:29‐33.20. GalassiF,SodiA,UcciF,etal.Ocularhaemodynamicsinglaucomaassociatedwithhighmyopia.IntOphthalmol1998;22:299‐305.21. HarrisA,SergottRC,SpaethGL,etal.ColorDoppleranalysisofocularvesselbloodvelocityinnormal‐tensionglaucoma.AmJOphthalmol1994;118:642‐649.22. RojanapongpunP,DranceSM,MorrisonBJ.Ophthalmicarteryflowvelocityinglaucomatousandnormalsubjects.BrJOphthalmol1993;77:25‐29.23. BreilP,KrummenauerF,SchmitzS,etal.Therelationshipbetweenretrobulbarbloodflowvelocityandglaucomadamage.Anintraindividualcomparison.Ophthalmologe2002;99:613‐616.24. ChungHS,HarrisA,EvansDW,etal.Vascularaspectsinthepathophysiologyofglaucomatousopticneuropathy.SurvOphthalmol1999;43Suppl1:S43‐50.25. GalassiF,SodiA,UcciF,etal.Ocularhemodynamicsandglaucomaprognosis:acolorDopplerimagingstudy.ArchOphthalmol2003;121:1711‐1715.26. HayrehSS,ZimmermanMB,PodhajskyP,etal.Nocturnalarterialhypotensionanditsroleinopticnerveheadandocularischemicdisorders.AmJOphthalmol1994;117:603‐624.27. DranceS,AndersonDR,SchulzerM,etal.Riskfactorsforprogressionofvisualfieldabnormalitiesinnormal‐tensionglaucoma.AmJOphthalmol2001;131:699‐708.28. LeskeMC,WuSY,NemesureB,etal.Incidentopen‐angleglaucomaandbloodpressure.ArchOphthalmol2002;120:954‐959.29. QuigleyHA,WestSK,RodriguezJ,etal.Theprevalenceofglaucomainapopulation‐basedstudyofHispanicsubjects:ProyectoVER.ArchOphthalmol2001;119:1819‐1826.30. FerdinandKC.Cardiovasculardiseaseinblacks:canwestoptheclock?JClinHypertens2008;10:382‐389.31. SieskyB,HarrisA,RacetteL,etal.DifferencesinocularbloodflowinglaucomabetweenpatientsofAfricanandEuropeandescent.JGlaucoma2015;24:117‐121.32. KanakamedalaP,HarrisA,SieskyB,etal.OpticnerveheadmorphologyinglaucomapatientsofAfricandescentisstronglycorrelatedtoretinalbloodflow.BrJOphthalmol2014;98:1551‐1554.33. EhrlichR,HarrisA,SieskyBA,etal.RepeatabilityofretrobulbarbloodflowvelocitymeasuredusingcolorDopplerimagingintheIndianapolisGlaucomaProgressionStudy.JGlaucoma2011;20:540‐547.34. WilliamsonTH,HarrisA.ColorDopplerultrasoundimagingoftheeyeandorbit.SurvOphthalmol1996;40:255‐267.35. Jonescu‐CuypersCP,HarrisA,WilsonR,etal.ReproducibilityoftheHeidelbergretinalflowmeterindetermininglowperfusionareasinperipapillaryretina.BrJOphthalmol2004;88:1266‐1269.36. KagemannL,HarrisA,ChungHS,etal.Heidelbergretinalflowmetry:factorsaffectingbloodflowmeasurement.BrJOphthalmol1998;82:131‐136.

20
37. HoskingSL,EmbletonS,KagemannL,etal.DetectorsensitivityinfluencesbloodflowsamplinginscanninglaserDopplerflowmetry.GraefesArchClinExpOphthalmol2001;239:407‐410.38. KagemannL,HarrisA,ChungH,etal.Photodetectorsensitivitylevelandheidelbergretinaflowmetermeasurementsinhumans.InvestOphthalmolVisSci2001;42:354‐357.39. Jonescu‐CuypersCP,HarrisA,Bartz‐SchmidtKU,etal.ReproducibilityofcircadianretinalandopticnerveheadbloodflowmeasurementsbyHeidelbergretinaflowmetry.BrJOphthalmol2004;88:348‐353.40. AkarsuC,BilgiliMY.ColorDopplerimaginginocularhypertensionandopen‐angleglaucoma.GraefesArchClinExpOphthalmol2004;242:125‐129.41. ChiouHJ,ChouYH,LiuCJ,etal.EvaluationofoculararterialchangesinglaucomawithcolorDopplerultrasonography.JUltrasoundMed1999;18:295‐302.42. NicolelaMT,WalmanBE,BuckleyAR,etal.Ocularhypertensionandprimaryopen‐angleglaucoma:acomparativestudyoftheirretrobulbarbloodflowvelocity.JGlaucoma1996;5:308‐310.43. AdeyinkaOO,OlugbengaA,HelenOO,etal.Ocularbloodflowvelocityinprimaryopenangleglaucoma‐‐atropicalAfricanpopulationstudy.MiddleEastAfrJOphthalmol2013;20:174‐178.44. MartinezA,SanchezM.PredictivevalueofcolourDopplerimaginginaprospectivestudyofvisualfieldprogressioninprimaryopen‐angleglaucoma.ActaOphthalmolScand2005;83:716‐722.45. BenSimonGJ,MorozI,GoldenfeldM,etal.ScanninglaserDopplerflowmetryofnonperfusedregionsoftheopticnerveheadinpatientswithglaucoma.OphthalmicSurgLasersImaging2003;34:245‐250.46. CiancagliniM,CarpinetoP,CostagliolaC,etal.Perfusionoftheopticnerveheadandvisualfielddamageinglaucomatouspatients.GraefesArchClinExpOphthalmol2001;239:549‐555.47. HafezAS,BizzarroRL,LeskMR.Evaluationofopticnerveheadandperipapillaryretinalbloodflowinglaucomapatients,ocularhypertensives,andnormalsubjects.AmJOphthalmol2003;136:1022‐1031.48. RosenbergNA,PritchardJK,WeberJL,etal.Geneticstructureofhumanpopulations.Science2002;298:2381‐2385.49. GirkinCA,NievergeltCM,KuoJZ,etal.BiogeographicAncestryintheAfricanDescentandGlaucomaEvaluationStudy(ADAGES):AssociationWithCornealandOpticNerveStructure.InvestOphthalmolVisSci2015;56:2043‐2049.

21
FIGURE LEGEND
Figure 1. The association between pattern standard deviation (PSD) and peak systolic
velocity (PSV) is shown in Panel A. A significant correlation was observed in
the AD group (r=-0.46; p=0.02) but not in the ED group (r=0.26; p=0.14). The
difference between these correlations was significant (p=0.01). The
association between pattern standard deviation (PSD) and end diastolic
velocity (EDV) is shown in Panel B. A significant correlation was observed in
the AD group (r=-0.42; p=0.04) but not in the ED group (r=0.09; p=0.62). The
difference between these correlations was not significant (p=0.06).