Embed Size (px)
Citation preview

Accepted Manuscript
Differences in magnitude and spatial extent of impact of tuna farming onbenthic macroinvertebrate assemblages
Marija Mangion, Joseph A. Borg, Pablo Sanchez-Jerez
PII: S2352-4855(17)30083-XDOI: https://doi.org/10.1016/j.rsma.2017.10.008Reference: RSMA 309
To appear in: Regional Studies in Marine Science
Received date : 12 March 2017Revised date : 29 September 2017Accepted date : 13 October 2017
Please cite this article as: Mangion M., Borg J.A., Sanchez-Jerez P., Differences in magnitude andspatial extent of impact of tuna farming on benthic macroinvertebrate assemblages. RegionalStudies in Marine Science (2017), https://doi.org/10.1016/j.rsma.2017.10.008
This is a PDF file of an unedited manuscript that has been accepted for publication. As a service toour customers we are providing this early version of the manuscript. The manuscript will undergocopyediting, typesetting, and review of the resulting proof before it is published in its final form.Please note that during the production process errors may be discovered which could affect thecontent, and all legal disclaimers that apply to the journal pertain.
brought to you by COREView metadata, citation and similar papers at core.ac.uk
provided by Repositorio Institucional de la Universidad de Alicante

1
Differences in magnitude and spatial extent of impact of tuna farming on benthic
macroinvertebrate assemblages
Mangion Marijaa, *, Borg Joseph A.a, 1, and Sanchez-Jerez Pablob, 2
a Department of Biology, Faculty of Science, University of Malta, Msida MSD 2080
Malta
b Department of Marine Science and Applied Biology, University of Alicante, Science
Building 5, PO BOX 99, 03080 Alicante, Spain
*Corresponding author. Tel: +35679869262. E-mail address:
1 E-mail address: [email protected]
2 E-mail address: [email protected]
Abstract
Differences in magnitude and spatial extent of impact of three tuna farms located in
Malta on polychaete and amphipod assemblages associated with soft sediment habitat
were assessed using a hierarchical spatial design that incorporated different spatial scales,
from tens of meters to a few kilometers. Spatial variation in impact was significant at the
scale of location, at which farm size and local environmental factors differed. The
magnitude of impact was higher at the larger farm, as indicated by elevated levels of
sediment fish bone content, significantly lower number of polychaete families, and the

2
‘Poor’ ecological quality status recorded for the seabed area occupied by the cages. The
influence of tuna farming activities on the benthic macroinvertebrate assemblages
extended up to c. 1 km away from the cages, possibly due to transportation of particulate
organic waste there via sea currents.
Keywords: Mediterranean Sea; Tuna farming; Environmental impact; Aquaculture;
Benthic assemblages; Spatial variability1
1. Introduction
Farming of Atlantic bluefin tuna (Thunnus thynnus thynnus Linnaeus 1758) is a large
sector of the aquaculture industry, which however has raised concerns on sustainability
(see review by Metian et al., 2014). Atlantic Bluefin Tuna (ABT) is captured in the
Mediterranean from the wild and transferred to cages for fattening (FAO, 2005-2011)
using whole bait fish as feed (Aguado et al., 2004; Vita and Marin, 2007). The uneaten
feed-fish that accumulate below the tuna cages are the main source of pollution of the
seabed (Aguado-Giménez et al., 2006; Mangion et al., 2014; Vita and Marin, 2007). The
1 After (Af); Atlantic Bluefin Tuna (ABT); Before/After (BA); Before (Be); Biota and/or
environment matching (BIOENV); Ecological Quality Status (EQS); Impacted (Im); Location (Lo);
Northeastern farm (NEF); Number of families (NoF); Percent feed-fish bone content (PFBC); Percent
organic carbon content (POCC); Percent organic nitrogen content (PONC); Permutational analysis of
variance (PERMANOVA); Plot (Pl); BOPA Fish farming (BOPA-FF) index; Reference (Re); Shannon
Wiener diversity (ShW); Site (Si); Southeastern Farm 1 (SEF 1); Southeastern Farm 2 (SEF 2)

3
tuna are farmed at high stocking densities, which entail high feed input; however, these
vary between different farms. As a result, one would expect differences in the level of
adverse environmental impact, when present, between different farms. Potential adverse
impacts of tuna farming on the seabed may be reduced or eliminated when the cages are
located in exposed sites characterised by deep waters, where strong bottom currents
prevail (Maldonado et al., 2005).
Several studies have addressed the environmental effects of tuna farming in the
Mediterranean, including the potential adverse effects of ABT farming on nutrient levels
in the water column and sediment (Aksu et al., 2010; Dal Zotto et al., 2016; Marin et al.,
2007; Matijević et al., 2006, 2008; Vita et al, 2004; Vita and Marin, 2007; Vezzulli et al.,
2008), and microbial levels in the water column (Kapetanović et al., 2013). Other studies
assessed the indirect effects of the ABT penning industry via the use of diesel fuel
(Hospido and Tyedmers, 2005), impact of ABT farming on Posidonia oceanica meadows
(Kružić et al., 2014), wild fish assemblages associated with the tuna pens (Šegvić Bubić
et al., 2011), and effects of ABT farming on trophic food-web linkages (Forrestal et al.,
2012). Several studies on the influence of the activity on benthic macroinvertebrate
assemblages in the vicinity of the tuna pens have also been published (Jahani et al., 2012;
Mangion et al., 2014, in press; Marin et al., 2007; Moraitis et al., 2013; Vezzulli et al.,
2008; Vita and Marin, 2007). A comparison of the benthic impacts of ABT farming with
those of other Mediterranean farming activities, namely sea bass and sea bream rearing,
is available in San-Lázaro and Marin (2008).

4
Different conclusions have been reached on the level and spatial extent of adverse effects
of fish farming on the seabed because the experimental design, method, and indicators
used, as well as local environmental factors, vary widely between different study sites
(Kalantzi and Karakassis, 2006). To properly address the environmental impact of ABT
farming on benthic habitat, it is desirable to include multiple spatial scales in the
sampling design (Wiens, 1989). Determination of appropriate spatial scales at which
potential environmental impacts of aquaculture may be investigated is necessary to
enable proper assessment of patterns of variation in the influence of the activity on the
marine environment (Fernandez-Gonzalez et al., 2013). Several studies have assessed
patterns of variation in the influence of fish farming on benthic habitat at a number of
spatial scales (e.g. Gyllenhammar and Håkanson, 2005; Fernandez-Gonzalez et al.,
2013), but in the case of tuna farming this aspect has not been given sufficient attention
(but see Moraitis et al., 2013; Vita and Marin, 2007).
The use of polychaetes (e.g. Aguado-Giménez et al., 2015; Mangion et al., in press;
Martinez-Garcia et al., 2013; Sutherland et al., 2007; Tomassetti and Porrello, 2005) and
amphipods (e.g. Fernandez-Gonzalez et al., 2013; Fernandez-Gonzalez and Sanchez-
Jerez, 2011; Mangion et al., in press) as biological indicators of fish farming impacts on
benthic habitat is well known. The polychaete/amphipod (BOPA) ratio is a benthic index
developed for the European Water Framework Directive (WFD, 2000/60/EC) (Dauvin
and Ruellet, 2007; Gomez-Gesteira and Dauvin, 2000), that has also been used to classify
coastal waters under the influence of fish farming activities (e.g. Aguado-Giménez et al.,
2015; Jahani et al., 2012; Mangion et al., in press) into ‘High’, ‘Good’, ‘Moderate’,

5
‘Poor’, or ‘Bad’ Ecological Quality Status (EQS) classes (Dauvin and Ruellet, 2007;
Gomez-Gesteira and Dauvin, 2000). The BOPA index uses frequency data and the
proportion of organisms in each category, which render it independent of sampling
protocols that utilize different mesh sizes and measurements used to express the
abundance of organisms per unit area. Another major advantage of the BOPA index is the
reduced taxonomic effort required to assess the ecological quality status (EQS) of the
marine environment. The BOPA index has been applied to measure the impact of various
environmental disturbances, and has been shown to be effective in detecting the presence
of hydrocarbons (Dauvin and Ruellet, 2007; Gomez-Gesteira and Dauvin, 2000) and
sewage discharges (de-la-Ossa-Carretero et al., 2009) in certain zones, such as oyster
culture areas (Bouchet and Sauriau, 2008) and harbors (Ingole et al., 2009). However,
BOPA tends to overestimate the EQS compared to other benthic indices (see de-la-Ossa-
Carretero and Dauvin, 2010). A modification of the BOPA index was proposed by
Aguado-Giménez et al. (2015) to improve its performance in Mediterranean areas
affected by fish farming activities.
The main aim of the present study was to assess the magnitude and spatial extent of tuna
farming on soft bottom polychaete and amphipod assemblages using a hierarchical spatial
design; from tens of meters to a few kilometers, using abundance of three selected
indicator taxa, total number of taxa and Shannon-Wiener diversity of the polychaete and
amphipod taxa, and the fish farm polychaete/amphipod index (as modified by Aguado-
Giménez et al., 2015). In the present study, the hypothesis that particulate organic matter
originating from the tuna cages and settling to the seabed leads to changes in the

6
invertebrate assemblages associated with the soft bottom habitat was tested using data on
sediment physico-chemical attributes, namely w/w feed-fish bone content (PFBC); which
represents the uneaten feed-fish that decomposed on the seabed; mean sediment grain
size (MSGS), percent organic carbon content (POCC), and percent organic nitrogen
content (PONC). Three tuna farms located in the Maltese Islands and differing in size,
stocking density and feed management regime, were used in the present assessment.
2. Materials and Methods
2.1. Study sites and sampling
The three Maltese tuna farms considered in the present study are located 1 km offshore
(Figure 1) where the seabed consists of soft sediment. One farm is located off the
northeastern coast, where water depth is some 45 m – 50 m, while the other two farms are
located off the southeastern coast where water depth is some 42 m – 53 m, and are some
1.5 km apart. The northeastern farm (NEF) had eight tuna cages having a maximum total
annual capacity of 2500 t, while the two southeastern farms were smaller (maximum total
annual capacity of 1500 t each); one having three cages (southeastern Farm 1 [SEF 1])
and the other (southeastern Farm 2 [SEF 2]) having four cages (ICCAT, 2011). All three
farms utilize cages having a diameter of some 50 m and a height of around 25 m. The
tuna stocking density was circa 100 + 200 t per cage, and the fish were fed the equivalent
of 3-4% of the fish biomass per day, divided over two feeding sessions (tuna farm

7
managers, personal communication). The feed consisted of whole bait fish; namely
mackerel, sardines, squid and prawn; and the ratio of food (based on the wet weight of
the feed) that is converted to tuna biomass is around 10-15:1 (tuna farm managers,
personal communication). However, the feeding regime is expected to differ between the
different farms as a result of adaptive management to natural environmental factors (e.g.
sea current strength), and depending on the growth rate of the tuna.
The sampling design incorporated three fixed, orthogonal, factors: (a) Before/After (BA),
with two sampling periods, (i) in November 2000 at NEF, in October 2002 at SEF 1, and
in June 2001 at SEF 2 ‘before’ initiation of the tuna farming activities, and (ii) in
November 2001 at NEF, in October 2003 at SEF 1, and in June 2002 at SEF 2, ‘after’
initiation of the activity; (b) Location (Lo), with three farms (i) NEF, (ii) SEF 1, and (iii)
SEF 2; and (c) Plot (Pl), measuring some 300 m by 500 m, with two treatments: (i)
‘impacted’ plot; i.e. the seabed area where the tuna cages were sited, and (ii) ‘reference’
plot, located some 1 km – 1.5 km away from the cages. A random factor ‘Site’ (Si) was
nested within the ‘BA x Lo x Pl’ interaction, with sites separated at the scale of hundreds
of meters. Three sampling sites were allotted to each level of the three-way interaction, as
the minimum number of cages at any one of the farms was three, such that a total of
eighteen sampling sites are included in the sampling design.
Sampling was carried out using a 0.1 m2 van Veen grab. Three replicate grab samples for
benthic macrofaunal studies and one grab sample for sediment physico-chemical studies
were collected at each of the eighteen sampling sites. The collected samples were live-

8
sieved (0.5 mm mesh) on board the vessel and afterward temporarily preserved in 10%
formalin.
In the laboratory, samples for faunal studies were sorted for polychaetes and amphipods
after washing on a 0.5 mm mesh. Specimens were identified to the family level (see
Karakassis and Hatziyanni, 2000; Olsgard and Somerfield, 2000) and enumerated to
obtain estimates of number of families and abundance per grab sample. For sediment
physico-chemical studies, sub-samples were frozen at -20°C for later analyses to
determine the POCC, PONC and PFBC, while another sub-sample was oven dried for
granulometric analysis. Analysis of the sediment to determine the PFBC was carried out
by sorting fish bones from the sediment using forceps under a dissecting microscope.
POCC in the sediment was determined by wet oxidation using a chromic acid-sulfuric
acid mixture, and titration of the evolved carbon dioxide (see Walkley and Black, 1934).
PONC in the sediment was determined by the Kjeldhal method, i.e. by digestion in
concentrated sulfuric acid containing a copper sulfate catalyst, addition of excess strong
alkali, and condensation of the ammonia given off for titration. Measurement of MSGS
was carried out according to Buchanan (1984) (see Holme and McIntyre, 1984).
Unpublished data on sea current direction and velocity collected every three months
during the period 2010 to 2017 at the northeastern and southeastern farm sites at water
depths of between 1 m and 10 m, using drogues according to the Lagrange method, were
obtained from Ecoserv Ltd.

9
2.2. Data analyses
Indicator taxa at family level were selected as the three most abundant (in terms of
number of individuals) macroinvertebrates (see Morrisey et al., 1992) before tuna
farming activities were initiated. The polychaete/amphipod (BOPA-Fish farming [BOPA-
FF]) index was calculated using BOPA = log ((fP / fA +1) +1 ); where ‘fP’ is the
frequency of polychaetes tolerant to organic enrichment resulting from fish farming
activities, as identified by Martinez-Garcia et al. (2013) (see Aguado-Giménez et al.,
2015), and ‘fA’ is the frequency of amphipod individuals excluding the genus Jassa
(Dauvin and Ruellet, 2007). Boundary values between ‘High’ (0.00 > x > 0.09), ‘Good’
(0.09 > x > 0.16), ‘Moderate’ (0.16 > x > 0.25), ‘Poor’ (0.25 > x > 0.30), and ‘Bad’ (>
0.30) EQS classes are as given in Dauvin and Ruellet (2007).
Four-factor univariate permutational analysis of variance (PERMANOVA) (Anderson,
2001) was used (with α set at 0.05) on a Euclidean similarity matrix to test the hypothesis
of no difference in tuna farming activities between different farms in terms of (i)
abundance of selected indicator taxa Maldanidae, Paraonidae and Glyceridae
(polychaetes), and of Lysianassidae, Phoxocephalidae and Urothoidae (amphipods), (ii)
number and Shannon-Wiener diversity of polychaete and amphipod families (Morrisey et
al., 1992), and (iii) polychaete/amphipod (BOPA-FF) index as defined by Aguado-
Giménez et al. (2015). Separate univariate PERMANOVA was carried out (with α set at
0.05) using a Euclidean similarity matrix to test the hypothesis of no difference in tuna
farming activities between different farms in terms of the sediment MSGS, POCC and

10
PONC, using a model with three fixed, orthogonal factors ‘BA’, ‘Lo’ and ‘Pl’, and
treating the levels of ‘Si’ as replicates. When the PERMANOVA indicated a significant
difference, the source of significant difference was identified for the highest interaction
term using a posteriori pair-wise tests. To determine which sediment physico-chemical
variable, or combination of variables, best explained the observed variation in the
macroinvertebrate assemblages, the BEST routine of the biota and/or environment
matching (BIOENV) analysis (Clarke and Gorley, 2006) was carried out, using the
Spearman rank correlation method and D1 Euclidean similarity measure, at the level of
the 2-way interaction terms, as the number of replicates at the level of ‘BA x Lo x Pl’
was too low. All the analyses were implemented using PRIMER v.7.0.11 (PRIMER
software; Clarke and Gorley, 2006) and the PERMANOVA+ v.1.0 add-on package
(Anderson et al., 2008).
3. Results
3.1. Macroinvertebrate data
A total of 5,750 individuals from 26 polychaete families, and 2,103 individuals from 22
amphipod families, were collected. The top families (in terms of number of individuals)
that characterised the polychaete and amphipod assemblages at the three tuna farms
before farming activities commenced were: Maldanidae, Paraonidae and Glyceridae
(polychaetes), and Lysianassidae, Phoxocephalidae and Urothoidae (amphipods) (Figure
2).

11
PERMANOVA indicated no significant difference for the interaction term ‘BA x Lo x
Pl’ in the abundance of polychaetes and amphipods, while ‘BA x Lo’ was significant for
abundance of Glyceridae (p < 0.05) and Urothoidae (p < 0.01), ‘BA x Pl’ was significant
for abundance of Urothoidae (p < 0.001), and ‘Pl x Lo’ was significant for abundance of
Maldanidae (p < 0.05), Glyceridae (p < 0.01), Urothoidae (p < 0.001) and
Phoxocephalidae (p < 0.01) (Table 1). Pair-wise tests showed that the abundance of
Glyceridae recorded from the NEF impacted/reference plots increased significantly (p <
0.05) following the tuna farming activities, while the abundance of Urothoidae (p < 0.01)
and Phoxocephalidae (p < 0.001) was significantly low at the NEF impacted plot
compared to the NEF reference plot before/after the tuna farming activities (Table 1,
Figure 2). At the southeastern farms, the abundance of Urothoidae recorded from the
impacted/reference plots decreased significantly (p SEF 1 < 0.05, p SEF 2 < 0.001) following
the tuna farming activities. The abundance of Phoxocephalidae was significantly high (p
< 0.05) at the SEF 1 impacted plot compared to the SEF 1 reference plot, while the
abundance of Glyceridae (p < 0.05), Urothoidae (p < 0.05) and Phoxocephalidae (p <
0.001) was significantly high at the SEF 2 impacted plot compared to the SEF 2 reference
plot, before/after the tuna farming activities (Table 1, Figure 2).
PERMANOVA indicated a significant difference in the abundance of Lysianassidae for
‘BA’ (p < 0.05), and in the abundance of Paraonidae for ‘Lo’ (p < 0.05) (Table 1). Pair-
wise tests showed that the overall abundance of Lysianassidae decreased significantly (p
< 0.05) following initiation of tuna farming, while the overall abundance of Paraonidae
was significantly high (p < 0.05) at SEF 1 compared to NEF and SEF 2 (Table 1, Figure

12
2). PERMANOVA also indicated a significant difference in the abundance of Maldanidae
(p < 0.001), Paraonidae (p < 0.05), Lysianassidae (p < 0.05) and Urothoidae (p < 0.01)
for ‘Si(BA x Lo x Pl)’ (Table 1).
PERMANOVA indicated a significant difference in the Shannon-Wiener diversity of
polychaetes (p < 0.01), number of amphipod families (p < 0.05), and Shannon-Wiener
diversity of amphipods (p < 0.001) for the interaction term ‘BA x Lo x Pl’ (Table 1).
Pair-wise tests showed that, following initiation of the tuna farming activities, the
Shannon-Wiener diversity of polychaetes (p < 0.001), number of amphipod families (p <
0.01), and Shannon-Wiener diversity of amphipods (p < 0.01) recorded at the NEF
impacted plot, decreased significantly (Table 1, Figure 3). The number of amphipod
families at the SEF 2 impacted (p < 0.05) and reference plots (p < 0.01), and the
Shannon-Wiener diversity of amphipods at the SEF 2 reference plot (p < 0.05), decreased
significantly in the same period (Table 1, Figure 3).
PERMANOVA indicated significant differences in the number of polychaete families for
‘BA’ (p < 0.05), ‘Lo’ (p < 0.001) and ‘Pl’ (p < 0.01) (Table 1). Pair-wise tests showed
that the overall number of polychaete families decreased significantly (p < 0.05)
following the tuna farming activities, and was significantly low (p < 0.001) at NEF
compared to SEF 1 and SEF 2, and at the impacted plots compared to the reference plots
(p < 0.01) (Table 1, Figure 3). PERMANOVA also indicated a significant difference (p <
0.05) in the number of families and Shannon-Wiener diversity of polychaetes for ‘Si(BA
x Lo x Pl)’ (Table 1).

13
PERMANOVA indicated a significant difference in BOPA-FF for the interaction term
‘BA x Lo x Pl’ (p < 0.01) (Table 1). Values of the mean BOPA-FF index indicated
‘High’ EQS at NEF, ‘Good’/‘High’ EQS at SEF 1, and ‘High’ EQS at SEF 2, at the
impacted and reference plots prior to the initiation of tuna farming activities (Figure 3),
and pair-wise tests indicated no significant difference in BOPA-FF in that period (Table
1). Following initiation of tuna farming activities, BOPA-FF increased significantly at the
NEF (p < 0.01) and SEF 2 (p < 0.05) at the impacted plots. The mean EQS was ‘Poor’ at
the NEF impacted plot and ‘High’ at the NEF reference plot, while the pair-wise tests
showed that BOPA-FF was significantly high (p < 0.001) at the NEF impacted plot
compared to the NEF reference plot in the same period. There was no significant
difference in BOPA-FF between the mean ‘Moderate’ and ‘Good’ EQS recorded
respectively at the SEF 1 impacted and reference plots following tuna farming, nor
between the mean ‘Good’ and ‘Moderate’ EQS recorded respectively at the SEF 2
impacted and reference plots in the same period. Pair-wise tests showed that BOPA-FF
was significantly high (p SEF 1 < 0.05, p SEF 2 < 0.001) at the NEF impacted plot compared
to the two southeastern farms’ impacted plots following the farming activities. No
significant difference in BOPA-FF was detected between the two southeastern farms’
impacted plots in the same period (Table 1, Figure 3).

14
3.2. Sediment physico-chemical data
The sediment PFBC recorded below fish cages following the tuna farming activities was
higher at the NEF (2.33% + 3.12%) compared to the two southeastern farms, and higher
at SEF 1 (1.59% + 2.66%) compared to SEF 2 (0.04% + 0.06%).
PERMANOVA indicated a significant difference in sediment POCC and PONC for ‘BA
x Lo x Pl’ (p < 0.05) (Table 2). Pair-wise tests showed that, following initiation of tuna
farming, POCC increased significantly (p < 0.05) at the NEF impacted plot (Table 2).
The general increase in POCC recorded at the SEF 1 impacted plot, and at the SEF 2
reference plot (Figure 4), was not significant. PONC increased significantly (p < 0.05) at
the SEF 1 reference plot following the tuna farming activities, and was significantly high
(p < 0.05) at the SEF 1 reference plot compared to the NEF reference plot in the same
period (Table 2). A general increase in PONC following tuna farming activities was
observed at the NEF impacted plot (Figure 4), while no significant difference was
detected for this sediment attribute at NEF from before to after initiation of tuna farming,
nor between the impacted and reference plot afterwards (Table 2).
The general trend in MSGS was similar before and after the tuna farming activities, at the
impacted and reference plots of each of the three tuna farms (Figure 4), with no
significant difference indicated for ‘BA’, ‘Lo’, and ‘Pl’; and interactions terms (Table 2).
15
3.3. Relationship between macroinvertebrates and sediment physico-chemical attributes
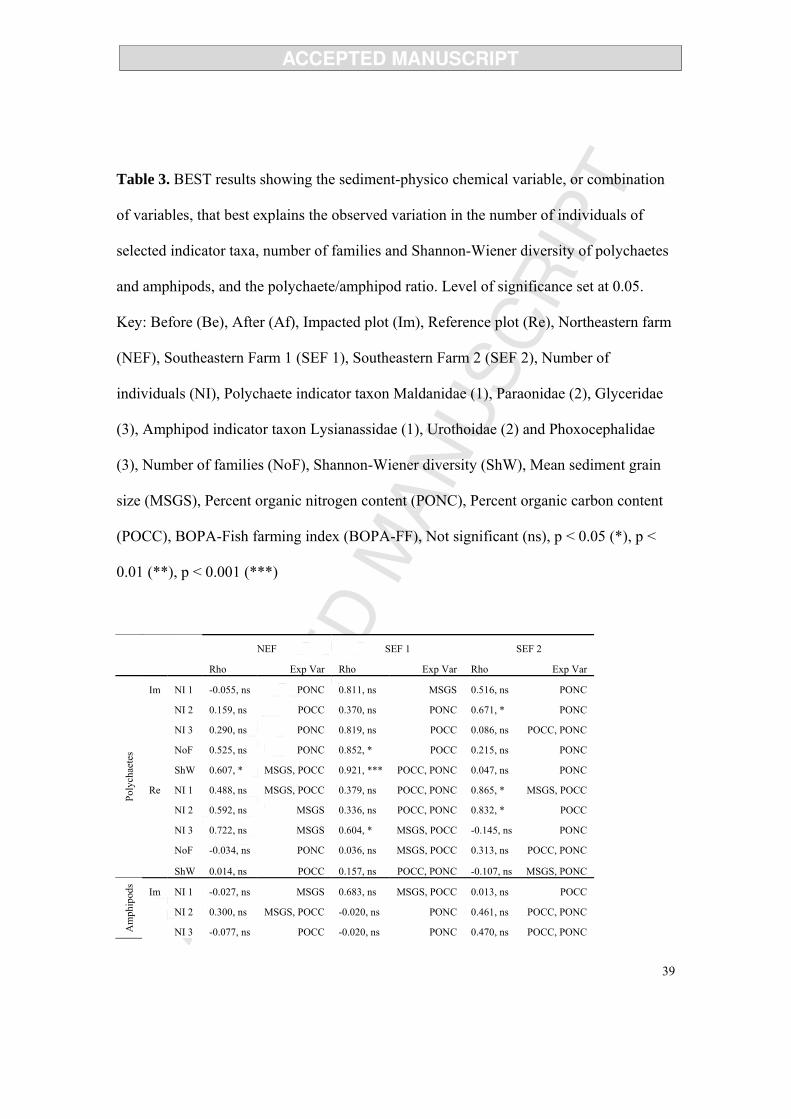
BEST analysis showed that a combination of MSGS and POCC was significantly
correlated with the Shannon-Wiener diversity of polychaetes that was recorded overall
during the study period at the NEF impacted plot (ρ = 0.607, p < 0.05), and with the
Shannon-Wiener diversity of polychaetes (ρ = 0.668, p < 0.05), number of amphipod
families (ρ = 0.613, p < 0.05), and Shannon-Wiener diversity of amphipods (ρ = 0.810, p
< 0.01) recorded overall at the NEF impacted and reference plots after the tuna farming
activities (Table 3).
At SEF 1, a significant correlation was recorded between POCC and number of
polychaete families (ρ = 0.852, p < 0.05), and between a combination of POCC and
PONC, and Shannon-Wiener diversity of polychaetes (ρ = 0.921, p < 0.001) recorded
from the impacted plot before/after the tuna farming activities. BEST analysis also
showed significant correlation between POCC, and abundance of Lysianassidae (ρ =
0.815, p < 0.05) and Shannon-Wiener diversity of amphipods (ρ = 0.871, p < 0.01)
recorded overall from the SEF 1 impacted/reference plots after tuna farming; between a
combination of MSGS and POCC, and abundance of Glyceridae (ρ = 0.604, p < 0.05)
and the BOPA-FF index (ρ = 0.754, p < 0.05) recorded from the SEF 1 reference plot
before/after the tuna farming activities; and between PONC, and abundance of
Glyceridae recorded overall from the SEF 1 impacted/reference plots before initiation of
tuna farming (ρ = 0.931, p < 0.01) (Table 3).
16
At SEF 2, a significant correlation was recorded between PONC and abundance of
Paraonidae (ρ = 0.671, p < 0.05) recorded from the impacted plot before/after tuna
farming; between a combination of MSGS and POCC, and abundance of Lysianassidae
(ρ = 0.865, p < 0.05), and POCC and abundance of Urothoidae (ρ = 0.832, p < 0.05),
recorded from the reference plot before/after the tuna farming activities; and between
MSGS and abundance of Phoxocephalidae (ρ = 0.766, p < 0.05) recorded from the
impacted/reference plots before the tuna farming activities (Table 3).
4. Discussion
The present results show that tuna farming activities resulted in alterations to the benthic
invertebrate assemblages via accumulation of uneaten feed-fish on the seabed below the
tuna cages. Values of the biological attributes assessed in the present work varied
spatially, particularly at the scale of location (km). Previous studies at Mediterranean fish
farms recorded high spatial variation in attributes of peracarid crustacean assemblages in
the vicinity of fish cages (Fernandez-Gonzalez et al., 2013; Fernandez-Gonzalez and
Sanchez-Jerez, 2011). Consideration of spatial variation in ecological studies that utilise a
hierarchical nested design is important since the power of statistical tests is reduced (see
Morrisey, 1992) when small scale variation is larger than the variation at higher spatial
scales (e.g. Anderson et al., 2005; Chapman et al. 2010; Fernandez-Gonzalez et al., 2013;
Fraschetti et al., 2005). In the present hierarchical study design, the power of statistical
tests to detect observed differences in attributes of the benthic assemblage was increased

17
(see Morrisey, 1992) by setting location as a fixed factor, rather than as a random factor
nested within the higher scale of impacted/reference plot.
Studies at other Mediterranean tuna farms reported low diversity of benthic assemblages
below fish cages during the farming season (Jahani et al., 2012; Mangion et al., 2014;
Marin et al., 2007; Vita and Marin, 2007), and elevated values of the ratio
polychaete/amphipod abundance (BOPA) (Jahani et al., 2012). However, Moraitis et al.
(2013) found no significant influence of tuna farming on benthic assemblages in Greece,
which was attributed to exposure, hence to a high energy environment that helped
dispersal of organic matter generated at the farm. The effects of fish farm wastes on
seabed habitats are determined by local environmental characteristics, such as bottom
type, water depth, exposure, and bottom currents, as well as the farms’ feed management
regime (Borja et al., 2009; Tomassetti et al., 2009). Therefore, differences in the level and
spatial extent of potential adverse environmental impacts of tuna farming are expected
between sites having different environmental characteristics. The three tuna farms
investigated in the present study differed in size, stocking density, and feed management,
as well as in their location; hence one would expect differences in the magnitude and
spatial extent of potential adverse environmental impact among them.
Spatial variation in the influence of tuna farming on the polychaete and amphipod
assemblages was significant at the scale of location. Furthermore, the number of
polychaete families was significantly lower, and values of the polychaete/amphipod ratio
were significantly higher at the impacted plot of the northeastern farm, where a ‘Poor’
18
EQS was recorded. Concomitantly, the sediment POCC increased significantly at the
impacted plot, while levels of sediment fish bone content below fish cages at the
northeastern farm were elevated compared to the southeastern farms. In the present study,
the northeastern farm has the largest annual fish holding capacity compared to the other
two farms. Borja et al. (2009) previously reported that benthic ecological quality was
better at fish farm sites that had a lower total annual production, which is in agreement
with the present results. The sediment MSGS and POCC were significantly correlated
with the diversity of polychaete families, and with the number and diversity of amphipod
families recorded overall at the impacted plot of the northeastern farm, and at the
northeastern farm after the tuna farming activities.
The influence of tuna farming on benthic habitat at the impacted plots of the southeastern
farms was indicated by a significant decrease in the number of amphipod families, and
the significant influence of sediment POCC and PONC, on the abundance and diversity
of polychaete and amphipod families. The elevated levels of sediment PFBC below the
tuna cages of southeastern Farm 1 compared to southeastern Farm 2, and the ‘Moderate’
EQS recorded from the impacted plot of southeastern Farm 1, indicate that the influence
of tuna farming on benthic habitat present in the immediate vicinity of southeastern Farm
2, which retained ‘Good’ EQS, was not as large.
The level of tuna farming activities and feed management regime adopted at different
tuna farms resulted in different levels of impact on sediment quality between cages
within the same farm (Mangion et al., 2014), over and above the expected variation
19
between different tuna farms. Given potential high variation in biological attributes at
small spatial scales, the pattern of influence of a fish farm on benthic biota at one site
cannot be extrapolated to other farms at different sites (e.g. Fernandez-Gonzalez et al.,
2013). Fernandez-Gonzalez et al. (2013) noted that spatial variation in attributes of
benthic assemblages between different sites may be higher at fish farms compared to
reference areas; this is characteristic of stressed assemblages (e.g. Stark et al., 2003;
Warwick and Clarke, 1993). For instance, for the same farm considered in the present
study, i.e. the northeastern farm, Mangion et al. (2014) reported a significantly higher
abundance of Capitellid polychaetes below cages, which varied at the scale of site. The
present results showed that, when considering the three tuna farms, significant variation
in the abundance of polychaetes (Maldanidae, Paraonidae) and amphipods
(Lysianassidae, Urothoidae), number of polychaete families, and Shannon-Wiener
diversity of polychaetes was recorded at the scale of ‘site’, i.e. 100’s of meters.
The spatial extent of influence of fish farm waste on the marine environment will vary
(Karakassis et al., 2005) from a localised level to a regional one that may extend several
kilometres (Silvert, 1992). The influence of tuna farming on benthic habitat detected in
the present study appears to exceed the largest spatial scale incorporated in the survey
design, since some influence of the activity on macroinvertebrate assemblages was
detected c. 1 km away from the cages. Fernandez-Gonzalez et al. (2013) reported an
influence of fish farming on spatial patterns of attributes of amphipod assemblages at
spatial scales that varied from several meters to hundreds of kilometers. While a distance
of c. 1 km would appear to be sufficient to minimize the influence of fish farm wastes on

20
a reference area (Porello et al., 2005), the oligotrophic nature of the Mediterranean may
render the benthic ecosystem more sensitive to the organic input. Present results indicate
that tuna farming at southeastern Farm 2 resulted in a significant decrease in the number
of families and diversity of amphipods, and in a ‘Moderate’ EQS, at the reference plot
located c. 1 km away from the tuna cages. The orientation of the reference plot of
southeastern Farm 2 with respect to both impacted plots of the two southeastern farms,
may account for the influence of tuna farming observed there, since organic waste may
have been transported to the reference plot via sea currents; the acquired sea current data
indicated a predominantly southern current (189 o) having a mean velocity of 0.185 ms-1
in the vicinity of the two southeastern farms. It is possible that other unidentified factors
apart from the tuna farming activities may be influencing the soft bottom habitat at the
reference plot of southeastern Farm 2, although the changes recorded there are in all
probability due to the tuna farming activities, since they coincide with the onset of tuna
farming in the general area. Apart from the location and size of the farm, the magnitude
and spatial extent of tuna farming is also determined by a farm’s specific feed
management regime (Mangion et al., 2014).
5. Conclusion
The present results show that the magnitude of influence of tuna farming activities on
benthic invertebrate assemblages varies significantly among different tuna farming
locations having different farm sizes and local environmental and oceanographic factors.
The influence of tuna farming activities on benthic invertebrate assemblages was larger at

21
the impacted plot of the largest tuna farm - in terms of ABT holding capacity and
production - compared to the other two smaller farms. On the other hand, the spatial
extent of impact appeared to be largest at one of the southeastern farms (Farm 2), where
the influence of tuna farming activities extended down-current in a southerly direction,
up to some 1 km away from fish cages; this may possibly reflect an ‘additive effect’ of
the two southeastern farms, given that they are relatively close to each other (1 km apart).
Taken together, these observations corroborate the expectation that the level and extent of
influence of tuna farming activities on benthic habitat in the vicinity will be larger for
farms having higher fish stocking density. Furthermore, farms located relatively close to
one another may result in added loading on the environment, resulting in larger spatial
extent of environmental impact - this latter observation has implications for spatial
planning of tuna farming activities, particularly given that many countries are moving
toward establishing ‘allocated zones for aquaculture’ (AZA); see Sanchez-Jerez et al.
(2016). Finally, the present findings also show that inclusion of multiple reference areas
in monitoring programmes is important for assessing potential environmental impacts of
tuna farms.

22
Acknowledgment
This research study was part-funded through the Elisabeth Mann Borgese Bursary of the
International Ocean Institute, and the University of Malta’s Research Fund Committee.
References
Aguado, F., Martinez, F.J., Garcia-Garcia, B., 2004. In vivo total nitrogen and total
phosphorous digestibility in Atlantic bluefin tuna (Thunnus thynnus thynnus Linnaeus,
1758) under industrially intensive fattening conditions in Southeast Spain Mediterranean
coastal waters. Aquacult. Nutr. 10, 413-419.
Aguado-Giménez, F., Garcia-Garcia, B., Hernandez-Lorente, M.D., Cerezo-Valverde, J.,
2006. Gross metabolic waste output estimates using a nutritional approach in Atlantic
bluefin tuna (Thunnus thynnus) under intensive fattening conditions in western
Mediterranean Sea. Short Communication. Aquac. Res. 37, 1254-1258.
Aguado-Giménez, F., Gairín, J.I., Martinez-Garcia, E., Fernandez-Gonzalez, V., Ballester
Moltó, M., Cerezo-Valverde, J., Sanchez-Jerez, P., 2015. Application of "taxocene
surrogation" and "taxonomic sufficiency" concepts to fish farming environmental
monitoring. Comparison of BOPA index versus polychaete assemblage structure. Mar.
Environ. Res. 103, 27-35.

23
Aksu, M., Kaymakçi-Başaran, A., Egemen, O., 2010. Long-term monitoring of the
impact of a capture-based bluefin tuna aquaculture on water column nutrient levels in the
Eastern Aegean Sea, Turkey. Environ. Monit. Assess. 171, 681-688.
Anderson, M.J., 2001. A new method for nonparametric multivariate analysis of
variance. Austral Ecol. 26, 32-46.
Anderson, M.J., Connell, S.D., Gillanders, B.M., Diebel, C.E., Blom, W.M., Saunders,
J.E., Landers, T.J., 2005. Relationships between taxonomic resolution and spatial scales
of multivariate variation. J. Anim. Ecol. 74, 636-646.
Anderson, M.J., Gorley, R.N., Clarke, K.R., 2008. PERMANOVA+ for PRIMER: guide
to software and statistical methods. PRIMER-E, Plymouth, UK, 214 pp.
Borja, Á., Rodríguez, J.G., Black, K., Bodoy, A., Emblow, C., Fernandes, T.F., Forte, J.,
Karakassis, I., Muxika, I., Nickell, T.D., Papageorgiou, N., Pranovi, F., Sevastou, K.,
Tomassetti, P., Dror, A., 2009. Assessing the suitability of a range of benthic indices in
the evaluation of environmental impact of fin and shellfish aquaculture located in sites
across Europe. Aquaculture 293, 231-240.
Bouchet, V.M.P., Sauriau, P.-G., 2008. Influence of oyster culture practices and
environmental conditions on the ecological status of intertidal mudflats in the Pertuis
Charentais (SW France): a multi-index approach. Marine Poll. Bull. 56, 1898–1912.

24
Buchanan, J.B., 1984. Sediment analysis. In: Holme N.A. & McIntyre A.D. (eds)
Methods for the study of marine benthos. Blackwell Scientific Publications, Oxford, p
41-65.
Chapman, M.G, Tolhurst, T.J., Murphy, R. J., Underwood, A.J., 2010. Complex and
inconsistent patterns of variation in benthos, micro-algae and sediment over multiple
spatial scales. Mar. Ecol. Prog. Ser. 398, 33-47.
Clarke, K.R., Gorley, R.N., 2006. PRIMER v6: User manual/tutorial. PRIMER-E,
Plymouth, UK, 190 pp.
Dauvin, J.C., Ruellet, T., 2007. Polychaete/amphipod ratio revisited. Marine Poll. Bull.
55, 215-224.
Dal Zotto, M., Santulli, A., Simonini, R., Todaro, M. A., 2016. Organic enrichment
effects on a marine meiofauna community, with focus on Kinorhyncha. Zool Anz. 265,
127-140.
de-la-ossa Carretero, A., Dauvin, J. C., 2010. A comparison of two biotic indices, AMBI
and BOPA/BO2A, for assessing the ecological quality status (EcoQS) of benthic macro-
invertebrates. Transit. Waters Bull. 4, 12-24.
25
de-la-Ossa-Carretero, J.A., del-Pilar-Ruso, Y., Giménez-Casalduero, F., Sánchez-Lizaso,
J. L., 2009. Testing BOPA index in sewage affected soft-bottom communities in the
north-western Mediterranean. Marine Poll. Bull. 58, 332–340.
FAO, 2005-2011. National Aquaculture Sector Overview. Malta. National Aquaculture
Sector Overview Fact Sheets. Text by Vassallo-Agius, R. FAO Fisheries and Aquaculture
Department: Rome. http://www.fao.org/fishery/countrysector/naso_malta/en. Accessed
20 January 2016.
Fernandez-Gonzalez, V., Sanchez-Jerez, P., 2011. Effects of sea bass and sea bream
farming (Western Mediterranean Sea) on peracarid crustacean assemblages. Anim.
Biodiv. Conserv. 34, 179-190.
Fernandez-Gonzalez, V., Aguado-Giménez, F., Gairin, J.I., Sanchez-Jerez, P., 2013.
Exploring patterns of variation in amphipod assemblages at multiple spatial scales:
natural variability versus coastal aquaculture effect. Aquacult. Env. Interac. 3, 93-105.
Forrestal, F., Coll, M., Die, D.J., Christensen, V., 2012. Ecosystem effects of bluefin tuna
Thunnus thynnus thynnus aquaculture in the NW Mediterranean Sea. Mar. Ecol. Prog.
Ser. 456, 215-231.

26
Fraschetti, S., Terlizzi, A., Benedetti-Cecchi, L., 2005. Patterns of distribution of marine
assemblages from rocky shores: evidence of relevant scales of variation. Mar. Ecol. Prog.
Ser. 296, 12-29.
Gomez-Gesteira, L., Dauvin, J.C., 2000. Amphipods are good bioindicators of the impact
of oil spills on soft-bottom macrobenthic communities. Mar. Poll. Bull. 40, 1017-1027.
Gyllenhammar, A., Håkanson, L., 2005. Environmental consequence analyses of fish
farm emissions related to different scales and exemplified by data from the Baltic–a
review. Mar. Environ. Res. 60, 211-243.
Holme, N.A., McIntyre, A.D., 1984. Methods for the study of marine benthos. Blackwell
Scientific Publications, Oxford, p 41-65.
Hospido, A., Tyedmers, P., 2005. Life cycle environmental impacts of Spanish tuna
fisheries. Fish. Res. 76, 174-186.
ICCAT, 2011. ICCAT Record of BFT Farming Facilities.
https://www.iccat.int/en/ffb.asp. Accessed 20 January 2016.
Ingole, B., Sivadas, S., Nanajkar, M., Sautya, S., Nag, A., 2009. A comparative study of
macrobenthic community from harbours along the central west coast of India. Environ.
Monit. Assess. 154, 135-146.

27
Jahani, N., Nabavi, S.N.B., Dehghan Madiseh, S., Mortezaie, S.R.S., Fazeli, N., 2012.
The effect of marine fish cage culture on benthic communities using BOPA index in
Ghazale Creek. Iran. J. Fish. Sci. 11, 78-88.
Kalantzi, I., Karakassis, I., 2006. Benthic impacts of fish farming: meta-analysis of
community and geochemical data. Mar. Pollut. Bull. 52, 484−493.
Kapetanović, D., Dragun, Z., Vardić Smrzlić, I., Valić, D., Teskeredžić, E., 2013. The
microbial marine water quality associated with capture-based bluefin tuna aquaculture: A
case study in Adriatic Sea (Croatia). Fresen. Environ. Bull. 22, 2214-2220.
Karakassis, I., Hatziyanni, E., 2000. Benthic disturbance due to fish farming analyzed
under different levels of taxonomic resolution. Mar. Ecol. Prog. Ser. 203, 247-253.
Karakassis, I., Pitta, P., Krom, M.D., 2005. Contribution of fish farming to the nutrient
loading of the Mediterranean. Sci. Mar. 69, 313-321.
Kružić, P., Vojvodić, V., Bura-Nakić, E., 2014. Inshore capture-based tuna aquaculture
impact on Posidonia oceanica meadows in the eastern part of the Adriatic Sea. Mar.
Pollut. Bull. 86, 174-185.
28
Maldonado, M., Carmona, M.C., Echeverria, Y., Riesgo, A., 2005. The environmental
impact of Mediterranean cage fish farms at semi-exposed locations: does it need a re-
assessment? Helgoland Mar. Res. 7, 574-576.
Mangion, M., Borg, J.A., Thompson, R., Schembri, P.J., 2014. Influence of tuna penning
activities on soft bottom macrobenthic assemblages. Mar. Pollut. Bull. 79, 164-174.
Mangion, M., Borg, J.A., Schembri, P.J., Sanchez-Jerez, P., in press. Assessment of
benthic biological indicators for evaluating the environmental impact of tuna farming.
Aquac. Res.
Marin, A., Montoya, S., Vita, R., Marín-Guirao, L., Lloret, J., Aguado, F., 2007. Utility
of sea urchin embryo-larval bioassays for assessing the environmental impact of marine
fishcage farming. Aquaculture 271, 286-297.
Martinez-Garcia, E., Sanchez-Jerez, P., Aguado-Gimenez, F., Avila, P., Guerrero, A.,
Sanchez-Lizaso, J.L., Fernandez-Gonzalez, V., Gonzalez, N., Gairin, J.I., Carballeira, C.,
García-García, B., Carreras, J., Macías, J.C., Carballeira, A., Collado, C., 2013.
A meta-analysis approach to the effects of fish farming on soft-bottom polychaeta
assemblages in temperate regions. Mar. Pollut. Bull. 69, 165-171.
29
Matijević, S., Kušpilić, G., Barić, A., 2006. Impact of a fish farm on physical and
chemical properties of sediment and water column in the middle Adriatic sea. Fresen.
Environ. Bull. 15, 1058-1063.
Matijević, S., Kušpilić, G., Kljaković-Gašpić, Z., Bogner, D., 2008. Impact of fish
farming on the distribution of phosphorus in sediments in the middle Adriatic area. Mar.
Pollut. Bull. 56, 535- 548.
Metian, M., Pouil, S., Boustany, A.M., Troell, M., 2014. Farming of Bluefin tuna –
reconsidering global estimates and sustainability concerns. Rev. Fish. Sci. Aquac. 22,
184-192.
Moraitis, M., Papageorgiou, N., Dimitriou, P.D., Petrou, A., Karakassis, I., 2013. Effects
of offshore tuna farming on benthic assemblages in the Eastern Mediterranean. Aquacult.
Env. Interac. 4, 41-51.
Morrisey, D.J., 1992. Spatial variation in soft-sediment benthos. Mar. Ecol. Prog. Ser. 81,
197-204.
Olsgard, F., Somerfield, P.J., 2000. Surrogates in marine benthic investigations�which
taxonomic unit to target?. J. Aquat. Ecosyst. Stress Recovery 7, 25-42.

30
Porello, S., Tomassetti, P., Manzueto, L., Finoia, M.G., Persia, E., Mercatali, I., Stipa, P.,
2005. The influence of marine cages on sediment chemistry in the Western
Mediterranean Sea. Aquaculture 245, 145-158.
Sanchez-Jerez, P., Karakassis, I., Massa, F., Fezzardi, D., Aguilar-Manjarrez, J.,
Soto, D., Chapela, R., Avila, P., Macias, J.C., Tomassetti, P., Marino, G., Borg, J.A.,
Franičević, V., Yucel-Gier, G., Fleming, I.A., Biao, X., Nhhala, H., Hamza, H., Forcada
A., Dempster. T., 2016. Aquaculture’s struggle for space: the need for coastal spatial
planning and the potential benefits of Allocated Zones for Aquaculture (AZAs) to avoid
conflict and promote sustainability. Aquacult. Env. Interac. 8, 41-54.
Sanz-Lázaro, C., Marín, A., 2008. Assessment of finfish aquaculture impact on the
benthic communities in the Mediterranean Sea. Dyn. Biochem. Process Biotechnol. Mol.
Biol. 2, 21-32.
Šegvić Bubić, T., Grubišić, L., Tičina, V., Katavić, I., 2011. Temporal and spatial
variability of pelagic wild fish assemblages around Atlantic bluefin tuna Thunnus thynnus
farms in the eastern Adriatic Sea. J. Fish. Biol. 78, 78-97.
Silvert, W., 1992. Assessing environmental impacts of finfish aquaculture in marine
waters. Aquaculture 107, 67-79.

31
Stark, J.S., Riddle, M.J., Simpson, R.D., 2003. Human impacts in soft-sediment
assemblages at Casey Station, East Antarctica: Spatial variation, taxonomic resolution
and data transformation. Austral. Ecol. 28, 287-304.
Sutherland, T.F., Levings, C.D., Petersen, S.A., Poon, P., Piercey, B., 2007. The use of
meiofauna as an indicator of benthic organic enrichment associated with salmonid
aquaculture. Mar. Pollut. Bull. 54, 1249–1261.
Tomassetti, P., Persia, E., Mercatali, I., Vani, D., Marussso, V., Porrello, S., 2009. Effects
of mariculture on macrobenthic assemblages in a western Mediterranean site. Mar. Pollut.
Bull. 58, 533-541.
Tomassetti, P., Porrello, S., 2005. Polychaetes as indicators of marine fish farm organic
enrichment. Aquacult. Int. 13, 109-128.
Vezzulli, L., Moreno, M., Marin, V., Pezzati, E., Bartoli, M., Fabiano, M., 2008. Organic
waste impact of capture-based Atlantic bluefin tuna aquaculture at an exposed site in the
Mediterranean Sea. Estuar. Coast. Shelf Sci. 78, 369-384.
Vita, R., Marin, A., 2007. Environmental impact of capture-based bluefin tuna
aquaculture on benthic communities in the western Mediterranean. Aquac. Res. 38, 331-
339.
32
Vita, R., Marin, A., Jimenez-Brinquis, B., Cesar, A., Marin-Guirao, I., Borredat, M.,
2004. Aquaculture of Bluefin tuna in the Mediterranean: evaluation of organic particulate
wastes. Short Communication. Aquac. Res. 35, 1384-1387.
Walkley, A., Black, I.A., 1934. An examination of the Degtjareff method for determining
soil organic matter, and a proposed modification of the chromic acid titration method.
Soil Sci. 37, 29-38.
Warwick, R.M., Clarke, K.R., 1993. Increased variability as a symptom of stress in
marine communities. J. Exp. Mar. Biol. Ecol. 172, 215-226.
Wiens, J.A., 1989. Spatial scaling in ecology. Funct. Ecol. 3, 385-397.
Figures
Fig. 1 Location of Malta at the centre of the Mediterranean (a); and map of the Maltese
Islands showing the locations of the northeastern farm (NEF), southeastern Farm 1 (SEF
1), and southeastern Farm 2 (SEF 2) (b). Im = impacted plot; Re = reference plot
Fig. 2 Mean values (+ SE) per grab of the number of individuals of Polychaete indicator
taxon Maldanidae (a), Paraonidae (b), Glyceridae (c), and Amphipod indicator taxon
Lysianassidae (d), Urothoidae (e), Phoxocephalidae (f), recorded before (black bars) and
after (white bars) tuna-penning activities at the impacted (Im) and reference (Re) plots of

33
the northeastern farm (NEF), southeastern Farm 1 (SEF 1) and southeastern Farm 2 (SEF
2).
Fig. 3 Mean values (+ SE) per grab of the total number of families (a, c) and Shannon-
Wiener diversity (b, d) of polychaetes (a, b) and amphipods (c, d), and the
polychaete/amphipod ratio (e) recorded before (black bars) and after (white bars) tuna-
penning activities at the impacted (Im) and reference (Re) plots of the northeastern farm
(NEF), southeastern Farm 1 (SEF 1) and southeastern Farm 2 (SEF 2).
Fig. 4 Mean values (+ SE) per grab of sediment mean grain size (a), percent organic
carbon content (b), and percent organic nitrogen content (c) recorded before (black bars)
and after (white bars) tuna-penning activities at the impacted (Im) and reference (Re)
plots of the northeastern farm (NEF), southeastern Farm 1 (SEF 1) and southeastern Farm
2 (SEF 2).

34
Table 1 Results of the 4-factor PERMANOVA for number of individuals of selected
indicator taxa, number of families, and Shannon-Wiener diversity of polychaetes and
amphipods, and the polychaete/amphipod ratio. Level of significance set at 0.05. Key:
Degrees of freedom (df), Number of individuals (NI), Polychaete indicator taxon
Maldanidae (1), Paraonidae (2), Glyceridae (3), Amphipod indicator taxon Lysianassidae
(1), Urothoidae (2) and Phoxocephalidae (3), Number of families (NoF), Shannon-
Wiener diversity (ShW), BOPA-Fish farming index (BOPA-FF), Before (Be), After (Af),
Impacted plot (Im), Reference plot (Re), Northeastern farm (NEF), Southeastern Farm 1
(SEF 1), Southeastern Farm 2 (SEF 2), Not significant (ns), p < 0.05 (*), p < 0.01 (**), p
< 0.001 (***)
Polychaeta Amphipods
Source of Variation df NI 1 NI 2 NI 3 NoF ShW NI 1 NI 2 NI 3 NoF ShW BOPA-FF
Before/After = BA 1 ns ns ns * *** * *** ** *** *** ***
Location = Lo 2 * ns ns ** *** ns *** ns *** *** **
Plot = Pl 1 *** * *** *** *** ns ns ** *** *** ns
BA x Lo 2 ns ns ns ns * ns ns ** *** *** ***
BA x Pl 1 ns ns * ns ** ns ns *** ns ns ns
Pl x Lo 2 * ns ** ns *** ns ** *** *** *** ***
BA x Lo x Pl 2 ns ns ns ns ** ns ns ns * *** **
Site = Si (BA x Pl x Lo) 24 *** * ns * * * ** ns ns ns ns
RES 72
TOT 107
Pair-wise tests for the 3-way interaction term 'BA x Lo x Pl'
NEF Im
Be, Af
- - - - > *** - - - < ** < ** < **
Re - - - - ns - - - ns ns ns
SEF 1 Im - - - - ns - - - ns ns ns
Re - - - - ns - - - ns ns ns
SEF 2 Im - - - - ns - - - > * ns < *
Re - - - - ns - - - > ** > ** ns
Be NEF
Im, Re
- - - - < * - - - > ** > * ns
SEF 1 - - - - ns - - - ns ns ns
SEF 2 - - - - ns - - - ns ns ns

35
Af NEF - - - - < *** - - - > ** > *** > ***
SEF 1 - - - - ns - - - ns > * ns
SEF 2 - - - - ns - - - ns ns ns
Table 1 Continued
Polychaeta Amphipods
NI 1 NI 2 NI 3 NoF ShW NI 1 NI 2 NI 3 NoF ShW BOPA-FF
Pair-wise tests for the 3-way interaction term 'BA x Lo x Pl'
Be Im NEF, SEF 1 - - - - ns - - - < * ns ns
NEF, SEF 2 - - - - < ** - - - < ** < ** ns
SEF 1, SEF 2 - - - - ns - - - < * < ** ns
Re NEF, SEF 1 - - - - ns - - - ns ns ns
NEF, SEF 2 - - - - ns - - - ns < ** ns
SEF 1, SEF 2 - - - - ns - - - ns < * ns
Af Im NEF, SEF 1 - - - - < ** - - - < ** < ** > *
NEF, SEF 2 - - - - < *** - - - < * < ** > ***
SEF 1, SEF 2 - - - - ns - - - ns ns ns
Re NEF, SEF 1 - - - - ns - - - ns ns < *
NEF, SEF 2 - - - - ns - - - > * > * ns
SEF 1, SEF 2 - - - - ns - - - > ** > * ns
Pair-wise tests for the 2-way interaction terms ‘BA x Lo’, ‘BA x Pl’ and ‘Pl x Lo’
NEF
Be, Af
- - * - - - - ns - - -
SEF 1 - - ns - - - - > * - - -
SEF 2 - - ns - - - - > *** - - -
Be NEF, SEF 1 - - < *** - - - - ns - - -
NEF, SEF 2 - - < *** - - - - < *** - - -
SEF 1, SEF 2 - - ns - - - - ns - - -
Af NEF, SEF 1 - - < *** - - - - > * - - -
NEF, SEF 2 - - ns - - - - ns - - -
SEF 1, SEF 2 - - > *** - - - - ns - - -
Im Be, Af
- - - - - - - > *** - - -
Re - - - - - - - ns - - -
Be Im, Re
- - - - - - - > *** - - -
Af - - - - - - - < * - - -
Im NEF, SEF 1 < ** - < *** - - - ns < ** - - -
NEF, SEF 2 ns - < *** - - - ns < *** - - -
SEF 1, SEF 2 ns - ns - - - ns ns - - -
Re NEF, SEF 1 < * - < *** - - - > ** > ** - - -
NEF, SEF 2 ns - < * - - - > *** > *** - - -
SEF 1, SEF 2 > * - > *** - - - ns ns - - -

36
NEF
Im, Re
ns - ns - - - > ** < *** - - -
SEF 1 ns - ns - - - ns > * - - -
SEF 2 ns - > * - - - > * > *** - - -
Table 1 Continued
Polychaeta Amphipods
NI 1 NI 2 NI 3 NoF ShW NI 1 NI 2 NI 3 NoF ShW BOPA-FF
Pair-wise tests for the factors ‘BA’, ‘Lo’ and ‘Pl’
Be, Af - - - > * - < * - - - - -
NEF, SEF 1 - < * - < *** - - - - - - -
NEF, SEF 2 - ns - < *** - - - - - - -
SEF 1, SEF 2 - > * - ns - - - - - - -
Im, Re - - - < ** - - - - - - -

37
Table 2 Results of the 3-factor PERMANOVA for mean sediment grain size, percent
organic carbon content and percent organic nitrogen content. Level of significance set at
0.05. Key: Degrees of freedom (df), Mean sediment grain size (MSGS), Percent organic
carbon content (POCC), Percent organic nitrogen content (PONC), Not significant (ns), p
< 0.05 (*), p < 0.01 (**), Before (Be), After (Af), Impacted plot (Im), Reference plot
(Re), Northeastern farm (NEF), Southeastern Farm 1 (SEF 1), Southeastern Farm 2 (SEF
2)
Source of variation df MSGS POCC PONC
Before/After = BA 1 ns ** **
Location = Lo 2 ns * ns
Plot = Pl 1 ns ns ns
BA x Pl 2 ns ns ns
BA x Lo 1 ns ns ns
Pl x Lo 2 ns ns ns
BA x Lo x Pl 2 ns * *
RES 24
TOT 35
Pair-wise tests for 3-way interaction term
NEF Im Be, Af - < * ns
Re - ns ns
SEF 1 Im - ns ns
Re - ns < *
SEF 2 Im - ns ns
Re - ns ns
Be NEF Im, Re - ns < *
SEF 1 - ns ns
SEF 2 - ns ns
Af NEF - ns ns
SEF 1 - ns ns
SEF 2 - ns ns

38
Table 2 Continued
MSGS POCC PONC
Pair-wise tests for 3-way interaction term
Be Im NEF, SEF 1 - < * ns
NEF, SEF 2 - < ** < *
SEF 1, SEF 2 - ns < *
Re NEF, SEF 1 - ns > *
NEF, SEF 2 - ns ns
SEF 1, SEF 2 - ns ns
Af Im NEF, SEF 1 - ns ns
NEF, SEF 2 - ns ns
SEF 1, SEF 2 - ns ns
Re NEF, SEF 1 - > ** < *
NEF, SEF 2 - ns ns
SEF 1, SEF 2 - ns ns
39
Table 3. BEST results showing the sediment-physico chemical variable, or combination
of variables, that best explains the observed variation in the number of individuals of
selected indicator taxa, number of families and Shannon-Wiener diversity of polychaetes
and amphipods, and the polychaete/amphipod ratio. Level of significance set at 0.05.
Key: Before (Be), After (Af), Impacted plot (Im), Reference plot (Re), Northeastern farm
(NEF), Southeastern Farm 1 (SEF 1), Southeastern Farm 2 (SEF 2), Number of
individuals (NI), Polychaete indicator taxon Maldanidae (1), Paraonidae (2), Glyceridae
(3), Amphipod indicator taxon Lysianassidae (1), Urothoidae (2) and Phoxocephalidae
(3), Number of families (NoF), Shannon-Wiener diversity (ShW), Mean sediment grain
size (MSGS), Percent organic nitrogen content (PONC), Percent organic carbon content
(POCC), BOPA-Fish farming index (BOPA-FF), Not significant (ns), p < 0.05 (*), p <
0.01 (**), p < 0.001 (***)
NEF SEF 1 SEF 2
Rho Exp Var Rho Exp Var Rho Exp Var
Pol
ycha
etes
Im NI 1 -0.055, ns PONC 0.811, ns MSGS 0.516, ns PONC
NI 2 0.159, ns POCC 0.370, ns PONC 0.671, * PONC
NI 3 0.290, ns PONC 0.819, ns POCC 0.086, ns POCC, PONC
NoF 0.525, ns PONC 0.852, * POCC 0.215, ns PONC
ShW 0.607, * MSGS, POCC 0.921, *** POCC, PONC 0.047, ns PONC
Re NI 1 0.488, ns MSGS, POCC 0.379, ns POCC, PONC 0.865, * MSGS, POCC
NI 2 0.592, ns MSGS 0.336, ns POCC, PONC 0.832, * POCC
NI 3 0.722, ns MSGS 0.604, * MSGS, POCC -0.145, ns PONC
NoF -0.034, ns PONC 0.036, ns MSGS, POCC 0.313, ns POCC, PONC
ShW 0.014, ns POCC 0.157, ns POCC, PONC -0.107, ns MSGS, PONC
Am
phip
ods
Im NI 1 -0.027, ns MSGS 0.683, ns MSGS, POCC 0.013, ns POCC
NI 2 0.300, ns MSGS, POCC -0.020, ns PONC 0.461, ns POCC, PONC
NI 3 -0.077, ns POCC -0.020, ns PONC 0.470, ns POCC, PONC

40
NoF 0.569, ns MSGS, POCC 0.400, ns PONC 0.451, ns PONC
ShW 0.530, ns MSGS, POCC 0.854, ns POCC, PONC 0.249, ns PONC
Re NI 1 0.361, ns MSGS 0.286, ns POCC 0.013, ns MSGS
NI 2 0.419, ns PONC 0.379, ns POCC -0.134, ns MSGS
NI 3 0.283, ns MSGS 0.123, ns POCC 0.392, ns MSGS, POCC
Table 3 Continued
NEF SEF 1 SEF 2
Rho Exp Var Rho Exp Var Rho Exp Var
NoF 0.073, ns POCC 0.095, ns POCC 0.068, ns MSGS, POCC
ShW 0.286, ns PONC 0.146, ns POCC 0.229, ns MSGS, POCC
BOPA- FF
Im 0.479, ns MSGS, POCC 0.743, ns POCC, PONC 0.410, ns PONC
Re 0.125, ns MSGS 0.754, * MSGS, POCC 0.525, ns MSGS, POCC
Pol
ycha
etes
Be NI 1 -0.013, ns MSGS 0.285, ns MSGS, POCC 0.669, ns POCC
NI 2 -0.120, ns POCC 0.332, ns POCC 0.680, ns POCC, PONC
NI 3 -0.209, ns POCC 0.931, ** PONC -0.083, ns MSGS, POCC
NoF 0.361, ns PONC 0.441, ns PONC 0.628, ns MSGS
ShW 0.136, ns PONC 0.214, ns POCC 0.189, ns MSGS
Af NI 1 no test 0.467, ns PONC 0.495, ns MSGS, POCC
NI 2 0.343, ns MSGS, POCC 0.527, ns POCC, PONC 0.729, ns PONC
NI 3 0.052, ns MSGS, POCC 0.622, ns POCC 0.090, ns MSGS
NoF 0.521, ns MSGS, POCC 0.515, ns POCC, PONC 0.703, ns POCC, PONC
ShW 0.668, * MSGS, POCC 0.780, ns POCC, PONC 0.206, ns PONC
Am
phip
ods
Be NI 1 -0.182, ns MSGS, PONC 0.381, ns POCC 0.358, ns POCC
NI 2 0.619, ns MSGS, PONC 0.185, ns POCC 0.088, ns POCC
NI 3 0.683, ns PONC 0.386, ns POCC 0.766, * MSGS
NoF 0.586, ns PONC -0.185, ns MSGS 0.702, ns PONC
ShW 0.568, ns MSGS 0.143, ns POCC 0.693, ns PONC
Af NI 1 0.459, ns MSGS, POCC 0.815, * POCC 0.130, ns MSGS
NI 2 0.030, ns MSGS, POCC 0.192, ns MSGS, POCC -0.056, ns PONC
NI 3 0.170, ns MSGS, POCC 0.274, ns MSGS -0.139, ns POCC
NoF 0.613, * MSGS, POCC 0.522, ns MSGS, POCC -0.165, ns MSGS
ShW 0.810, ** MSGS, POCC 0.871, ** POCC -0.086, ns POCC
BOPA-FF
Be 0.689, ns MSGS, PONC 0.579, ns PONC 0.607, ns MSGS, POCC
Af 0.404, ns MSGS, POCC 0.700, ns MSGS, POCC, PONC 0.114, ns POCC

41
Table 3 Continued
Impacted Reference Rho Exp Var Rho Exp Var
Pol
ycha
etes
Be NI 1 0.468, ns MSGS 0.136, ns PONC NI 2 0.256, ns PONC 0.230, ns PONC NI 3 0.720, ** POCC 0.257, ns PONC NoF 0.511, * MSGS, POCC, PONC 0.776, ** MSGS, POCC, PONC ShW 0.472, * PONC 0.459, ns MSGS, PONC Af NI 1 -0.018, ns MSGS 0.533, ns POCC NI 2 0.03, ns POCC, PONC 0.200, ns MSGS NI 3 -0.061, ns MSGS 0.083, ns MSGS NoF 0.241, ns POCC, PONC 0.295, ns MSGS, POCC, PONC ShW 0.396, * POCC 0.284, ns POCC
Am
phip
ods
Be NI 1 0.199, ns PONC 0.100, ns POCC NI 2 -0.021, ns MSGS 0.403, ns PONC NI 3 0.766, ** POCC, PONC 0.55, ns PONC NoF 0.830, ** POCC, PONC 0.349, ns MSGS ShW 0.726, ** PONC 0.252, ns MSGS Af NI 1 -0.039, ns POCC 0.128, ns MSGS, PONC NI 2 0.027, ns MSGS 0.046, ns MSGS, PONC NI 3 -0.014, ns MSGS -0.037, ns PONC NoF 0.218, ns POCC, PONC 0.102, ns MSGS, POCC, PONC ShW 0.382, ns POCC, PONC 0.096, ns MSGS, POCC, PONC
Be BOPA-FF 0.460, ns MSGS, POCC, PONC 0.340, ns MSGS, POCC
Af 0.329, ns POCC 0.202, ns MSGS, PONC