Embed Size (px)
Citation preview
1
CONSUMER PREFERENCE AND CONSUMPTION OF ORGANIC PRODUCTS IN THE EASTERN CAPE PROVINCE OF SOUTH AFRICA
Maggie Kisaka-Lwayo1 and Ajuruchukwu Obi1
1 Department of Agricultural Economics & Extension, University of Fort Hare, Private Bag X1314, Alice 5700 South Africa.
Abstract Food purchasing is an important expression of food habits. This paper therefore examines the factors associated with a household’s decision to purchase organic food products because such information is not yet available for the study area despite anecdotal evidence of the growing importance of organic products in the country. A randomly chosen sample of 200 consumers in rural and urban areas of the province’s two major regions, the former Ciskei and Transkei homeland areas, were enumerated. By means of structured questionnaires, the respondents were interviewed in relation to where they buy their groceries from, the types of foods they bought, their present and future buying patterns, preferred food products, and their reasons for choice of particular food products. In addition, information was obtained on a number of personal characteristics and circumstances of the respondents, including their health status, income, and family circumstances. The study employed descriptive statistics, logistic regression and the standardized discriminant functions to analyze the resulting data. There is evidence of growing interest in organic products in the province, with a sizeable proportion of respondents having consumed or considered consuming organics while only a small number of respondents did not know about the products. Consumers considered organic products healthier and more nutritious with better appearance and taste, affordability and safety. The logistic regression suggests that gender, education, employment, location, price and the person responsible for shopping are important factors in consumer awareness and choice of organic products.
Keywords: Organic products, consumer preference, logistic model, discriminant function.
2
1. Introduction
Organic agriculture offers developing countries a wide range of economic, environment,
social and cultural benefits. Global markets for certified organic products have been
growing rapidly over the past two decades. In 2006, global certified organic sales were
estimated to have reached over 30 billion Euros, a 20 per cent increase over 2005, and are
expected to increase to 52 billion Euros by 2012 (UNEP-UNCTAD, 2008). While most
sales are in North America and Europe, production is global with developing countries
producing and exporting ever-increasing shares. Due to expanding markets and attractive
price premiums, numerous studies in Africa, Asia and Latin America indicate that
organic farmers earn higher incomes than their conventional counterparts (IFAD, 2003;
IFAD, 2005). Moreover, organic products more easily meet the ever stringent
requirements on maximum residual levels of synthetic agro-chemicals, as organic
standards prohibit their use (FAO, 2009).
Despite phenomenal success of the commercial agricultural sector in South Africa and
significant progress in integrating smallholders since democratic reforms, food security
concerns remain in South Africa. Recent global increases in food prices have further
exacerbated vulnerabilities and make it imperative to examine alternative food production
and consumption questions in the country. The World Bank (2010) reports that domestic
staple food prices in several countries particularly in Sub-Saharan Africa, experienced
double digit increases in 2009. It estimated that the impact on undernourishment or
hunger has been as much as 8% in 2009 (World Bank, 2010). Similarly according to
Cuesta (2011), global prices of food in July 2011 remained significantly high and are
close to the 2008 peak levels, with the World Bank Food Price Index increasing by 33
percent in the last year. Investigating what people buy and the factors influencing their
choices is therefore an important policy imperative.
2. Objectives
The broad objective that this paper sets out to address is to determine household buying
behaviour in relation to organic food products to fill the existing gap in knowledge about
3
the market potential of this important food group that is growing in popularity in the
country. More specifically, the paper aims:
• To explore consumer awareness, perceptions and attitudes regarding organic
products;
• To identify the factors that affect the consumer’s preference and consumption
of organic products.
3. The Model and Methods
A sample of 200 consumers was drawn randomly from rural and urban locations in the
two main regions of the Eastern Cape, namely the former Transkei homeland area and the
former Ciskei homeland area. By means of structured questionnaires, the respondents
were interviewed in relation to where they buy their groceries from, the types of foods
they bought, their present and future buying patterns, preferred food products, and their
reasons for choice of particular food products. In addition, information was obtained on a
number of personal characteristics and circumstances of the respondents, including their
health status, income, and family circumstances. The study employed descriptive
statistics, logistic regression and the standardized discriminant functions to analyze the
resulting data.
4. Preference of shopping places in the Eastern Cape
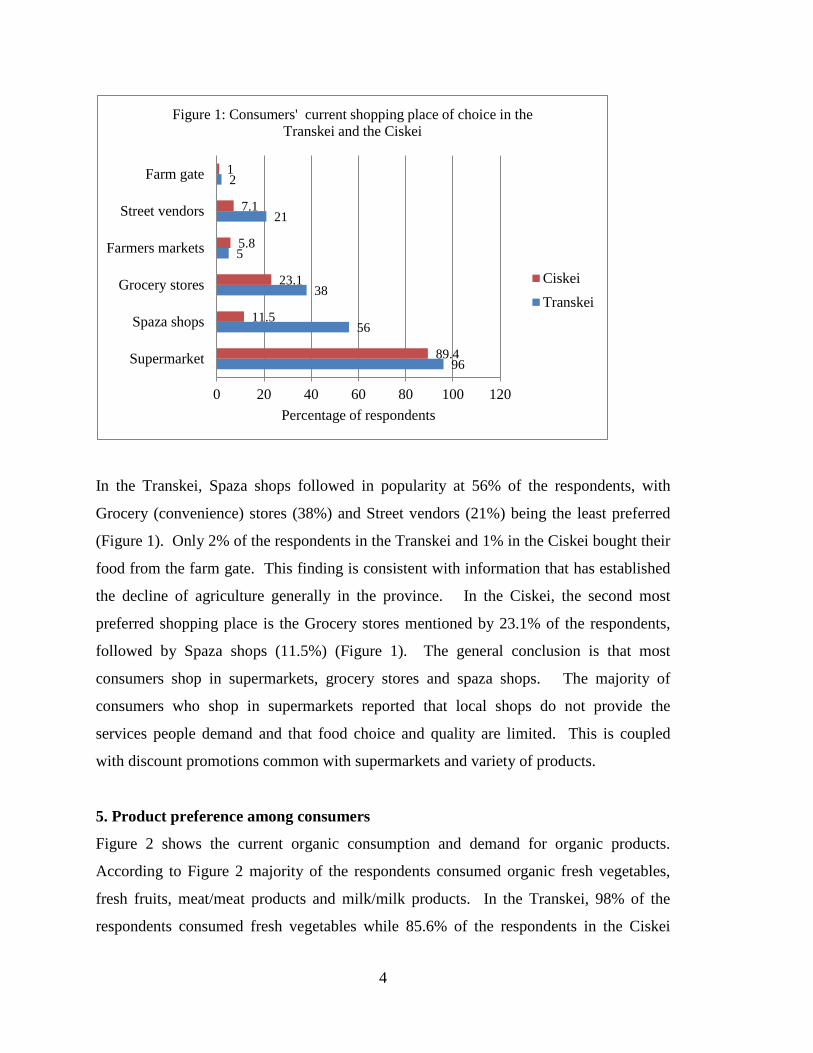
In order to establish the preferred shopping places for food, consumers were asked to
indicate what shop they traditionally buy their groceries from. Six places were identified
from past research as: supermarket, spaza shops (which are common in rural areas),
Grocery stores, Farmers markets such as the Kei Fresh produce in Mthatha or the farmers
market in Wilsonia, East London, Street vendors or the farm gate. Respondents’ were
free to mark all the choices. An overwhelming majority of the respondents, 96% in the
Transkei and 89.4% in the Ciskei, indicated that they bought their food from
supermarkets (Figure 1).
4
In the Transkei, Spaza shops followed in popularity at 56% of the respondents, with
Grocery (convenience) stores (38%) and Street vendors (21%) being the least preferred
(Figure 1). Only 2% of the respondents in the Transkei and 1% in the Ciskei bought their
food from the farm gate. This finding is consistent with information that has established
the decline of agriculture generally in the province. In the Ciskei, the second most
preferred shopping place is the Grocery stores mentioned by 23.1% of the respondents,
followed by Spaza shops (11.5%) (Figure 1). The general conclusion is that most
consumers shop in supermarkets, grocery stores and spaza shops. The majority of
consumers who shop in supermarkets reported that local shops do not provide the
services people demand and that food choice and quality are limited. This is coupled
with discount promotions common with supermarkets and variety of products.
5. Product preference among consumers
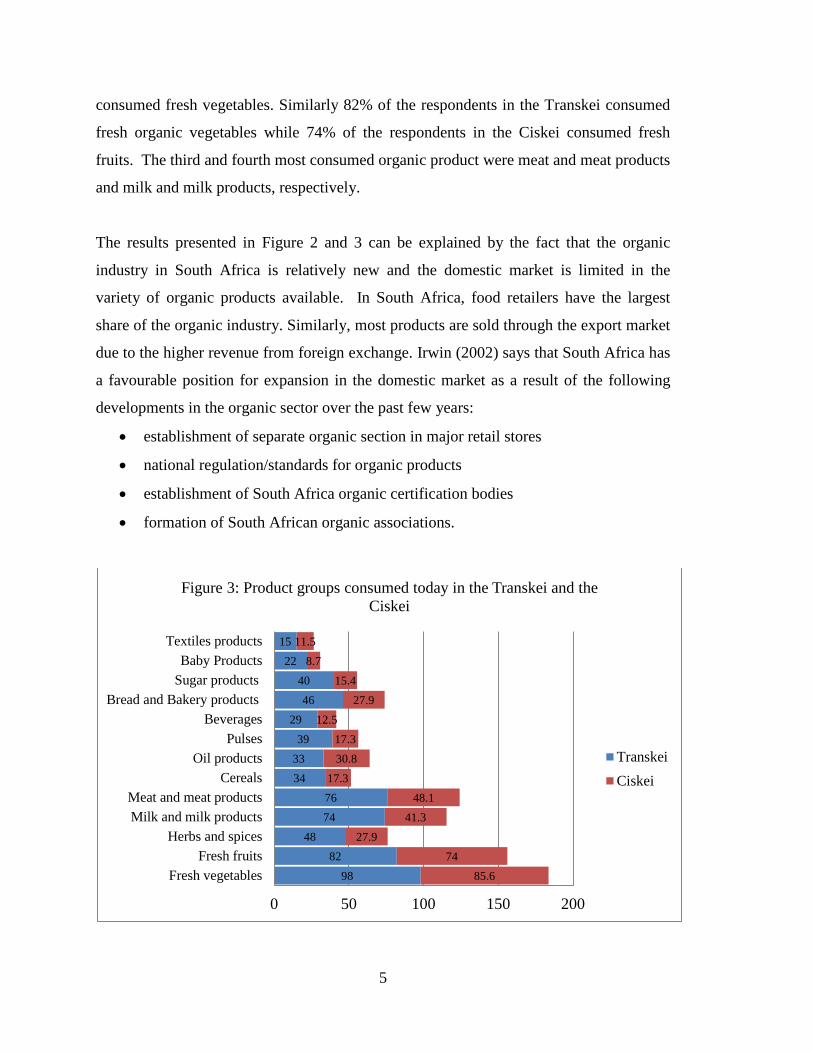
Figure 2 shows the current organic consumption and demand for organic products.
According to Figure 2 majority of the respondents consumed organic fresh vegetables,
fresh fruits, meat/meat products and milk/milk products. In the Transkei, 98% of the
respondents consumed fresh vegetables while 85.6% of the respondents in the Ciskei
96
56
38
5
21
2
89.4
11.5
23.1
5.8
7.1
1
0 20 40 60 80 100 120
Supermarket
Spaza shops
Grocery stores
Farmers markets
Street vendors
Farm gate
Percentage of respondents
Figure 1: Consumers' current shopping place of choice in the Transkei and the Ciskei
CiskeiTranskei
5
consumed fresh vegetables. Similarly 82% of the respondents in the Transkei consumed
fresh organic vegetables while 74% of the respondents in the Ciskei consumed fresh
fruits. The third and fourth most consumed organic product were meat and meat products
and milk and milk products, respectively.
The results presented in Figure 2 and 3 can be explained by the fact that the organic
industry in South Africa is relatively new and the domestic market is limited in the
variety of organic products available. In South Africa, food retailers have the largest
share of the organic industry. Similarly, most products are sold through the export market
due to the higher revenue from foreign exchange. Irwin (2002) says that South Africa has
a favourable position for expansion in the domestic market as a result of the following
developments in the organic sector over the past few years:
• establishment of separate organic section in major retail stores
• national regulation/standards for organic products
• establishment of South Africa organic certification bodies
• formation of South African organic associations.
98 82
48 74 76
34 33 39
29 46
40 22
15
85.6 74
27.9 41.3
48.1 17.3
30.8 17.3
12.5 27.9
15.4 8.7
11.5
0 50 100 150 200
Fresh vegetablesFresh fruits
Herbs and spicesMilk and milk productsMeat and meat products
CerealsOil products
PulsesBeverages
Bread and Bakery productsSugar productsBaby Products
Textiles products
Figure 3: Product groups consumed today in the Transkei and the Ciskei
TranskeiCiskei
6
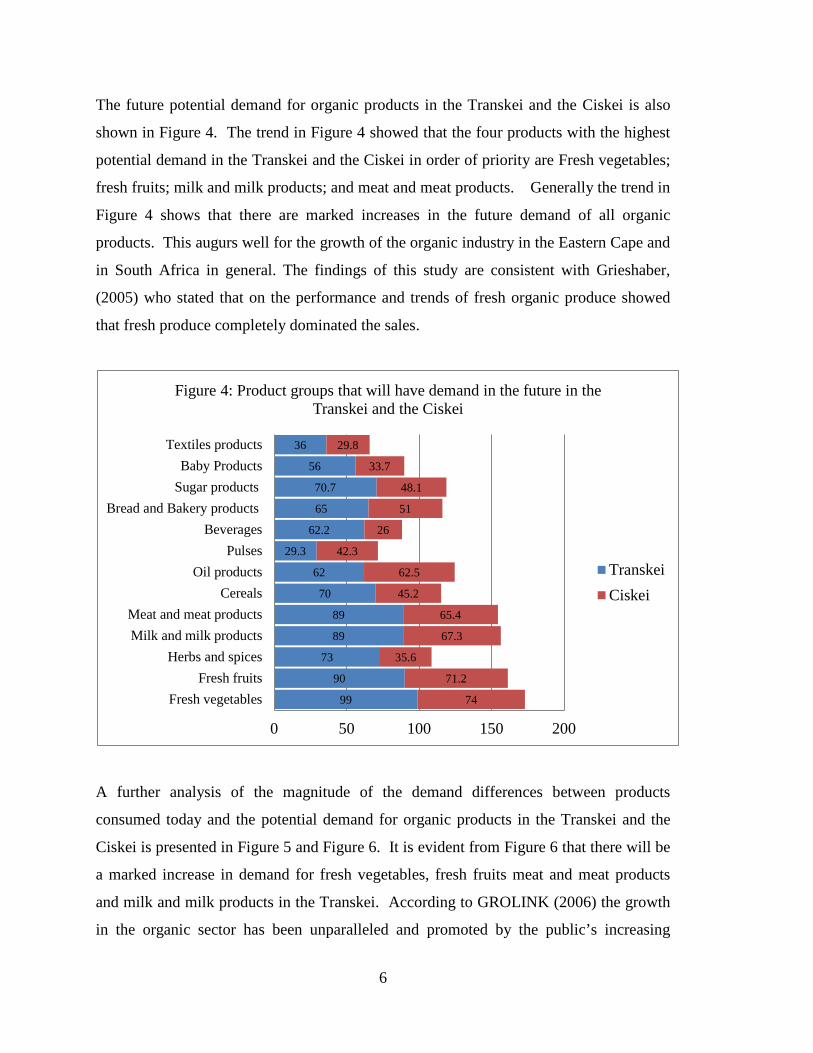
The future potential demand for organic products in the Transkei and the Ciskei is also
shown in Figure 4. The trend in Figure 4 showed that the four products with the highest
potential demand in the Transkei and the Ciskei in order of priority are Fresh vegetables;
fresh fruits; milk and milk products; and meat and meat products. Generally the trend in
Figure 4 shows that there are marked increases in the future demand of all organic
products. This augurs well for the growth of the organic industry in the Eastern Cape and
in South Africa in general. The findings of this study are consistent with Grieshaber,
(2005) who stated that on the performance and trends of fresh organic produce showed
that fresh produce completely dominated the sales.
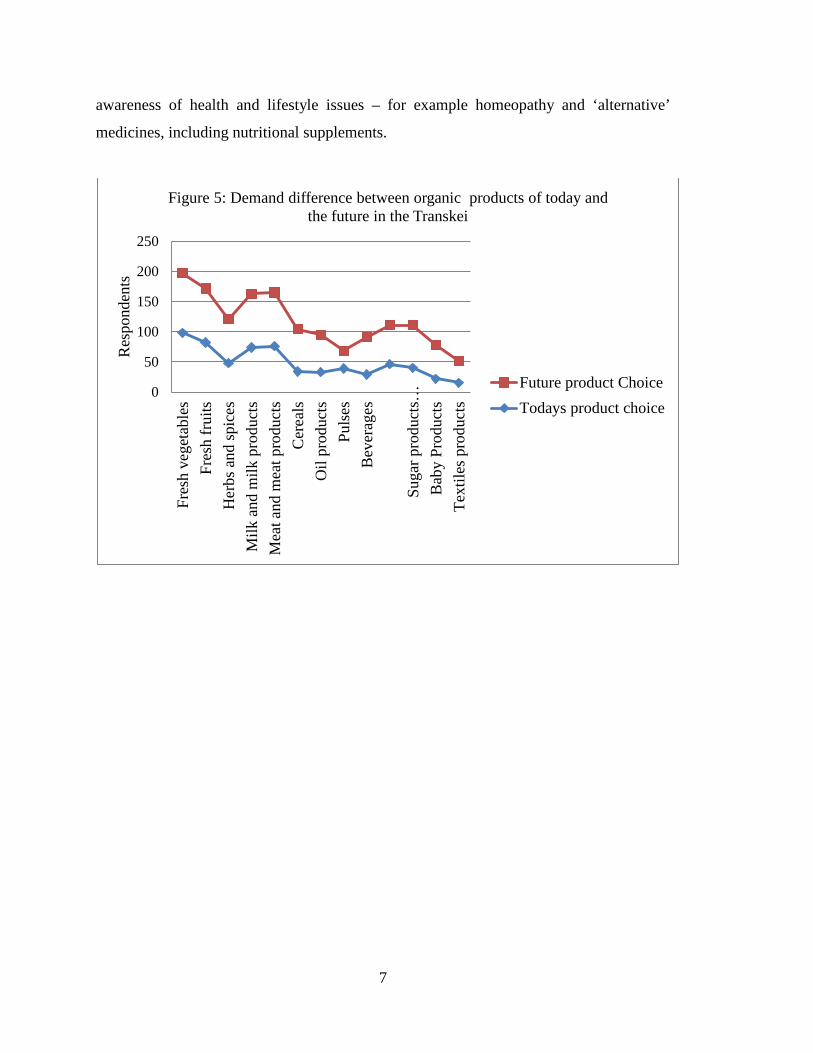
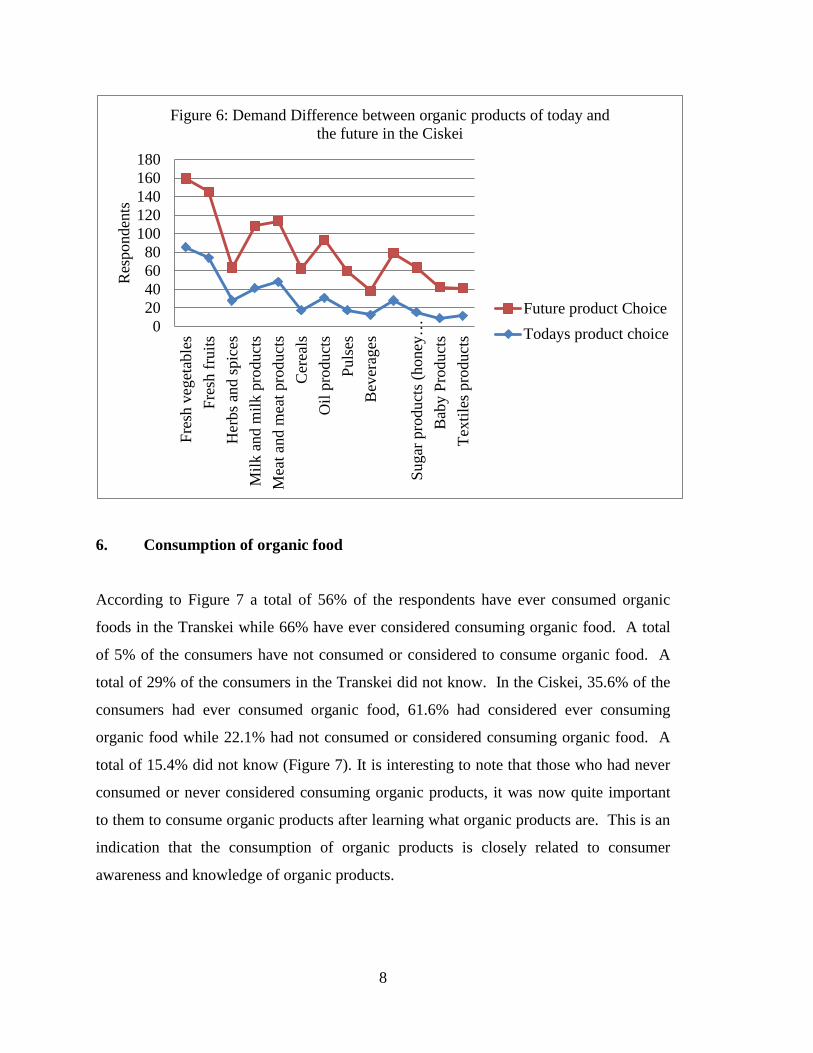
A further analysis of the magnitude of the demand differences between products
consumed today and the potential demand for organic products in the Transkei and the
Ciskei is presented in Figure 5 and Figure 6. It is evident from Figure 6 that there will be
a marked increase in demand for fresh vegetables, fresh fruits meat and meat products
and milk and milk products in the Transkei. According to GROLINK (2006) the growth
in the organic sector has been unparalleled and promoted by the public’s increasing
99
90
73
89
89
70
62
29.3
62.2
65
70.7
56
36
74
71.2
35.6
67.3
65.4
45.2
62.5
42.3
26
51
48.1
33.7
29.8
0 50 100 150 200
Fresh vegetablesFresh fruits
Herbs and spicesMilk and milk productsMeat and meat products
CerealsOil products
PulsesBeverages
Bread and Bakery productsSugar productsBaby Products
Textiles products
Figure 4: Product groups that will have demand in the future in the Transkei and the Ciskei
TranskeiCiskei
7
awareness of health and lifestyle issues – for example homeopathy and ‘alternative’
medicines, including nutritional supplements.
0
50
100
150
200
250
Fres
h ve
geta
bles
Fres
h fr
uits
Her
bs a
nd sp
ices
Milk
and
milk
pro
duct
sM
eat a
nd m
eat p
rodu
cts
Cer
eals
Oil
prod
ucts
Puls
esB
ever
ages
Suga
r pro
duct
s…B
aby
Prod
ucts
Text
iles p
rodu
cts
Res
pond
ents
Figure 5: Demand difference between organic products of today and the future in the Transkei
Future product ChoiceTodays product choice
8
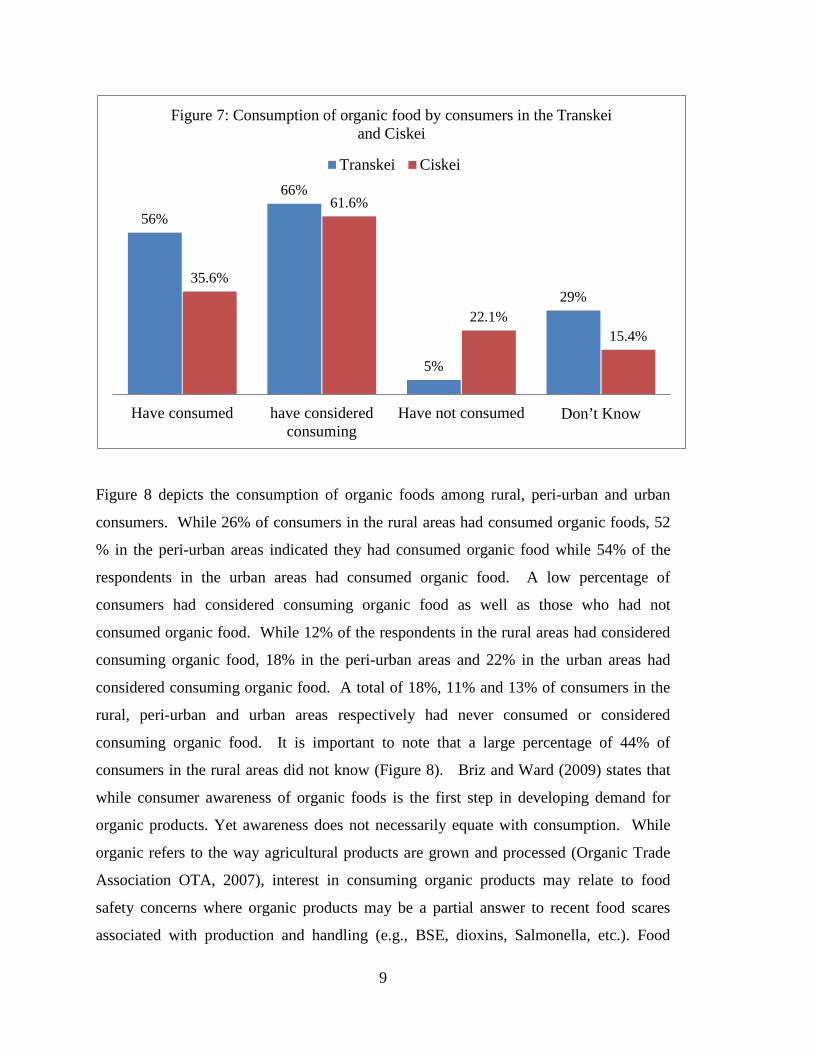
6. Consumption of organic food
According to Figure 7 a total of 56% of the respondents have ever consumed organic
foods in the Transkei while 66% have ever considered consuming organic food. A total
of 5% of the consumers have not consumed or considered to consume organic food. A
total of 29% of the consumers in the Transkei did not know. In the Ciskei, 35.6% of the
consumers had ever consumed organic food, 61.6% had considered ever consuming
organic food while 22.1% had not consumed or considered consuming organic food. A
total of 15.4% did not know (Figure 7). It is interesting to note that those who had never
consumed or never considered consuming organic products, it was now quite important
to them to consume organic products after learning what organic products are. This is an
indication that the consumption of organic products is closely related to consumer
awareness and knowledge of organic products.
020406080
100120140160180
Fres
h ve
geta
bles
Fres
h fr
uits
Her
bs a
nd sp
ices
Milk
and
milk
pro
duct
sM
eat a
nd m
eat p
rodu
cts
Cer
eals
Oil
prod
ucts
Puls
esB
ever
ages
Suga
r pro
duct
s (ho
ney…
Bab
y Pr
oduc
tsTe
xtile
s pro
duct
s
Res
pond
ents
Figure 6: Demand Difference between organic products of today and
the future in the Ciskei
Future product ChoiceTodays product choice
9
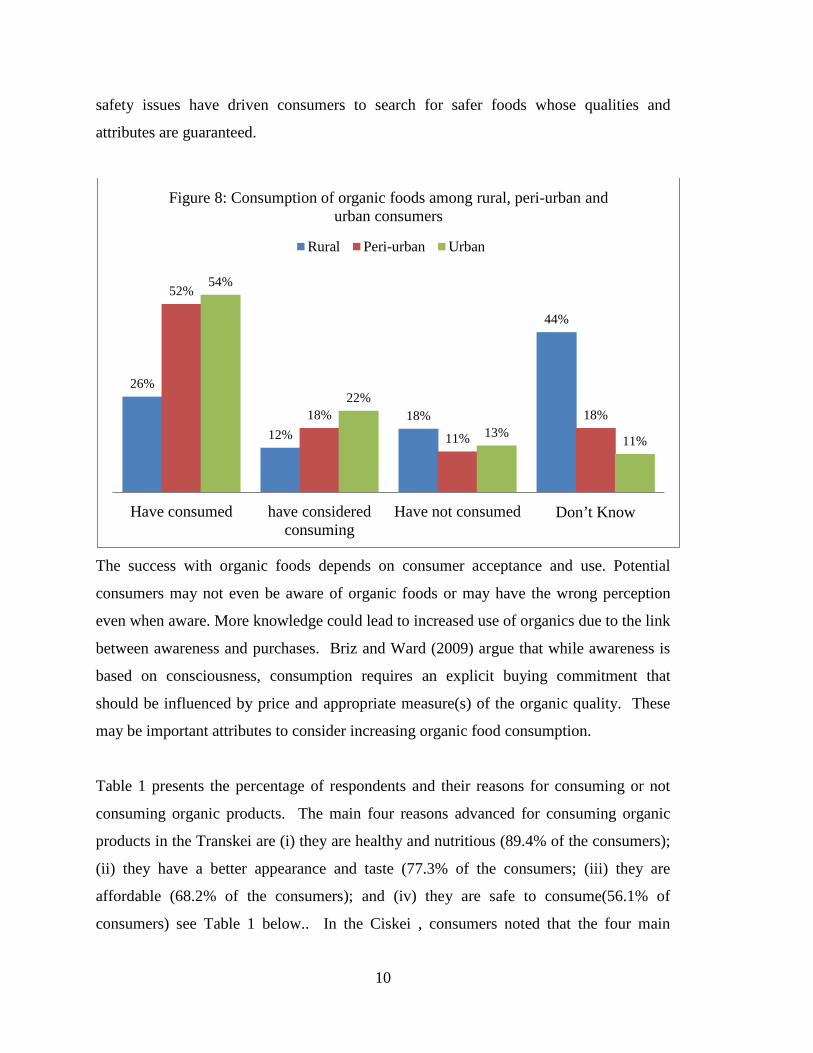
Figure 8 depicts the consumption of organic foods among rural, peri-urban and urban
consumers. While 26% of consumers in the rural areas had consumed organic foods, 52
% in the peri-urban areas indicated they had consumed organic food while 54% of the
respondents in the urban areas had consumed organic food. A low percentage of
consumers had considered consuming organic food as well as those who had not
consumed organic food. While 12% of the respondents in the rural areas had considered
consuming organic food, 18% in the peri-urban areas and 22% in the urban areas had
considered consuming organic food. A total of 18%, 11% and 13% of consumers in the
rural, peri-urban and urban areas respectively had never consumed or considered
consuming organic food. It is important to note that a large percentage of 44% of
consumers in the rural areas did not know (Figure 8). Briz and Ward (2009) states that
while consumer awareness of organic foods is the first step in developing demand for
organic products. Yet awareness does not necessarily equate with consumption. While
organic refers to the way agricultural products are grown and processed (Organic Trade
Association OTA, 2007), interest in consuming organic products may relate to food
safety concerns where organic products may be a partial answer to recent food scares
associated with production and handling (e.g., BSE, dioxins, Salmonella, etc.). Food
56%
66%
5%
29% 35.6%
61.6%
22.1% 15.4%
Have consumed have consideredconsuming
Have not consumed Don’t Know
Figure 7: Consumption of organic food by consumers in the Transkei and Ciskei
Transkei Ciskei
10
safety issues have driven consumers to search for safer foods whose qualities and
attributes are guaranteed.
The success with organic foods depends on consumer acceptance and use. Potential
consumers may not even be aware of organic foods or may have the wrong perception
even when aware. More knowledge could lead to increased use of organics due to the link
between awareness and purchases. Briz and Ward (2009) argue that while awareness is
based on consciousness, consumption requires an explicit buying commitment that
should be influenced by price and appropriate measure(s) of the organic quality. These
may be important attributes to consider increasing organic food consumption.
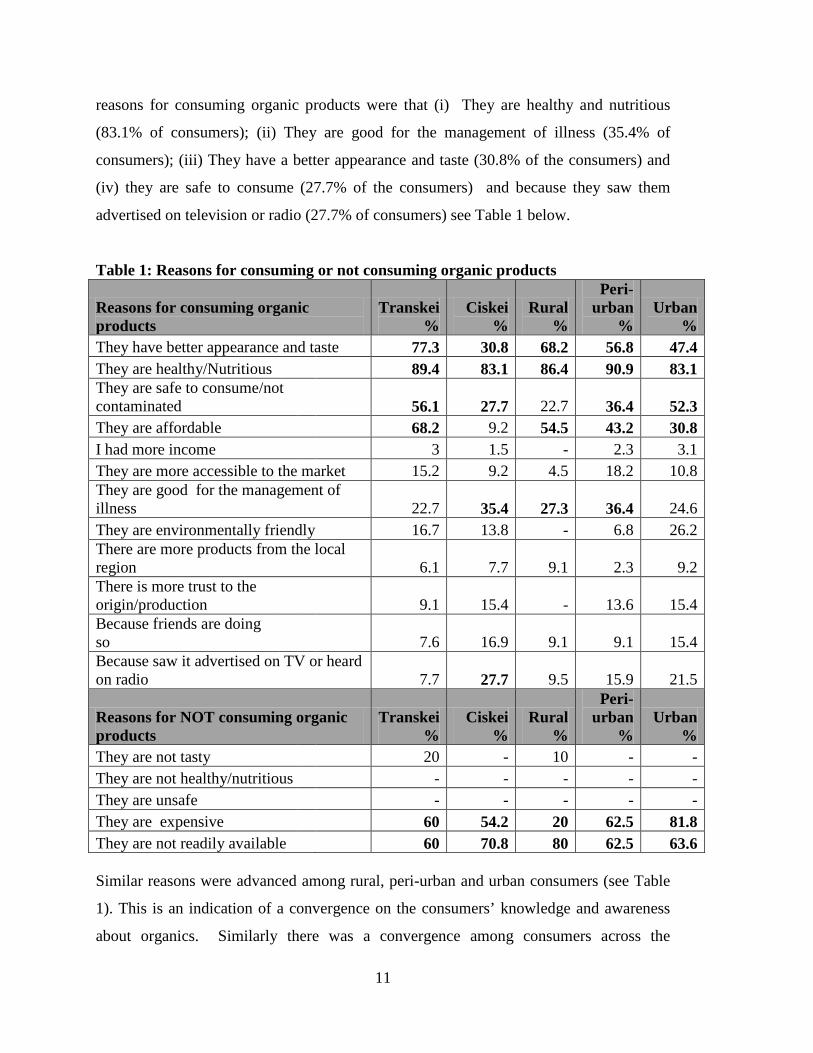
Table 1 presents the percentage of respondents and their reasons for consuming or not
consuming organic products. The main four reasons advanced for consuming organic
products in the Transkei are (i) they are healthy and nutritious (89.4% of the consumers);
(ii) they have a better appearance and taste (77.3% of the consumers; (iii) they are
affordable (68.2% of the consumers); and (iv) they are safe to consume(56.1% of
consumers) see Table 1 below.. In the Ciskei , consumers noted that the four main
26%
12% 18%
44%
52%
18%
11%
18%
54%
22%
13% 11%
Have consumed have consideredconsuming
Have not consumed Don’t Know
Figure 8: Consumption of organic foods among rural, peri-urban and urban consumers
Rural Peri-urban Urban
11
reasons for consuming organic products were that (i) They are healthy and nutritious
(83.1% of consumers); (ii) They are good for the management of illness (35.4% of
consumers); (iii) They have a better appearance and taste (30.8% of the consumers) and
(iv) they are safe to consume (27.7% of the consumers) and because they saw them
advertised on television or radio (27.7% of consumers) see Table 1 below.
Table 1: Reasons for consuming or not consuming organic products
Reasons for consuming organic products
Transkei %
Ciskei %
Rural %
Peri-urban
% Urban
% They have better appearance and taste 77.3 30.8 68.2 56.8 47.4 They are healthy/Nutritious 89.4 83.1 86.4 90.9 83.1 They are safe to consume/not contaminated 56.1 27.7 22.7 36.4 52.3 They are affordable 68.2 9.2 54.5 43.2 30.8 I had more income 3 1.5 - 2.3 3.1 They are more accessible to the market 15.2 9.2 4.5 18.2 10.8 They are good for the management of illness 22.7 35.4 27.3 36.4 24.6 They are environmentally friendly 16.7 13.8 - 6.8 26.2 There are more products from the local region 6.1 7.7 9.1 2.3 9.2 There is more trust to the origin/production 9.1 15.4 - 13.6 15.4 Because friends are doing so 7.6 16.9 9.1 9.1 15.4 Because saw it advertised on TV or heard on radio 7.7 27.7 9.5 15.9 21.5
Reasons for NOT consuming organic products
Transkei %
Ciskei %
Rural %
Peri-urban
% Urban
% They are not tasty 20 - 10 - - They are not healthy/nutritious - - - - - They are unsafe
- - - - -
They are expensive
60 54.2 20 62.5 81.8 They are not readily available 60 70.8 80 62.5 63.6 Similar reasons were advanced among rural, peri-urban and urban consumers (see Table
1). This is an indication of a convergence on the consumers’ knowledge and awareness
about organics. Similarly there was a convergence among consumers across the
12
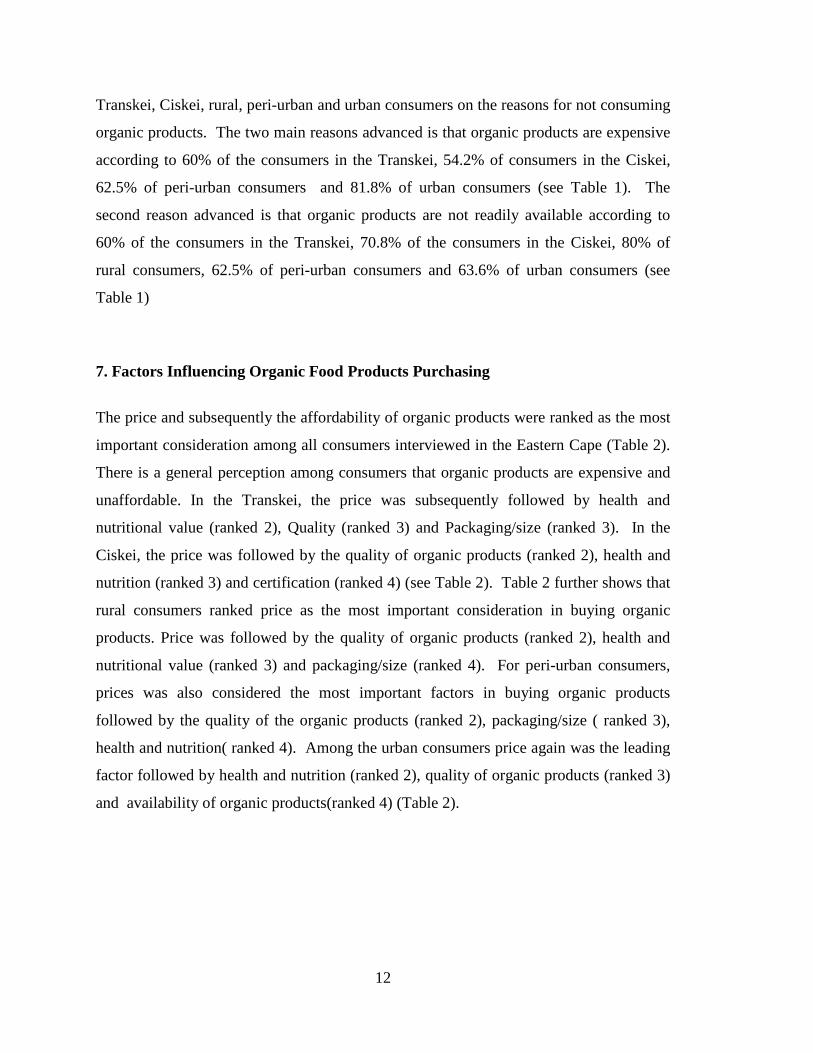
Transkei, Ciskei, rural, peri-urban and urban consumers on the reasons for not consuming
organic products. The two main reasons advanced is that organic products are expensive
according to 60% of the consumers in the Transkei, 54.2% of consumers in the Ciskei,
62.5% of peri-urban consumers and 81.8% of urban consumers (see Table 1). The
second reason advanced is that organic products are not readily available according to
60% of the consumers in the Transkei, 70.8% of the consumers in the Ciskei, 80% of
rural consumers, 62.5% of peri-urban consumers and 63.6% of urban consumers (see
Table 1)
7. Factors Influencing Organic Food Products Purchasing
The price and subsequently the affordability of organic products were ranked as the most
important consideration among all consumers interviewed in the Eastern Cape (Table 2).
There is a general perception among consumers that organic products are expensive and
unaffordable. In the Transkei, the price was subsequently followed by health and
nutritional value (ranked 2), Quality (ranked 3) and Packaging/size (ranked 3). In the
Ciskei, the price was followed by the quality of organic products (ranked 2), health and
nutrition (ranked 3) and certification (ranked 4) (see Table 2). Table 2 further shows that
rural consumers ranked price as the most important consideration in buying organic
products. Price was followed by the quality of organic products (ranked 2), health and
nutritional value (ranked 3) and packaging/size (ranked 4). For peri-urban consumers,
prices was also considered the most important factors in buying organic products
followed by the quality of the organic products (ranked 2), packaging/size ( ranked 3),
health and nutrition( ranked 4). Among the urban consumers price again was the leading
factor followed by health and nutrition (ranked 2), quality of organic products (ranked 3)
and availability of organic products(ranked 4) (Table 2).
13
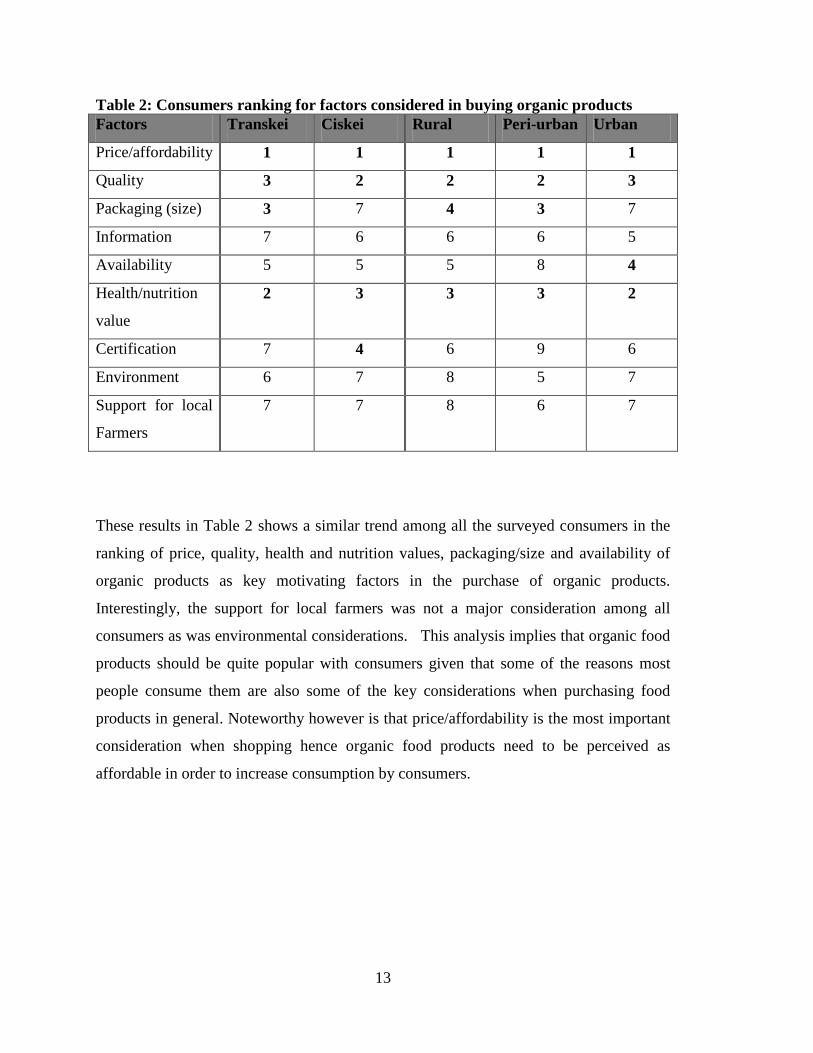
Table 2: Consumers ranking for factors considered in buying organic products Factors Transkei Ciskei Rural Peri-urban Urban
Price/affordability 1 1 1 1 1
Quality 3 2 2 2 3
Packaging (size) 3 7 4 3 7
Information 7 6 6 6 5
Availability 5 5 5 8 4
Health/nutrition
value
2 3 3 3 2
Certification 7 4 6 9 6
Environment 6 7 8 5 7
Support for local
Farmers
7 7 8 6 7
These results in Table 2 shows a similar trend among all the surveyed consumers in the
ranking of price, quality, health and nutrition values, packaging/size and availability of
organic products as key motivating factors in the purchase of organic products.
Interestingly, the support for local farmers was not a major consideration among all
consumers as was environmental considerations. This analysis implies that organic food
products should be quite popular with consumers given that some of the reasons most
people consume them are also some of the key considerations when purchasing food
products in general. Noteworthy however is that price/affordability is the most important
consideration when shopping hence organic food products need to be perceived as
affordable in order to increase consumption by consumers.
14
8. Health and lifestyle conditions of consumers in the Eastern Cape The health and lifestyle conditions identified among households in the Eastern Cape were
hypertension/High blood pressure, cholesterol, diabetes, arthritis, cancer and skin
conditions. Health benefits have been reported as a main motive for purchasing organic
food (Yiridoe et al., 2005). As consumers become more aware of food safety, nutrition
and sustainability, consumer health takes centre stage. Health is the one aspect
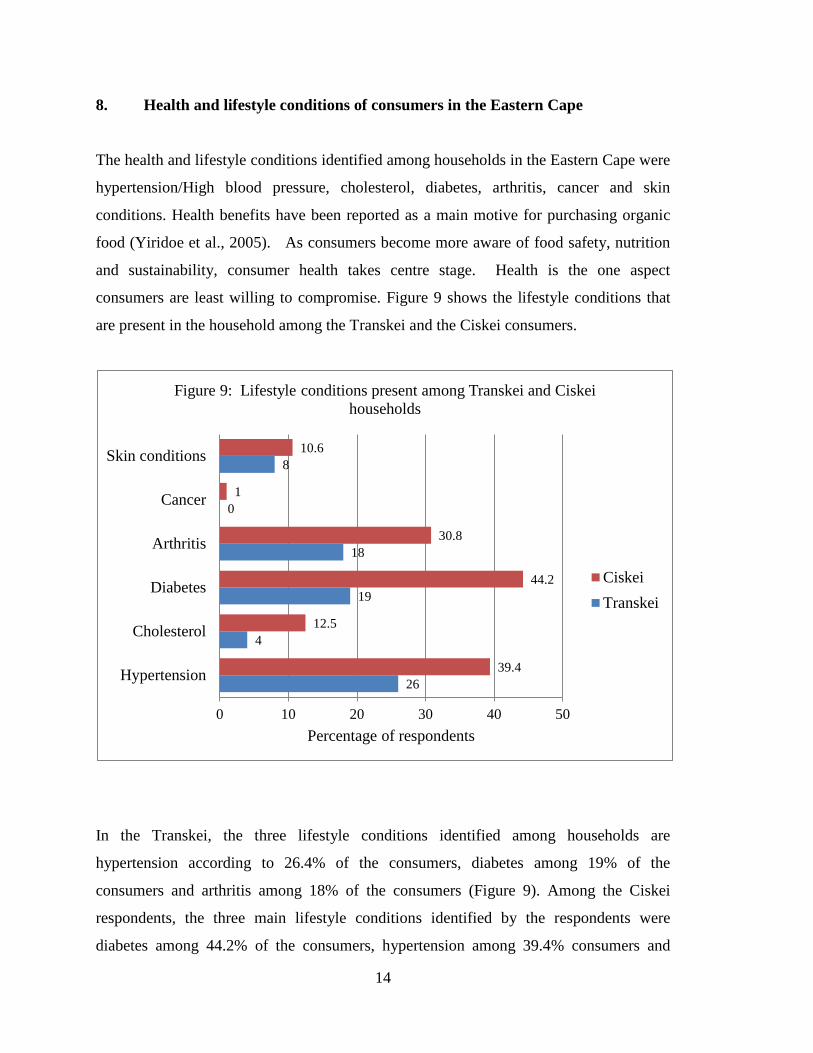
consumers are least willing to compromise. Figure 9 shows the lifestyle conditions that
are present in the household among the Transkei and the Ciskei consumers.
In the Transkei, the three lifestyle conditions identified among households are
hypertension according to 26.4% of the consumers, diabetes among 19% of the
consumers and arthritis among 18% of the consumers (Figure 9). Among the Ciskei
respondents, the three main lifestyle conditions identified by the respondents were
diabetes among 44.2% of the consumers, hypertension among 39.4% consumers and
26
4
19
18
0
8
39.4
12.5
44.2
30.8
1
10.6
0 10 20 30 40 50
Hypertension
Cholesterol
Diabetes
Arthritis
Cancer
Skin conditions
Percentage of respondents
Figure 9: Lifestyle conditions present among Transkei and Ciskei households
CiskeiTranskei
15
arthritis among 30.8% of the consumers (Figure 9). There barely was any cancer
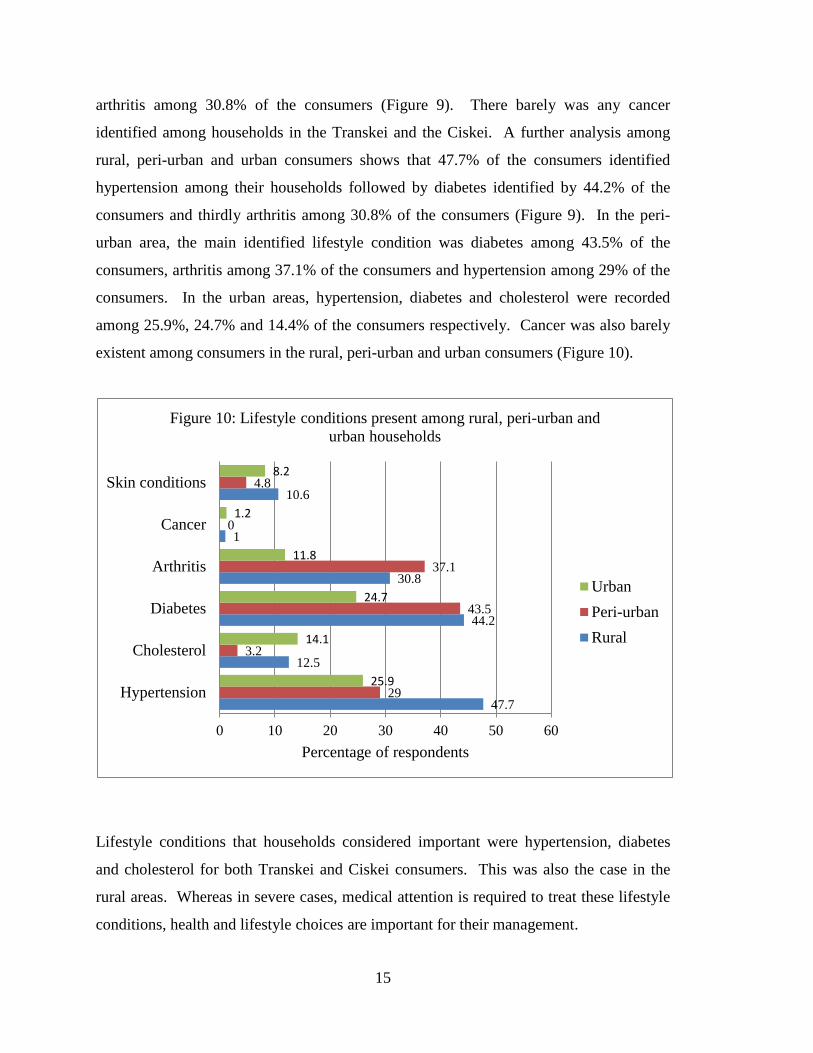
identified among households in the Transkei and the Ciskei. A further analysis among
rural, peri-urban and urban consumers shows that 47.7% of the consumers identified
hypertension among their households followed by diabetes identified by 44.2% of the
consumers and thirdly arthritis among 30.8% of the consumers (Figure 9). In the peri-
urban area, the main identified lifestyle condition was diabetes among 43.5% of the
consumers, arthritis among 37.1% of the consumers and hypertension among 29% of the
consumers. In the urban areas, hypertension, diabetes and cholesterol were recorded
among 25.9%, 24.7% and 14.4% of the consumers respectively. Cancer was also barely
existent among consumers in the rural, peri-urban and urban consumers (Figure 10).
Lifestyle conditions that households considered important were hypertension, diabetes
and cholesterol for both Transkei and Ciskei consumers. This was also the case in the
rural areas. Whereas in severe cases, medical attention is required to treat these lifestyle
conditions, health and lifestyle choices are important for their management.
47.7
12.5
44.2
30.8
1
10.6
29
3.2
43.5
37.1
0
4.8
25.9
14.1
24.7
11.8
1.2
8.2
0 10 20 30 40 50 60
Hypertension
Cholesterol
Diabetes
Arthritis
Cancer
Skin conditions
Percentage of respondents
Figure 10: Lifestyle conditions present among rural, peri-urban and urban households
UrbanPeri-urbanRural
16
9. Traditional food taboos in the Eastern Cape.
Traditional food taboos were not a common occurrence in the study area with less than
5% of the consumers across the various study sites identifying some of the traditional
food taboos. On a comparative basis many food taboos seem to make no sense at all, as to
what may be declared unfit by one group may be perfectly acceptable to another (Koehler
& Leonhaeuser, 2008). On the other hand, food taboos have a long history and one ought
to expect a sound explanation for the existence (and persistence) of certain dietary
customs in a given culture. Yet, this is a highly debated view and no single theory may
explain why people employ special food taboos (Mintz & Du Bois, 2002) .Traditional
food taboos are a hindrance to choice variation and lifestyle choices available to
consumers who subscribe to these taboos. Traditional Food taboos identified in the
Eastern Cape during the study were:
Ntsangu-Ntsangu is a weed found in the gardens which looks more like dagga
("ntsangu'' in xhosa) it is not for human consumption as it is believed that if you
eat it you will get mad.
Velemampondweni is another wild plant found in gardens which is believed to
have originated from the Pondoland hence the name, it also believed to bring
madness to the family when consumed.
Dungamzi is a bad luck plant that no one is allowed to bring it to the house and
also not for consumption as it brings a bad omen to the household
Mpungempu similar to Velempondweni but it’s a taboo mainly in the Transkei
area.
Ntebe and Gcamnge are types of wild weed which are not be eaten and also
associated with madness when consumed.
Vumbangweis a plant notfor human consumption but used for dandruff treatment
in some areas of Pondoland.
Young girls and women are prohibited from consuming fresh milk from the
Kraal. This refers to animal milk (cow, goat and sheep) especially in rural areas
where milk comes from the kraal.
17
Eggs should not be consumed by girls in puberty and pregnant women. In the
Xhosa culture women and young girls were not allowed to eat them in the olden
days and some households still practise this today as it is associated with fertility,
child birth and enhanced sexual activity.
Food taboos vary among different societies and individuals. Traditional views about food
are liable to change under the influence of neighbouring communities, travel and
education. Many taboos concern the consumption of protein-rich animal foods, often by
those groups of the community most in need of protein. A common taboo in Africa
against the consumption of eggs is rapidly disappearing. This taboo usually applies to
females, who are said to become sterile if they eat eggs. The psychological connection
between human fertility and the egg is obvious. In other places the custom applies to
children, perhaps to discourage them from stealing the eggs of setting hens, which would
endanger the survival of poultry.
Buruiana (2003) argues that food taboos, whether scientifically correct or not, are often
meant to protect the human individual and the observation, for example, that certain
allergies and depression are associated with each other could have led to declaring food
items taboo that were identified as causal agents for the allergies. Moreover, any food
taboo, acknowledged by a particular group of people as part of its ways, aids in the
cohesion of this group, helps that particular group maintain its identity in the face of
others, and therefore creates a feeling of "belonging" (Buruiana 2003).
18
10. Factors affecting the consumer awareness of organic products
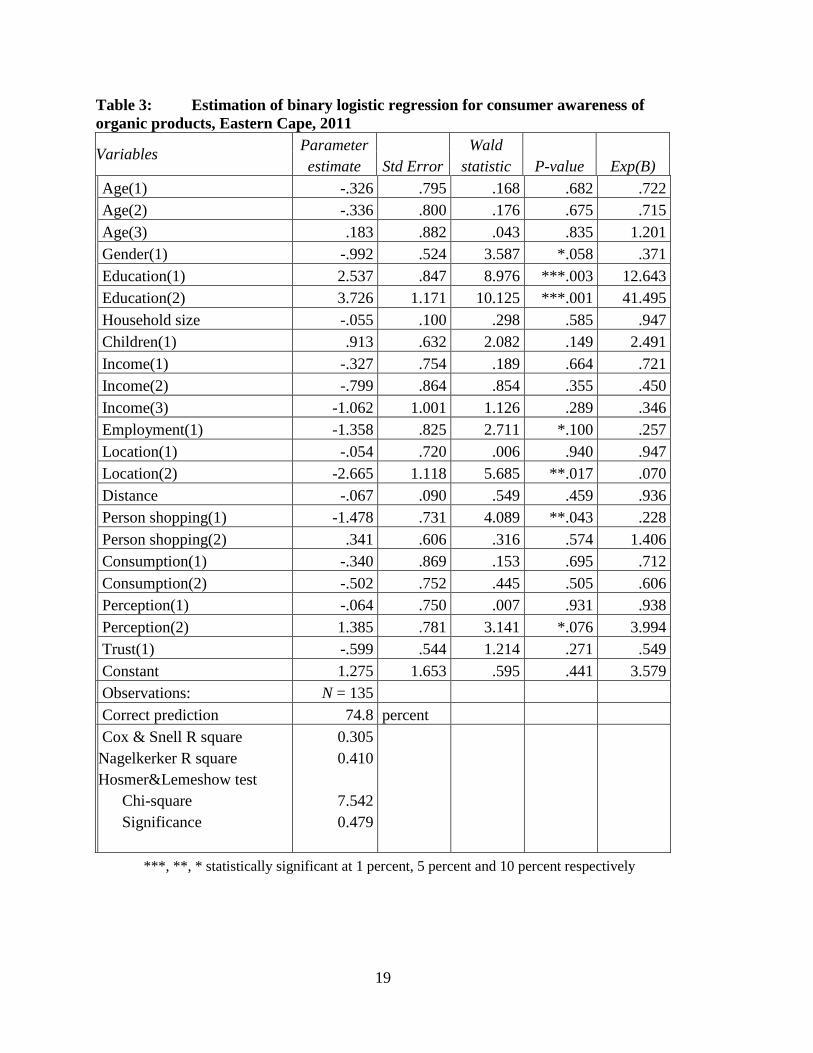
The results of the logistic regression that estimates consumer awareness of organic
products are presented in Table 3 below. The results of the omnibus test of model
coefficients were highly significant with P<0.001 with a chi-square value of 49.137. The
Hosmer and Lemeshow test also supports the model as being worthwhile. Pallant (2007)
argues that this test is the most reliable test for goodness of fit in SPSS. The chi-square
value for the Hosmer and Lemeshow test is 7.542 with a significance level of 0.479. This
value is greater than 0.05 indicating support for the model. The model as a whole
explained between 30.5 percent (Cox and Snell R square) and 41 percent (Nagelkerke R
square) of the variability in the consumer’s awareness status.
The accuracy of classification was estimated at 74.8 percent with the sensitivity of the
model showing that 64.9 percent of the consumers who are aware of organic products
being correctly classified while the specificity of the model is 82.1 percent (indicating
that the consumers who are not aware of organic products have been correctly classified).
The positive predictive value indicates that of the consumers predicted to be aware of
organic products, the model accurately picked 72.6percent (Peat, 2001; Wright, 1995).
According to Table 3, the major factors influencing consumer awareness of organic
products are: gender, education, employment, location, person responsible for shopping
and the price perception.
Gender was statistically significant at 10 percent and negatively correlated to consumer
awareness. These results imply that male were more likely to be aware about organic
products that female. This can be attributed to access of information by males compared
to females. Briz and Ward (2009) also found that males showed a slightly higher level of
awareness than females. Education was positively correlated to consumer awareness and
statistically significant at 1 percent level of probability. This results support previous
findings that reported that consumers with higher level of education were more likely to
be aware about organic products than those with low levels of education (Gracia and
Magistris, 2007).
19
Table 3: Estimation of binary logistic regression for consumer awareness of organic products, Eastern Cape, 2011
Variables Parameter estimate Std Error
Wald statistic P-value Exp(B)
Age(1) -.326 .795 .168 .682 .722 Age(2) -.336 .800 .176 .675 .715 Age(3) .183 .882 .043 .835 1.201 Gender(1) -.992 .524 3.587 *.058 .371 Education(1) 2.537 .847 8.976 ***.003 12.643 Education(2) 3.726 1.171 10.125 ***.001 41.495 Household size -.055 .100 .298 .585 .947 Children(1) .913 .632 2.082 .149 2.491 Income(1) -.327 .754 .189 .664 .721 Income(2) -.799 .864 .854 .355 .450 Income(3) -1.062 1.001 1.126 .289 .346 Employment(1) -1.358 .825 2.711 *.100 .257 Location(1) -.054 .720 .006 .940 .947 Location(2) -2.665 1.118 5.685 **.017 .070 Distance -.067 .090 .549 .459 .936 Person shopping(1) -1.478 .731 4.089 **.043 .228 Person shopping(2) .341 .606 .316 .574 1.406 Consumption(1) -.340 .869 .153 .695 .712 Consumption(2) -.502 .752 .445 .505 .606 Perception(1) -.064 .750 .007 .931 .938 Perception(2) 1.385 .781 3.141 *.076 3.994 Trust(1) -.599 .544 1.214 .271 .549 Constant 1.275 1.653 .595 .441 3.579
Observations: N = 135 Correct prediction 74.8 percent Cox & Snell R square Nagelkerker R square Hosmer&Lemeshow test Chi-square Significance
0.305 0.410
7.542 0.479
***, **, * statistically significant at 1 percent, 5 percent and 10 percent respectively
20
Briz and Ward (2009) revealed the profound importance of education in the organic food
industry. They noted that education and awareness of organic foods showed a close linear
relationship where the probabilities almost double between the lowest and highest levels of
education. While the purchasing power of lower education level consumers may be limited, the
potential payoff from promoting organic foods to the lower educated groups may produce
marginal gains incrementally since their percentages are quite low. Employment was statistically
significant at 10 percent level of probability and was negatively correlated to consumer
awareness. This result is unexpected and may be explained by the fact that consumers with no
employment would most likely use traditional methods of production (no chemicals applied) due
to the prohibitive costs of chemical inputs and other pesticides. In this study it was established
that most of the consumers who used traditional methods of production and did not used
chemical and other pesticides but rather animal manure referred to this as their understanding of
organic methods of productions. These consumers were thus more likely to be aware of organic
products as those products produced using these traditional methods.
The location of the consumer is significant at 5 percent level of probability and positively
correlated to organic awareness. Rural consumers were less likely to be aware about organic
products that urban consumers. This can be attributed to the fact that organic products currently
target a niche market which is the upper middle class and the modes of marketing the products
through mass media are more accessible to urban consumers than rural consumers. However any
government or private sector programs to inform the public about organics should probably be
national in scope and contrasted to focus on rural, peri-urban and urban consumers, if the organic
industry is to grow and be sustainable.
The person responsible for shopping was statistically significant at 5 percent level of probability
and positively correlated to organic awareness. Consumers who shopped jointly with other
members’ of the household were more likely to be aware of organic products than those who
shopped alone. This can be attributed to discussions and sharing or information among shoppers
on the different products available in the market. It also increases the chance of a purchase
decision being made. The consumer’s perception of price was statistically significant at 5
percent. Consumers who perceived the price of organic products as high were less likely to be
21
aware of organic products than those who did not think the price of organic was high. This can
be attributed to consumer’s reluctance to consume organics due to perceived high prices and
would shy away from organic products.
11. Determinants of organic products consumption in the Eastern Cape
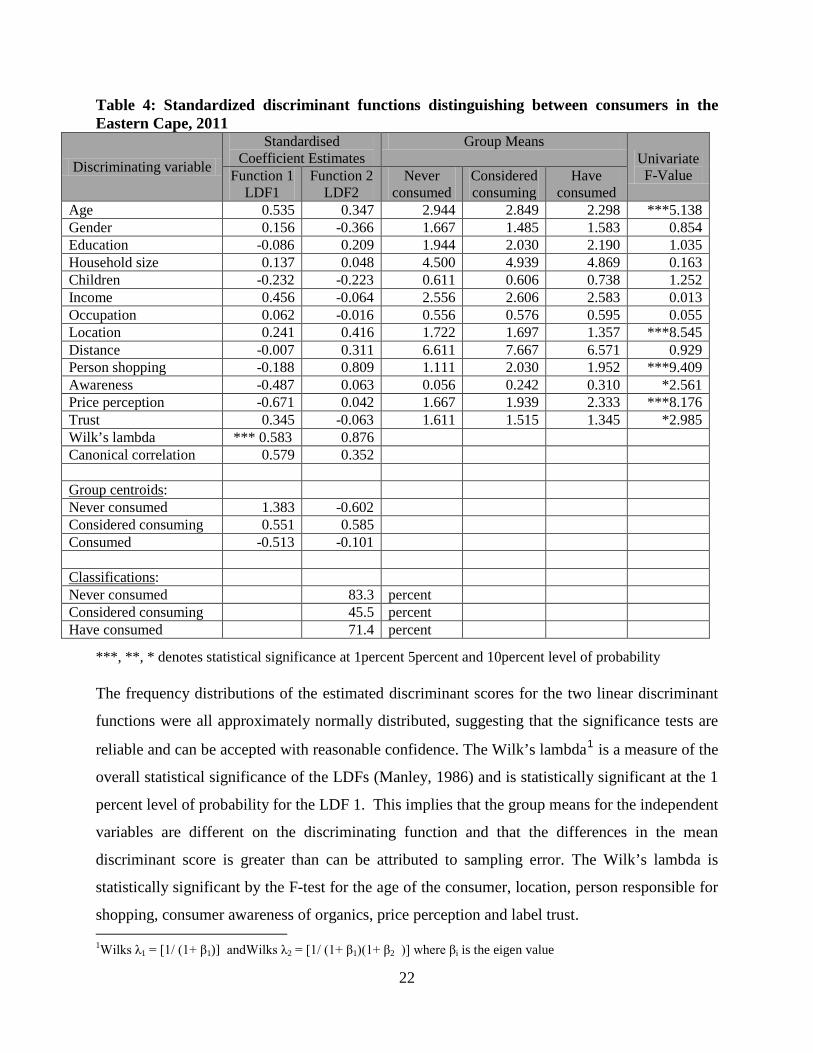
The results of the discriminant analysis are presented in Table 4 below. The estimated LDF
coefficients show the relative importance of the independent variables because they are
standardized and unit-free (Harris, 1985). The first LDF1 (Table 4) identifies price perception
and age of the consumer as the most important variables distinguishing the consumers who have
never consumed organics against those that have consumed organics. This is probably because if
the consumer perceives the price of organics as high they are less likely to consume organics.
The contrary is true if the consumer perceives the price of organics as reasonable. Price
perceptions have generally been considered as an important factor in consumers’ willingness to
pay for organics (Canavari, Nocella and Scarpa, 2003; Laroche, Toffoli, Kim and Muller, 1996).
Some researchers on the other hand have found that organic food consumers are less likely to
consider price as important (Williams and Hammitt, 2000).
Cobo and Gonzales (2001) found that organic consumers were most likely between 25 and 54
years old. Thompson (1998) indicated that the highest percentage of consumers buying organics
were aged 18 – 29 and 40 - 49 years and the least likely were those over 60 years. This indicate
that age is considered important and understanding the age dynamics and consumption of
organics will go a long way in influencing the target market and marketing approach to drive the
demand of organics. The second LDF 2 identified the person responsible for shopping and the
location of the consumer as discriminating factors between those who have never consumed
organics and those that consider consuming organics. The person responsible for shopping is
most likely to make the decision on the composition of the food basket and the location of the
consumer will determine accessibility and trends within a given locality and will influence the
consumer’s decisions.
22
Table 4: Standardized discriminant functions distinguishing between consumers in the Eastern Cape, 2011
Discriminating variable
Standardised Coefficient Estimates
Group Means Univariate F-Value Function 1
LDF1 Function 2
LDF2 Never
consumed Considered consuming
Have consumed
Age 0.535 0.347 2.944 2.849 2.298 ***5.138 Gender 0.156 -0.366 1.667 1.485 1.583 0.854 Education -0.086 0.209 1.944 2.030 2.190 1.035 Household size 0.137 0.048 4.500 4.939 4.869 0.163 Children -0.232 -0.223 0.611 0.606 0.738 1.252 Income 0.456 -0.064 2.556 2.606 2.583 0.013 Occupation 0.062 -0.016 0.556 0.576 0.595 0.055 Location 0.241 0.416 1.722 1.697 1.357 ***8.545 Distance -0.007 0.311 6.611 7.667 6.571 0.929 Person shopping -0.188 0.809 1.111 2.030 1.952 ***9.409 Awareness -0.487 0.063 0.056 0.242 0.310 *2.561 Price perception -0.671 0.042 1.667 1.939 2.333 ***8.176 Trust 0.345 -0.063 1.611 1.515 1.345 *2.985 Wilk’s lambda *** 0.583 0.876 Canonical correlation 0.579 0.352 Group centroids: Never consumed 1.383 -0.602 Considered consuming 0.551 0.585 Consumed -0.513 -0.101 Classifications: Never consumed 83.3 percent Considered consuming 45.5 percent Have consumed 71.4 percent
***, **, * denotes statistical significance at 1percent 5percent and 10percent level of probability
The frequency distributions of the estimated discriminant scores for the two linear discriminant
functions were all approximately normally distributed, suggesting that the significance tests are
reliable and can be accepted with reasonable confidence. The Wilk’s lambda1 is a measure of the
overall statistical significance of the LDFs (Manley, 1986) and is statistically significant at the 1
percent level of probability for the LDF 1. This implies that the group means for the independent
variables are different on the discriminating function and that the differences in the mean
discriminant score is greater than can be attributed to sampling error. The Wilk’s lambda is
statistically significant by the F-test for the age of the consumer, location, person responsible for
shopping, consumer awareness of organics, price perception and label trust. 1Wilks λ1 = [1/ (1+ β1)] andWilks λ2 = [1/ (1+ β1)(1+ β2 )] where βi is the eigen value
23
The LDF1 accounts for 78.1 percent of the variation between the consumer groups. The group
centroids are quite different for the three groups for each LDF. The results show reasonable
explanatory power, with the percent of overall correct predictions estimated at 66.7 percent. The
percentage of correct classification for each stratum is 83.3 percent for those who have never
consumed organic, 45.5 percent for those who have considered consuming organics and 71.4
percent for those that have consumed organics (Table 4).
According to the results in Table 4 the age of the consumer was statistically significant at 1
percent level of probability and positively correlated to consumption. This result indicates that
older consumers were more likely to consume organics compared to younger consumers. This
may be attributed to the fact that aging populations are more concerned with their health and
hence more likely to purchase organics (Padel and Foster, 2005) as organic consumers are
mainly those that are health conscious (Baker, Thompson and Engelken, 2004). The results
support findings by Tsakiridou, Boutsouki, Zotos & Mattas (2008) who indicated that older
consumers were more health conscious and willing to pay an extra price for organics. Clearly
for the organic food industry, gains are needed among all age groups but particular efforts among
the youngest generation may be incrementally more beneficial since their awareness levels are
lower.
The location of consumer was statistically significant at 1 percent level of probability and was
positively correlated to the consumption of organic products. The results show that consumers
residing in the Ciskei were more likely to consume or consider consuming organics compared to
consumers residing in the Transkei. The Ciskei consumer was more readily exposed to organic
products compared to the Transkei consumer due to the cosmopolitan nature of the Ciskei
compared to the Transkei. While majority of the Transkei is classified as rural, the Ciskei
include the economic and industrial hub of the province harbouring the major towns, airports
and industrial zones. The provincial headquarters are also located in the Ciskei. According to
Briz & Ward (2009), predominantly rural areas are slightly less likely to be exposed to organic
foods. The major organic retail markets are also based in the Ciskei as are the organic farmer’s
markets example Lavender Blue in East London which is popular for the selling of organic
products.
24
The person responsible for household food shopping was statistically significant at 1 percent
level of probability and negatively correlated with the consumption of organic food. The
consumer who was personally responsible for the household food shopping was more likely to
consume organics than if this was a joint responsibility. This could be attributed to personal
consciousness and decision making with less external influence. Consumption of organics is
more of an individual choice than a choice made jointly or after consultation.
Consumer awareness of organic products was statistically significant and negatively correlated to
consumption of organic products. This finding supports several studies that have indicated that
while consumer awareness of organic food is the first step in developing demand for organic
products, awareness does not necessarily equate consumption. Briz and Ward (2009) argue that
while success with organic foods depends on consumer acceptance and use, potential consumers
may not even be aware of organic foods or may have the wrong perception even when aware.
According to Rezai, Mohamed and Shamsudin (2011) more knowledge could lead to increased
use of organics as suggested with the link between awareness and purchases. Yet complete
knowledge does not assure continued increases in demand since potential consumers may
discover attributes that differ little from non-organic alternatives. To the extent that demand for
organics is based on credence attributes and consumer emotions, the linkage between awareness
and consumption may be nonlinear and for some level of awareness possibly not even positive
(Jensen, 2008). That implies that the learning curve about organics may not always lead to
increasing demand.
The price perception was statistically significant at 1 percent level of probability and negatively
correlated to consumer awareness of organics. Whereas consumers generally conceded that the
prices of organic were somewhat high to really high, in the Eastern Cape, Aryal, Chaudhary,
Pandit, and Sharma (2009) argues that production and marketing strategies of organic products are
determined considering the willingness to pay a premium price. Dipeolu, Philip, Aiyelaagbe,
Akinbode and Adedokun (2009) and Salleh, Ali, Harun, Jalil and Shaharudin (2010) also
confirmed findings that consumers are willing to pay more for organic foods or what could also
be referred to as the ethical premium.This niche consumer is willing to pay an extra price for
25
health and safety, animal welfare as well as the beneficial effect to the environment. Studies
where health and environmental benefits were considered as the main factors to consume
organics include among others (Hill and Lynchehaun, 2002; Makatouni (2002) and McEachern
and McClean (2002). These studies noted that consumers were willing to pay more for health,
safety and environmental consciousness.
There was a positive and statistically significant relationship between consumers who trust
organic food labels and the consumption of organic foods. Consumers who fully trusted organic
labels were more likely to consumer organics that those who were weary of organic food labels.
Trust was statistically significant at 1 percent level of probability. This result supports findings
by Krystallis and Chryssohoidis (2005) and Raab and Grobe (2005) who found that trust for
regulatory authorities and brand labeling positively impacted on the purchase of organic foods.
Trustworthy eco-labels provide consumers with valuable information on environmentally friendly
products and thus promote green consumerism (Boström 2006). Boström and Klintman (2008)
argue that low governmental involvement increases confidence and trust for eco-ecolabels. In this
study majority of the consumers responded that they would prefer verification and labelling of
organic products to be done by an independent company. This suggests that government should just
provide the basic legal framework for eco-labelling and leave the rest to independent. Nilsson,
Tunçer, and Thidell (2004) state that independence of the verification and certification of organic
products impacts positively on the consumer’s confidence of the product and is an indication of the
trust of the organic label.
12. Conclusion This paper has established the growing importance of organic products in the food system of the
Eastern Cape Province which warrants a systematic investigation into consumer preferences and
buying behaviour. Factors influencing choice revolve around issues that are amenable to
manipulation by advocacy and policy, including such questions as the consideration of organic
products as healthier and more nutritious with better appearance and taste, as well as being more
affordable and safe. There is a strong role for the private sector in promoting the consumption of
organic products whose demand outlook is quite bright. This is particularly crucial in view of the
finding that consumers respond to food labelling quite significantly which throws the challenge
to agro-business management for more innovative packaging and displays to enhance the appeal
26
of organic products. It is also important that government finds ways of integrating organic foods
issues into the on-going agricultural restructuring process by providing the basic legal framework
for eco-labelling, among other actions to create an enabling environment for private sector
operations.
REFERENCES
Aryal, K. P, Pashupati C., Sangita, P., and Govinda S.. 2009. Consumers' willingness to pay for organic products: a case from Kathmandu Valley. The Journal of Agriculture and Environment 10:12-22.
Baker, S., Thompson, K., and Engelken, J., 2004. Mapping the values driving organic food choice: Germany vs. the UK and UK vs. Germany. European Journal of Marketing 38 (8), 995 – 1012.
Boström, M. 2006a. Establishing credibility: Practising standard-setting ideals in a Swedish seafood-labelling case. Journal of Environmental Policy and Planning 8(2): 135–158.
Boström, M., and M. Klintman. 2008. Eco-standards, product labeling, and green consumerism. New York, NY: Palgrave Macmillan.
Briz, T and Ward R.W. (2009). Consumer awareness of organic products in Spain: An application of multinomial logit models. Food Policy 34 (2009) 295–304.
Buruiana C: Taboos and social order. The socio-anthropological deciphering of interdictions. Revista Romana de Sociologie 2003, 14:529-533.
Canavari, M., Nocella, G., and Scarpa, R. (2003). Stated willingness to pay for environment-friendly production of apples and peaches: web-based versus in-person surveys. paper presented at the 83rd EAAE Seminar, Chania, 4-6 September, Via Website: www.maich/eaae.gr Accessed on 3rd December 2009 .
Cobo, F.B., and y González, L., 2001. La agricultura ecológica ante la gran distribución. Revista Distribución y Consumo. Año 11. Núm. 60. Nov-Dic.
Cuesta, J. (2011). Food Price Trends. Food Price Watch, World Bank. [online]. http://siteresources.worldbank.org/INTPOVERTY/News%20and%20Events/22982477/Food-Price-Watch-August-2011.htm. Accessed 14 September 2011
Dipeolu,AO., Philip,BB., Aiyelaagbe,IOO., Akinbode, SO., and Adedokun, TA(2009) (2009). Consumer awareness and willingness to pay for organic vegetables in S.W. Nigeria. Asian Journal of Food and Agro-IndustrySpecial Issue, S57-S65.
27
FAO, 2009a. High Prices and Volatility in Agricultural Commodities, Rome: FAO
Gracia, A and Magistris, T (2008), “The demand for organic foods in the South of Italy: A discrete choice model”, Food Policy, Vol. 33, pp. 386-396.
GROLINK (2002). Feasibility Study for the Establishment of Certification Bodies for Organic Agriculture in Eastern and Southern Africa, Report commissioned by Sida/INEC, Höje.
Hill, H. and Lynchehaun, F. 2002. Organic milk: Attitudes and consumption patterns. British Food Journal. 104(7): 526-542.
IFAD, 2003. The adoption of organic agriculture among small farmers in Latin America and the Caribbean: Thematic evaluation. Rome, IFAD. April 2003. Report No. 1337.
IFAD, 2005. Organic agriculture and poverty reduction in Asia: China and India focus. Thematic evaluation. Rome, IFAD. July 2005. Report No. 1664.
Irwin, B. L. (2002). Small-Scale Previously Disadvantaged Producers in the South African Organic Market: Adoption Model and Institutional Approach. A Masters Dissertation.Michigan State University. Department of Agricultural Economics.
Koehler J, and Leonhaeuser IU: Changes in food preferences during aging. Ann Nutr Metab 2008, 52(suppl 1):15-19.
Krystallis, A. and G. Chryssohoidis. 2005. Consumers’ willingness to pay for organic food: Factors that affect it and variation per organic product type. British Food Journal 107(5): 320- 343.
Laroche M., Toffoli, R., Kim, C. Ad Muller, T.E. (1996), “The influence of culture in pro-environment knowledge, attitude and behaviors: a Canadian perspective”, Advances in Consumer Research, Vol. 23, pp. 53 – 62.
Makatouni, A. (2002). What motivates consumers to buy organic food in the UK? British Food Journal,104, 345-352.
Manley, B.F.J. 1986. Multivariate statistical methods: a primer. Chapman and Hall, London.
McEachern, M.G., and McClean, P. (2002). Organic purchasing motivations and attitudes: Are they ethical? International Journal of Consumer Studies, 26(2), 85-92.
Mintz SW, Du Bois CM: The anthropology of food and eating. Annu Rev Anthropol 2002, 31:99-119.
Nilsson, H., B. Tunçer, and Å. Thidell. 2004. The use of eco-labeling like initiatives on food products to promote quality assurance—is there enough credibility? Journal of Cleaner Production 12(5): 517–526.
28
Organic Trade Association, 2007. Manufacturer Survey. www.ota.com
Padel, S., and Foster, C., 2005. Exploring the gap between attitudes and behaviour: Understanding why consumers buy or do not buy organic food. British Food Journal, 107 (8), 606 – 625.
Rezai, G., Mohamed, Z.,and Shamsudin, MN (2011). Malaysian consumer’s perceptive towards purchasing organically produce vegetable. 2nd international conference on business and economic research (2nd ICBER 201 1) Proceeding 1774.
Salleh, MM., Ali, SM, Harun, EH; Jalil, MA., and Shaharudin, MR(2010). Consumer’s Perception and Purchase Intentions Towards Organic Food Products: Exploring Attitude Among Academician /Canadian Social Science Vol.6 No.6, 2010.
Thompson, G.D., 1998. Consumer demand for organic foods: what we know and what we need to know. Am. J. Agri. Eco. 80 (5), 1113–1118.
Tsakiridou, E, Boutsouki, C, Zotos, Y and Mattas, K 2008, Attitudes and behaviour towards organic Products: an exploratory study, International Journal of Retail & Distribution Management, vol. 36, no. 2, pp.158 - 175.
UNCTAD-UNEP. 2008. Organic agriculture and food security in Africa. UNEP-UNCTAD Capacity-Building Task Force on Trade, Environment and Development. United Nations, New York and Geneva.
Williams, P., and Hammitt, K., 2000. A Comparison of Organic and Conventional Fresh Produce Buyers in the Boston Area. Risk Analysis Journal, 20 (5), 735-746.
World Bank (2010). Global Food Prices. Food Price Watch. World Bank. [Online] http://siteresources.worldbank.org/INTPOVERTY/Resources/335642210859591030/FINAL _Food_Price_Watch_Feb2010.pdf. Accessed 15 June 2011.
Wright, R.E. (1995). Logistic regression in L.G. Grimm & P.R. Yarnold, eds., Reading and understanding multivariate statistics. Washington, DC: American Psychological Association.
Yiridoe, E., Bonti-Ankomah, S., and Ralph, C., 2005. Comparison of consumer perceptions and preference toward organic versus conventionally produced foods: a review and update of the literature. Renewable Agriculture and Food Systems 20, 193–205.