Embed Size (px)
Citation preview
Aquaculture. 92 (1991) 165-178 Elsevier Science Publishers B.V., Amsterdam
165
Differences in growth, morphometric traits, and male sexual maturity among Pacific white shrimp,
Penaeus vannamei, from different commercial hatcheries
Seinen Chow* and Paul A. Sandifer Marine Resources Research Institute, POB 12559, Charleston, SC 29412, US.4
(Accepted 22 June 1990)
ABSTRACT
Chow, S. and Sandifer, P.A., 1991. Differences in growth, morphometric traits, and male sexual ma- turity among Pacific white shrimp, Penaeus vannamei, from different commercial hatcheries. Aqua- culture. 92: 165-178.
Postlarvae of Penaeus vannamei from four commercial hatcheries (lots) were divided between two laboratory sites. Body length, body weight, condition factor, male sexual maturity, and ratios of the tail length and carapace width to body length, were monitored at days 50, 80, I 10. 170, 200.230 and 270. There were small differences in body size between sexes within each lot at all age groups. Consis- tent differences were observed between sexes in the proportional variables for all age groups and sites. Males had a larger average tail length ratio than females, while females had a larger average carapace width ratio and higher average condition factor than males. Average tail length ratio of younger age groups was smaller and the average condition factor was lower than those of the older groups.
Significant differences in all of the morphometric traits were found between sites, indicating that the environmental differences affected not only the growth but also the shape of the shrimp. Rank order of the lots for all of the morphometric traits varied among age groups and between sites. How- ever, certain lots consistently exhibited significantly smaller values for the proportional variables than other lots, independent of age and site. Percent of maturing males was significantly different among lots, and the rank order was consistent for ages and sites. These results suggest the presence of genetic differences for morphometric traits and male sexual maturity among the shrimp hatchery lots, al- though the traits are largely affected by environmental variance.
INTRODUCTION
There has been little attempt to date to genetically improve decapod crus- taceans for aquaculture. This is largely because of the dearth of pertinent in- formation. A few studies have dealt with genetic variation in quantitative
*Present address: RSMAS, University of Miami, 4600 Rickenbacker Causeway, Miami, FL 33149-1098, USA.
0044-8486/91/$03.50 0 1991 - Elsevier Science Publishers B.V.
166 S. CHOW AND P.A. SANDIFER
traits of decapod crustaceans (Hedgecock et al., 1976; Hedgecock and Nelson, 1978; Malecha et al., 1984; Lester, 1988; Lutz and Walters, 1989). However, a number of surveys have attempted to detect differences in mor- phometric traits between sexes and among localities and size groups for pen- aeid shrimps (Anderson and Lindner, 1958; Fontaine and Neal, 1968; Klima, 1969; Villaluz et al., 1969; Fontaine and Neal, 197 1; Thomas, 1975; Farmer, 1986; Huang et al., 1989). While useful, these studies have been limited be- cause the samples came from wild populations which differed in age, paren- tage, and location.
In the present paper, we report observations on differences in growth, mor- phometric traits and male sexual maturity among production lots of Penaeus vannamei from four hatcheries. These lots had the advantages that the ani- mals were all of similar age, that they resulted from a quite small (but, unfor- tunately, undefined group of parents) and that, within a lot, they were sub- jected to virtually identical rearing conditions.
MATERIALS AND METHODS
Rearing condition Separate lots of postlarval Penaeus vannamei were acquired from four com-
mercial hatcheries, designated as A, B, C and D, in February 1988. (These same lots of postlarvae were designated A, D, B and C, respectively, by Stokes et al., 1989). Since the postlarvae came from different hatcheries, it was im- possible to standardize their ages. Thus, the lots of animals were introduced into the laboratory rearing system at ages PL27 (27 days following the molt to postlarvae), PL19, PL13, and PL8 in lots A-D, respectively. No informa- tion was available on the size of the parental groups for each lot, and it was assumed that some or all of the lots were mixed offspring from several fami- lies. Each lot was divided into two groups, one reared at the Marine Resources Research Institute (MRRI) in Charleston, SC, and the other reared at the Waddell Mariculture Center (WMC) near Bluffton, SC.
At MRRI, 700 postlarvae from each lot were placed into concrete tanks (2.9 x 1.2x0.8-0.9 m deep) at a density of 200 shrimp/m* of tank floor. Sea- water ( lo-34 ppt) was circulated through a biological filter and returned to the tank at a rate of 12 l/min. Tap water was added weekly to replace losses to evaporation and cleaning, and half the total volume of seawater in the sys- tem was replaced with fresh filtered seawater every 2 months. The juveniles were fed minced squid and shrimp meat for the first 50 days of the study and a 38% protein commercial trout feed (Zeigler Brothers, Gardener, PA) there- after. The shrimp were fed twice daily morning and evening. Water tempera- ture ranged from 19 to 32 ‘C.
At WMC, the postlarvae were first stocked in circular fiberglass tanks ( 1.8 m diameter and 0.8 m deep) at 645 shrimp/m* of tank floor. They were fed
DIFFERENCES AMONG PACIFIC WHITE SHRIMP FROM DIFFERENT HATCHERIES 167
three times daily with frozen adult Artemia, chopped squid, postlarval diet and commercial shrimp grow-out pellets (Zeigler Brothers, Gardener, PA). Continuous water flow was maintained at an exchange rate of 170%/day. On day 70, the juvenile shrimps were transferred into larger circular fiberglass tanks (6 m diameterx0.8 m deep) at 30 shrimp/m’ of tank floor. A 40% protein shrimp grow-out diet (Zeigler Brothers) was fed three times/day, with chopped squid offered as a supplemental food three times/week. Water ex- change rate in these tanks was 59%/day. Temperature and salinity ranged from 20 to 33°C (mean, 27.8”C) and 30 to 32 ppt (mean, 31 ppt).
Measurements Measurements of individuals exhibiting body deformities were excluded
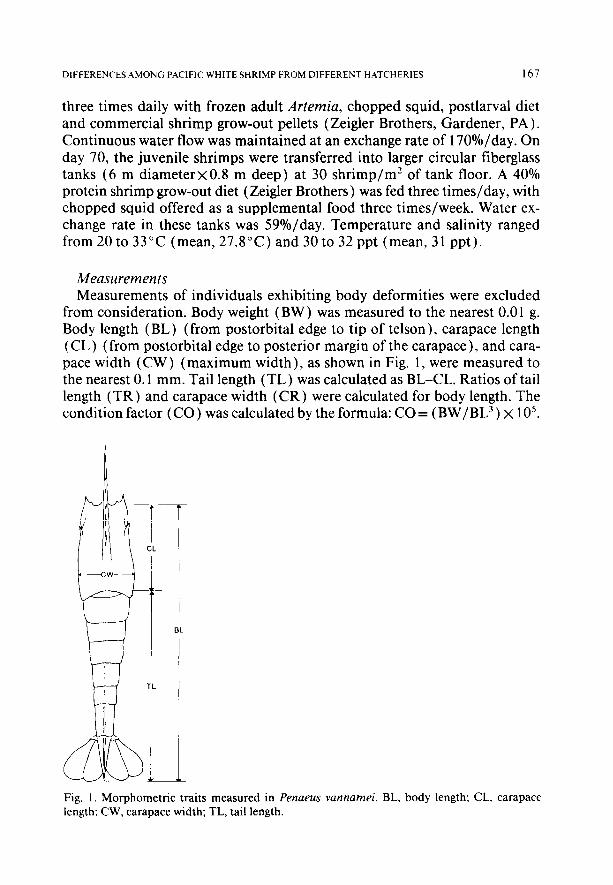
from consideration. Body weight (BW ) was measured to the nearest 0.0 1 g. Body length (BL) (from postorbital edge to tip of telson), carapace length (CL) (from postorbital edge to posterior margin of the carapace), and cara- pace width (CW) (maximum width), as shown in Fig. 1, were measured to the nearest 0.1 mm. Tail length (TL) was calculated as BL-CL. Ratios of tail length (TR) and carapace width (CR) were calculated for body length. The condition factor (CO) was calculated by the formula: CO = ( BW/BL3) x 1 05.
Fig. 1. Morphometric traits measured in Penaeus vannamei. BL. body length; CL, carapace length: CW, carapace width; TL, tail length.
168 S. CHOW AND P.A. SANDIFER
After day 110, sex could be determined by observing the male and female gonopores. After day 170, male sexual maturity was determined according to the appearance of the terminal ampullae. Males possessing full, whitish ter- minal ampullae were recorded as maturing males. At MRRI, the samples measured on days 50, 80 and 110 were not returned to the tanks following examination. Measurements were carried out only on day 230 at WMC. Sur- vival counts were made on day 270 at MRRI and on days 70 and 195 at WMC.
The absolute (BL and BW) and relative (TR, CR and CO) variables were log-transformed for analyses of variance (ANOVA) which were performed for sex, stock, age group and site. Duncan’s multiple-range test was used to determine rank order among lots, age groups and sexes. The G-test, using a contingency table, was employed to detect differences in the number of ma- turing males among the four hatchery lots and between the two rearing sites.
RESULTS
Survival A total of 143 to 150 individuals was removed from each lot reared at MRRI
during sampling on days 50,80 and 110. These shrimps were subtracted from the initial population size (700) for each lot, and survival at day 270 was conservatively estimated, based on corrected initial population size of 550- 557 shrimp/lot. Lot A showed the highest overall survival rate (50.7%), fol- lowed by B (29.0%)) C ( 14.4%) and D ( 7.0%). Similar trends were observed among the lots reared at WMC. At day 70, survival rates were 82.4,67.4,60.8 and 37.9% for lots A-D, respectively. Survival from day 70 to day 195 fol- lowed the same pattern, with 76.8, 63.8, 73.2 and 55.9% in lots A-D, respec- tively. Although these data were not amenable to statistical analyses, the four hatchery lots exhibited clear differences in relative survival in laboratory cul- ture,withA>B>C>D.
Body size Significant differences in body length and weight were observed among the
four hatchery lots (Tables 1 and 2). These differences varied somewhat over the culture period, and Duncan’s multiple-range test indicates that the rank order of the lots was not consistent over time or between sites. However, the shrimp in lot D tended to be larger than those in the other lots from day 200 onward, reflecting lot D’s lower survival and correspondingly lower popula- tion density. At day 110, males were signilicantly larger than females in both length and weight, but at the end of the study (day 230 at WMC and day 270 at MRRI ) , females tended to be slightly heavier than males (Table 2 ) .
DIFFERENCES AMONG PACIFIC WHITE SHRIMP FROM DIFFERENT HATCHERIES 169
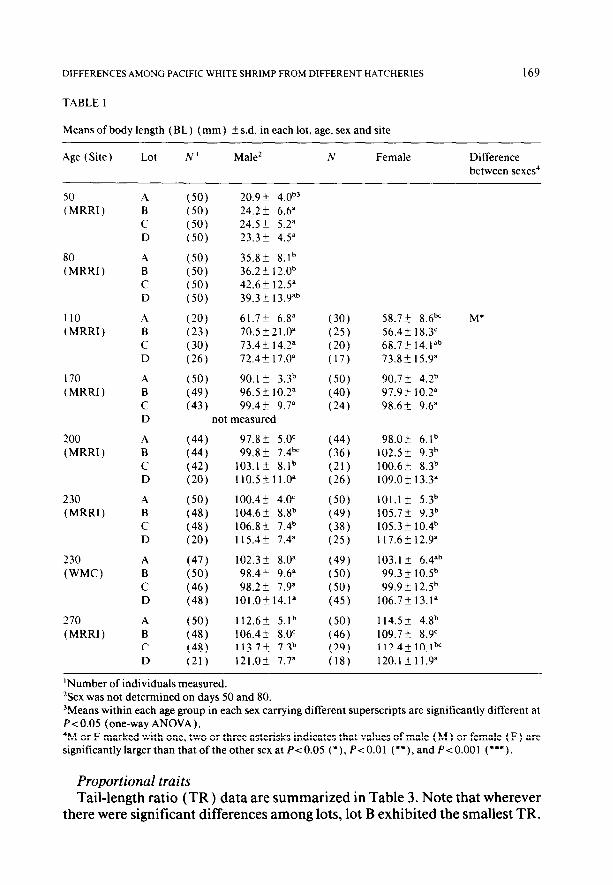
TABLE 1
Means of body length (BL) (mm) + s.d. in each lot, age, sex and site
Age (Site) Lot N’ Male’ N Female Difference between sexes“
50 ( MRRI )
80 ( MRRI )
110 ( MRRI )
170 (MRRI)
200 (MRRI)
230 (MRRI)
230
(WMC)
210 (MRRI)
A B C D
A B C D
A B C D
A B C D
A B C D
A B C D
A B C D
A B C D
(50) 20.9 f 4.0b’
(50) 24.2* 6.6 (50) 24.5? 5.2” (50) 23.3+_ 4.5”
(50) 35.8+ 8.1b
(50) 36.2 k 1 2.0b
(50) 42.6+ 12.5”
(50) 39.3 + 1 3.9”b
(20) 61.7? 6.8”
(23) 70.5*21.0a
(30) 73.4? 14.2a
(26) 72.42 17.0a
(50) 90.1+ 3.3b
(49) 96.5 + 10.2a
(43) 99.4+ 9.7a not measured
(44) 97.8+ 5.0’
(44) 99.8 + 7.4bc
(42) 103.15 8.1b
(20) 110.5+11.0=
(50) 100.4 * 4.0’
(48) 104.6+ 8.8b
(48) 106.8k 7.4b
(20) 115.4+ 7.4”
(47) 102.3 + 8.0”
(50) 98.4? 9.6”
(46) 98.25 7.9”
(48) 101.0+ 14.1”
(50) 112.6+ 5.1b
(48) 106.4& 8.0’
(48) 113.7f 7.3b
(21) 121.05 7.7”
(30) (25) (20) (17)
(50) (40) (24)
(44) (36) (21) (26)
(50) (49) (38) (25)
(49) (50) (50) (45)
(50) (46) (29) (IS)
58.7? 8.6bc M* 56.4? 18.3’ 68.7+ 14.1ab 73.8? 15.9”
90.12 4.2b 97.9 + 10.2” 98.6+ 9.6”
98.0+ 6.1b 102.5 + 9.3b 100.6t 8.3b 109.0+ 13.3”
101.1 t 5.3b 105.7 f 9.3b 105.3+ 10.4b 117.6+ 12.9”
103.1 + 6.4ab 99.3+ 10.5b 99.9+ 12.5b
106.7? 13.1”
114.5 I 4.8b 109.7 k 8.9’ 112.4? 10.lbc 120.1 f 11.9”
‘Number of individuals measured. ‘Sex was not determined on days 50 and 80. ‘Means within each age group in each sex carrying different superscripts are significantly different at PcO.05 (one-way ANOVA). 4M or F marked with one, two or three asterisks indicates that values of male (M ) or female (F) are significantly larger than that of the other sex at PcO.05 (*), P-co.01 (**). and P<O.OOl (***).
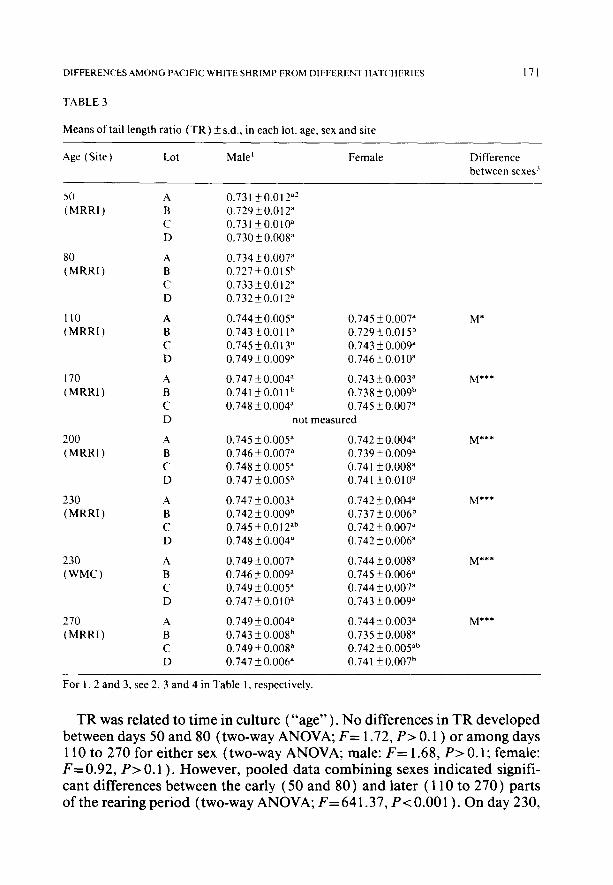
Proportional traits Tail-length ratio (TR) data are summarized in Table 3. Note that wherever
there were significant differences among lots, lot B exhibited the smallest TR.
170
TABLE 2
Means of body weight (BW) (g) f s.d. in each lot, age, sex and site
S. CHOW AND P.A. SANDIFER
Age (Site) Lot Male’ Female Difference between sexes’
50 (MRRI)
80 (MRRI)
110 (MRRI)
170 (MRRI)
200 (MRRI)
230 (MRRI)
230 (WMC)
270 (MRRI)
A B C D
A B C D
A B C D
A B C D
A B C D
A B C D
A B C D
A B C D
0.12 2 0.07b2 0.22rtO.15” 0.21 f0.13” 0.18+0.10”
0.64 k 0.38b 0.78 k 0.70b 1.22kO.99” 1.03? 1.01”
2.87kO.90” 2.51 k0.95b 5.45 f 3.53” 3.03 + 2.60b 5.43 + 2.36” 4.67+ 2.36” 5.46+ 3.25a 5.82 +2.69a
9.64 k 0.97b 10.01+ l.41b 13.23 5 3.52” 13.91 k3.67a 13.97k3.39” 14.05 + 3.63”
not measured
M’
12.21 f l.64b 12.54k2.18’ 14.11 k2.81b 15.63 f 3.63b 15.20k3.10b 14.63k2.89b 19.66k4.86” 19.07f5.76”
13.36? 1.48’ 13.87+ 1.96’ 16.27 k 3.62b 17.30*4.04b 17.31 k3.lOb 17.41 k4.42b 22.02k4.18” 22.32 + 6.30”
14.16+2.57” 14.58rt2.45b 13.68 + 3.53” 14.31* 3.94b 13.2 1 f 2.85” 14.32f4.58b 14.66 f 6.05” 17.47 i 5.46”
19.18f2.50b 20.442 2.54b 17.7423.22’ 19.60k4.31b 20.81 f 3.29b 20.94 k 4.86b 25.38 _+ 4.52” 25.17k6.37”
For 1, 2 and 3, see 2, 3 and 4 in Table 1, respectively.
The average TR did not appear to be related to survival rate, but there were significant and consistent differences between the sexes, with males always exhibiting a larger mean TR than females. However, this difference in TR did not appear to be related to the slight difference in size between the sexes, since the TR was positively correlated with BL and BW and females tended to be larger than males.
DIFFERENCES AMONG PACIFIC WHITE SHRIMP FROM DIFFERENT HATCHERIES
TABLE 3
Means oftail length ratio (TR) -fr s.d., in each lot, age, sex and site
171
Age (Site)
--
50 (MRRI)
80 (MRRI)
110 (MRRI)
170 (MRRI)
200
(MRRI)
230 (MRRI)
230
(WMC)
270
(MRRI)
Lot Male’ Female Difference between sexes’
-
A B C D
A B C D
A B C D
A B C D
A B C D
A B C D
A B C D
A B C D
0.731+0.012”’ 0.729+0.012” 0.731 kO.010” 0.730 * 0.008”
0.734 f 0.007” 0.727t0.015h 0.733kO.012 0.732kO.012”
0.744 + 0.005” 0.745 + 0.007” 0.743kO.01 I” 0.729f0.015b 0.745 k 0.013” 0.743 * 0.009” 0.749 * 0.009” 0.746kO.010”
0.747 + 0.004 0.743 t 0.003” 0.741 fO.O1 lb 0.738 ?0.009h 0.748 + 0.004” 0.745 * 0.007”
not measured
M*
M***
0.745 + 0.005” 0.142 + 0.004” M*** 0.746 f 0.007” 0.739 * 0.009” 0.748 k 0.005” 0.741? 0.008” 0.747 + 0.005” 0.741 +O.O1oa
0.747 * 0.003” 0.742 Ifr 0.004” M’*I
0.742 f 0.009b 0.737 +0.006b 0.745+0.012”b 0.742 + 0.007” 0.748 + 0.004” 0.742 k 0.006”
0.749 If_ 0.007” 0.744 f 0.008” M*** 0.746kO.009” 0.745 +0.006” 0.749 + 0.005” 0.744 k 0.007” 0.747+0.010 0.743 2 0.009”
0.749 f 0.004” 0.744 k 0.003” M*** 0.743 + 0.008h 0.735 kO.008” 0.749 f 0.008” 0.742 k 0.005ab 0.747 k 0.006” 0.741+ 0.007b
For 1, 2 and 3. see 2, 3 and 4 in Table 1, respectively.
TR was related to time in culture (“age”). No differences in TR developed between days 50 and 80 (two-way ANOVA; F= 1.72, P> 0.1) or among days 110 to 270 for either sex (two-way ANOVA; male: F= 1.68, P>O.l; female: F=0.92, P> 0.1). However, pooled data combining sexes indicated signifi- cant differences between the early (50 and 80) and later ( 110 to 270) parts of the rearing period (two-way ANOVA; F= 64 1.37, PC 0.00 1). On day 230,
172 S. CHOW AND P.A. SANDIFER
TABLE 4
Means of carapace width ratio (CR) + s.d. in each lot, age, sex and site
Age (Site) Lot Male’ Female
50 (MRRI)
80 (MRRI)
110 (MRRI)
170 (MRRI)
200 (MRRI)
230 (MRRI)
230
(WMC)
270 (MRRI)
A B C D
A B C D
A B C D
A B C D
A B C D
A B C D
A B C D
A B C D
0.14 I 2 O.OOSb’ 0.15 1 k 0.009” 0. I49 + 0.006” 0. I47 k 0.006”
0.14 I 2 0.006’ 0.15 1 k 0.008” 0.148~0.009b 0.147 5 0.007b
0.140 rt 0.004b 0.139 It 0.005b 0.143 + 0.006ab 0.149 + 0.009” 0.144 t 0.008” 0.147 t 0.007” 0.146 k 0.007” 0.15 1 i 0.008”
0.141 k0.004b 0.143 f 0.004b 0.148 + 0.007” 0.15 1 + 0.008” 0.145 + 0.006” 0.150 * 0.008”
not measured
0.138 I 0.006b 0.140+0.004b 0.145f0.007” 0.147 + 0.008” 0.144 2 0.007” 0.149 f 0.007” 0.146 2 0.007” 0.149 k 0.007”
0.140~0.005b 0.142 f 0.004b 0.146 2 0.006” 0.148 + 0.007” 0.145 f 0.007” 0.149 * 0.009” 0.146 + 0.007” 0.147~0.008”
0.145_+0.006’ 0.147 * 0.005’ 0.152 + 0.006” 0.156 + 0.006” 0.150 k 0.006ab 0.152 k 0.006b 0.148 k 0.005b 0.152 t 0.005b
0.138 + 0.004’ 0.140 f O.OOSb 0.146 2 0.007” 0.149 * 0.008” 0.14340.006b 0.147t0.007= 0.145+0.007ab 0.146 _+ 0.007”
Difference between sexes3
F**
I-**
F”
I=+**
F”*f
P**
For 1, 2 and 3, see 2, 3 and 4 in Table 1, respectively.
the MRRI group exhibited a signikantly smaller average TR than the WMC group (two-way ANOVA; male: F= 7.73, PcO.01; female: F= 18.07, P<O.OOl).
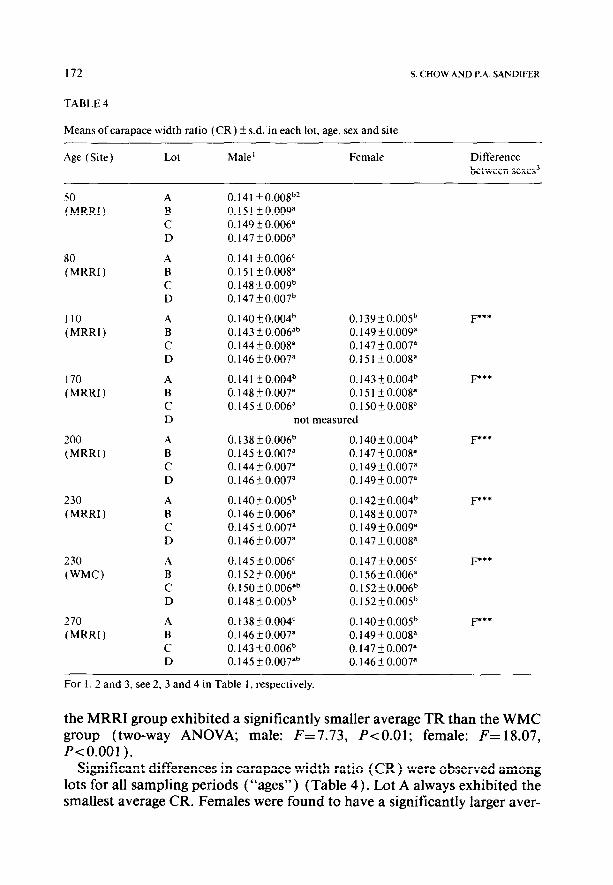
Significant differences in carapace width ratio (CR) were observed among lots for all sampling periods (“ages”) (Table 4). Lot A always exhibited the smallest average CR. Females were found to have a significantly larger aver-
DIFFERENCES AMONG PACIFIC WHITE SHRIMP FROM DIFFERENT HATCHERIES
TABLE 5
Means of condition factor (CO) k s.d. in each lot, age, sex and site
173
Age (Site) Lot Male’ Female Difference between sexes”
50 (MRRI)
80 (MRRI)
II0 (MRRI)
170 (MRRI)
200
(MRRI)
230 (MRRI)
230 (WMC)
270 (MRRI)
A B c D
A B c D
A B C D
A B C D
A B C D
A B C D
A B C D
A B C D
I. 175 f 0.095h’ I .270 f 0.109” 1.249 k 0.078” 1.242f0.106”
1.210+0.068” 1.246 k 0.079” 1.274f0.102” 1.244 k 0.072”
l.185+0.043h 1.177+0.053b 1.269+0.065” I.296 + 0.109” 1.27OkO.094” 1.295 + 0.088” 1.254+0.081” 1.298~0.081”
1.320f0.107b 1.336k0.054b 1.437 + 0.130” I .457 * 0.092” 1.396 + 0.093” 1.438 i- 0.097”
not measured
F**
I .300? 0.060’ l.319+0.058b I .402 + 0.080ah 1.432 k 0.080” l.374+0.091h 1.427+0.100 I .430 + 0.087” I.430 + 0.092”
I .3 I8 k 0.060b I.335 k 0.047’ I .402 2 0.076” 1.445 k 0.085ah 1.412+0.091” 1.466 + 0.106” I.420 k 0.098” 1.400 2 0.09 lb
1.317+0.104’ 1.319+0.052’ 1.405+0.062” I.430 + 0.08 1” I .377 f 0.065ab 1.392+0.081” 1.367 + 0.079b I.397 + 0.08gb
1.337~0.041’ 1.356 +_ 0.059b I.459 k 0.084” 1.466 ? 0.093” 1.410+0.087b 1.453 f 0.080” 1.419?0.082b I .424 k 0.079”
F*
I-**
F”
r
For I, 2 and 3, see 2. 3 and 4 in Table I, respectively.
age CR than males throughout the study. Since the CR was negatively corre- lated with BL and BW, and since females tended to be slightly larger than males, this consistent difference did not appear to be related to the slight size difference between sexes. The WMC group exhibited a significantly larger average CR than the MRRI group (two-way ANOVA; male: F=68.55, P<O.OOl; female: F=63.87, P<O.OOl).
174 S. CHOW AND P.A. SANDIFER
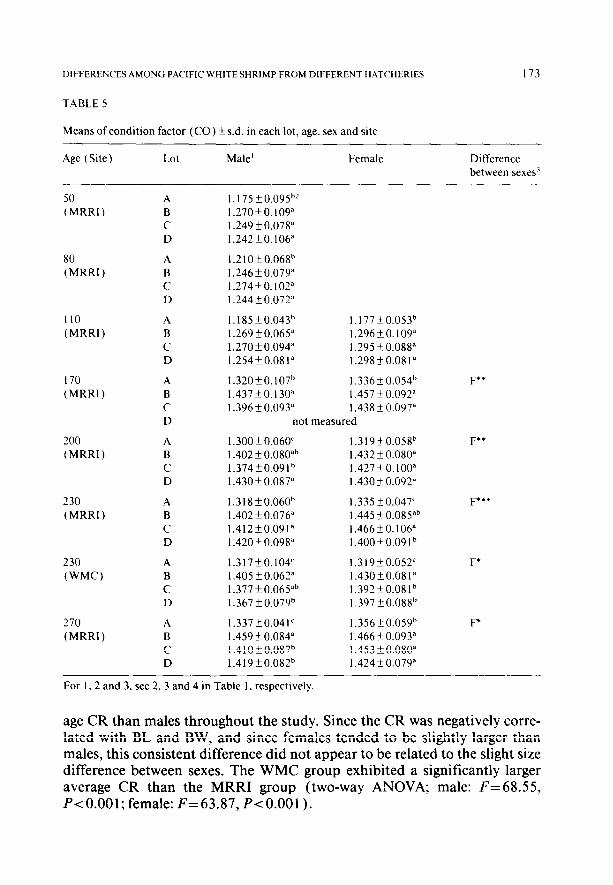
Significant differences in average condition factor (CO) were observed among lots and between sexes for all sampling periods except day 110 (Table 5 ). The CO of lot A was always the smallest, and females had a higher average CO than males. Pooled MRRI data combining sexes and lots indicated that the “younger” shrimp ( 50- 110 days) had a significantly smaller average CO than the “older” ones ( 170-270 days) (two-way ANOVA; F= 1397.96, P-c 0.00 1) . There were no significant differences in average CO by sampling period within the younger group (two-way ANOVA; F= 2.70, P> 0. lo), and only males exhibited differences by sampling period within the older group (two-way ANOVA; male: F=5.44, P<O.OOl; female: F=2.30, P>O.lO). The MRRI group had a larger average CO than the WMC group (two-way AN- OVA; male: F= 4.24, P< 0.05; female: F= 10.48, P-c 0.0 1).
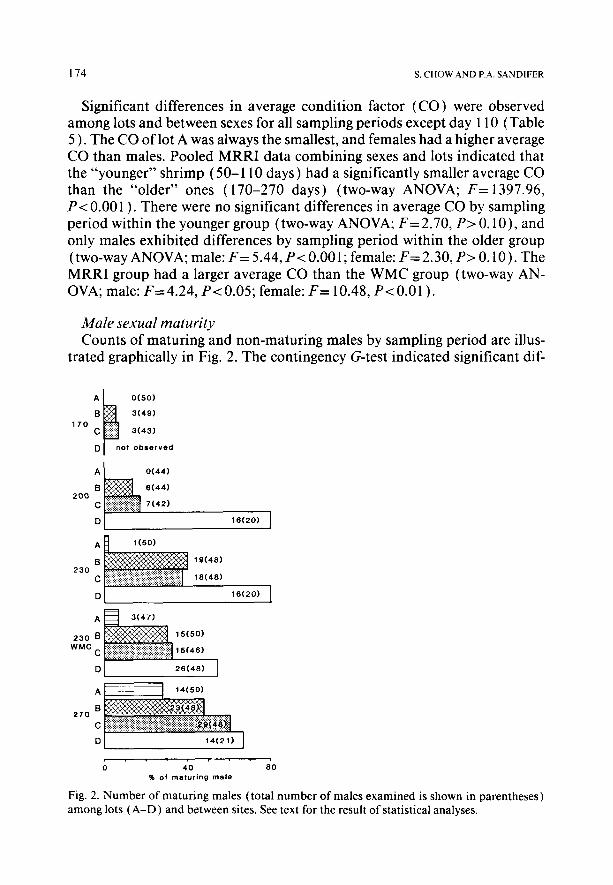
Male sexual maturity Counts of maturing and non-maturing males by sampling period are illus-
trated graphically in Fig. 2. The contingency G-test indicated significant dif-
170
200
230
230
A O(50)
B 3(49)
C 3(43)
D 01 observed
Al O(44)
A q 3(47)
270
DI 14(21) 1
0 40 80 % of maturing male
Fig. 2. Number of maturing males (total number of males examined is shown in parentheses) among lots (A-D) and between sites. See text for the result of statistical analyses.
DIFFERENCES AMONG PACIFIC WHITE SHRIMP FROM DIFFERENT HATCHERIES 175
ferences in male maturation among the lots at all sampling periods except day 170 (day 170: G=5.37, P>O.O5; day 200: G=54.38, P<O.OOl; day 230: G=51.64 at MRRI and G=28.46 at WMC, P<O.OOl; day 270: G= 14.28, PC 0.001). Comparison between the MRRI and WMC rearing sites on day 230 showed a significant difference only in lot D, with a higher proportion of maturing males at MRRI (lot A, G= 1.22; lot B, G=0.99; lot C, G=0.25; lot D, G=4.24, P-C 0.05). Rank order among lots was consistent throughout the study, and was the reverse of that for survival. The routinely higher level of male maturation noted in lot D beginning at day 200 and continuing through- out the remainder of the experiment was probably related to the significantly larger mean size of the lot D shrimp (Tables I and 2 ).
DISCUSSION
Highly significant differences in the tail-length ratio (TR) and condition factor (CO) observed here between younger and older Penaeus vannamei ob- tained from four different hatcheries coincide with allometric relationships reported between carapace and total lengths in the wild penaeid Plesiopen- aeus edwardsianus (Formoso et al., 1980) and between total length and weight in the wild white shrimp Penaeus setiferus (Anderson and Lindner, 1958). The tails and bodies of older individuals tend to be proportionally longer and thicker, and the weights greater in proportion to length than those of younger shrimp. Although not described in detail, relationships between body length- body weight or body length-carapace length have been found to differ be- tween sexes in several penaeid species (Kutkuhn, 1962; Klima, 1969; Villaluz et al., 1969; Thomas, 1975; Farmer, 1986; Liao, 1988). In Penaeus duorarum, Kutkuhn ( 1962) reported that females had a greater carapace length and body weight than males of the same total length, and that this difference became more pronounced in larger size groups. On the other hand, Choe ( 197 1) noted no differences in body length and weight between sexes in P. japonicus, but he sampled only relatively small ( < 14 g) shrimp. Thus, the growth of pen- aeid shrimps seems to be allometric with differences between sexes.
Attempts to identify differences in morphometric traits and to correlate such traits with geographic location have been made for some penaeid shrimp species for fisheries managements or genetic resources (e.g., see Klima, 1969: Huang et al., 1989). However, electrophoretic survey indicated that the nat- ural population of penaeid shrimps does not seem to be finely subdivided (Lester, 1979; Chow and Fujio, 1987). It is highly probable that heteroge- neous environments at different localities may cause morphometric differ- entiation among local samples. Similarly, in the present study, differences were apparent in morphometric traits between the two rearing sites.
Potential problems in comparing morphometric traits of the hatchery lots
176 S. CHOW AND P.A. SANDIFER
utilized in the present study include differences in postlarval age at introduc- tion, unequal survival, and unknown numbers of parents for each lot. Lot A was the oldest at introduction and had the highest survival, while lot D was the youngest and exhibited the poorest survival. Body size was more hetero- geneous among the lots reared at MRRI where there were pronounced sur- vival differences, while the same lots reared at WMC showed less striking size differences. The animals at WMC were stocked into larger tanks on day 70, at which time the population densities were standardized again. A negative correlation between stocking density and growth has been observed in P. vm- namei reared at moderately low densities (5-20 individuals/m’) (Taki et al., 1984; Sandifer et al., 1987; Wyban et al., 1987), while there is much less neg- ative effect at higher densities (20-100 individuals/m*) (Sandifer et al., 1988). The standing stock densities in the MRRI tanks on day 270 were 80, 46, 21 and 11 shrimp/m*, for lots A-D, respectively, while at day 195 the densities in the WMC tanks were 23, 19, 22 and 17 shrimp/m’. Thus, it ap- pears that the pronounced differences in population density significantly af- fected growth among the four hatchery lots at MRRI. Further, the differences observed in body size between sites within a particular hatchery lot suggest that site-specific factors, such as diet and rearing condition, may also have affected shrimp growth. The marked effect of environmental factors on gen- otypic expression makes estimation of growth heritability in decapod crusta- ceans very difficult (Hedgecock et al., 1976; Hedgecock and Nelson, 1978; Lester, 1988). Other traits measured in the present study (i.e., TR, CR and CO) were independent of the density effect but not of the site (environmen- tal) effect. And onset of male sexual maturity appeared to be little affected by either density or site.
The significant differences in growth, morphometric traits, and onset of male sexual maturity reported here among shrimp lots from four commercial hatcheries suggest the possibility of genetic differences among the lots, al- though the traits measured were largely influenced by environmental factors. Unfortunately, we lack detailed information on the genetic background and number of parents for each lot. However, at the time the animals were ac- quired, hatcheries A and C were thought to be operating with closed brood stock populations (i.e., no wild animals were being introduced to the breed- ing stock).
ACKNOWLEDGEMENTS
We thank the staff of the Waddell Mariculture Center for maintaining the animals, and our colleagues, Dr. C.L. Browdy, Mssrs. A.D. Stokes and J.S. Hopkins, and Ms. S.E.G. Harris, for reviewing the manuscript. We also thank Mrs. M.J. Clise of the MRRI Computer Center for assistance with data analysis. This research was supported in part by the U.S. Department of Ag-
DIFFERENCES AMONG PACIFIC WHITE SHRIMP FROM DIFFERENT HATCHERIES 177
riculture-supported Gulf Coast Research Laboratory Consortium’s U.S. Shrimp Farming Program via a subcontract from the Oceanic Institute, HI. This paper is contribution No. 282 from the South Carolina Marine Re- sources Center.
REFERENCES
Anderson. W.W. and Lindner, M.J., 1958. Length-weight relation in the common or white shrimp, Penaeus setiferus. U.S. Dept. Int. Fish Wildl. Serv., Special Sci. Rep., 256: I-1 3.
Choe, S.. 197 1. Body increases during molt and molting cycle of the oriental brown shrimp Penaeus japonicus. Mar. Biol., 9: 3 l-37.
Chow. S. and Fujio, Y., 1987. Comparison of intraspecific genetic diversity level among local populations in decapod crustacean species; with some references of phenotypic diversity. Bull. Jpn. Sot. Sci. Fish., 53: 691-693.
Farmer, A.S.D., 1986. Morphometric relationships of commercially important species of pen- aeid shrimp from the Arabian Gulf. Kuwait Bull. Mar. Sci., 7: l-2 1.
Fontaine. C.T. and Neal, R.A., 1968. Relation between tail length and total length for three commercially important species of penaeid shrimp. Fish. Bull., 67: 125- 126.
Fontaine, C.T. and Neal, R.A., 197 I. Length-weight relations for three commercially important penaeid shrimp of the Gulf of Mexico. Trans. Am. Fish. Sot.. 100: 584-586.
Formoso, M., Blanco, W. and Jardim, F., 1980. Some allometric relationships of the shrimp Pksiopenaeus edwardsianus (Decapoda, Penaeidae) of the Angola slope. Rev. Cub. Invest. Pesq., 5: 71-81.
Hedgecock, D. and Nelson, K., 1978. Components of growth rate variation among laboratory cultured lobster (Homarus). Proc. World Maricult. Sot., 9: I25- 137.
Hedgecock. D., Nelson, K. and Shlesser, R.A., 1976. Growth differences among families of the lobster, Homarus americanus. Proc. World Maricult. Sot., 7: 347-36 1.
Huang, C.M., Tsai, M.Y. and Liao, I.C., 1989. Selection of broodstock in genetic improvement of fenaeus penicillatus. In: R. Hirano and I. Hanyu (Editors), Proceedings of Second Asian Fisheries Forum. Asian Fisheries Society, Tokyo, p. 100 (abstr. ).
Klima, E.F.. 1969. Length-weight relation and conversion of “whole” and “headless” weights of royal-red shrimp, Hvmenopenaeus rohustus (Smith). U.S. Dept. Int. Fish Wildl. Serv., Special Sci. Rep., 585: 1-5.
Kutkuhn. J.H.. 1962. Dynamics of a penaeid shrimp population and management implications. Fish. Bull., 65: 3 13-338.
Lester, L.J., 1979. Population genetics of penaeid shrimps from the Gulf of Mexico. J. Hered., 70: 175-180.
Lester. L.J., 1988. Differences in larval growth among families of Penaeus stylirostris Stimpson and P. vannamei Boone. Aquacult. Fish. Manage, 19: 243-25 1.
Liao. I.C., 1988. Feasibility study for alternative culture species in Taiwan - Penaeus penicilla- tus. J. World Aquacult. Sot., 19: 227-236.
Lutz, C.G. and Walters, W.R., 1989. Estimate of heritabilities for growth, body size. and pro- cessing traits in red swamp crawfish. Procambarus darkii (Girard). Aquaculture. 78: 2 l- 33.
Malecha. S.R.. Masuno, S. and Onizuka. D., 1984. The feasibility of measuring the heritability of growth pattern variation in juvenile freshwater prawns. Macrobrachium rosenhergii (de Man ). Aquaculture, 38: 347-363.
Sandifer, P.A., Hopkins, J.S. and Stokes, A.D., 1987. Intensive culture potential of Penaeus wnnamei. J. World Aquacult. Sot., 18: 94-100.
178 S. CHOW AND P.A. SANDIFER
Sandifer, P.A., Hopkins, J.S. and Stokes, A.D., 1988. Intensification of shrimp culture in earthen ponds in South Carolina: progress and prospects. J. World Aquacult. Sot., 19: 2 18-226.
Stokes, A.D., Hopkins, J.S., Holloway, J.D. and Richardson, J.R., 1989. Comparison of the growth and survival performance of captive stocks of Penaeus vannarnei from four commer- ical hatcheries serving South Carolina shrimp farms. J. World Aquacult. Sot., 20: 72A (Abstract ).
Taki, Y., Primavera, J.H. and Lobrera, J.A., 1984. The effect of stocking densities on growth and survival of Penaeus vannamei in cow-manure-enriched ponds. In: Y. Taki, J.H. Prima- vera and J.A. Llobrera (Editors), Proceedings of the First International Conference on the Culture of Penaeid Prawns/Shrimps. SEAFDEC, Iloilo City, p. 170.
Thomas, M.M., 1975. Age and growth, length-weight relationship and relative condition factor of Penaeus semisulcutus De Haan. Ind. J. Fish., 22: 133-142.
Villaluz, D.K., Villaluz, A., Ladrera, B., Sheik, M. and Gonzaga, A., 1969. Reproduction, larval development, and cultivation of sugpo (Penaeus monodon Fabricius). Philipp. J. Sci., 98: 205-236.
Wyban, J.A., Lee, C.S., Sato, V.T., Sweeney, J.N. and Richards, W.K., Jr., 1987. Effect of stock- ing density on shrimp growth rates in manure-fertilized ponds. Aquaculture, 6 1: 23-32.


![Gross and Morphometric Anatomy of the Male …...VeterinaryMedicineInternational 5 mammalian gonad,” Development,vol.126,no.13,pp.2883– 2890,1999. [6] M. N. Drew and A. de Lahunta,](https://img.pdfslide.us/doc/110x75/5ec05e6188b6b92a9410e0ad/gross-and-morphometric-anatomy-of-the-male-veterinarymedicineinternational-5.jpg)