Embed Size (px)
Citation preview
127
Water stress of plants is the state when plants reduce the utilisation of radiation energy to tran-spiration as a consequence of the lower storage of soil water that limits hydraulic conductivity for water transport from soil to atmosphere. Due to the diminished leaf potential the plants close stomata, and so they cannot cool their surface efficiently, subsequently reducing their photosynthetic pro-duction. The incident solar energy is consumed mainly for the warming of air and canopy while the canopy is mostly cooled through the radiation of heat energy. A by-effect of this state is a decrease
in the canopy capacity to balance air temperature differences between day and night (PROCHÁZKA et al. 2001).
Water stress may be determined by the measure-ment of soil water potential, but it is a generally costly and complicated method of determining the water regime of soils. This method is hardly applicable in deep-rooted plants and stony soils. By an easy measurement of surface temperature with infrared sensors it is possible to use this important indicator for determination of plant water stress and/or of the rate of actual evapotranspiration
Difference in Canopy and Air Temperature as an Indicator of Grassland Water Stress
RENATA DUFFKOVÁ
Research Institute for Soil and Water Conservation, Prague, Czech Republic
Abstract: In 2003–2005 in conditions of the moderately warm region of the Třeboň Basin (Czech Republic) the difference between canopy temperature (Tc) and air temperature at 2 m (Ta) was tested as an indicator of grass-land water stress. To evaluate water stress ten-minute averages of temperature difference Tc–Ta were chosen recorded on days without rainfall with intensive solar radiation from 11.00 to 14.00 CET. Water stress in the zone of the major portion of root biomass (0–0.2 m) in the peak growing season (minimum presence of dead plant residues) documented by a sudden increase in temperature difference, its value 5–12°C and unfavourable canopy temperatures due to overheating (> 30°C) was indicated after high values of suction pressure approach-ing the wilting point (1300 kPa) were reached. High variability of temperature difference in the conditions of sufficient supply of water to plants was explained by the amount of dead plant residues in canopy, value of va-pour pressure deficit (VPD), actual evapotranspiration rate (ETA) and soil moisture content. At the beginning of the growing season (presence of dead plant residues and voids) we proved moderately strong negative linear correlations of Tc–Ta with VPD and Tc–Ta with ETA rate and moderately strong positive linear correlations of ETA rate with VPD. In the period of intensive growth (the coverage of dead plant residues and voids lower than 10%) moderately strong linear correlations of Tc–Ta with VPD and multiple linear correlations of Tc–Ta with VPD and soil moisture content at a depth of 0.10–0.40 m were demonstrated.
Keywords: water stress indicator; air temperature; canopy temperature; soil moisture; grassland; vapour pressure deficit; actual evapotranspiration
Supported by the Ministry of Agriculture of the Czech Republic, Project No. MZE 0002704901-08.
Soil & Water Res., 1, 2006 (4): 127–138
128
because a difference between the temperature of air and that of canopy (temperature differ-ence) is a generally accepted indicator of water availability to plants (e.g. JACKSON et al. 1977, 1981; KEENER & KIRCHER 1983; PAW U 1984, and OLUFAYO et al. 1994). In the period of water stress temperature difference is influenced not only by the increasing surface resistance to water vapour transmission due to the closure of stomata but also by other factors limiting the use of this pro-posed indicator. Its values are influenced e.g. by the canopy structure through the occurrence of non-transpiring dead plant residues and voids at the beginning of spring. Vapour pressure deficit is another important evaluation criterion con-tributing to the definition of water stress on the basis of the difference between canopy (Tc) and air temperature (Ta) in the conditions of humid climate (KEENER & KIRCHER 1983); this deficit and radiation balance are very variable in such conditions. The negative linear relation of Tc–Ta to vapour pressure deficit (VPD) under unlim-ited availability of soil water to plants (so called baseline) was included in the computation of the crop water stress index (IDSO et al. 1981; JACKSON et al. 1981) which indicates to what extent the crop suffers from water stress. E.g. phenophase and crop shading are other factors influencing the temperature difference (IDSO 1982). An im-portant factor of the correct evaluation of water regime by means of temperature difference is a suitable selection of daytime and weather when the informative capacity of indicators is highest. Days with fine sunny weather (e.g. IDSO et al. 1981, OLIVA et al. 1994, ZAVADIL & DOLEŽAL 2005) seem ideal at about midday or shortly after midday ( JACKSON et al. 1977, 1981). ZAVADIL and DOLEŽAL (2005) stated that temperature difference was also inf luenced by free liquid water on the plant surface.
The objective of the paper is to define suitability of the use of temperature difference for the indica-tion of grassland water stress in conditions of the humid climate of the Czech Republic.
METHODS, DESCRIPTION OF EXPERIMENTAL LOCALITY
The method of grassland water stress analysis is based on the testing of suitability of the difference between Tc and Ta at a height of 2 m on the basis of comparison with soil characteristics (soil moisture
content, % by volume, soil water potential, bar). To test water stress we chose the values of tem-perature difference Tc–Ta measured at 10-minute intervals from 11:00 to 14:00, on days without rainfall with global radiation intensity higher than 700 W/m2. Under these conditions Tc–Ta indicates the water regime of the site more exactly than in cloudy or even rainy weather (a decrease in tem-perature difference and vapour pressure deficit) and a precondition for the validity of Bowen ratio method (maximisation of temperature gradient or air humidity) suitable for the computation of actual evapotranspiration (ETA) may be satisfied. To evaluate Tc–Ta variability in the period without water stress we determined simple linear regres-sions of Tc–Ta on ETA rate and VPD, the differ-ence between maximum pressure of water vapour at a given air temperature and actual pressure of water vapour in hPa and multiple linear regres-sions of temperature difference simultaneously on VPD and soil moisture content. The ETA rate was determined by the method of energy balance and Bowen ratio that was derived from the theory of turbulent diffusion. The results document the growing seasons 2003 to 2005.
Site description
An experimental plot is entered in the land reg-ister of Klečaty municipality in the former district Tábor, Czech Republic; geomorphologically it is situated in the Třeboň Basin, at an altitude of 423 m above sea level, in a moderately warm cli-matic region. Precipitation and temperature means (1.1.1961–31.12.1990) at Borkovice Station (of Czech Hydrometeorological Institute) are 596 mm and 7.2°C, in the growing season (IV–IX) 388 mm and 13.3°C. In pedological terms, the soil type is pseudogleyic Luvisol (Evaluation Soil Ecological Unit 7 43 00) and the soil texture is sandy loam. The plot was drained, and the groundwater table is not mostly available to plants in the growing season. The grassland is not fertilised, its constant height of ca. 10 cm is maintained, and Alopecurus pratensis is a dominant species.
Method of actual evapotranspiration determination on the basis of energy balance
and Bowen ratio
Actual evapotranspiration was determined on the basis of energy balance and Bowen ratio. ETA
Soil & Water Res., 1, 2006 (4): 127–138
129
is calculated from the energy balance equation and Bowen ratio determination (MONTEITH 1973):
Energy balance equation:
Rn = G + LE + H + P (1)
where:Rn – radiation balance (W/m2)G – heat flux into soil (W/m2)LE – heat flux consumed for evaporation (W/m2) (L – latent
heat of water evaporation, E – density of water vapour flux from evaporating surface to atmosphere, i.e. ETA intensity (kg/m2/s))
H – turbulent heat flux (W/m2)P – energy value of photosynthetic production (W/m2),
usually neglected for its low value
We adjust Eq. (1) for the calculation of LE with omission of P to:
LE = Rn – G – H (2)
Rn and G are relatively easy to be measured but it is difficult to determine H, it can be calculated from so called Bowen ratio β. β is based on the turbulent diffusion theory and if some assumptions are satisfied, it can be calculated from the vertical temperature gradient and water vapour concentra-tion. The basic assumption is the equality of trans-port coefficients for vertical turbulent transport of heat and water vapours under the condition of neutral atmosphere stratification and sufficiently extensive canopy.
Bowen ratio β is defined as the quotient of H and LE from equations for vertical turbulent transport of heat (MONTEITH 1973) and transport of wa-ter vapours (NOVÁK 1995). After modifications of those equations and after introduction of the concept of psychrometric constant γ (kPa/°C) we get the equation:
β = γ (T2 – T1)
(3) (T2 – T1)
where:T2 – T1 – difference in air temperature at two heights
above the canopy (°C)e2 – e1 – difference in humidities at those two heights
above the canopy (kPa)
By easy modification of Eq. (2) and by introduc-tion of β we calculate ETA:
ETA = Rn – G
(mm/s) (4) L (1 + β)
Heat flux into soil G (W/m2) was determined indirectly from the vertical gradient of tempera-ture in soil and its heat conductivity on the basis of the simple relationship:
G = α
(T2 – T1)
(5) (z2 – z1)
where:α – heat conductivity of soil: 1.0 (W/m/K) (BAVER
et al. 1972)T1, T2 – soil temperature (°C) at the depth of 0.1 and 0.2 mz1, z2 – soil depth of 0.1 m and 0.2 m
Instrumentation
ETA values were computed from the data of an automated meteorological station placed on the grassland maintained at a constant height (ca. 0.10 m). Sensors registered measured values each minute and a datalogger stored their ten-minute means.
The measuring system for the acquisition of ETA data consists of a MiniCube VV/VX datalogger (EMS Brno, CR) registering data: from 2 sensors measuring temperature and relative air humidity at two heights (0.5 and 2.0 m, sensors with the same error were chosen, so called sensor pairing), from a pyranometer for the measurement of global solar radiation, from a balancemeter, from two sensors registering the soil temperature at two depths (0.1 and 0.2 m), and from an anemometer measuring the wind speed (at 2 m).
As the station was equipped with the balance- meter in October 2003, before its installation Rn was determined on the basis of estimation of grassland albedo from literature to amount to 20% (NOVÁK 1995) and calculation of long-wave radiation of the Earth (ALLEN et al. 1998). Since the growing season 2004 Rn values were measured with a balancemeter (Schenk Company, model 8110, annual stability 3%).
Methods for determination of canopy and air temperature, air humidity, soil moisture
content and soil water potential
Canopy and air temperature, air humidity. Both air and canopy temperature together with next common meteorological variables were meas-ured with a small meteorological station uEMSet 99 manufactured by Environmental Measuring
Soil & Water Res., 1, 2006 (4): 127–138
130
Systems, Brno, CZ. Air temperature/humidity sensor EMS 32A inside the radiation shield was installed at 2 m level above the ground. Infrared thermocouple OS36-2-80 made by Omega Engi-neering, Inc, U.S.A. was located 0.85 m above the ground and pointed downwards. Field of view of this sensor is defined as a circle with diameter/sen-sor distance ratio equal 1:2. With respect to the above-mentioned level the canopy area the average temperature of which is measured is represented by a circle with ca. 40 cm in diameter. The sensor output is linear (2% error) within the temperature range between 10 and 49°C. The emissivity of grass cover was estimated to 0.95 and set in datalogger configuration.
Soil moisture content (by volume). Soil moisture content (by volume) was measured by Time Domain Reflectometry (Water Content Reflectometer, Campbell Scientific, USA, model CS 616, length 30 cm, to the nearest 2.5%). Water content in the environment is derived from the speed of propa-gation of electromagnetic waves in the space with variable dielectric constant given practically only by the water content in soil. Sensors were placed at a depth of 0.13–0.43 m (soil moisture 1, the sensor was placed at 13 cm below the surface to hide also the sensor body), 0.3–0.6 m (soil moisture 2) and 0.6–0.9 m (soil moisture 3).
Soil water potential. Soil water potential de-scribes energy requirements of plants for depletion of a unit of water from the soil at different soil moisture contents within available water capac-ity and is expressed by suction pressure. Suction pressure (SP) was measured with gypsum blocks (model GB 2, Delmhorst, USA, range 10–1500 kPa) at a depth of 0.1; 0.2; 0.3; 0.4; 0.5 and 0.6 m (SP 1, SP 2, SP 3, SP 4, SP 5, SP 6). The used equation of conversion of SP values from the resistance between the block electrodes in the form of a polynomial of 4th degree was determined by regression from tabular values given by the manufacturer (KUČERA, personal communication).
The data on soil water characteristics were stored in the interval of 10 min by the MiniCube VF datalogger (EMS Brno, CR) installed at the me-teorological station.
Statistical methods
Mini 32 software (version 3.65.22.29 of EMS Brno Company, CR) was used for determination of simple linear relationships; to evaluate multiple
linear regressions Statgraphics software, version 7.1, was used.
RESULTS AND DISCUSSION
Periods evaluating temperature difference as a potential indicator of water stress comprised different growing seasons from the season with extremely below-normal rainfall and extraordinar-ily above-normal temperatures (2003) through that with normal rainfall and temperatures (2004) to the season with extremely above-normal rainfall and normal temperatures (2005).
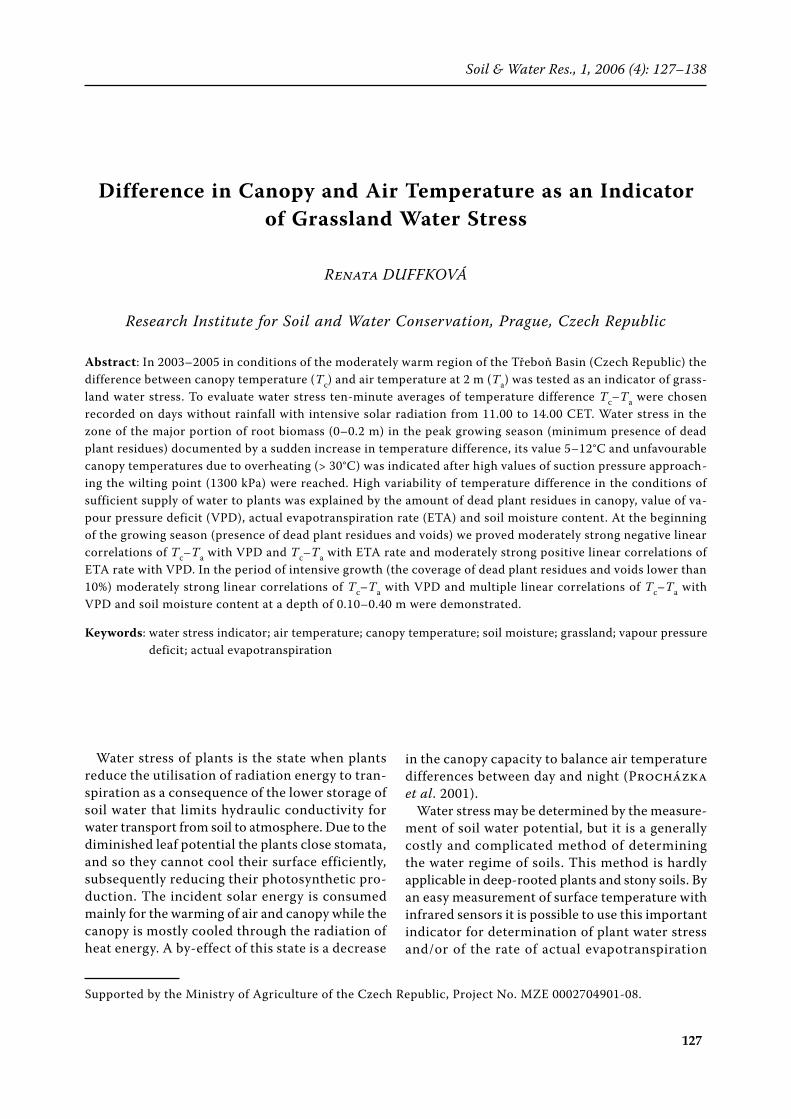
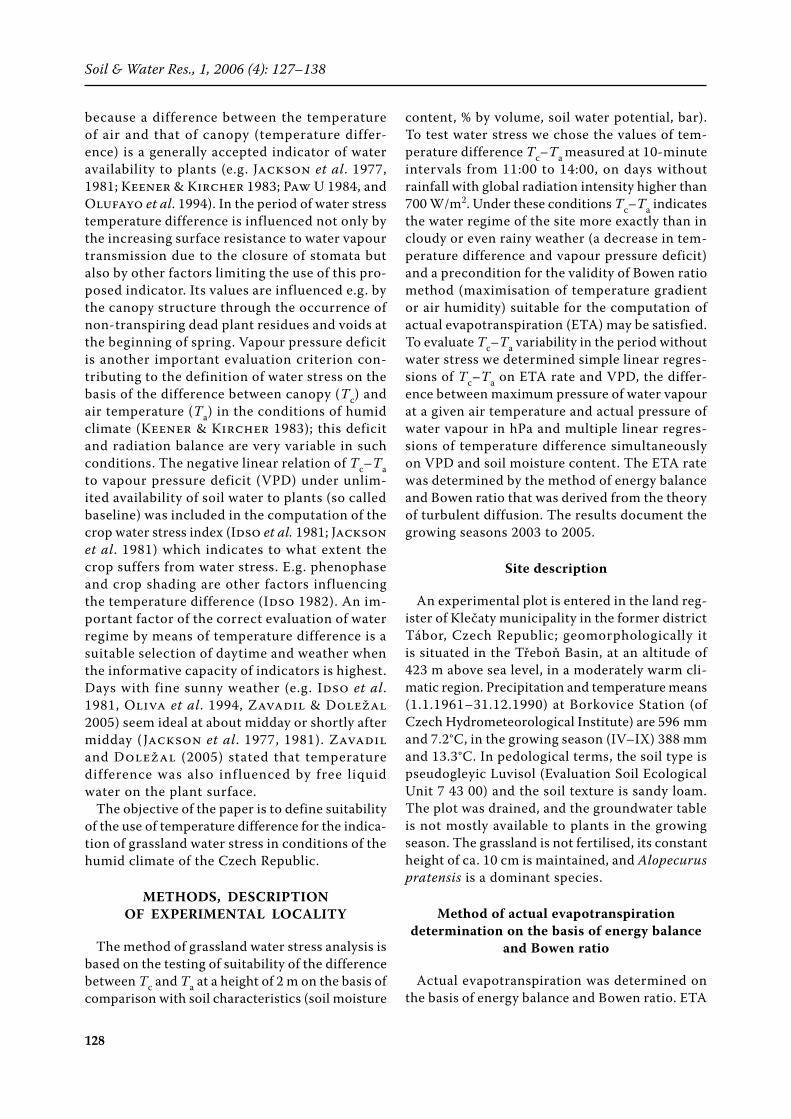
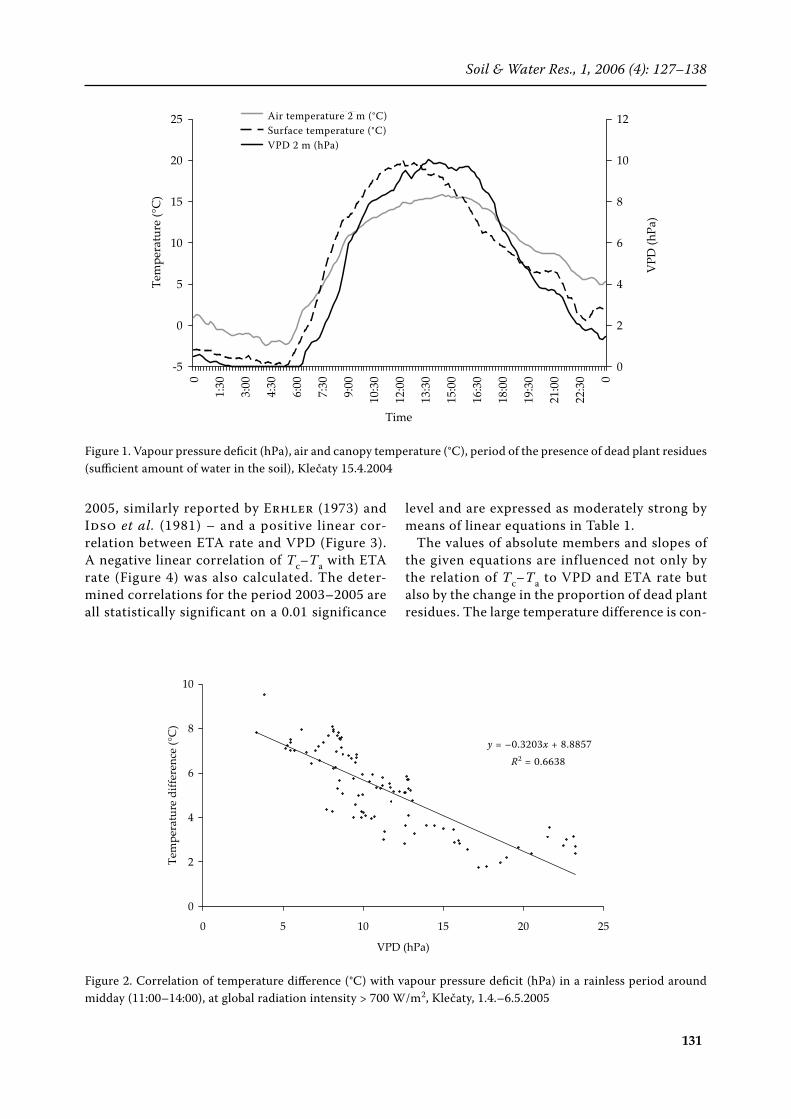
At the beginning of the growing season the growth activity is influenced by the temperature of air and/or soil. The amount of available water is not usually limiting for canopy development in this period (after winter). The grassland of the given site starts growing actively after the aver-age air temperature does not drop below 10°C, minimum daily temperature below 0°C and mini-mum soil temperature at 0.1 m below 5°C. Before these conditions are established, the growth rate is minimum and the grassland has a low index of active leaf area (LAI), i.e. in the canopy there are voids (ca. 10%) and a lot of non-transpiring dry parts (10–30%) coming from the preceding off-season and being overheated. As a consequence of these phenomena, and due to low VPD (about 5–7 hPa) and lower solar radiation that limit the transpiration process, Tc–Ta reached the values up to 10–14°C. So the high temperature differences Tc–Ta did not indicate the limited transpiration and minimum cooling of canopy as a result of water stress. The energy of radiation balance was mostly used for air warming. In the course of time (i.e. 2nd half of April–1st half of May) with a decreasing proportion of dead plant residues VPD and tran-spiration rate increased, the canopy was cooled more intensively and temperature difference also decreased. In this period (early April to mid-May) the values of Tc–Ta were very variable and ranged between 0 and 14°C in relation to weather condi-tions (VPD) and proportion of dead plant residues (> 10%) even though the soil contained enough water for evaporation (Figure 1, the maximum value of Tc reached by about 3 h earlier than the maximum of Ta was caused by the relation of air temperature to canopy temperature, also ZAVADIL & DOLEŽAL 2005). Linear regression indicated a negative linear correlation of selected values of Tc–Ta with VPD – Figure 2, for the chosen year
Soil & Water Res., 1, 2006 (4): 127–138
131
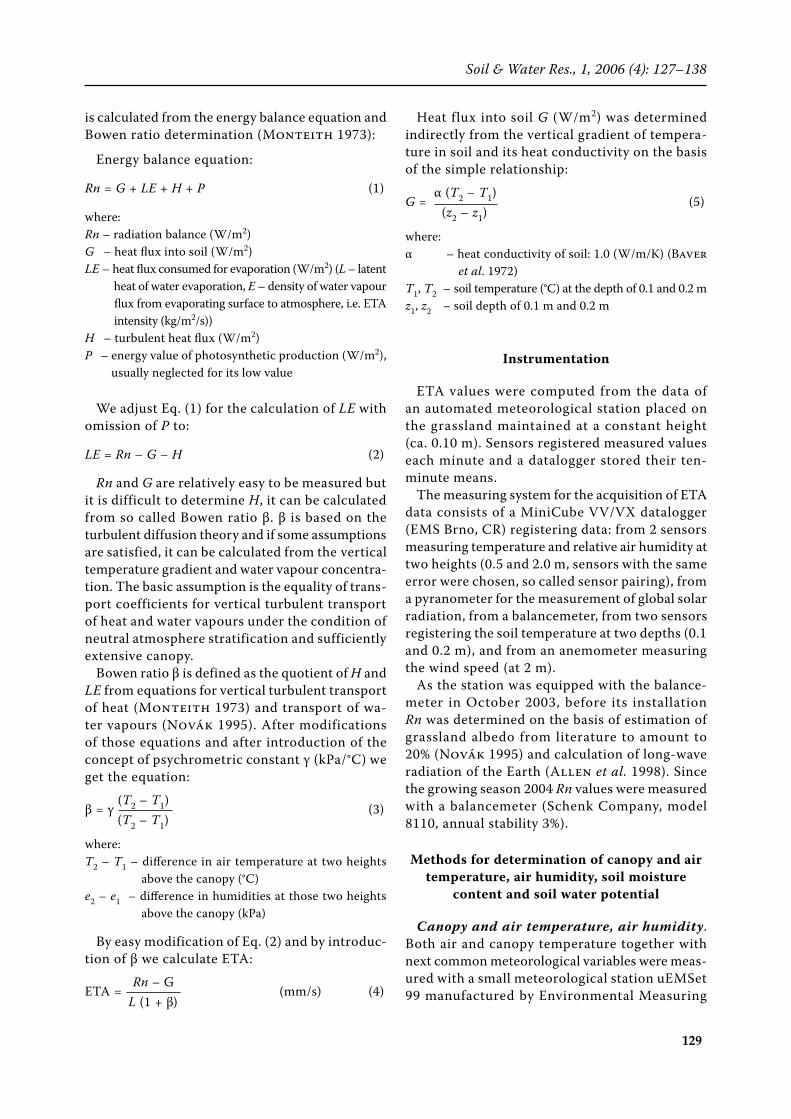
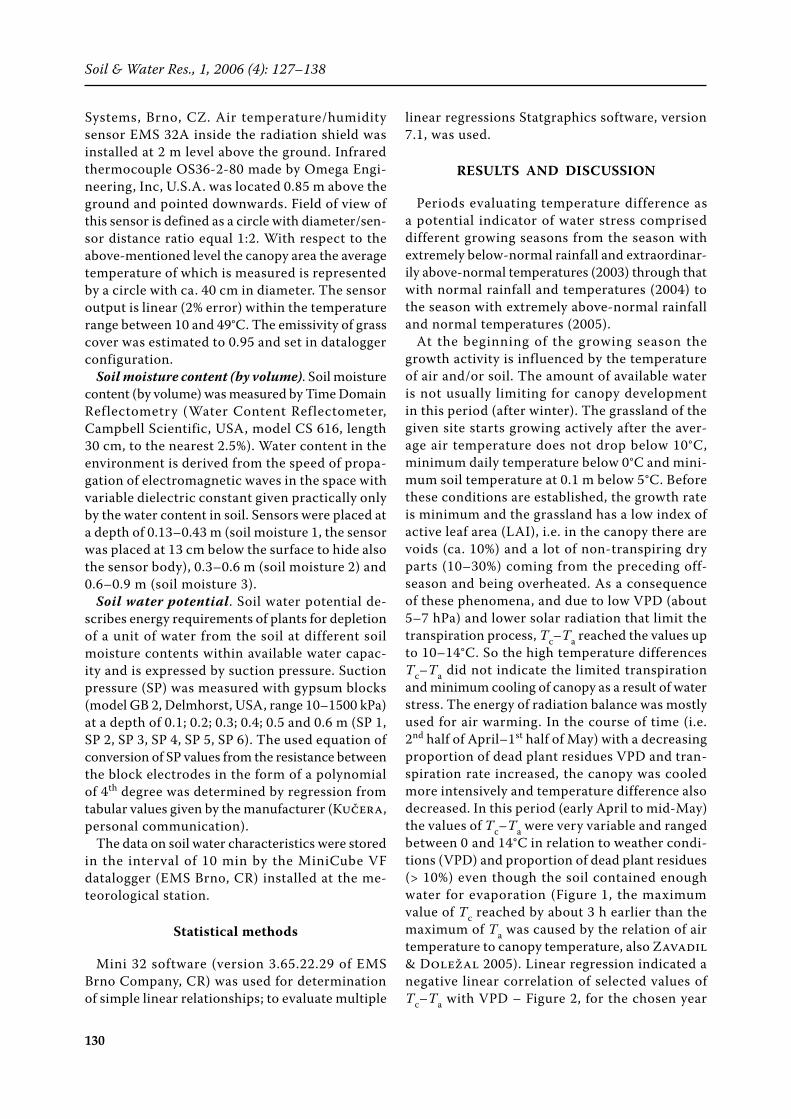
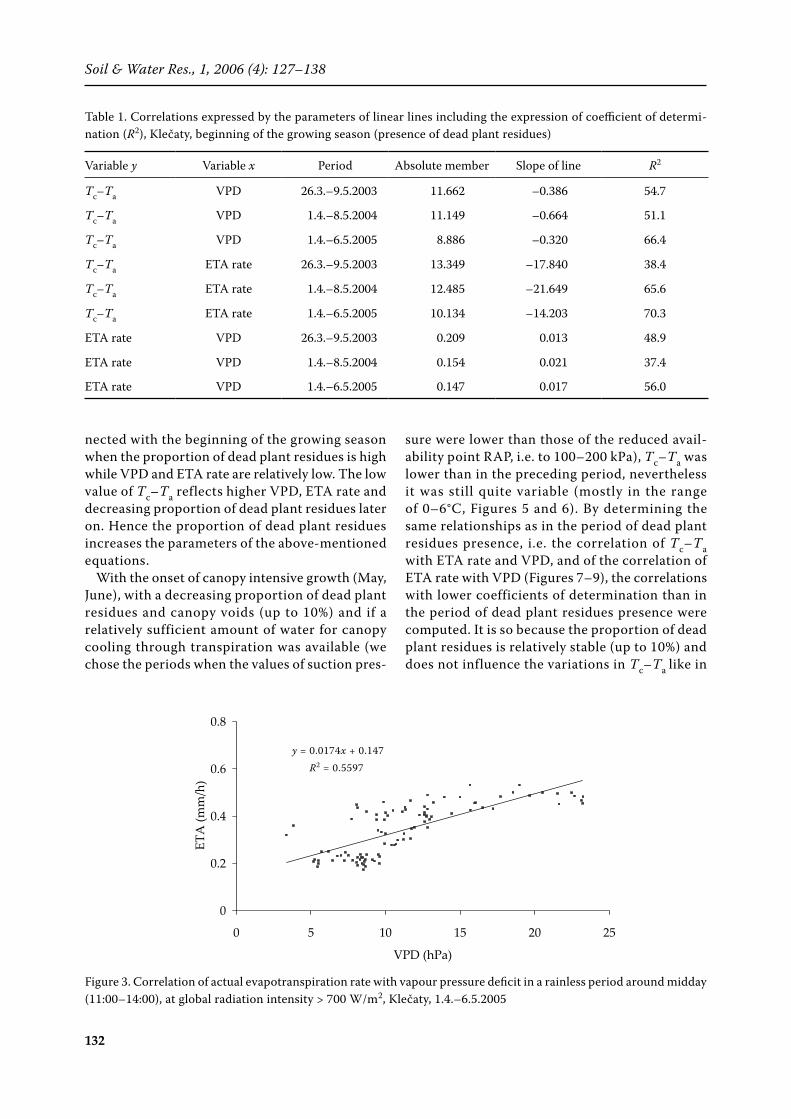
2005, similarly reported by ERHLER (1973) and IDSO et al. (1981) – and a positive linear cor-relation between ETA rate and VPD (Figure 3). A negative linear correlation of Tc–Ta with ETA rate (Figure 4) was also calculated. The deter-mined correlations for the period 2003–2005 are all statistically significant on a 0.01 significance
level and are expressed as moderately strong by means of linear equations in Table 1.
The values of absolute members and slopes of the given equations are influenced not only by the relation of Tc–Ta to VPD and ETA rate but also by the change in the proportion of dead plant residues. The large temperature difference is con-
-5
0
5
10
15
20
25
0
1:3
0
3:0
0
4:3
0
6:0
0
7:3
0
9:0
0
10:
30
12:
00
13:
30
15:
00
16:
30
18:
00
19:
30
21:
00
22:
30 0
Time
Tem
pera
ture
(°C
)
0
2
4
6
8
10
12
VPD
(hPa
)
Air temperature 2m [°C]
Surface temperature [°C]
VPD 2m [hPa]
Figure 1. Vapour pressure deficit (hPa), air and canopy temperature (°C), period of the presence of dead plant residues (sufficient amount of water in the soil), Klečaty 15.4.2004
Figure 2. Correlation of temperature difference (°C) with vapour pressure deficit (hPa) in a rainless period aroundmidday (11:00–14:00), at global radiation intensity > 700 W/m2, Klečaty, 1.4.–6.5.2005
y = –0.3203x + 8.8857R 2 = 0.6638
0
2
4
6
8
10
0 5 10 15 20 25
VPD (hPa)
Tem
pera
ture
diff
eren
ce (°
C)
Air temperature 2 m (°C) Surface temperature (°C) VPD 2 m (hPa)
y = –0.3203x + 8.8857R2 = 0.6638
Soil & Water Res., 1, 2006 (4): 127–138
132
nected with the beginning of the growing season when the proportion of dead plant residues is high while VPD and ETA rate are relatively low. The low value of Tc–Ta reflects higher VPD, ETA rate and decreasing proportion of dead plant residues later on. Hence the proportion of dead plant residues increases the parameters of the above-mentioned equations.
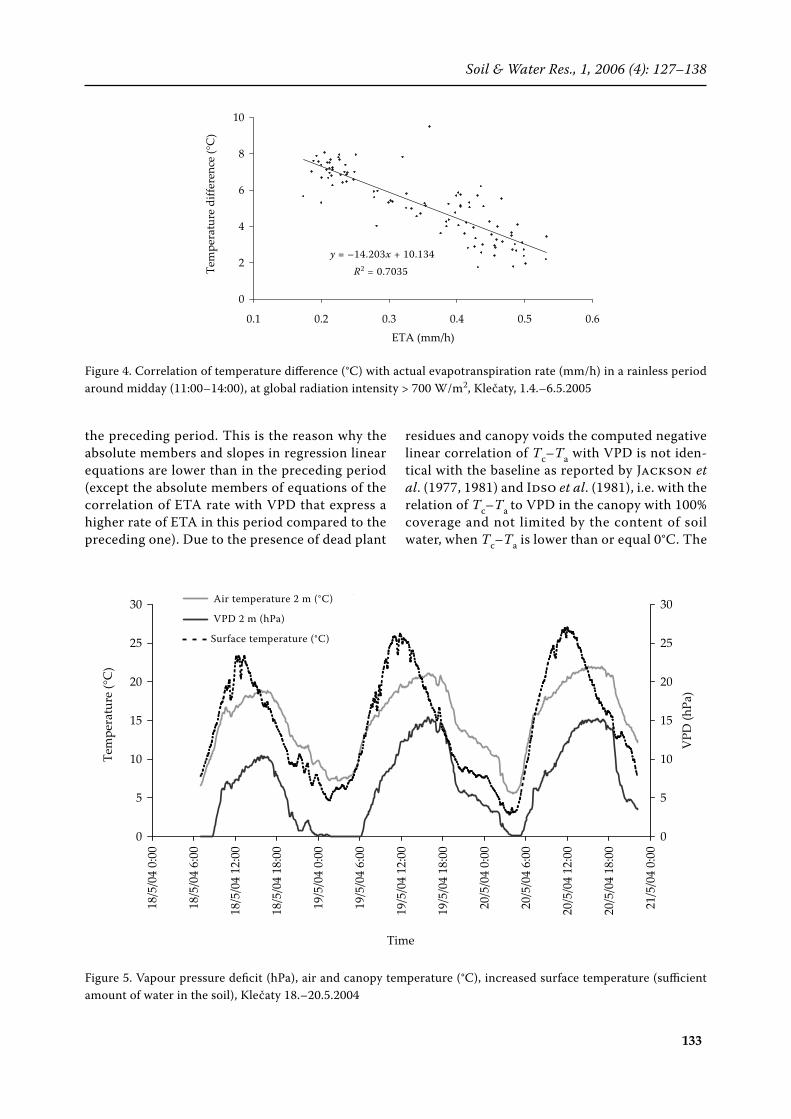
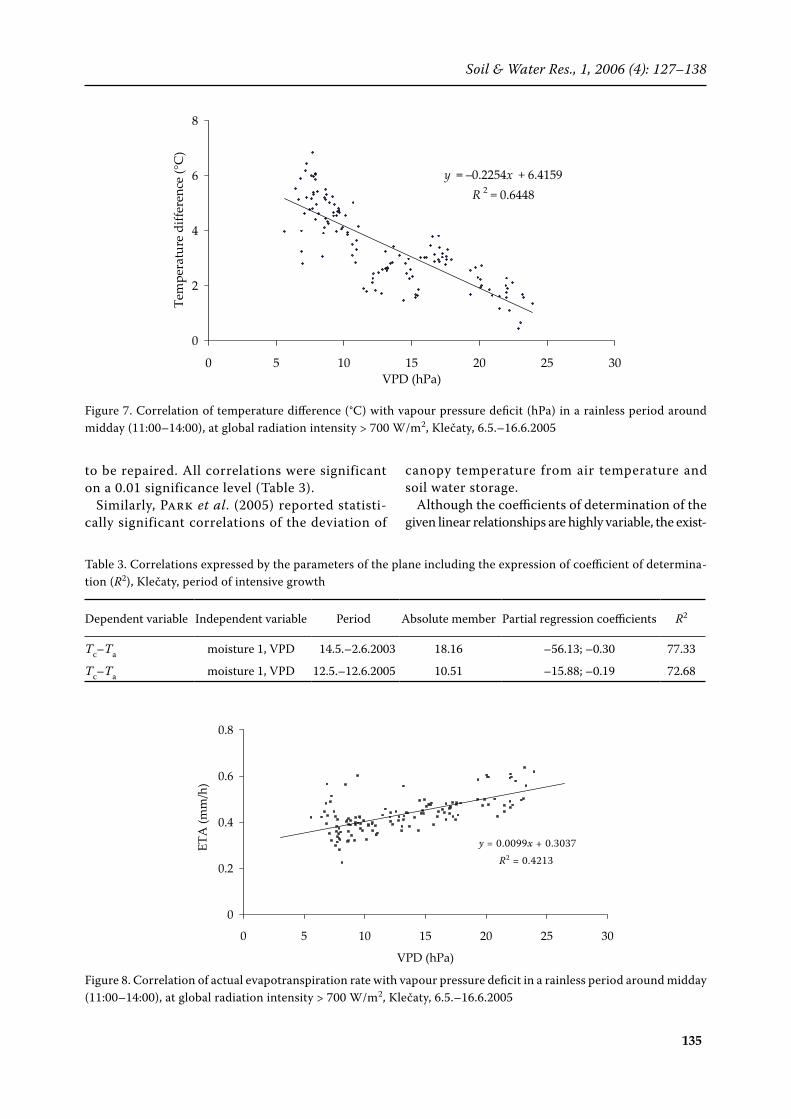
With the onset of canopy intensive growth (May, June), with a decreasing proportion of dead plant residues and canopy voids (up to 10%) and if a relatively sufficient amount of water for canopy cooling through transpiration was available (we chose the periods when the values of suction pres-
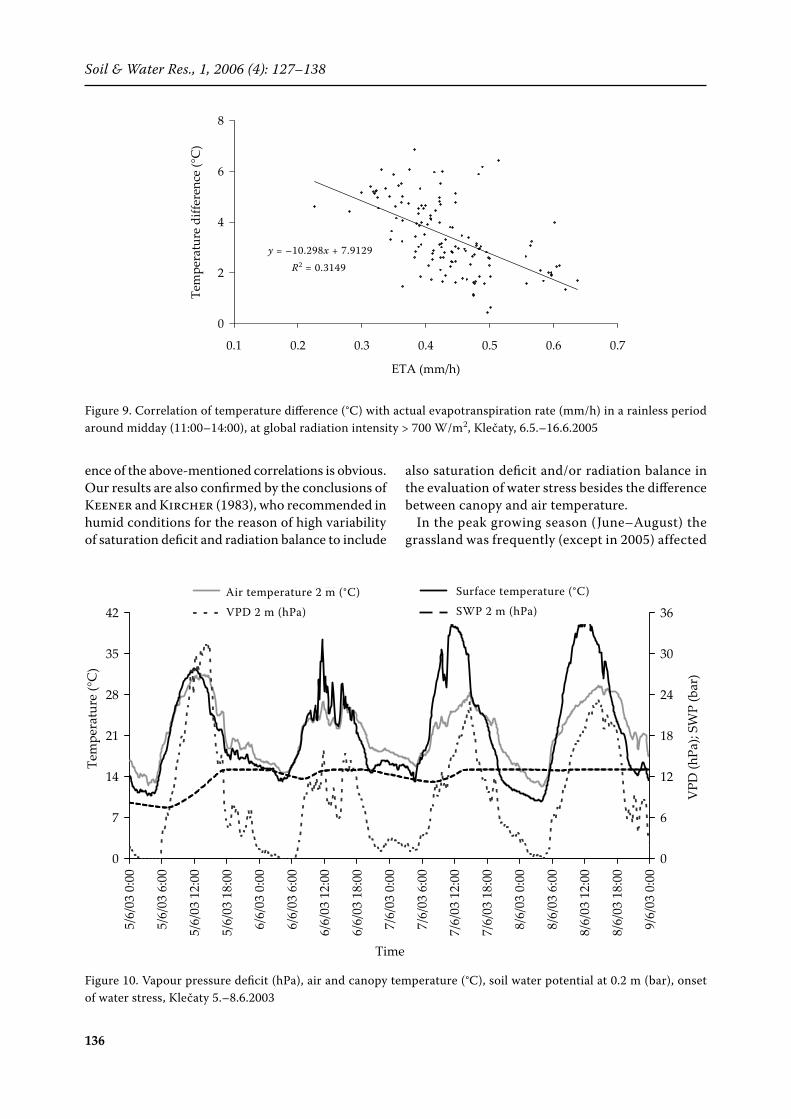
sure were lower than those of the reduced avail-ability point RAP, i.e. to 100–200 kPa), Tc–Ta was lower than in the preceding period, nevertheless it was still quite variable (mostly in the range of 0–6°C, Figures 5 and 6). By determining the same relationships as in the period of dead plant residues presence, i.e. the correlation of Tc–Ta with ETA rate and VPD, and of the correlation of ETA rate with VPD (Figures 7–9), the correlations with lower coefficients of determination than in the period of dead plant residues presence were computed. It is so because the proportion of dead plant residues is relatively stable (up to 10%) and does not influence the variations in Tc–Ta like in
Table 1. Correlations expressed by the parameters of linear lines including the expression of coefficient of determi-nation (R2), Klečaty, beginning of the growing season (presence of dead plant residues)
Variable y Variable x Period Absolute member Slope of line R2
Tc–Ta VPD 26.3.–9.5.2003 11.662 –0.386 54.7
Tc–Ta VPD 1.4.–8.5.2004 11.149 –0.664 51.1
Tc–Ta VPD 1.4.–6.5.2005 8.886 –0.320 66.4
Tc–Ta ETA rate 26.3.–9.5.2003 13.349 –17.840 38.4
Tc–Ta ETA rate 1.4.–8.5.2004 12.485 –21.649 65.6
Tc–Ta ETA rate 1.4.–6.5.2005 10.134 –14.203 70.3
ETA rate VPD 26.3.–9.5.2003 0.209 0.013 48.9
ETA rate VPD 1.4.–8.5.2004 0.154 0.021 37.4
ETA rate VPD 1.4.–6.5.2005 0.147 0.017 56.0
y = 0.0174x + 0.147R 2 = 0.5597
0
0.2
0.4
0.6
0.8
0 5 10 15 20 25
VPD (hPa)
ETA
(mm
/h)
Figure 3. Correlation of actual evapotranspiration rate with vapour pressure deficit in a rainless period around midday(11:00–14:00), at global radiation intensity > 700 W/m2, Klečaty, 1.4.–6.5.2005
y = 0.0174x + 0.147R2 = 0.5597
Soil & Water Res., 1, 2006 (4): 127–138
133
the preceding period. This is the reason why the absolute members and slopes in regression linear equations are lower than in the preceding period (except the absolute members of equations of the correlation of ETA rate with VPD that express a higher rate of ETA in this period compared to the preceding one). Due to the presence of dead plant
residues and canopy voids the computed negative linear correlation of Tc–Ta with VPD is not iden-tical with the baseline as reported by JACKSON et al. (1977, 1981) and IDSO et al. (1981), i.e. with the relation of Tc–Ta to VPD in the canopy with 100% coverage and not limited by the content of soil water, when Tc–Ta is lower than or equal 0°C. The
y = –14.203x + 10.134R 2 = 0.7035
0
2
4
6
8
10
0.1 0.2 0.3 0.4 0.5 0.6ETA (mm/h)
Tem
pera
ture
diff
eren
ce (°
C)
Figure 4. Correlation of temperature difference (°C) with actual evapotranspiration rate (mm/h) in a rainless period around midday (11:00–14:00), at global radiation intensity > 700 W/m2, Klečaty, 1.4.–6.5.2005
0
5
10
15
20
25
30
18/5
/04
0:00
18/5
/04
6:00
18/5
/04
12:0
0
18/5
/04
18:0
0
19/5
/04
0:00
19/5
/04
6:00
19/5
/04
12:0
0
19/5
/04
18:0
0
20/5
/04
0:00
20/5
/04
6:00
20/5
/04
12:0
0
20/5
/04
18:0
0
21/5
/04
0:00
Time
Tem
pera
ture
(°C
)
0
5
10
15
20
25
30
VPD
(hPa
)
Air temperature 2m [deg.C]
VPD 2m [hPa]
Surface temperature [deg.C]
Figure 5. Vapour pressure deficit (hPa), air and canopy temperature (°C), increased surface temperature (sufficientamount of water in the soil), Klečaty 18.–20.5.2004
Air temperature 2 m (°C)
VPD 2 m (hPa)
Surface temperature (°C)
y = –14.203x + 10.134R2 = 0.7035
Soil & Water Res., 1, 2006 (4): 127–138
134
relatively high value of Tc–Ta is also caused by the measurement of Ta at 2 m above the ground, which is lower than at a height of 1.5 m (JACKSON et al. 1977, 1981; IDSO 1982). Last but not least, the relation of Tc–Ta to VPD is influenced by the crop species – itsaerodynamic resistance ra (e.g. IDSO 1982).
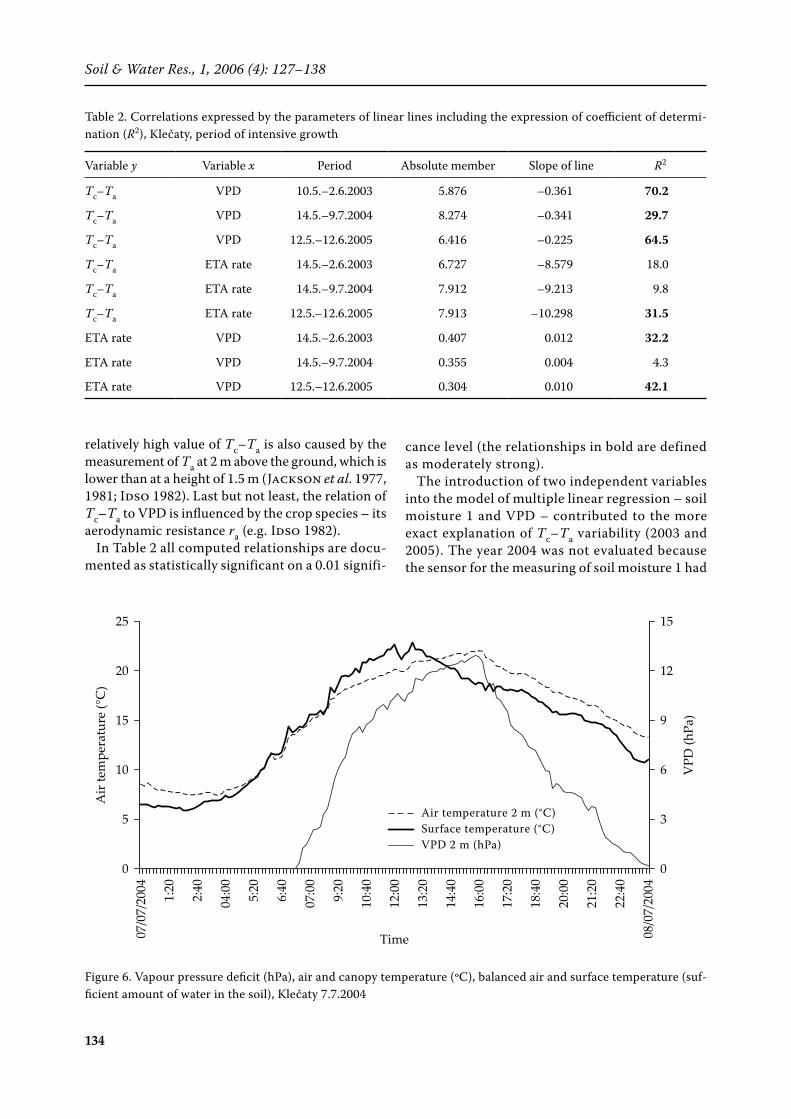
In Table 2 all computed relationships are docu-mented as statistically significant on a 0.01 signifi-
cance level (the relationships in bold are defined as moderately strong).
The introduction of two independent variables into the model of multiple linear regression – soil moisture 1 and VPD – contributed to the more exact explanation of Tc–Ta variability (2003 and 2005). The year 2004 was not evaluated because the sensor for the measuring of soil moisture 1 had
Table 2. Correlations expressed by the parameters of linear lines including the expression of coefficient of determi-nation (R2), Klečaty, period of intensive growth
Variable y Variable x Period Absolute member Slope of line R2
Tc–Ta VPD 10.5.–2.6.2003 5.876 –0.361 70.2
Tc–Ta VPD 14.5.–9.7.2004 8.274 –0.341 29.7
Tc–Ta VPD 12.5.–12.6.2005 6.416 –0.225 64.5
Tc–Ta ETA rate 14.5.–2.6.2003 6.727 –8.579 18.0
Tc–Ta ETA rate 14.5.–9.7.2004 7.912 –9.213 9.8
Tc–Ta ETA rate 12.5.–12.6.2005 7.913 –10.298 31.5
ETA rate VPD 14.5.–2.6.2003 0.407 0.012 32.2
ETA rate VPD 14.5.–9.7.2004 0.355 0.004 4.3
ETA rate VPD 12.5.–12.6.2005 0.304 0.010 42.1
0
5
10
15
20
25
07/0
7/20
04
1:2
0
2:4
0
04:0
0
5:2
0
6:4
0
07:0
0
9:2
0
10:
40
12:0
0
13:
20
14:
40
16:0
0
17:
20
18:
40
20:0
0
21:
20
22:
40
08/0
7/20
04
Time
Air
tem
pera
ture
(°C
)
0
3
6
9
12
15
VPD
(hPa
)
Air temperature 2m [°C]Surface temperature [°C]VPD 2m [hPa]
Figure 6. Vapour pressure deficit (hPa), air and canopy temperature (ºC), balanced air and surface temperature (suf-ficient amount of water in the soil), Klečaty 7.7.2004
Air temperature 2 m (°C) Surface temperature (°C) VPD 2 m (hPa)
Soil & Water Res., 1, 2006 (4): 127–138
135
to be repaired. All correlations were significant on a 0.01 significance level (Table 3).
Similarly, PARK et al. (2005) reported statisti-cally significant correlations of the deviation of
canopy temperature from air temperature and soil water storage.
Although the coefficients of determination of thegiven linear relationships are highly variable, the exist-
Figure 7. Correlation of temperature difference (°C) with vapour pressure deficit (hPa) in a rainless period aroundmidday (11:00–14:00), at global radiation intensity > 700 W/m2, Klečaty, 6.5.–16.6.2005
y = –0.2254x + 6.4159R 2 = 0.6448
0
2
4
6
8
0 5 10 15 20 25 30VPD (hPa)
Tem
pera
ture
diff
eren
ce (°
C)
Figure 8. Correlation of actual evapotranspiration rate with vapour pressure deficit in a rainless period around midday(11:00–14:00), at global radiation intensity > 700 W/m2, Klečaty, 6.5.–16.6.2005
y = 0.0099x + 0.3037R 2 = 0.4213
0
0.2
0.4
0.6
0.8
0 5 10 15 20 25 30
VPD (hPa)
ETA
(mm
/h)
Table 3. Correlations expressed by the parameters of the plane including the expression of coefficient of determina-tion (R2), Klečaty, period of intensive growth
Dependent variable Independent variable Period Absolute member Partial regression coefficients R2
Tc–Ta moisture 1, VPD 14.5.–2.6.2003 18.16 –56.13; –0.30 77.33
Tc–Ta moisture 1, VPD 12.5.–12.6.2005 10.51 –15.88; –0.19 72.68
y = 0.0099x + 0.3037R2 = 0.4213
Soil & Water Res., 1, 2006 (4): 127–138
136
ence of the above-mentioned correlations is obvious. Our results are also confirmed by the conclusions of KEENER and KIRCHER (1983), who recommended in humid conditions for the reason of high variability of saturation deficit and radiation balance to include
also saturation deficit and/or radiation balance inthe evaluation of water stress besides the differencebetween canopy and air temperature.
In the peak growing season (June–August) the grassland was frequently (except in 2005) affected
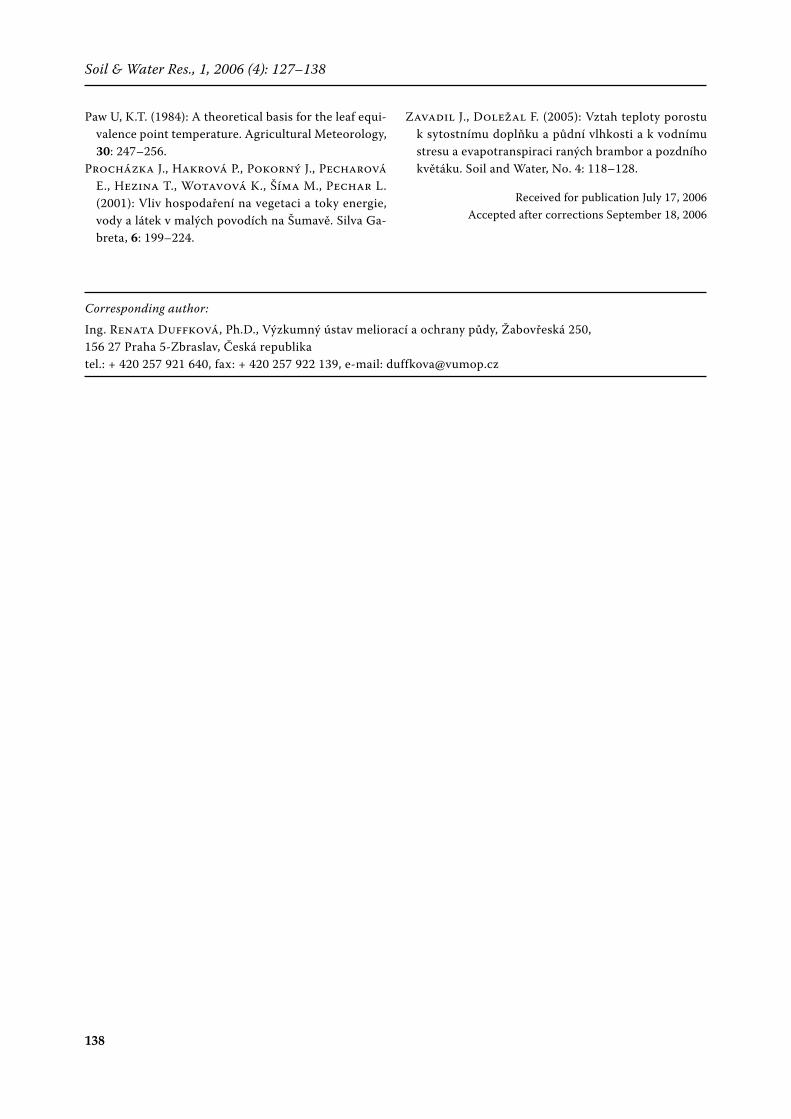
Figure 10. Vapour pressure deficit (hPa), air and canopy temperature (°C), soil water potential at 0.2 m (bar), onset of water stress, Klečaty 5.–8.6.2003
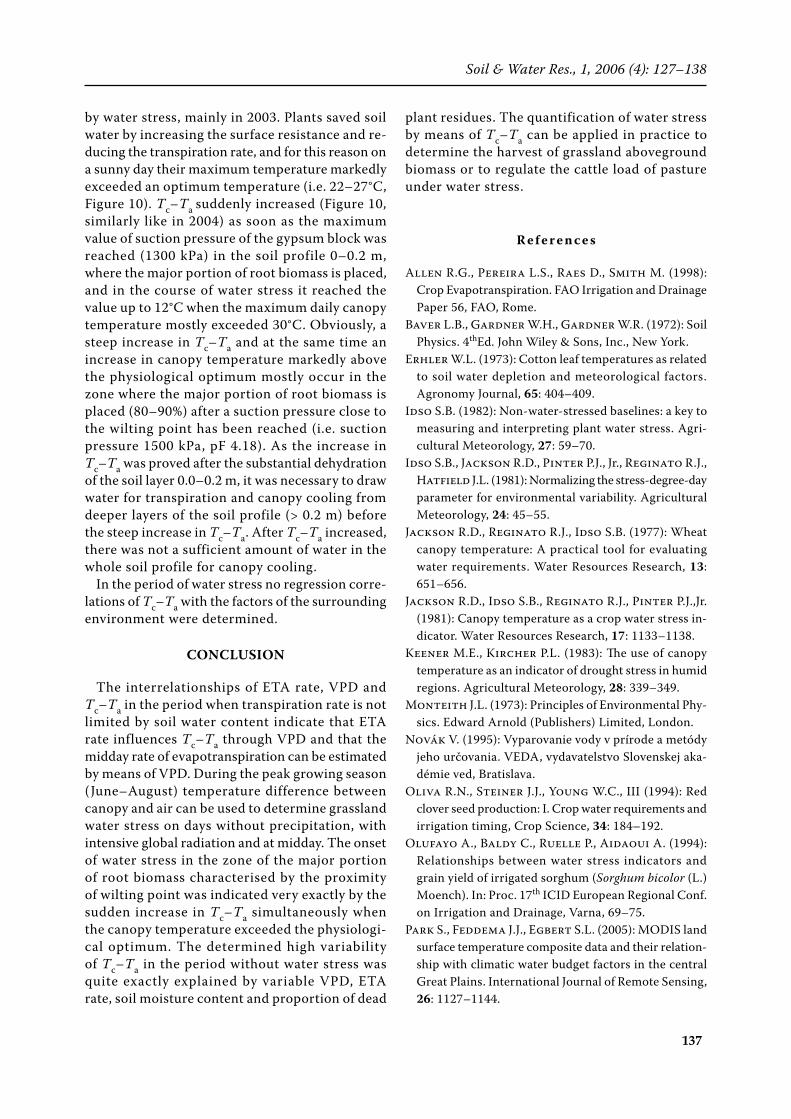
Figure 9. Correlation of temperature difference (°C) with actual evapotranspiration rate (mm/h) in a rainless period around midday (11:00–14:00), at global radiation intensity > 700 W/m2, Klečaty, 6.5.–16.6.2005
y = –10.298x + 7.9129R 2 = 0.3149
0
2
4
6
8
0.1 0.2 0.3 0.4 0.5 0.6 0.7
ETA (mm/h)
Tem
pera
ture
diff
eren
ce (°
C)
0
7
14
21
28
35
42
5/6/
03 0
:00
5/6/
03 6
:00
5/6/
03 1
2:00
5/6/
03 1
8:00
6/6/
03 0
:00
6/6/
03 6
:00
6/6/
03 1
2:00
6/6/
03 1
8:00
7/6/
03 0
:00
7/6/
03 6
:00
7/6/
03 1
2:00
7/6/
03 1
8:00
8/6/
03 0
:00
8/6/
03 6
:00
8/6/
03 1
2:00
8/6/
03 1
8:00
9/6/
03 0
:00
Time
Tem
pera
ture
(°C
)
0
6
12
18
24
30
36
VPD
(hPa
); SW
P (b
ar)
Air temper. 2m [°C] Surface temperature [deg.C]
VPD 2m [hPa] SWP 0,2m [bar]
Air temperature 2 m (°C)
VPD 2 m (hPa)
Surface temperature (°C)
SWP 2 m (hPa)
y = –10.298x + 7.9129R2 = 0.3149
Soil & Water Res., 1, 2006 (4): 127–138
137
by water stress, mainly in 2003. Plants saved soil water by increasing the surface resistance and re-ducing the transpiration rate, and for this reason on a sunny day their maximum temperature markedly exceeded an optimum temperature (i.e. 22–27°C, Figure 10). Tc–Ta suddenly increased (Figure 10, similarly like in 2004) as soon as the maximum value of suction pressure of the gypsum block was reached (1300 kPa) in the soil profile 0–0.2 m, where the major portion of root biomass is placed, and in the course of water stress it reached the value up to 12°C when the maximum daily canopy temperature mostly exceeded 30°C. Obviously, a steep increase in Tc–Ta and at the same time an increase in canopy temperature markedly above the physiological optimum mostly occur in the zone where the major portion of root biomass is placed (80–90%) after a suction pressure close to the wilting point has been reached (i.e. suction pressure 1500 kPa, pF 4.18). As the increase in Tc–Ta was proved after the substantial dehydration of the soil layer 0.0–0.2 m, it was necessary to draw water for transpiration and canopy cooling from deeper layers of the soil profile (> 0.2 m) before the steep increase in Tc–Ta. After Tc–Ta increased, there was not a sufficient amount of water in the whole soil profile for canopy cooling.
In the period of water stress no regression corre-lations of Tc–Ta with the factors of the surrounding environment were determined.
CONCLUSION
The interrelationships of ETA rate, VPD and Tc–Ta in the period when transpiration rate is not limited by soil water content indicate that ETA rate influences Tc–Ta through VPD and that the midday rate of evapotranspiration can be estimated by means of VPD. During the peak growing season (June–August) temperature difference between canopy and air can be used to determine grassland water stress on days without precipitation, with intensive global radiation and at midday. The onset of water stress in the zone of the major portion of root biomass characterised by the proximity of wilting point was indicated very exactly by the sudden increase in Tc–Ta simultaneously when the canopy temperature exceeded the physiologi-cal optimum. The determined high variability of Tc–Ta in the period without water stress was quite exactly explained by variable VPD, ETA rate, soil moisture content and proportion of dead
plant residues. The quantification of water stress by means of Tc–Ta can be applied in practice to determine the harvest of grassland aboveground biomass or to regulate the cattle load of pasture under water stress.
R e f e r e n c e s
ALLEN R.G., PEREIRA L.S., RAES D., SMITH M. (1998): Crop Evapotranspiration. FAO Irrigation and Drainage Paper 56, FAO, Rome.
BAVER L.B., GARDNER W.H., GARDNER W.R. (1972): Soil Physics. 4thEd. John Wiley & Sons, Inc., New York.
ERHLER W.L. (1973): Cotton leaf temperatures as related to soil water depletion and meteorological factors. Agronomy Journal, 65: 404–409.
IDSO S.B. (1982): Non-water-stressed baselines: a key to measuring and interpreting plant water stress. Agri-cultural Meteorology, 27: 59–70.
IDSO S.B., JACKSON R.D., PINTER P.J., Jr., REGINATO R.J., HATFIELD J.L. (1981): Normalizing the stress-degree-day parameter for environmental variability. Agricultural Meteorology, 24: 45–55.
JACKSON R.D., REGINATO R.J., IDSO S.B. (1977): Wheat canopy temperature: A practical tool for evaluating water requirements. Water Resources Research, 13: 651–656.
JACKSON R.D., IDSO S.B., REGINATO R.J., PINTER P.J.,Jr. (1981): Canopy temperature as a crop water stress in-dicator. Water Resources Research, 17: 1133–1138.
KEENER M.E., KIRCHER P.L. (1983): The use of canopytemperature as an indicator of drought stress in humid regions. Agricultural Meteorology, 28: 339–349.
MONTEITH J.L. (1973): Principles of Environmental Phy-sics. Edward Arnold (Publishers) Limited, London.
NOVÁK V. (1995): Vyparovanie vody v prírode a metódy jeho určovania. VEDA, vydavatelstvo Slovenskej aka-démie ved, Bratislava.
OLIVA R.N., STEINER J.J., YOUNG W.C., III (1994): Red clover seed production: I. Crop water requirements and irrigation timing, Crop Science, 34: 184–192.
OLUFAYO A., BALDY C., RUELLE P., AIDAOUI A. (1994): Relationships between water stress indicators and grain yield of irrigated sorghum (Sorghum bicolor (L.) Moench). In: Proc. 17th ICID European Regional Conf. on Irrigation and Drainage, Varna, 69–75.
PARK S., FEDDEMA J.J., EGBERT S.L. (2005): MODIS land surface temperature composite data and their relation-ship with climatic water budget factors in the central Great Plains. International Journal of Remote Sensing, 26: 1127–1144.
Soil & Water Res., 1, 2006 (4): 127–138
138
Paw U, K.T. (1984): A theoretical basis for the leaf equi-valence point temperature. Agricultural Meteorology, 30: 247–256.
PROCHÁZKA J., HAKROVÁ P., POKORNÝ J., PECHAROVÁ E., HEZINA T., WOTAVOVÁ K., ŠÍMA M., PECHAR L. (2001): Vliv hospodaření na vegetaci a toky energie, vody a látek v malých povodích na Šumavě. Silva Ga-breta, 6: 199–224.
ZAVADIL J., DOLEŽAL F. (2005): Vztah teploty porostu k sytostnímu doplňku a půdní vlhkosti a k vodnímu stresu a evapotranspiraci raných brambor a pozdního květáku. Soil and Water, No. 4: 118–128.
Received for publication July 17, 2006Accepted after corrections September 18, 2006
Corresponding author:
Ing. RENATA DUFFKOVÁ, Ph.D., Výzkumný ústav meliorací a ochrany půdy, Žabovřeská 250, 156 27 Praha 5-Zbraslav, Česká republika tel.: + 420 257 921 640, fax: + 420 257 922 139, e-mail: [email protected]
Soil & Water Res., 1, 2006 (4): 127–138