Embed Size (px)
Citation preview
Diff: simplifying the causal inference analysis with difference-in-differences
Juan M. Villa
PhD Student – University of Manchester
18th London Stata Users Group Meeting September 12th, 2012
Content
1. Considerations on causal inference.
2. What is diff?
3. Difference in differences a) Single diff-in-diff b) Diff-in-diff with covariates c) Kernel propensity score diff-in-diff d) Quantile diff-in-diff
4. Balancing test
Causal inference
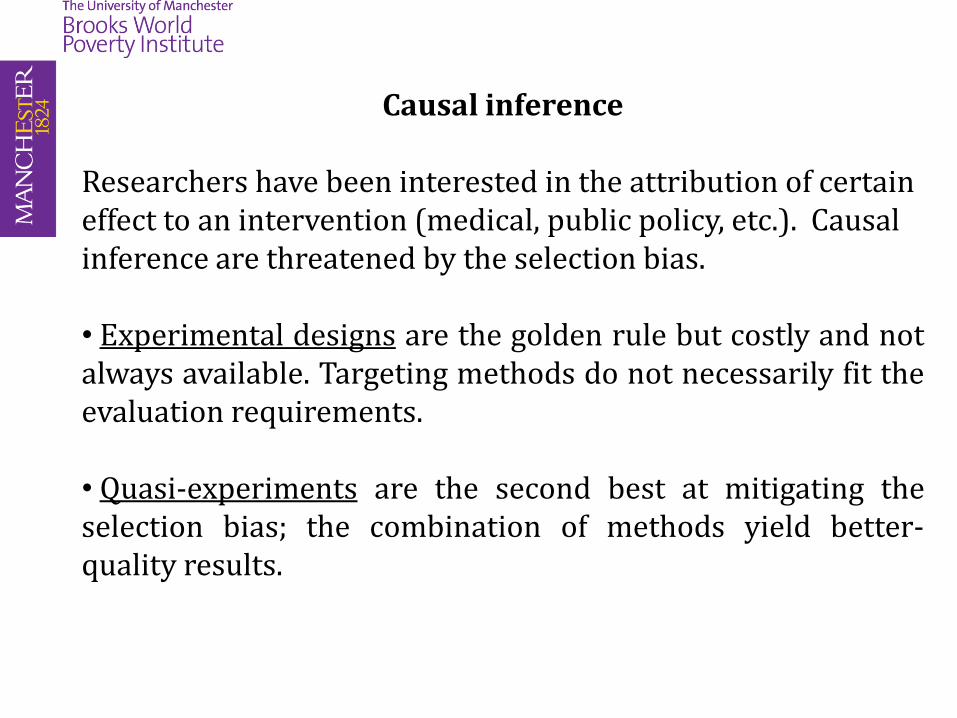
Researchers have been interested in the attribution of certain effect to an intervention (medical, public policy, etc.). Causal inference are threatened by the selection bias. • Experimental designs are the golden rule but costly and not always available. Targeting methods do not necessarily fit the evaluation requirements. • Quasi-experiments are the second best at mitigating the selection bias; the combination of methods yield better-quality results.
Causal inference
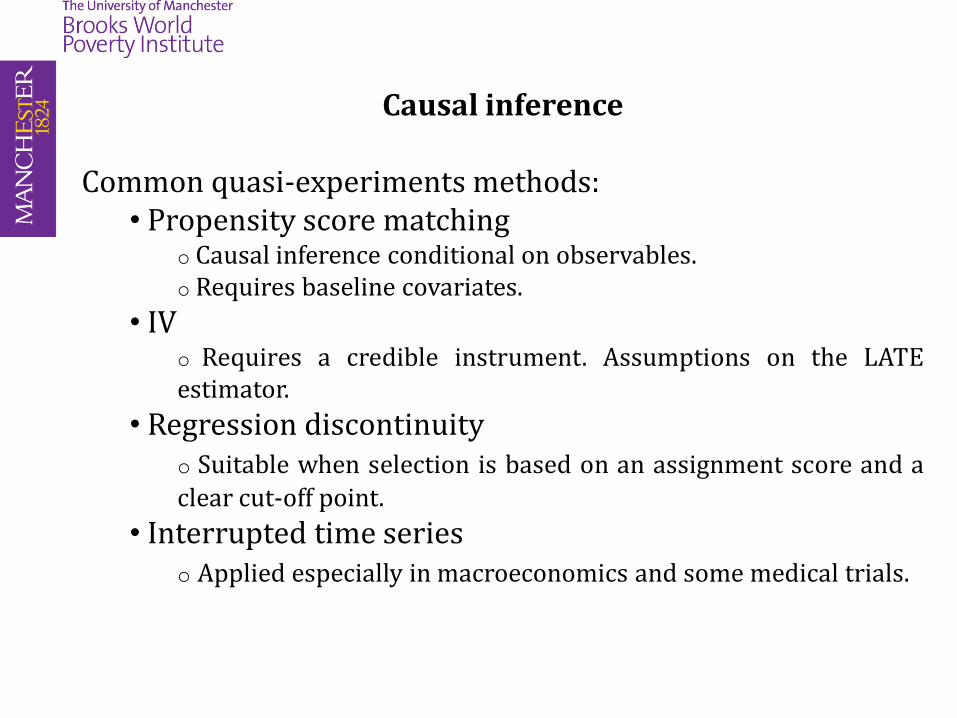
Common quasi-experiments methods: • Propensity score matching
o Causal inference conditional on observables. o Requires baseline covariates.
• IV o Requires a credible instrument. Assumptions on the LATE estimator.
• Regression discontinuity o Suitable when selection is based on an assignment score and a
clear cut-off point.
• Interrupted time series o Applied especially in macroeconomics and some medical trials.
What is diff?
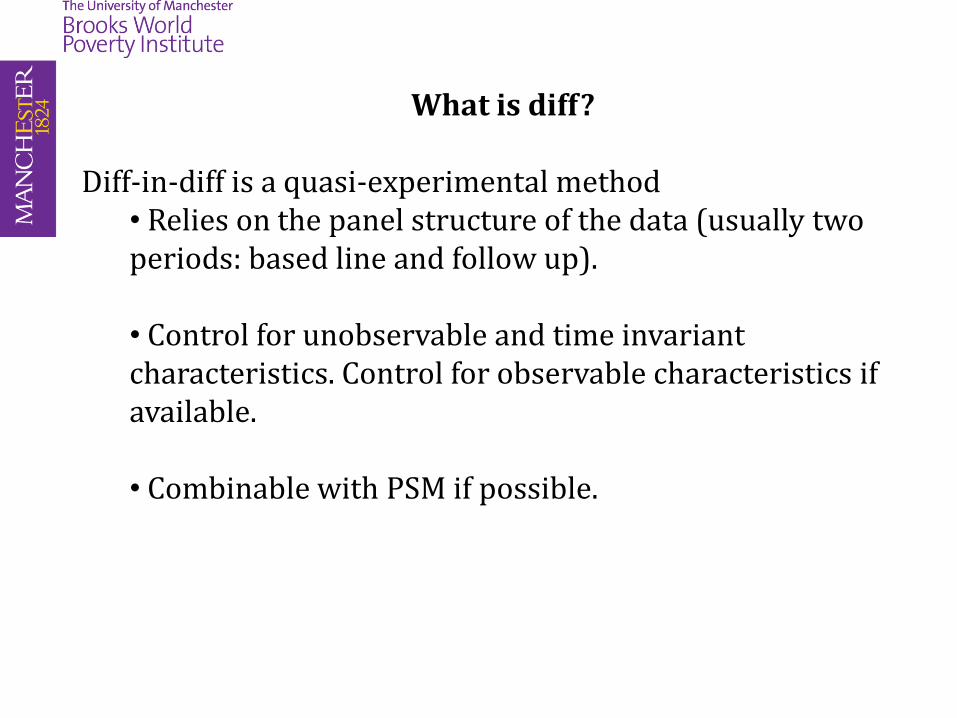
Diff-in-diff is a quasi-experimental method • Relies on the panel structure of the data (usually two periods: based line and follow up). • Control for unobservable and time invariant characteristics. Control for observable characteristics if available. • Combinable with PSM if possible.
What is diff?
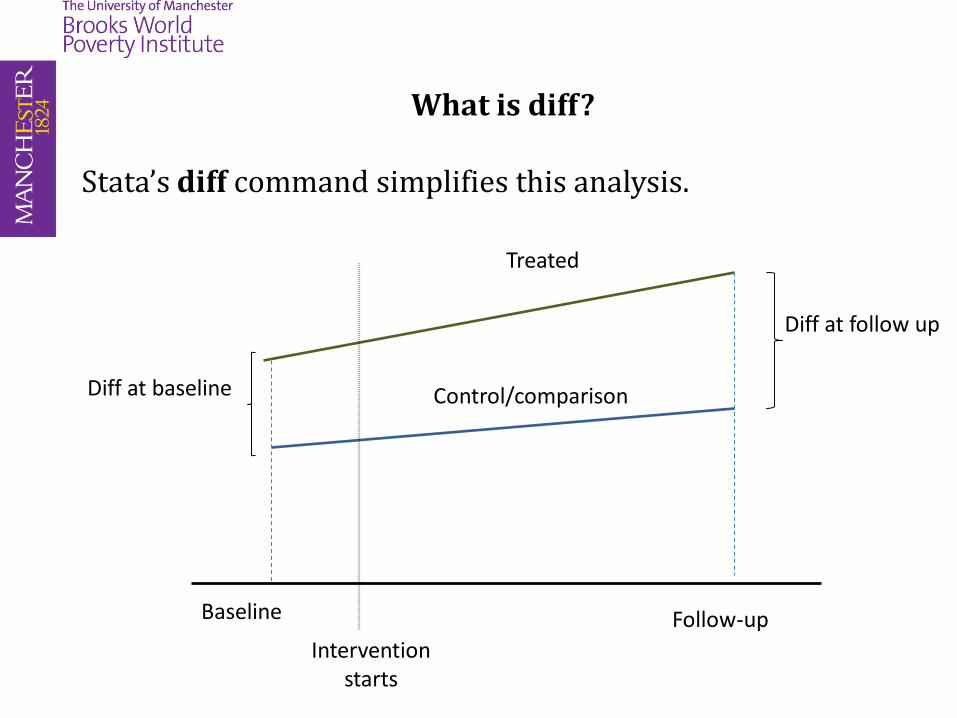
Stata’s diff command simplifies this analysis.
Baseline Follow-up
Diff at follow up
Diff at baseline
Treated
Control/comparison
Intervention starts
What is diff?
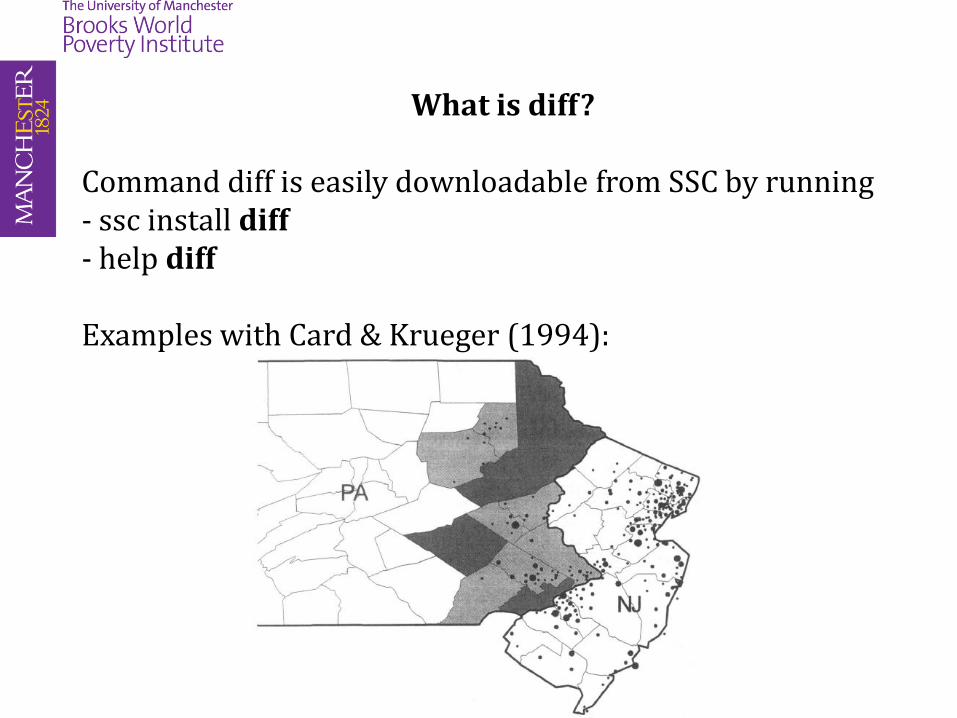
Command diff is easily downloadable from SSC by running - ssc install diff - help diff Examples with Card & Krueger (1994):
What is diff?
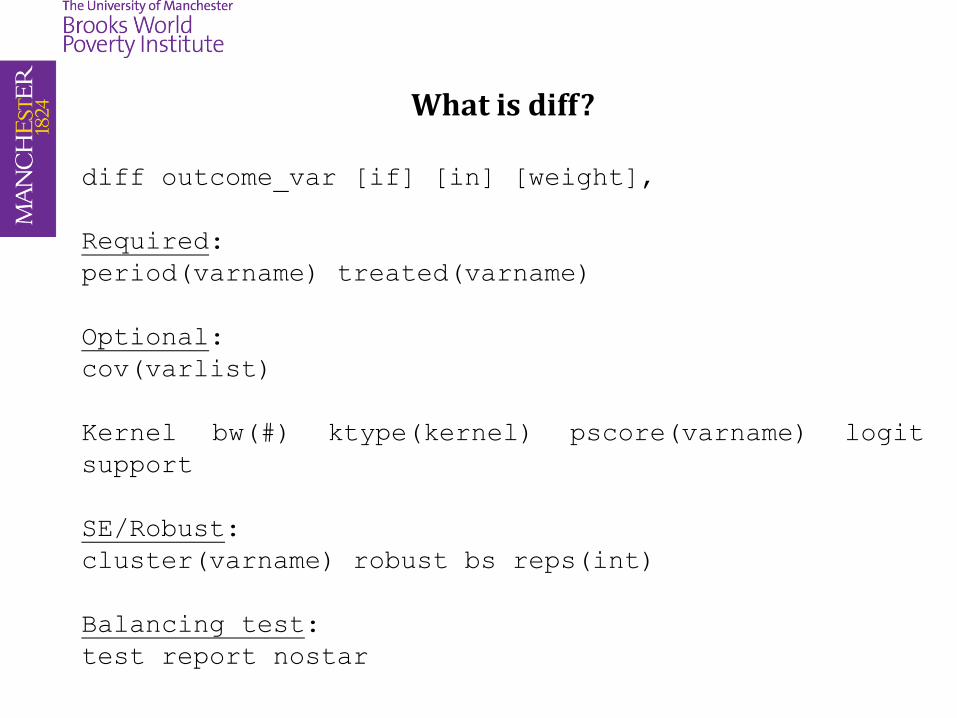
diff outcome_var [if] [in] [weight],
Required:
period(varname) treated(varname)
Optional:
cov(varlist)
Kernel bw(#) ktype(kernel) pscore(varname) logit
support
SE/Robust:
cluster(varname) robust bs reps(int)
Balancing test:
test report nostar
What is diff?
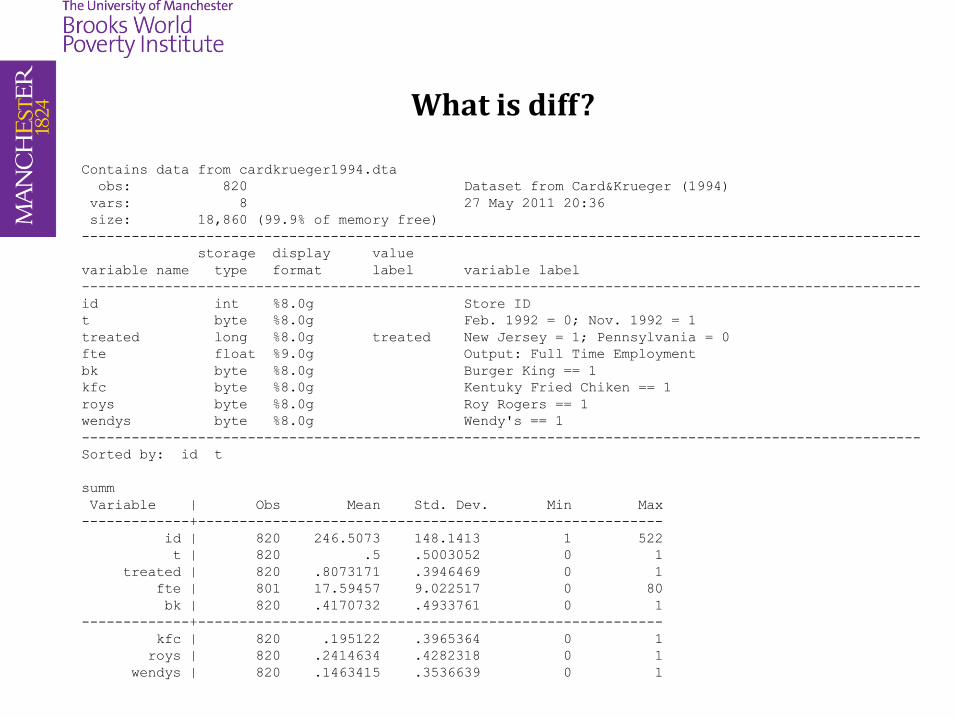
Contains data from cardkrueger1994.dta
obs: 820 Dataset from Card&Krueger (1994)
vars: 8 27 May 2011 20:36
size: 18,860 (99.9% of memory free)
-----------------------------------------------------------------------------------------------------
storage display value
variable name type format label variable label
-----------------------------------------------------------------------------------------------------
id int %8.0g Store ID
t byte %8.0g Feb. 1992 = 0; Nov. 1992 = 1
treated long %8.0g treated New Jersey = 1; Pennsylvania = 0
fte float %9.0g Output: Full Time Employment
bk byte %8.0g Burger King == 1
kfc byte %8.0g Kentuky Fried Chiken == 1
roys byte %8.0g Roy Rogers == 1
wendys byte %8.0g Wendy's == 1
-----------------------------------------------------------------------------------------------------
Sorted by: id t
summ
Variable | Obs Mean Std. Dev. Min Max
-------------+--------------------------------------------------------
id | 820 246.5073 148.1413 1 522
t | 820 .5 .5003052 0 1
treated | 820 .8073171 .3946469 0 1
fte | 801 17.59457 9.022517 0 80
bk | 820 .4170732 .4933761 0 1
-------------+--------------------------------------------------------
kfc | 820 .195122 .3965364 0 1
roys | 820 .2414634 .4282318 0 1
wendys | 820 .1463415 .3536639 0 1
Difference in differences
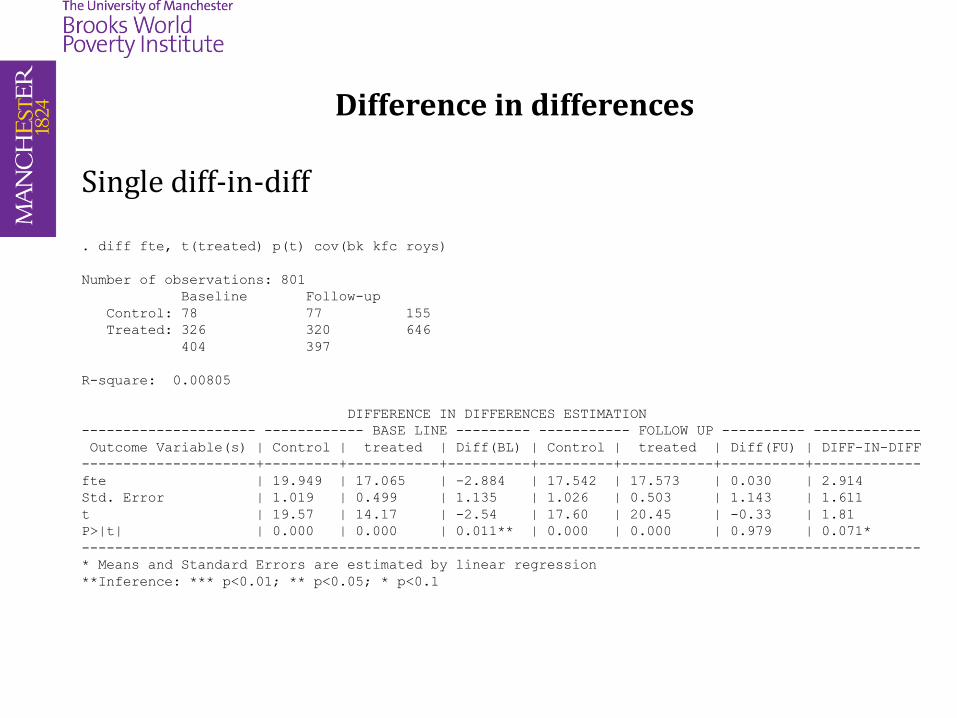
Single diff-in-diff . diff fte, t(treated) p(t) cov(bk kfc roys)
Number of observations: 801
Baseline Follow-up
Control: 78 77 155
Treated: 326 320 646
404 397
R-square: 0.00805
DIFFERENCE IN DIFFERENCES ESTIMATION
--------------------- ------------ BASE LINE --------- ----------- FOLLOW UP ---------- -------------
Outcome Variable(s) | Control | treated | Diff(BL) | Control | treated | Diff(FU) | DIFF-IN-DIFF
---------------------+---------+-----------+----------+---------+-----------+----------+-------------
fte | 19.949 | 17.065 | -2.884 | 17.542 | 17.573 | 0.030 | 2.914
Std. Error | 1.019 | 0.499 | 1.135 | 1.026 | 0.503 | 1.143 | 1.611
t | 19.57 | 14.17 | -2.54 | 17.60 | 20.45 | -0.33 | 1.81
P>|t| | 0.000 | 0.000 | 0.011** | 0.000 | 0.000 | 0.979 | 0.071*
-----------------------------------------------------------------------------------------------------
* Means and Standard Errors are estimated by linear regression
**Inference: *** p<0.01; ** p<0.05; * p<0.1
Difference in differences
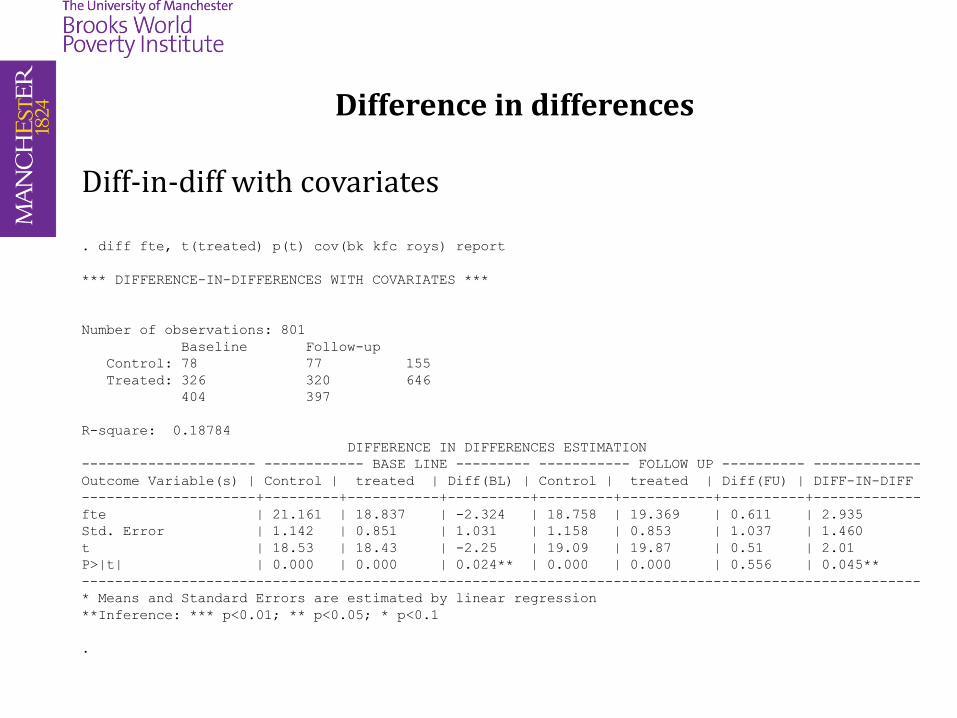
Diff-in-diff with covariates . diff fte, t(treated) p(t) cov(bk kfc roys) report
*** DIFFERENCE-IN-DIFFERENCES WITH COVARIATES ***
Number of observations: 801
Baseline Follow-up
Control: 78 77 155
Treated: 326 320 646
404 397
R-square: 0.18784
DIFFERENCE IN DIFFERENCES ESTIMATION
--------------------- ------------ BASE LINE --------- ----------- FOLLOW UP ---------- -------------
Outcome Variable(s) | Control | treated | Diff(BL) | Control | treated | Diff(FU) | DIFF-IN-DIFF
---------------------+---------+-----------+----------+---------+-----------+----------+-------------
fte | 21.161 | 18.837 | -2.324 | 18.758 | 19.369 | 0.611 | 2.935
Std. Error | 1.142 | 0.851 | 1.031 | 1.158 | 0.853 | 1.037 | 1.460
t | 18.53 | 18.43 | -2.25 | 19.09 | 19.87 | 0.51 | 2.01
P>|t| | 0.000 | 0.000 | 0.024** | 0.000 | 0.000 | 0.556 | 0.045**
-----------------------------------------------------------------------------------------------------
* Means and Standard Errors are estimated by linear regression
**Inference: *** p<0.01; ** p<0.05; * p<0.1
.
Difference in differences
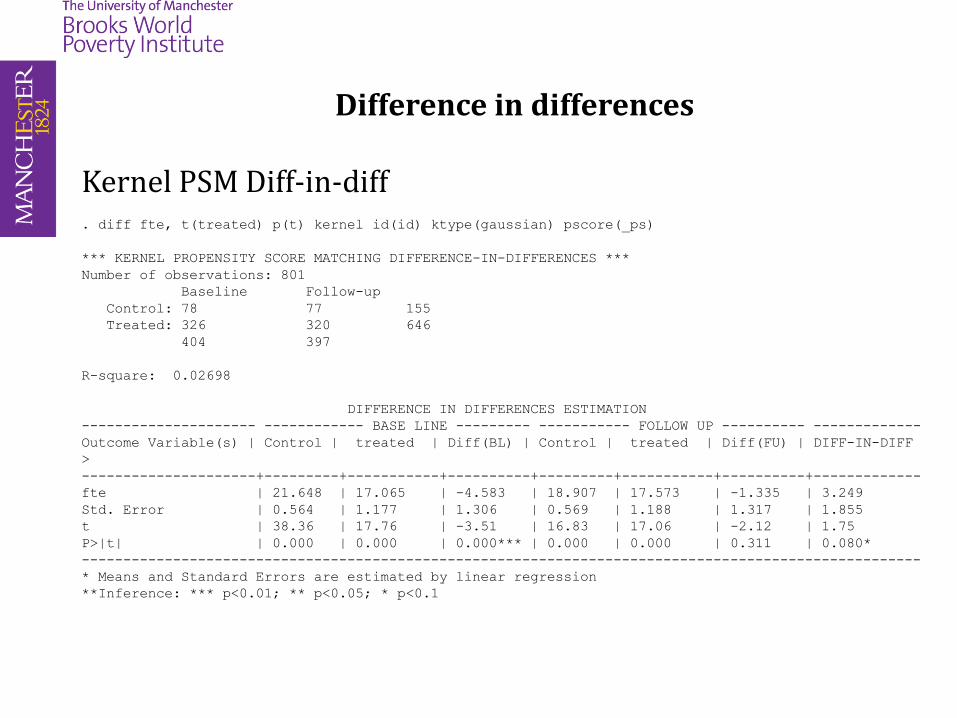
Kernel PSM Diff-in-diff
. diff fte, t(treated) p(t) kernel id(id) ktype(gaussian) pscore(_ps)
*** KERNEL PROPENSITY SCORE MATCHING DIFFERENCE-IN-DIFFERENCES ***
Number of observations: 801
Baseline Follow-up
Control: 78 77 155
Treated: 326 320 646
404 397
R-square: 0.02698
DIFFERENCE IN DIFFERENCES ESTIMATION
--------------------- ------------ BASE LINE --------- ----------- FOLLOW UP ---------- -------------
Outcome Variable(s) | Control | treated | Diff(BL) | Control | treated | Diff(FU) | DIFF-IN-DIFF
>
---------------------+---------+-----------+----------+---------+-----------+----------+-------------
fte | 21.648 | 17.065 | -4.583 | 18.907 | 17.573 | -1.335 | 3.249
Std. Error | 0.564 | 1.177 | 1.306 | 0.569 | 1.188 | 1.317 | 1.855
t | 38.36 | 17.76 | -3.51 | 16.83 | 17.06 | -2.12 | 1.75
P>|t| | 0.000 | 0.000 | 0.000*** | 0.000 | 0.000 | 0.311 | 0.080*
-----------------------------------------------------------------------------------------------------
* Means and Standard Errors are estimated by linear regression
**Inference: *** p<0.01; ** p<0.05; * p<0.1

Difference in differences
Quantile Diff-in-diff
. diff fte, t(treated) p(t) qdid(0.25)
Number of observations: 801
Baseline Follow-up
Control: 78 77 155
Treated: 326 320 646
404 397
R-square: 0.00297
DIFFERENCE IN DIFFERENCES ESTIMATION
--------------------- ------------ BASE LINE --------- ----------- FOLLOW UP ---------- -------------
Outcome Variable(s) | Control | treated | Diff(BL) | Control | treated | Diff(FU) | DIFF-IN-DIFF
---------------------+---------+-----------+----------+---------+-----------+----------+-------------
fte | 12.500 | 11.000 | -1.500 | 11.500 | 11.500 | -0.000 | 1.500
Std. Error | 1.411 | 0.720 | 1.584 | 1.490 | 0.728 | 1.658 | 2.293
t | 8.86 | 10.42 | -0.95 | 11.83 | 12.06 | -0.60 | 0.65
P>|t| | 0.000 | 0.000 | 0.344 | 0.000 | 0.000 | 1.000 | 0.513
-----------------------------------------------------------------------------------------------------
* Values are estimated at the .25 quantile
**Inference: *** p<0.01; ** p<0.05; * p<0.1
Difference in differences
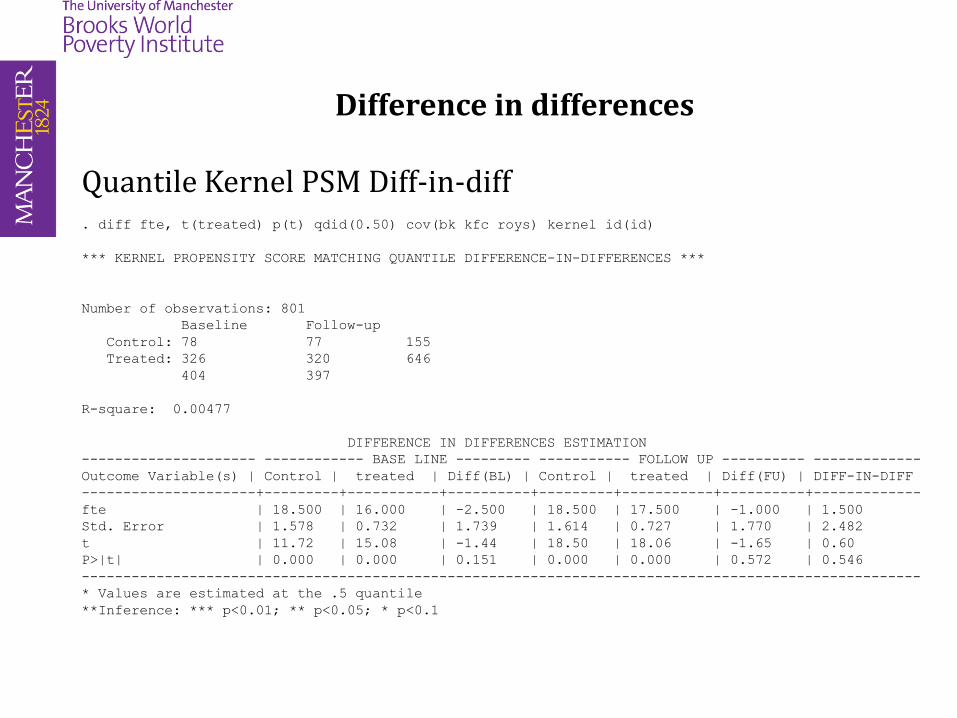
Quantile Kernel PSM Diff-in-diff
. diff fte, t(treated) p(t) qdid(0.50) cov(bk kfc roys) kernel id(id)
*** KERNEL PROPENSITY SCORE MATCHING QUANTILE DIFFERENCE-IN-DIFFERENCES ***
Number of observations: 801
Baseline Follow-up
Control: 78 77 155
Treated: 326 320 646
404 397
R-square: 0.00477
DIFFERENCE IN DIFFERENCES ESTIMATION
--------------------- ------------ BASE LINE --------- ----------- FOLLOW UP ---------- -------------
Outcome Variable(s) | Control | treated | Diff(BL) | Control | treated | Diff(FU) | DIFF-IN-DIFF
---------------------+---------+-----------+----------+---------+-----------+----------+-------------
fte | 18.500 | 16.000 | -2.500 | 18.500 | 17.500 | -1.000 | 1.500
Std. Error | 1.578 | 0.732 | 1.739 | 1.614 | 0.727 | 1.770 | 2.482
t | 11.72 | 15.08 | -1.44 | 18.50 | 18.06 | -1.65 | 0.60
P>|t| | 0.000 | 0.000 | 0.151 | 0.000 | 0.000 | 0.572 | 0.546
-----------------------------------------------------------------------------------------------------
* Values are estimated at the .5 quantile
**Inference: *** p<0.01; ** p<0.05; * p<0.1
Balancing test
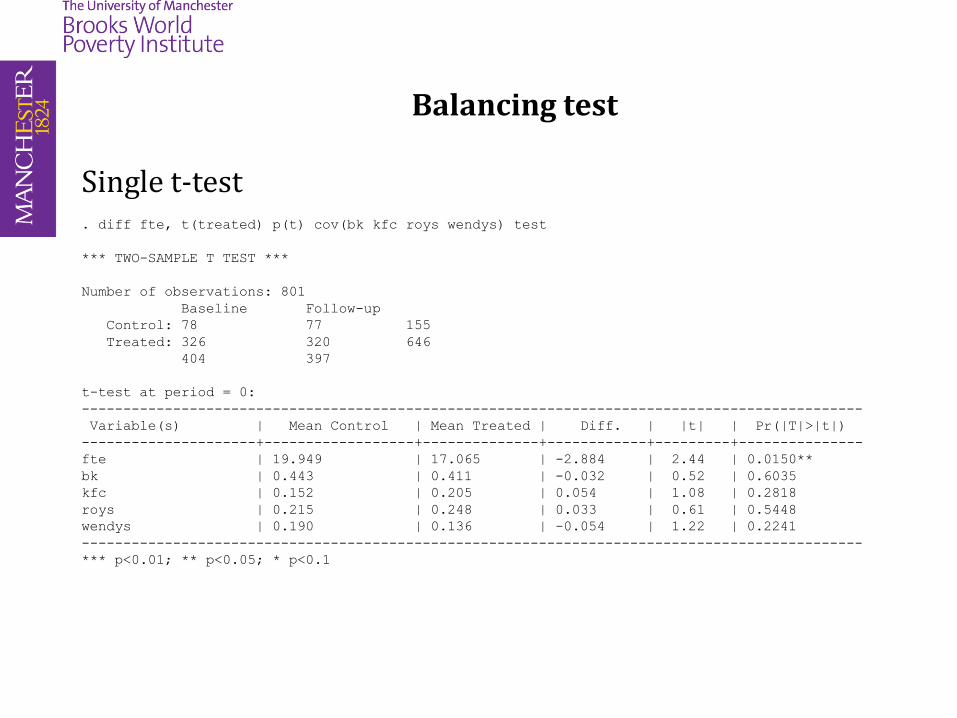
Single t-test
. diff fte, t(treated) p(t) cov(bk kfc roys wendys) test
*** TWO-SAMPLE T TEST ***
Number of observations: 801
Baseline Follow-up
Control: 78 77 155
Treated: 326 320 646
404 397
t-test at period = 0:
----------------------------------------------------------------------------------------------
Variable(s) | Mean Control | Mean Treated | Diff. | |t| | Pr(|T|>|t|)
---------------------+------------------+--------------+------------+---------+---------------
fte | 19.949 | 17.065 | -2.884 | 2.44 | 0.0150**
bk | 0.443 | 0.411 | -0.032 | 0.52 | 0.6035
kfc | 0.152 | 0.205 | 0.054 | 1.08 | 0.2818
roys | 0.215 | 0.248 | 0.033 | 0.61 | 0.5448
wendys | 0.190 | 0.136 | -0.054 | 1.22 | 0.2241
----------------------------------------------------------------------------------------------
*** p<0.01; ** p<0.05; * p<0.1
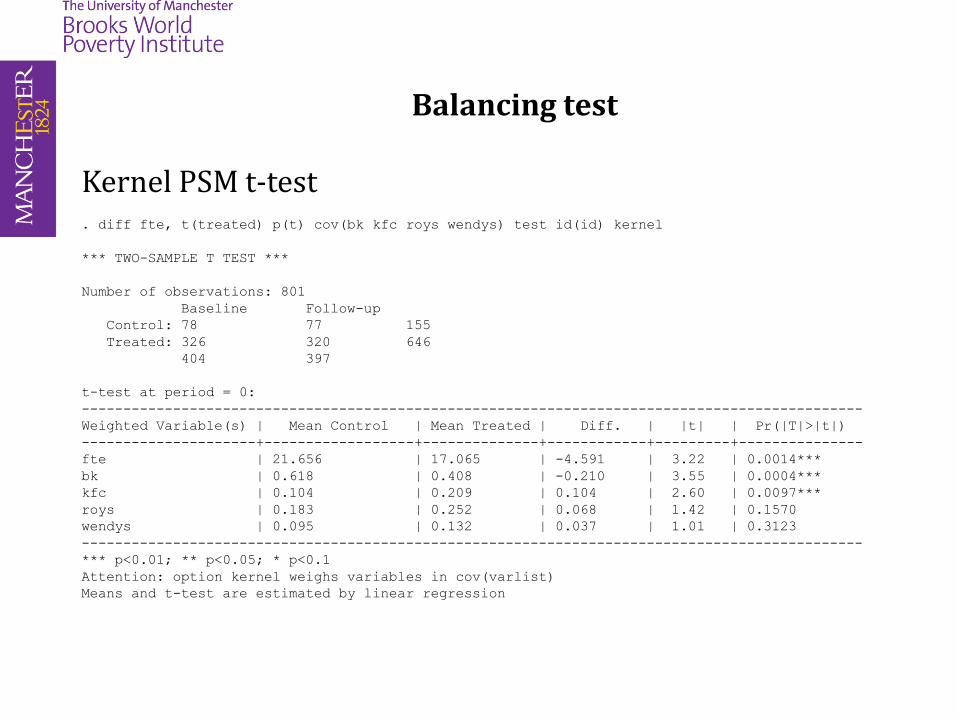
Balancing test
Kernel PSM t-test
. diff fte, t(treated) p(t) cov(bk kfc roys wendys) test id(id) kernel
*** TWO-SAMPLE T TEST ***
Number of observations: 801
Baseline Follow-up
Control: 78 77 155
Treated: 326 320 646
404 397
t-test at period = 0:
----------------------------------------------------------------------------------------------
Weighted Variable(s) | Mean Control | Mean Treated | Diff. | |t| | Pr(|T|>|t|)
---------------------+------------------+--------------+------------+---------+---------------
fte | 21.656 | 17.065 | -4.591 | 3.22 | 0.0014***
bk | 0.618 | 0.408 | -0.210 | 3.55 | 0.0004***
kfc | 0.104 | 0.209 | 0.104 | 2.60 | 0.0097***
roys | 0.183 | 0.252 | 0.068 | 1.42 | 0.1570
wendys | 0.095 | 0.132 | 0.037 | 1.01 | 0.3123
----------------------------------------------------------------------------------------------
*** p<0.01; ** p<0.05; * p<0.1
Attention: option kernel weighs variables in cov(varlist)
Means and t-test are estimated by linear regression


![SPair-71k: A Large-scale Benchmark for Semantic ...arXiv:1908.10543v1 [cs.CV] 28 Aug 2019 Type View-point diff. Scale diff. Truncation diff. Occlusion diff. easy medi hard easy medi](https://img.pdfslide.us/doc/110x75/6049bbd3adaaa52b560671c6/spair-71k-a-large-scale-benchmark-for-semantic-arxiv190810543v1-cscv-28.jpg)