Embed Size (px)
Citation preview
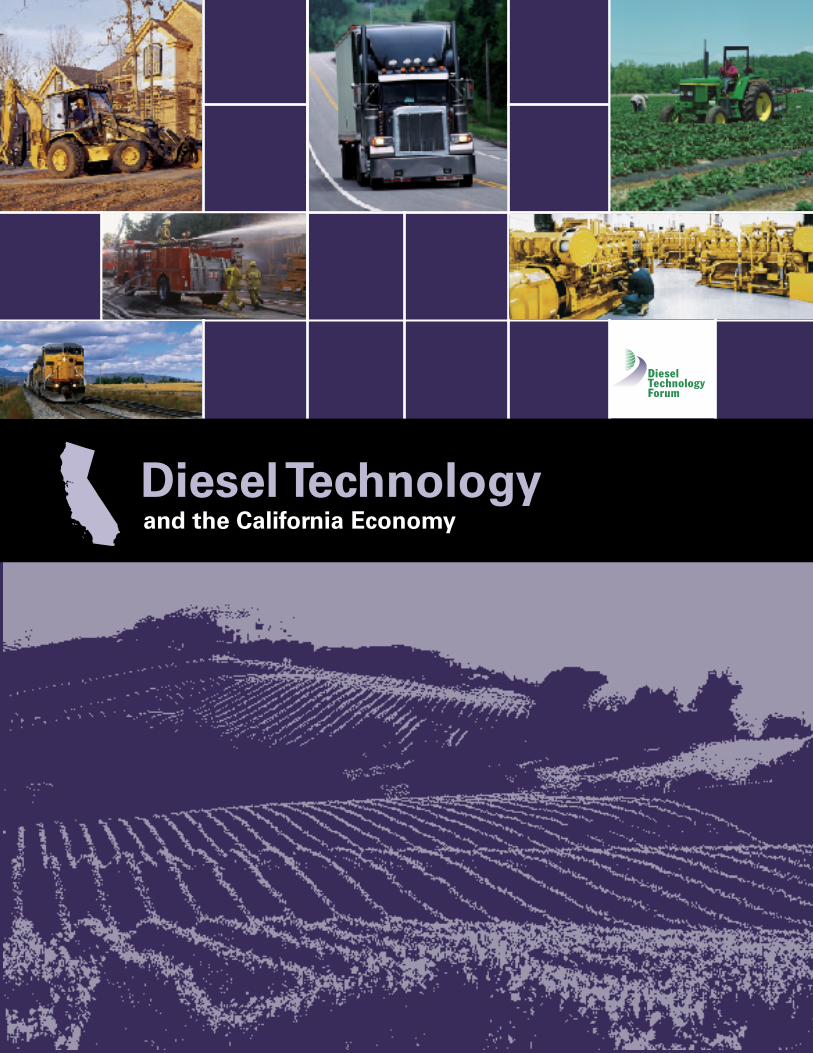
Diesel Technologyand the California Economy
The Diesel Technology Forum is the nation’s leading information resource on and promoter of clean diesel technology, its value, economic importance, environmental progress and promise for the future. The Forum promotes clean diesel solutions for new diesel engines (on/off road), conducts technology demonstrations and works with stakeholders to modernize and upgrade
existing diesel engines. Members include leaders in diesel engine, vehicle and component manufacturing, fuel refining, and emissions treatment systems.
Diesel Technology Forum5210 Chairman’s Court, Suite 2-B
Frederick, MD 21703Tel: 301/668-7230 Fax: 301/668-7234
M.Cubed is a resource and utility economic and policy consulting firm specializing in environmental, water supply, and energy management issues. M.Cubed was formed in 1993,
and has consulted to a wide range of state and federal agencies, and private interests and trade associations. M.Cubed has been involved in many key California-related issues, including the Bay-Delta proceedings and CALFED, electricity restructuring and the subsequent crisis
resolution, closure of the Rancho Seco nuclear plant, large water transfer proposals, regional and state air quality planning, and power plant siting cases. M.Cubed partners have testified before
the California Public Utilities Commission, California Energy Commission, Air Resources Board, State Water Resources Control Board, and other regulatory agencies, as well as in legal
and local planning proceedings. M.Cubed uses a range of analytic tools to develop pricing proposals, resource use plans, and regional economic impact forecasts. M.Cubed professionals
also are familiar with the institutional settings and constraints that dictate policy choices in the environmental, energy, water, solid waste, utility regulation, agricultural and economic development arenas. We also regularly manage interdisciplinary teams of analysts to solve
multifaceted policy problems.
2655 Portage Bay Ave. East, Suite 3Davis, California 95616
Diesel Technology and the
California EconomyPrepared for the Diesel Technology Forum by M.Cubed

Diesel Technology and the California EconomyExecutive Summary The Role of Diesel Engines in California’s Economy The Purpose of this Report
How is Economic Activity Engendered by Diesel Technology? The Concept of Total Output, Balue Added adn Gross State Product
Measuring the Influence of Diesel Technology on California’s Economy Provision of DIesel Technology: Selling Goods and Services to Diesel Users Fuel Producers and Refiners Vehicle, Equipment, and Engine Manufacturing and Servicing
The Economic Benefits of Using Diesel Technology Using Diesel to Produce Basic Commodities and Build Infrastructure Diesel Moving and Protecting People
Summing Up: The Value Added to the California Economy
Appendix A
Endnotes
Executive Summary 1
The Role of Diesel Engines in California’s Economy The Purpose of this Report
3 4
How is Economic Activity Engendered by Diesel Technology? The Concept of Total Output, Value Added and Gross State Product
5 5
Measuring the Influence of Diesel Technology on California’s Economy Provision of Diesel Technology: Selling Goods and Services to Diesel Users Fuel Producers and Refiners Vehicle, Equipment, and Engine Manufacturing and Servicing The Economic Benefits of Using Diesel Technology Using Diesel to Produce Basic Commodities and Build Infrastructure Diesel Moving and Protecting People
7 7 8 10 10 10 22
Summing Up: The Value Added to the California Economy 25
Appendix A 29
References 32
Table of Contents

EXECUTIVE SUMMARY
California has the largest economy of any of the 50 United States. With a gross
state product (GSP) of $1.3 trillion in 2000, California alone stands among the half dozen
largest economies in the world. At the core of that economy are agriculture—the
growing of food and fiber; construction—the creation of highways, buildings and
infrastructure; and transportation—the moving of products and people. These sectors
account for 12 percent of California’s GSP, and could not function effectively without
diesel technology. Of the production of these sectors, $12.4 billion can be attributed to
the use of diesel technology.
Diesel engines drive most of the tractors that plow fields and move dirt, and have
made a dramatic contribution to the increase in productivity that has exemplified
California agriculture since World War II. Diesel fuels the trucks, trains and ships that
move most of the freight carried in the state. Buses, which transport two-thirds of the
state’s transit passengers, are primarily diesel-powered. Most fire trucks and other heavy
emergency vehicles also use diesel. Even the emergency standby generators that
powered hospitals and other critical facilities during the 2000-2001 energy crisis are
almost exclusively diesel. There is no economic sector in the state that does not benefit
from the contribution of diesel power.
Diesel’s advantage over other power sources for these uses is manifold.
Compared to alternatives such as gasoline-powered engines, diesel
is more energy efficient;
provides greater power output in large applications;
is remarkably more durable and reliable; and
is safer to handle.
Further, diesel is more portable than other alternatives: electric power requires a
connection to a source of electricity, and natural gas requires either connection to a
pipeline or significant investment in compression and fueling facilities.
California imports most inputs for diesel technology, i.e., fuels, vehicles and
engines, so most of the economic activity associated with producing those goods and
DIESEL TECHNOLOGY AND THE CALIFORNIA ECONOMY 1
services takes place outside of the state. This diesel sector contributes about $1.8 billion
directly to the state GSP, and induces an additional $2.7 billion in associated purchases in
other sectors.
Diesel’s role is apparent in several key sectors that rely substantially on the
technology:
California’s agricultural economy is the largest in the nation, and the most diverse, producing more than 250 crops. The state has 74,000 farms, which employ 668,000 Californians. In 2000, it produced $38 billion in output, and contributed $19.1 billion to the state’s gross product. One estimate places the larger, indirect multiplier effects on the California economy at $65.3 billion in value added, and 1.1 million jobs, or more than 7 percent of the state’s total labor force. Diesel powers a large majority of California farm equipment, moves products to market, and pumps a large share of the water used in irrigation. These uses have contributed significantly to productivity improvements in the agriculture sector. Agriculture spent $534 million on diesel technology in 2000.
California’s construction industry employed 1.85 million people with a payroll of $67 billion in 2000. It sold $279 billion in goods and services, creating $108 billion in value added to the GSP. Construction relies heavily on the large horsepower capability, mobility, and durability of diesel power. The industry purchased $11.72 billion in diesel technology goods and services in 2000.
Freight is hauled by truck, train, ship and a combination of these known as “intermodal.” All of these are predominantly diesel-powered. For example, diesel propels 90 percent of the state’s heavy-duty truck travel. California’s freight-hauling industry had 16,000 firms that employed 475,000 individuals with a payroll of $18 billion in 2000. It produced $58 billion in services, adding $29 billion in value added to the GSP. These industry sectors spent $2 billion on diesel technology inputs in 2000.
California’s transit and local and interurban personal transportation industry employed 77,000 people, with a payroll of $2.6 billion in 2000. The industry delivered $4.4 billion in services, with a value added of $482 million. These industry sectors spent $596 million on diesel technology inputs in 2000.
DIESEL TECHNOLOGY AND THE CALIFORNIA ECONOMY 2
THE ROLE OF DIESEL ENGINES IN CALIFORNIA’S ECONOMY
California is the nation’s economic engine. Over the last decade, innovation by
state businesses and immigration into the state have created opportunities and brought
new resources that have led to improved productivity and increased output that has
spilled over nationwide. California’s economic output now rivals that of France and
Great Britain, making the state among the half dozen largest economies in the world.
To keep the state’s economy rolling requires powerful, efficient, inexpensive
motive power. Diesel is a prime mover for transporting freight, powering tractors,
building roads and meeting critically important demand for emergency services:
The vast majority of products exported from and imported to California are moved using diesel technology. These products are moved by truck, train, ship or intermodal means. Even air freight is dependent on diesel tractors to push planes into the jetways. Most commercial trucks – including those used by independent trucking companies and “fleets” (e.g., store- and distributor-owned trucks) – rely on diesel-powered engines.
Likewise, a substantial number of off-road equipment including tractors and stationary engines and pumps depend on diesel. Three-quarters of the fossil-fueled equipment used in construction and agriculture are diesel-powered. In addition, these industries rely on diesel to pump water for drainage and irrigation.
Diesel engines are the primary motive force for land and sea-route mass transit as well. Buses, commuter trains and ferries all rely mostly on diesel technology.
Diesel technology is equally important in protecting public safety and ensuring energy reliability. Many emergency vehicles, such as fire and tow trucks, have diesel engines. Hospitals, government offices and businesses often rely on diesel generators for emergency standby power when the power grid suffers an outage.
Consumers may not see how diesel affects their everyday life, but its presence in our economy is ubiquitous.
Diesel engines are chosen over other motive sources for a variety of reasons.
Among the most important are the following:
Energy efficiency – Compression-ignition diesel engines can be 25 to 40 percent more efficient than spark-ignition gasoline or natural gas fueled engines in the same applications. That is, diesel can pull greater weight for longer distances than alternative fuels. A portion of this difference comes from the higher energy content in diesel over gasoline, and the majority from the greater efficiency inherent in compression ignition. These fuel savings translate into lower costs for businesses and farms, which are passed on to consumers.
DIESEL TECHNOLOGY AND THE CALIFORNIA ECONOMY 3
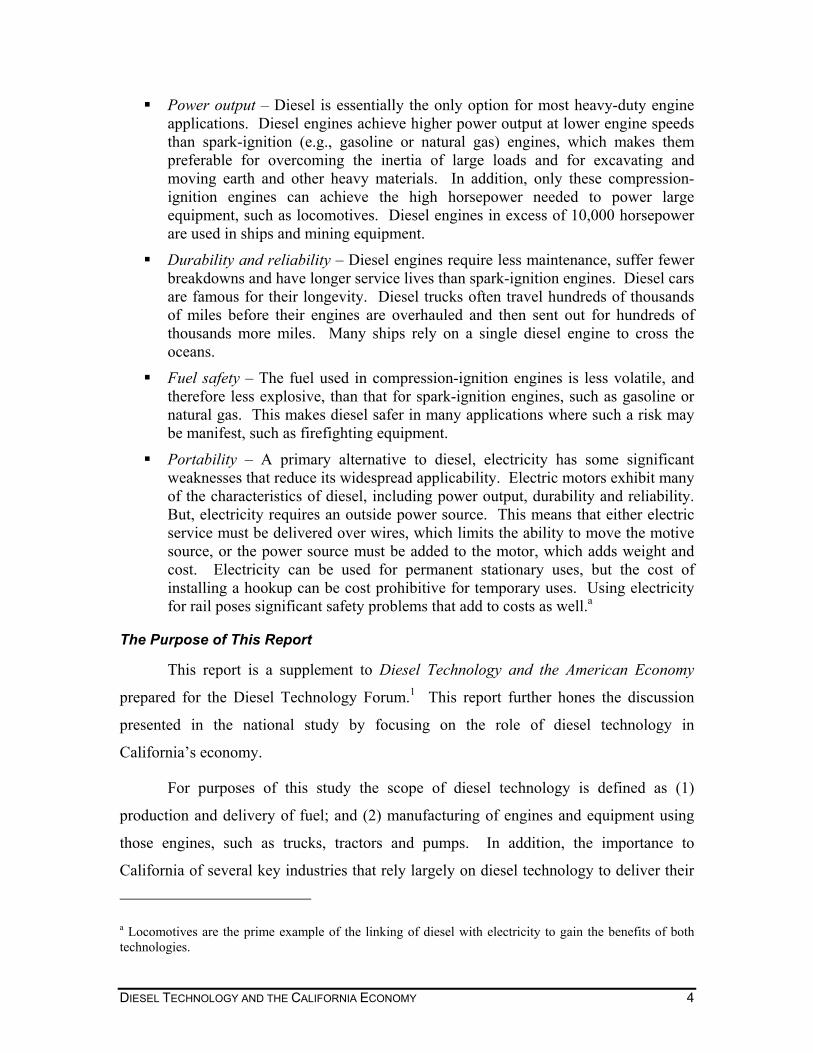
Power output – Diesel is essentially the only option for most heavy-duty engine applications. Diesel engines achieve higher power output at lower engine speeds than spark-ignition (e.g., gasoline or natural gas) engines, which makes them preferable for overcoming the inertia of large loads and for excavating and moving earth and other heavy materials. In addition, only these compression-ignition engines can achieve the high horsepower needed to power large equipment, such as locomotives. Diesel engines in excess of 10,000 horsepower are used in ships and mining equipment.
Durability and reliability – Diesel engines require less maintenance, suffer fewer breakdowns and have longer service lives than spark-ignition engines. Diesel cars are famous for their longevity. Diesel trucks often travel hundreds of thousands of miles before their engines are overhauled and then sent out for hundreds of thousands more miles. Many ships rely on a single diesel engine to cross the oceans.
Fuel safety – The fuel used in compression-ignition engines is less volatile, and therefore less explosive, than that for spark-ignition engines, such as gasoline or natural gas. This makes diesel safer in many applications where such a risk may be manifest, such as firefighting equipment.
Portability – A primary alternative to diesel, electricity has some significant weaknesses that reduce its widespread applicability. Electric motors exhibit many of the characteristics of diesel, including power output, durability and reliability. But, electricity requires an outside power source. This means that either electric service must be delivered over wires, which limits the ability to move the motive source, or the power source must be added to the motor, which adds weight and cost. Electricity can be used for permanent stationary uses, but the cost of installing a hookup can be cost prohibitive for temporary uses. Using electricity for rail poses significant safety problems that add to costs as well.a
The Purpose of This Report
This report is a supplement to Diesel Technology and the American Economy
prepared for the Diesel Technology Forum.1 This report further hones the discussion
presented in the national study by focusing on the role of diesel technology in
California’s economy.
For purposes of this study the scope of diesel technology is defined as (1)
production and delivery of fuel; and (2) manufacturing of engines and equipment using
those engines, such as trucks, tractors and pumps. In addition, the importance to
California of several key industries that rely largely on diesel technology to deliver their
a Locomotives are the prime example of the linking of diesel with electricity to gain the benefits of both technologies.
DIESEL TECHNOLOGY AND THE CALIFORNIA ECONOMY 4
services is examined. These industries include freight transportation, construction,
agriculture, transit and public safety.
HOW IS ECONOMIC ACTIVITY ENGENDERED BY DIESEL TECHNOLOGY MEASURED?
Diesel technology supports a wide array of economic activities. Producing the
inputs to diesel technology also creates economic activity. Oil extraction, fuel refining,
engine and vehicle manufacturing, and equipment servicing all require hiring employees
and purchasing commodities and services. Further, the use of diesel in trucks, trains and
ships facilitates the connections between factories, warehouses and stores. All of these
activities can be translated into expenditures of dollars and jobs created. Economic
models have been developed to assess how these expenditures and jobs influence activity
in the economy at large.
The Concept of Total Output, Value Added and Gross State Product
The economic significance of diesel technology to the California economy can be
assessed using an input-output model of the California economy based on the IMPLAN
system of regional economic accounts.2 The IMPLAN data set is derived from U.S.
Bureau of Economic Affairs data.a The IMPLAN model assesses impacts to such
variables as industry output (or gross sales), labor income (employee compensation and
self-employed proprietors’ earnings), other property ownership-related income (corporate
profits, dividends, rents and other returns on capital assets), indirect business taxes
(mainly sales and property taxes), and employment (full- and part-time jobs).
Economic activity is measured with two important concepts.b The first is total
output. This is the total expenditures and receipts associated with all transactions in the
economy. However, it includes both activity which may only be a simple transfer with
little associated economic production as well as the actual economic activity that is
facilitated by or facilitates the transfer. The second concept of value added measures the
actual economic activity associated with a transfer, and is a component of total output. It
a IMPLAN is one of several regional economic impact models used to assess economic changes in local, state and national economies. Other such models include RIMS, REMI, and DRAM. b How economic activity is measured for this study is described in more detail in Appendix A.
DIESEL TECHNOLOGY AND THE CALIFORNIA ECONOMY 5
is the component that adds actual wealth to the economy. Value added is the economic
value added to a product by an industry beyond the costs of purchasing the necessary
inputs from other industries, as measured by labor and property income and indirect
taxes. Each step of the production, delivery and service process adds incremental value.
The cumulative value added across these industries, plus any out-of-state imports, will
equal the total cost to provide the final product to the end consumer. The sum of all of
this value added for California is known as the “Gross State Product” or GSP. The GSP
excludes out-of-state imports, and does not include the multiplier effect. The GSP is
directly analogous to the U.S. Gross Domestic Product or GDP, whose growth rate is
followed closely in the business and economic press.
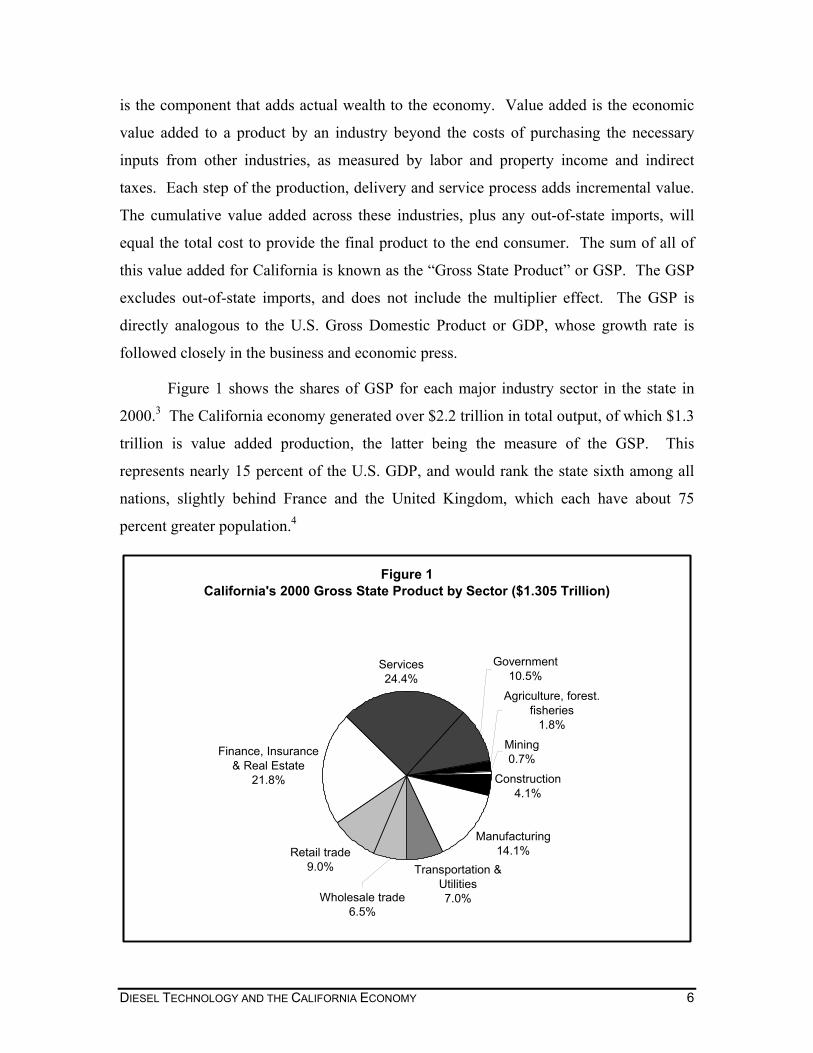
Figure 1 shows the shares of GSP for each major industry sector in the state in
2000.3 The California economy generated over $2.2 trillion in total output, of which $1.3
trillion is value added production, the latter being the measure of the GSP. This
represents nearly 15 percent of the U.S. GDP, and would rank the state sixth among all
nations, slightly behind France and the United Kingdom, which each have about 75
percent greater population.4
Figure 1California's 2000 Gross State Product by Sector ($1.305 Trillion)
Agriculture, forest. fisheries
1.8%Mining0.7%
Construction4.1%
Manufacturing14.1%
Transportation & Utilities7.0%
Retail trade9.0%
Finance, Insurance & Real Estate
21.8%
Services24.4%
Government10.5%
Wholesale trade6.5%
DIESEL TECHNOLOGY AND THE CALIFORNIA ECONOMY 6
MEASURING THE INFLUENCE OF DIESEL TECHNOLOGY ON CALIFORNIA’S ECONOMY
Provision of Diesel Technology: Selling Goods and Services to Diesel Users
Diesel technology includes both the engines and associated equipment that are the
“hardware,” and the fuel that is burned in the engines. The engines, vehicles, generators
and pumps compose the manufactured technology. The extraction and refining of
petroleum makes up the fuel portion.
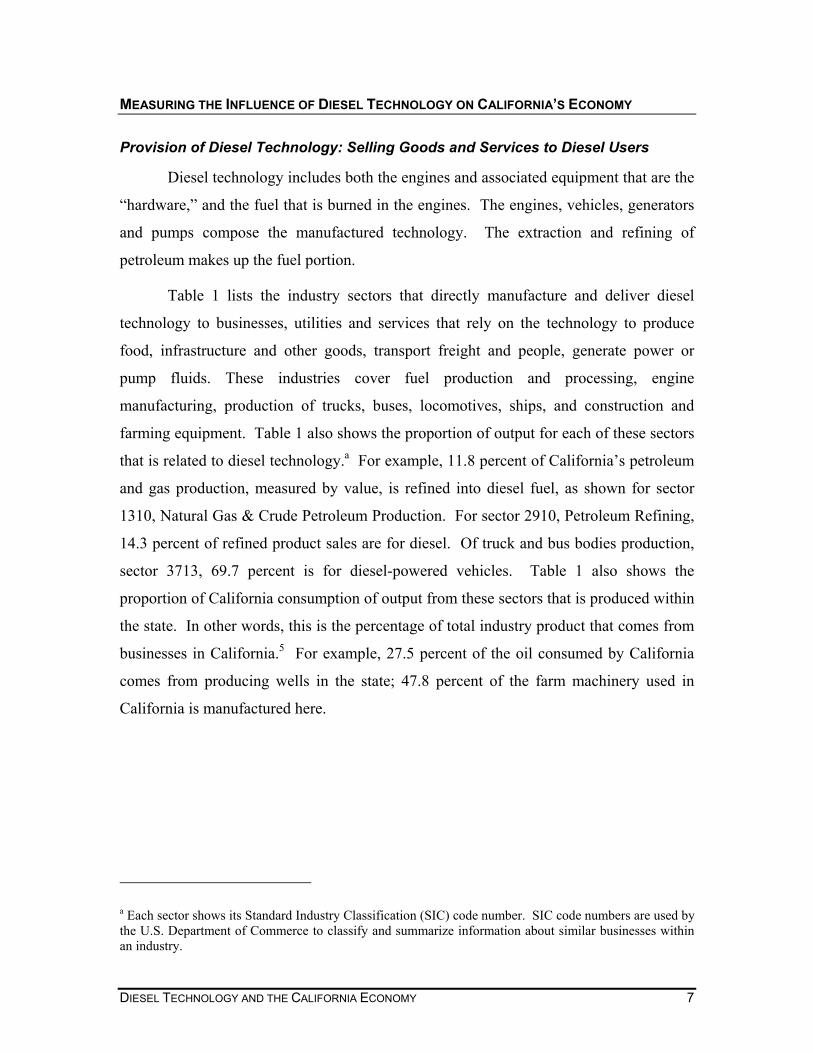
Table 1 lists the industry sectors that directly manufacture and deliver diesel
technology to businesses, utilities and services that rely on the technology to produce
food, infrastructure and other goods, transport freight and people, generate power or
pump fluids. These industries cover fuel production and processing, engine
manufacturing, production of trucks, buses, locomotives, ships, and construction and
farming equipment. Table 1 also shows the proportion of output for each of these sectors
that is related to diesel technology.a For example, 11.8 percent of California’s petroleum
and gas production, measured by value, is refined into diesel fuel, as shown for sector
1310, Natural Gas & Crude Petroleum Production. For sector 2910, Petroleum Refining,
14.3 percent of refined product sales are for diesel. Of truck and bus bodies production,
sector 3713, 69.7 percent is for diesel-powered vehicles. Table 1 also shows the
proportion of California consumption of output from these sectors that is produced within
the state. In other words, this is the percentage of total industry product that comes from
businesses in California.5 For example, 27.5 percent of the oil consumed by California
comes from producing wells in the state; 47.8 percent of the farm machinery used in
California is manufactured here.
a Each sector shows its Standard Industry Classification (SIC) code number. SIC code numbers are used by the U.S. Department of Commerce to classify and summarize information about similar businesses within an industry.
DIESEL TECHNOLOGY AND THE CALIFORNIA ECONOMY 7
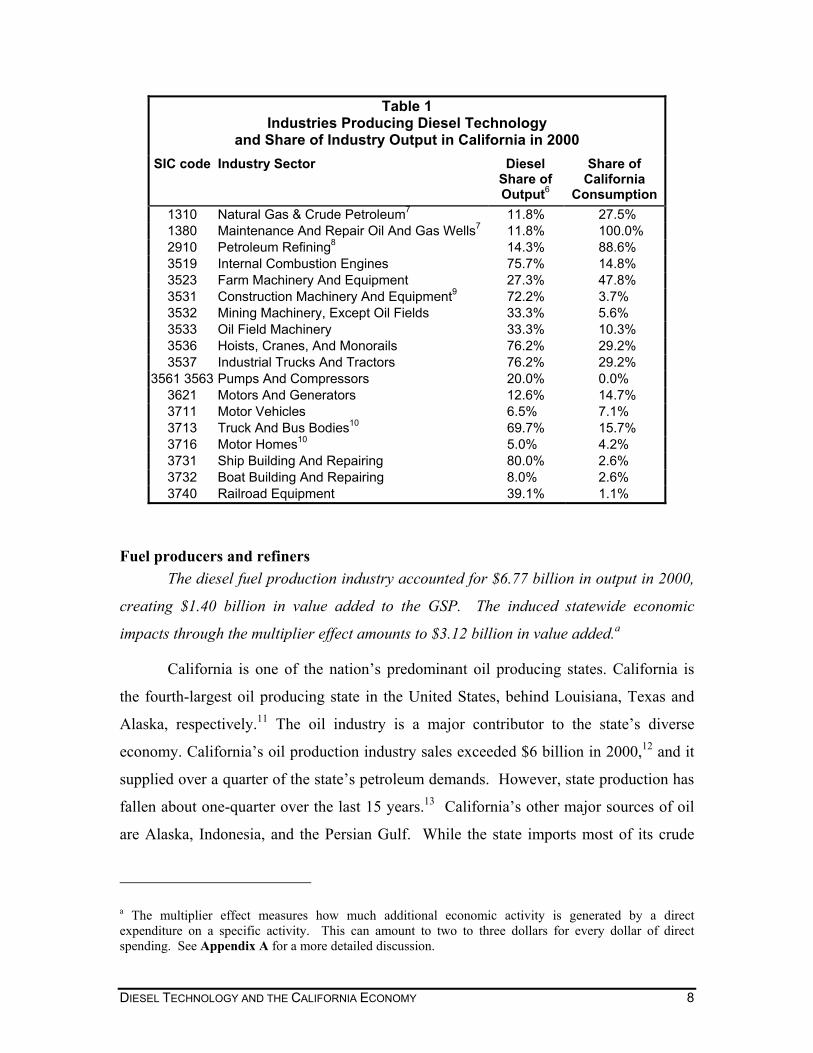
Table 1 Industries Producing Diesel Technology
and Share of Industry Output in California in 2000 SIC code Industry Sector Diesel
Share of Output6
Share of California
Consumption1310 Natural Gas & Crude Petroleum7 11.8% 27.5% 1380 Maintenance And Repair Oil And Gas Wells7 11.8% 100.0% 2910 Petroleum Refining8 14.3% 88.6% 3519 Internal Combustion Engines 75.7% 14.8% 3523 Farm Machinery And Equipment 27.3% 47.8% 3531 Construction Machinery And Equipment9 72.2% 3.7% 3532 Mining Machinery, Except Oil Fields 33.3% 5.6% 3533 Oil Field Machinery 33.3% 10.3% 3536 Hoists, Cranes, And Monorails 76.2% 29.2% 3537 Industrial Trucks And Tractors 76.2% 29.2%
3561 3563 Pumps And Compressors 20.0% 0.0% 3621 Motors And Generators 12.6% 14.7% 3711 Motor Vehicles 6.5% 7.1% 3713 Truck And Bus Bodies10 69.7% 15.7% 3716 Motor Homes10 5.0% 4.2% 3731 Ship Building And Repairing 80.0% 2.6% 3732 Boat Building And Repairing 8.0% 2.6% 3740 Railroad Equipment 39.1% 1.1%
Fuel producers and refiners The diesel fuel production industry accounted for $6.77 billion in output in 2000,
creating $1.40 billion in value added to the GSP. The induced statewide economic
impacts through the multiplier effect amounts to $3.12 billion in value added.a
California is one of the nation’s predominant oil producing states. California is
the fourth-largest oil producing state in the United States, behind Louisiana, Texas and
Alaska, respectively.11 The oil industry is a major contributor to the state’s diverse
economy. California’s oil production industry sales exceeded $6 billion in 2000,12 and it
supplied over a quarter of the state’s petroleum demands. However, state production has
fallen about one-quarter over the last 15 years.13 California’s other major sources of oil
are Alaska, Indonesia, and the Persian Gulf. While the state imports most of its crude
a The multiplier effect measures how much additional economic activity is generated by a direct expenditure on a specific activity. This can amount to two to three dollars for every dollar of direct spending. See Appendix A for a more detailed discussion.
DIESEL TECHNOLOGY AND THE CALIFORNIA ECONOMY 8
petroleum, California is largely self-sufficient in refining its fuel, and even exports to
neighboring states, particularly Nevada and Arizona.
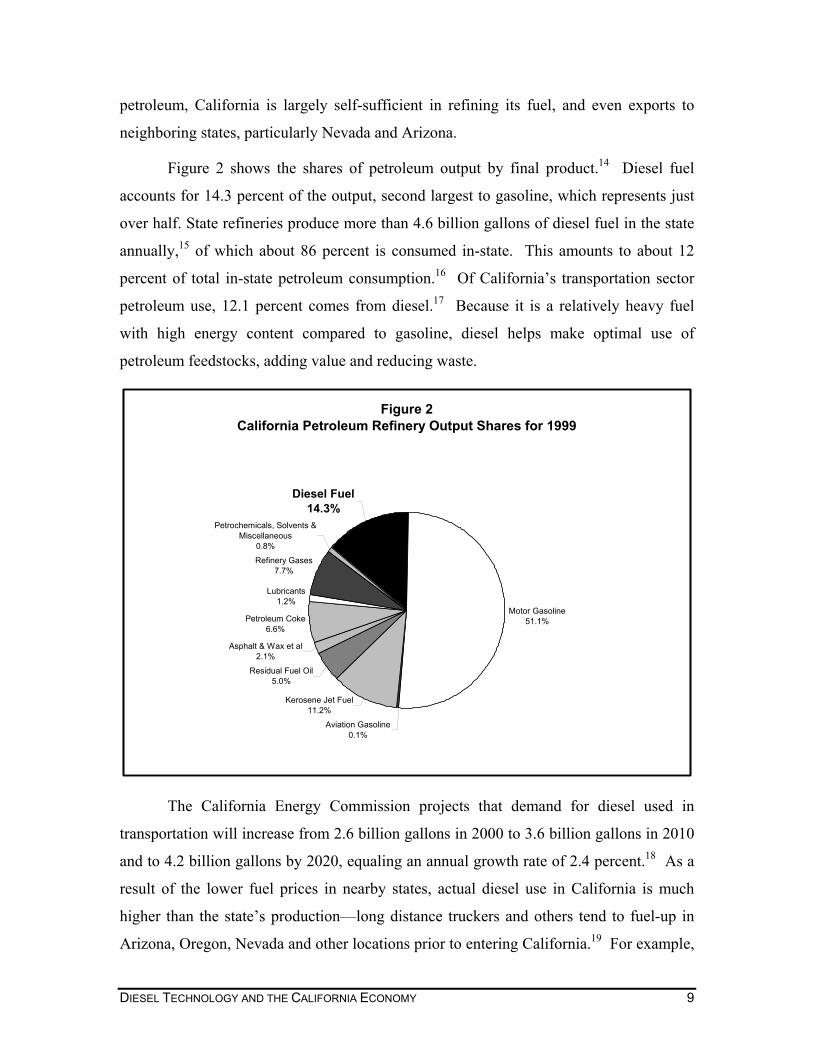
Figure 2 shows the shares of petroleum output by final product.14 Diesel fuel
accounts for 14.3 percent of the output, second largest to gasoline, which represents just
over half. State refineries produce more than 4.6 billion gallons of diesel fuel in the state
annually,15 of which about 86 percent is consumed in-state. This amounts to about 12
percent of total in-state petroleum consumption.16 Of California’s transportation sector
petroleum use, 12.1 percent comes from diesel.17 Because it is a relatively heavy fuel
with high energy content compared to gasoline, diesel helps make optimal use of
petroleum feedstocks, adding value and reducing waste.
Figure 2California Petroleum Refinery Output Shares for 1999
Motor Gasoline51.1%
Aviation Gasoline0.1%
Kerosene Jet Fuel11.2%
Residual Fuel Oil5.0%
Asphalt & Wax et al2.1%
Petroleum Coke6.6%
Lubricants1.2%
Refinery Gases7.7%
Petrochemicals, Solvents & Miscellaneous
0.8%
Diesel Fuel14.3%
The California Energy Commission projects that demand for diesel used in
transportation will increase from 2.6 billion gallons in 2000 to 3.6 billion gallons in 2010
and to 4.2 billion gallons by 2020, equaling an annual growth rate of 2.4 percent.18 As a
result of the lower fuel prices in nearby states, actual diesel use in California is much
higher than the state’s production—long distance truckers and others tend to fuel-up in
Arizona, Oregon, Nevada and other locations prior to entering California.19 For example,
DIESEL TECHNOLOGY AND THE CALIFORNIA ECONOMY 9
in June 2003, the retail diesel price in Los Angeles was $1.51 per gallon, $1.54 in
Sacramento, $1.71 in San Francisco, and $1.72 in San Diego.20 In contrast, the price in
Phoenix was $1.39, $1.46 in Las Vegas, and $1.25 in Portland.
Vehicle, equipment, and engine manufacturing and servicing The diesel vehicle, equipment, and engine manufacturing and servicing industries
accounted for $2.63 billion in output in 2000, and $927 million in value added. Based on
the multiplier effect, these industries induced another $415 million in economic activity,
for a total of $1.34 billion in value added.
California tends to rely on imports from other states and nations for diesel
engines, and vehicle and equipment manufacturing. California’s ship building industry,
once dominant after World War II, has largely dissipated. Tractor and pump
manufacturing also is largely located out-of-state. However, the share of transit vehicle
manufacturing is significant in the state due to the large demand relative to other Western
states. Nevertheless, diesel technology manufacturing and servicing industries have a
substantial presence in California.
The Economic Benefits of Using Diesel Technology
Diesel technology is the dominant motive force for the most basic economic
activities in California—growing food, building roads and houses, and moving goods to
market. While the economic impacts from these services can be delineated in various
ways economically, the more important fact is that without diesel technology, many of
these tasks would be more costly and difficult. We turn now to how diesel is used to
produce goods and services.
Using Diesel to Produce Basic Commodities and Build Infrastructure Table 2 lists the industry sectors that rely heavily on diesel technology to deliver
their products and services, and the percentage of value in the product delivered through
the use of diesel technology. These include agriculture, construction, freight transport
and transit.
DIESEL TECHNOLOGY AND THE CALIFORNIA ECONOMY 10
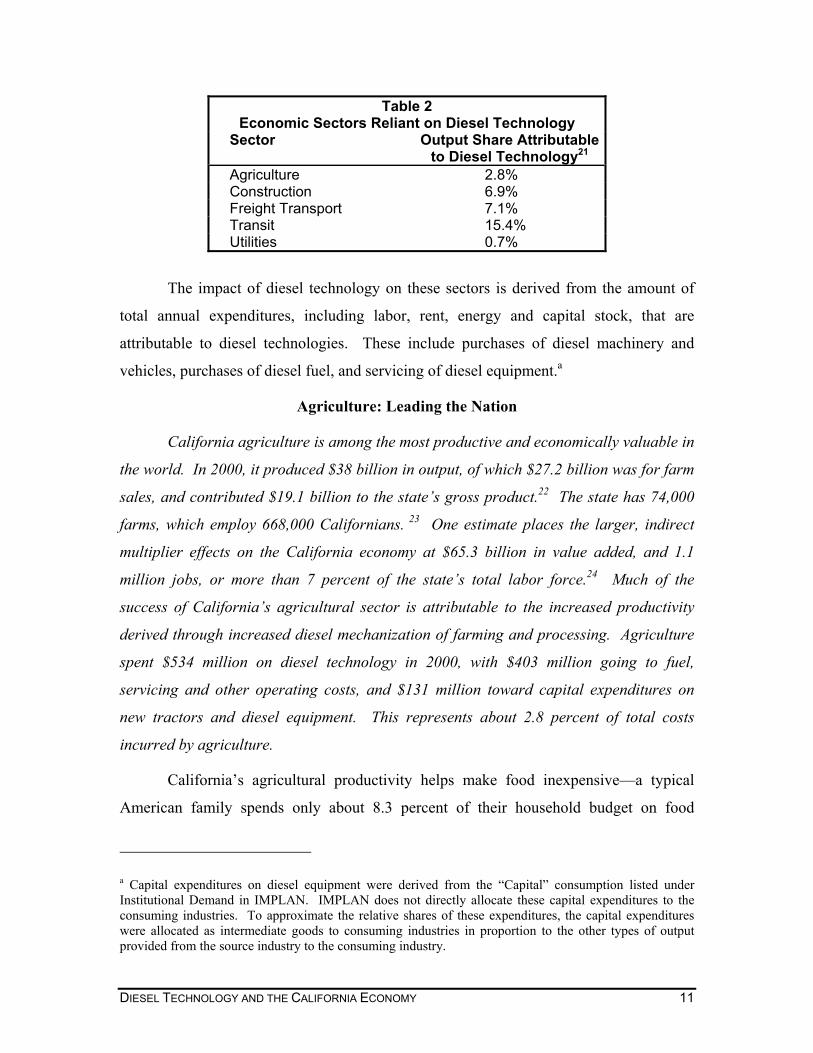
Table 2 Economic Sectors Reliant on Diesel Technology
Sector Output Share Attributable to Diesel Technology21
Agriculture 2.8% Construction 6.9% Freight Transport 7.1% Transit 15.4% Utilities 0.7%
The impact of diesel technology on these sectors is derived from the amount of
total annual expenditures, including labor, rent, energy and capital stock, that are
attributable to diesel technologies. These include purchases of diesel machinery and
vehicles, purchases of diesel fuel, and servicing of diesel equipment.a
Agriculture: Leading the Nation
California agriculture is among the most productive and economically valuable in
the world. In 2000, it produced $38 billion in output, of which $27.2 billion was for farm
sales, and contributed $19.1 billion to the state’s gross product.22 The state has 74,000
farms, which employ 668,000 Californians. 23 One estimate places the larger, indirect
multiplier effects on the California economy at $65.3 billion in value added, and 1.1
million jobs, or more than 7 percent of the state’s total labor force.24 Much of the
success of California’s agricultural sector is attributable to the increased productivity
derived through increased diesel mechanization of farming and processing. Agriculture
spent $534 million on diesel technology in 2000, with $403 million going to fuel,
servicing and other operating costs, and $131 million toward capital expenditures on
new tractors and diesel equipment. This represents about 2.8 percent of total costs
incurred by agriculture.
California’s agricultural productivity helps make food inexpensive—a typical
American family spends only about 8.3 percent of their household budget on food
a Capital expenditures on diesel equipment were derived from the “Capital” consumption listed under Institutional Demand in IMPLAN. IMPLAN does not directly allocate these capital expenditures to the consuming industries. To approximate the relative shares of these expenditures, the capital expenditures were allocated as intermediate goods to consuming industries in proportion to the other types of output provided from the source industry to the consuming industry.
DIESEL TECHNOLOGY AND THE CALIFORNIA ECONOMY 11
prepared and consumed at home.25 Although California farms represent only 4 percent of
the nation’s total, they account for 13 percent of the national gross receipts generated
from U.S. farming.26 California farms generate yields per acre that are one-third or more
higher than the national average.27 In addition to helping feed the nation, California
growers export a significant share of their production—in 2001 the state exported $6.5
billion worth of agricultural products.28
Fresno County is the leading agricultural county in the country, and in 2000 it
produced $3.42 billion in agricultural output.29 If ranked separately, Fresno’s agricultural
cash crops would place it ahead of more than half the other states in the nation.
Since World War II, three significant events have served to transform California
agriculture: the final transition from animal to tractor power; the application of advanced
science, particularly agricultural chemicals; and the completion of large water supply
storage and conveyance systems, which enabled intensive irrigation of California
farmland. These factors served to greatly increase per-acre productivity. Partially as a
result, in 1945 California had 132,658 farms, with an average size of 230 acres.30 By
2000 the number of farms had dropped by 35 percent, while the average size had
increased by 40 percent, as farmers became more productive through mechanization.
While farming has become much more mechanized, over the past three decades
agricultural energy use has actually decreased.31 Agricultural energy use peaked in the
late-1970s and declined throughout most of the 1980s. By the mid-1990s, the sector’s
energy use was only slightly higher than it was in the mid-1970s. Yet between 1974 and
1994 food crop output rose by almost 80 percent.
This energy use pattern in part reflects agriculture’s shift away from gasoline-
powered machinery towards the use of more efficient diesel fuel.32 In 1974, gasoline
accounted for approximately 50 percent of the energy supplied by fuels purchased on
farms nationally, with diesel responsible for 38 percent. By 1994 gasoline’s share had
fallen to 24 percent, while diesel’s had risen to 66 percent, reflecting the increased use of
diesel technology in the sector to increase productivity. Yet, output per energy unit has
increased in this period.
While growers have been able to reduce the use of most agricultural inputs, diesel
DIESEL TECHNOLOGY AND THE CALIFORNIA ECONOMY 12
fuel has been an important exception. This is because diesel power provides a cost-
effective method of maintaining and improving agricultural productivity. This, in turn, is
a key factor behind low food prices and California’s valuable agricultural export market.
As a result, petroleum, primarily diesel, represents approximately 5 percent of total
purchases by the agricultural sector nationally.33
How Agriculture Uses Diesel Power
California agriculture relies on diesel fuel for a number of different applications,
including:
Moving commodities to market (e.g., trucking). In 1997 California agriculture shipped in excess of $85 billion worth of commodities, including cereal grains ($505 million); animal feed ($4.1 billion); meat, fish and seafood ($20.1 billion); milled grain products ($11.2 billion); other prepared foodstuffs ($32.7 billion); and other agricultural products ($16.6 billion).34 More than 90 percent these items were shipped by truck, with rail and air accounting for most of the rest.
Planting, cultivating and harvesting crops, as well as tending livestock (e.g., off-road vehicles, such as tractors and combines). As much as three-quarters of tractors over 100 horsepower, and a similar share of combines, purchased by growers during the late-1990s were diesel-powered.35 Agricultural uses account for about 32 percent of off-road stationary engines in California.36 There is currently no cost-effective substitute for diesel for most tractor applications as a result of the inability of other fuels to provide sufficient power to pull the necessary equipment weight at slow speeds while providing remote portability.
Water pumping. In 1998 California growers relied on almost 7,000 diesel-powered irrigation pumps, and spent more than $21 million to purchase the associated diesel to deliver water to where it was needed.37 While diesel fuels only about 10 percent of the pumps used by agriculture, these represent the “swing” capacity that is installed during drought periods to increase groundwater use and reduce reliance on surface water supplies. The shift to groundwater by agriculture allowed surface water supplies to be transferred to urban consumers during the extended drought from 1987 to 1994.
Construction: Building the State’s Infrastructure
California’s construction industry employed 1.85 million people with a payroll of
$67 billion in 2000.a It sold $279 billion in goods and services, creating $108 billion in
a The definition of the “Construction” industry used here includes extractive industries that directly supply the traditional construction industry, such as sand, and gravel mining and quarrying. Mining for other commodities not used in construction (e.g., metallic ores) is no longer a significant industry in California.
DIESEL TECHNOLOGY AND THE CALIFORNIA ECONOMY 13
value added to the GSP. The industry purchased $11.72 billion in diesel technology
goods and services in 2000, of which $594 million were fuel and services, and $11.12
billion was in purchases of capital equipment. This represents 6.9 percent of total
expenses incurred by construction.
Statewide, over 60,000 construction firms employ 430,000 construction
workers.38 Of these firms, almost 14,000 focus on new residential construction, and
37,000 provide special trades contracting, such as electricians, plumbers and painters.
The value of construction work in 1997 was $93 billion. These firms spent $758 million
on gasoline and diesel fuel in 1997.39
As with agriculture, construction activity is dominated by diesel technology.
Simply, no viable alternative has been developed yet for applications that exceed 500
horsepower. Some construction engines produce several thousand horsepower. Of on-
road trucks, 67 percent are diesel-fueled;40 of off-road equipment, including tractors, 73
percent are fueled by diesel.41 Construction accounts for 48 percent of off-road engines
in use in the state.42 It also uses 20.5 percent of the heavy-duty on-road trucks.43
Using Diesel to Deliver Goods and Services: Freight Hauling
California’s freight hauling industry had 16,000 firms that employed 475,000
individuals with a payroll of $18 billion in 2000. It produced $58 billion in services,
adding $29 billion in value added to the GSP. These industry sectors spend $2 billion on
diesel technology inputs, of which $1.66 billion is on fuel and services, and $340 million
on capital equipment. This represents 7.1 percent of total expenses for these industries.
The dominance of diesel for moving the state economy’s “lifeblood”—freight—is
documented in federal and state surveys. According to the 1997 Commodity Flow
Survey, 778 million tons of commodities, valued at $802 billion, were shipped from
California.44 Table 3 shows the value and tonnage by mode.45 Diesel was used to move
over 85 percent of the value, and 83 percent of the tonnage, by truck, rail, ship and
intermodal means.46
DIESEL TECHNOLOGY AND THE CALIFORNIA ECONOMY 14
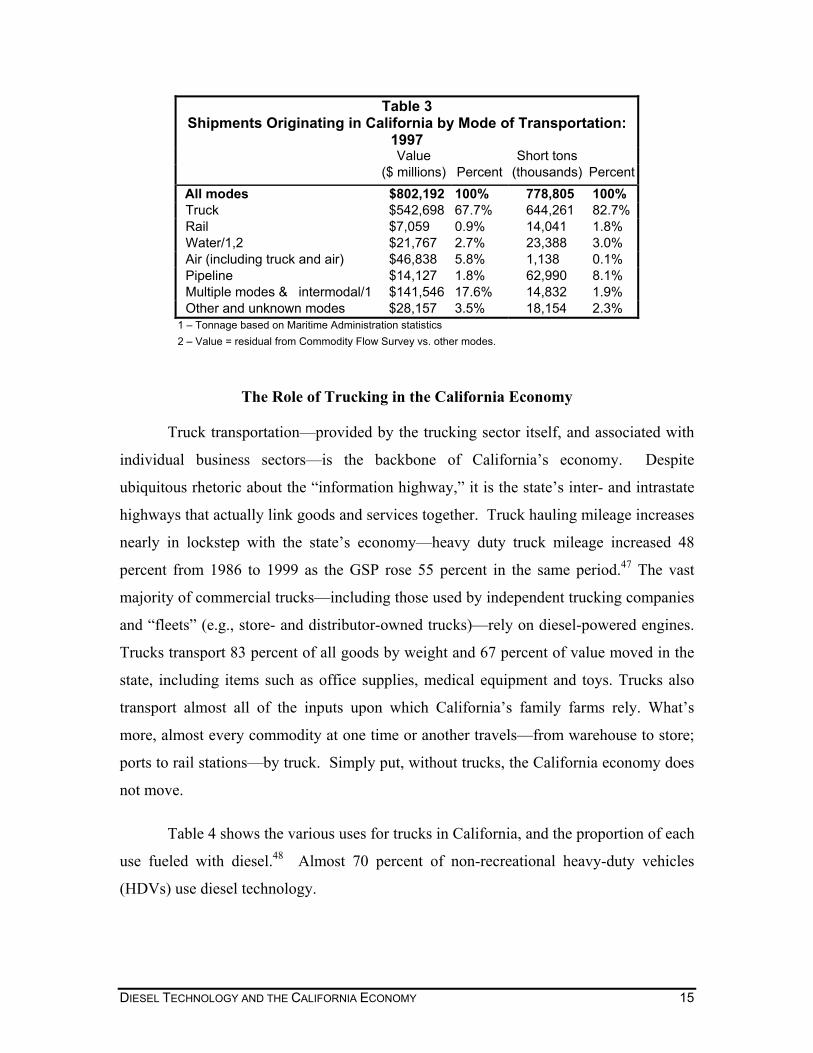
Table 3 Shipments Originating in California by Mode of Transportation:
1997 Value Short tons ($ millions) Percent (thousands) Percent
All modes $802,192 100% 778,805 100% Truck $542,698 67.7% 644,261 82.7% Rail $7,059 0.9% 14,041 1.8% Water/1,2 $21,767 2.7% 23,388 3.0% Air (including truck and air) $46,838 5.8% 1,138 0.1% Pipeline $14,127 1.8% 62,990 8.1% Multiple modes & intermodal/1 $141,546 17.6% 14,832 1.9% Other and unknown modes $28,157 3.5% 18,154 2.3%
1 – Tonnage based on Maritime Administration statistics 2 – Value = residual from Commodity Flow Survey vs. other modes.
The Role of Trucking in the California Economy
Truck transportation—provided by the trucking sector itself, and associated with
individual business sectors—is the backbone of California’s economy. Despite
ubiquitous rhetoric about the “information highway,” it is the state’s inter- and intrastate
highways that actually link goods and services together. Truck hauling mileage increases
nearly in lockstep with the state’s economy—heavy duty truck mileage increased 48
percent from 1986 to 1999 as the GSP rose 55 percent in the same period.47 The vast
majority of commercial trucks—including those used by independent trucking companies
and “fleets” (e.g., store- and distributor-owned trucks)—rely on diesel-powered engines.
Trucks transport 83 percent of all goods by weight and 67 percent of value moved in the
state, including items such as office supplies, medical equipment and toys. Trucks also
transport almost all of the inputs upon which California’s family farms rely. What’s
more, almost every commodity at one time or another travels—from warehouse to store;
ports to rail stations—by truck. Simply put, without trucks, the California economy does
not move.
Table 4 shows the various uses for trucks in California, and the proportion of each
use fueled with diesel.48 Almost 70 percent of non-recreational heavy-duty vehicles
(HDVs) use diesel technology.
DIESEL TECHNOLOGY AND THE CALIFORNIA ECONOMY 15
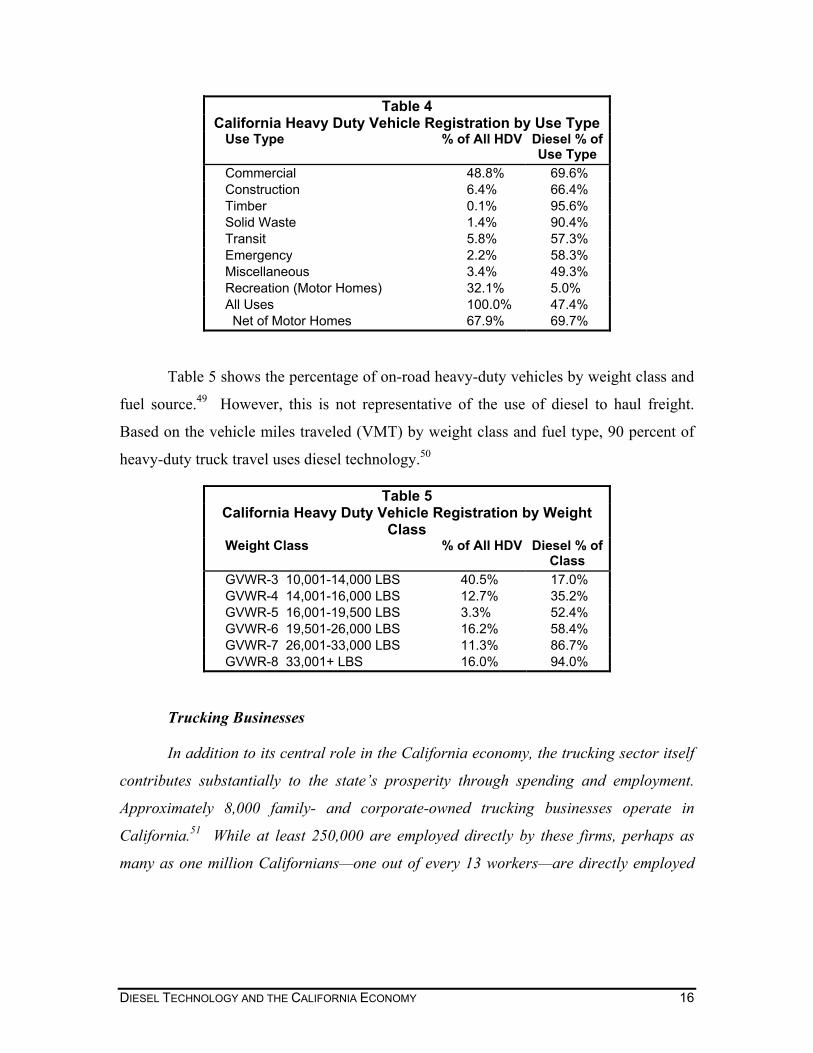
Table 4 California Heavy Duty Vehicle Registration by Use Type
Use Type % of All HDV Diesel % of Use Type
Commercial 48.8% 69.6% Construction 6.4% 66.4% Timber 0.1% 95.6% Solid Waste 1.4% 90.4% Transit 5.8% 57.3% Emergency 2.2% 58.3% Miscellaneous 3.4% 49.3% Recreation (Motor Homes) 32.1% 5.0% All Uses 100.0% 47.4% Net of Motor Homes 67.9% 69.7%
Table 5 shows the percentage of on-road heavy-duty vehicles by weight class and
fuel source.49 However, this is not representative of the use of diesel to haul freight.
Based on the vehicle miles traveled (VMT) by weight class and fuel type, 90 percent of
heavy-duty truck travel uses diesel technology.50
Table 5 California Heavy Duty Vehicle Registration by Weight
Class Weight Class % of All HDV Diesel % of
Class GVWR-3 10,001-14,000 LBS 40.5% 17.0% GVWR-4 14,001-16,000 LBS 12.7% 35.2% GVWR-5 16,001-19,500 LBS 3.3% 52.4% GVWR-6 19,501-26,000 LBS 16.2% 58.4% GVWR-7 26,001-33,000 LBS 11.3% 86.7% GVWR-8 33,001+ LBS 16.0% 94.0%
Trucking Businesses
In addition to its central role in the California economy, the trucking sector itself
contributes substantially to the state’s prosperity through spending and employment.
Approximately 8,000 family- and corporate-owned trucking businesses operate in
California.51 While at least 250,000 are employed directly by these firms, perhaps as
many as one million Californians—one out of every 13 workers—are directly employed
DIESEL TECHNOLOGY AND THE CALIFORNIA ECONOMY 16
by trucking in other industrial activities.a The trucking and warehouse sector is
responsible for $12.7 billion of the state's total gross product. The trucking industry
supports an annual payroll of $6.8 billion dollars, with average wages that are higher
than similar jobs in manufacturing, wholesale trade and construction.52
Trucking provides opportunities for small and family-owned businesses. Over
two-thirds of firms in the trucking and warehousing sector employ fewer than ten people.
Likewise, 95 percent of all truck companies generate revenues of less than $5 million a
year.53
The trucking industry also makes substantial contributions to federal, state and
local tax revenues. For example, in 1999 an operator of a typical five-axle tractor semi-
trailer paid almost $13,500 in state and federal highway user taxes, as well as
approximately $1,000 in sales and $1,600 in property taxes.54
Over the past decade, increasingly stringent air quality rules have substantially
reduced mobile source emissions. For example, diesel engines emit 90 percent less
particulate matter and over 75 percent less nitrous oxides (NOx) than engines built only a
decade and a half ago.
Freight Transportation by Rail
The state’s 31 freight railroads employ 10,098 individuals within California, and
pay wages and benefits totaling approximately $865.4 million.55 The industry delivers
$1.37 billion in value added.
California is substantially dependent on railroads to haul freight. For example,
rail is responsible for approximately 12 percent of the total ton-miles carried by various
transportation modes (e.g., trucks, ships and air craft), and provides essential transport for
a number of key state commodities. The state’s railroads haul 14 million tons of freight
valued at well over $7 billion.56 As indicated in Table 6, rail is responsible for 22 percent
a Given the fact that there are over 300,000 California base-plated trucks in the state, the official employment number appears to significantly underestimate actual trucking-related employment. This underestimate may be due to the fact that many trucking-related jobs are reported as part of other sectors, such as construction, wholesale and retail trade, manufacturing and agriculture. See California Trucking Association, Trucking in California, (West Sacramento, California: 1998).
DIESEL TECHNOLOGY AND THE CALIFORNIA ECONOMY 17
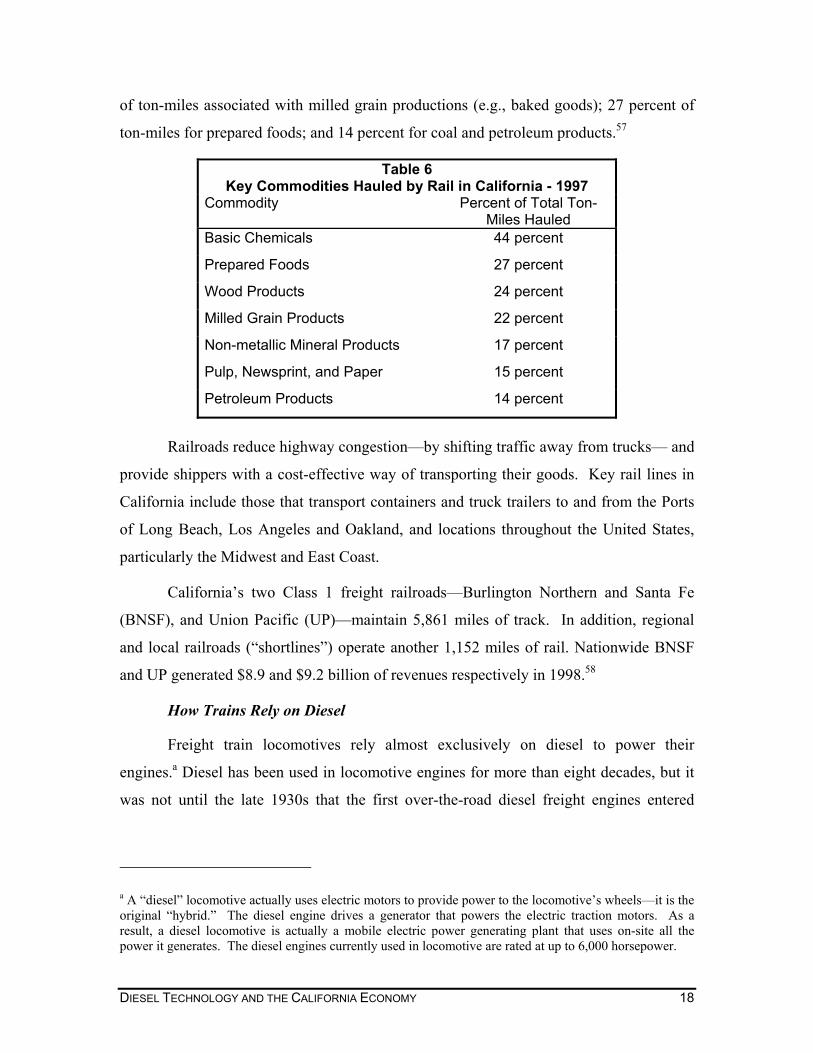
of ton-miles associated with milled grain productions (e.g., baked goods); 27 percent of
ton-miles for prepared foods; and 14 percent for coal and petroleum products.57
Table 6 Key Commodities Hauled by Rail in California - 1997
Commodity Percent of Total Ton-Miles Hauled
Basic Chemicals 44 percent
Prepared Foods 27 percent
Wood Products 24 percent
Milled Grain Products 22 percent
Non-metallic Mineral Products 17 percent
Pulp, Newsprint, and Paper 15 percent
Petroleum Products 14 percent
Railroads reduce highway congestion—by shifting traffic away from trucks— and
provide shippers with a cost-effective way of transporting their goods. Key rail lines in
California include those that transport containers and truck trailers to and from the Ports
of Long Beach, Los Angeles and Oakland, and locations throughout the United States,
particularly the Midwest and East Coast.
California’s two Class 1 freight railroads—Burlington Northern and Santa Fe
(BNSF), and Union Pacific (UP)—maintain 5,861 miles of track. In addition, regional
and local railroads (“shortlines”) operate another 1,152 miles of rail. Nationwide BNSF
and UP generated $8.9 and $9.2 billion of revenues respectively in 1998.58
How Trains Rely on Diesel
Freight train locomotives rely almost exclusively on diesel to power their
engines.a Diesel has been used in locomotive engines for more than eight decades, but it
was not until the late 1930s that the first over-the-road diesel freight engines entered
a A “diesel” locomotive actually uses electric motors to provide power to the locomotive’s wheels—it is the original “hybrid.” The diesel engine drives a generator that powers the electric traction motors. As a result, a diesel locomotive is actually a mobile electric power generating plant that uses on-site all the power it generates. The diesel engines currently used in locomotive are rated at up to 6,000 horsepower.
DIESEL TECHNOLOGY AND THE CALIFORNIA ECONOMY 18
service.a The number of diesel-powered locomotives on the nation’s railroads passed
1,000 in 1940, most of which were used for passenger service. World War II slowed the
rate at which the railroads adopted diesels, but once the war was over the rest of the
locomotive fleet rapidly converted. By the early 1950s, the number of diesel locomotives
exceeded the number of steam engines. Today there are virtually no steam locomotives
in operation. Diesel engines replaced steam due to their superior power-to-weight
performance.
Diesel engines have substantial economic advantages over other power sources
for locomotives. 59 For example, diesel’s thermal efficiency is approximately four times
greater than that of steam locomotives. As a result, diesel engines require substantially
less fuel for equivalent power. Diesel locomotives accelerate quickly, run at high speeds
with minimal track damage, and require modest servicing. They function with similar
efficiencies as electric locomotives, but do not require the capital investments in
substations and electric distribution networks. Finally, many diesel units can be
combined depending on the amount of power required to pull a particular train, while
only one crew member is needed for all the units, thereby increasing the overall
productivity of rail transportation.
a Prior to that time most locomotives were powered by coal or fuel oil using steam-driven pistons.
DIESEL TECHNOLOGY AND THE CALIFORNIA ECONOMY 19
p
e
a
C
sh
im
7
th
o
Je
D
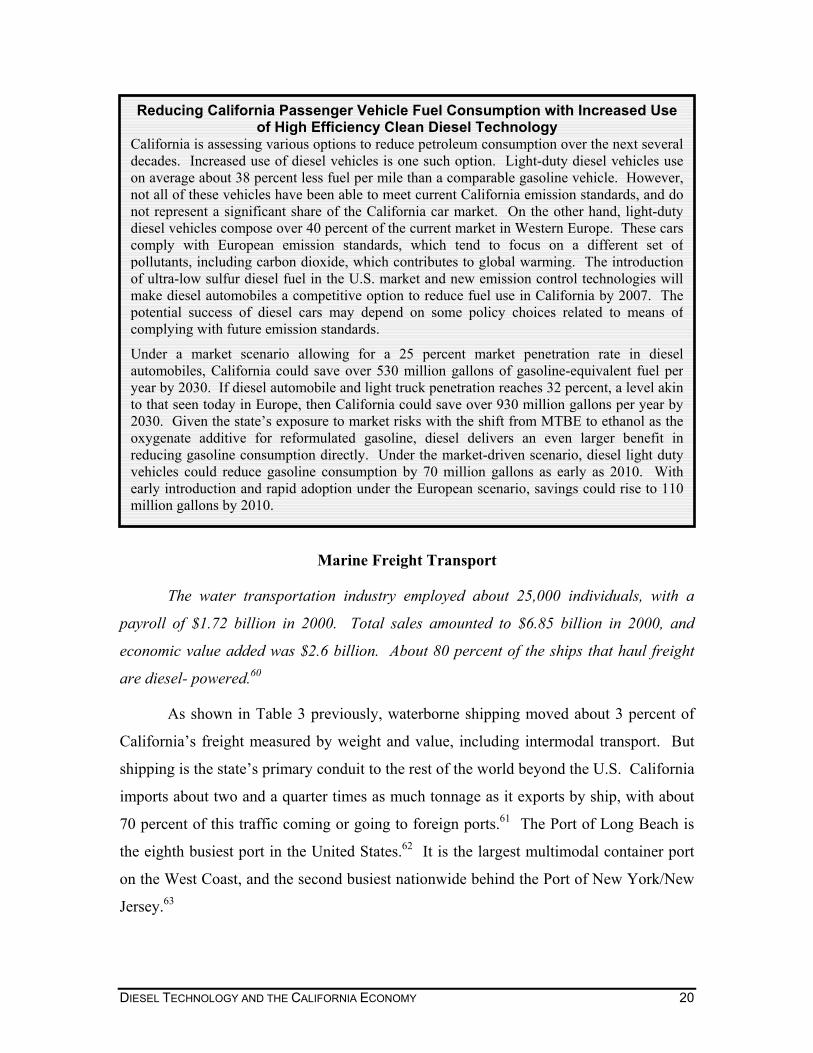
Reducing California Passenger Vehicle Fuel Consumption with Increased Use of High Efficiency Clean Diesel Technology
California is assessing various options to reduce petroleum consumption over the next severaldecades. Increased use of diesel vehicles is one such option. Light-duty diesel vehicles useon average about 38 percent less fuel per mile than a comparable gasoline vehicle. However,not all of these vehicles have been able to meet current California emission standards, and donot represent a significant share of the California car market. On the other hand, light-dutydiesel vehicles compose over 40 percent of the current market in Western Europe. These carscomply with European emission standards, which tend to focus on a different set ofpollutants, including carbon dioxide, which contributes to global warming. The introductionof ultra-low sulfur diesel fuel in the U.S. market and new emission control technologies willmake diesel automobiles a competitive option to reduce fuel use in California by 2007. Thepotential success of diesel cars may depend on some policy choices related to means ofcomplying with future emission standards.
Under a market scenario allowing for a 25 percent market penetration rate in dieselautomobiles, California could save over 530 million gallons of gasoline-equivalent fuel peryear by 2030. If diesel automobile and light truck penetration reaches 32 percent, a level akinto that seen today in Europe, then California could save over 930 million gallons per year by2030. Given the state’s exposure to market risks with the shift from MTBE to ethanol as theoxygenate additive for reformulated gasoline, diesel delivers an even larger benefit inreducing gasoline consumption directly. Under the market-driven scenario, diesel light dutyvehicles could reduce gasoline consumption by 70 million gallons as early as 2010. Withearly introduction and rapid adoption under the European scenario, savings could rise to 110million gallons by 2010.
Marine Freight Transport
The water transportation industry employed about 25,000 individuals, with a
ayroll of $1.72 billion in 2000. Total sales amounted to $6.85 billion in 2000, and
conomic value added was $2.6 billion. About 80 percent of the ships that haul freight
re diesel- powered.60
As shown in Table 3 previously, waterborne shipping moved about 3 percent of
alifornia’s freight measured by weight and value, including intermodal transport. But
ipping is the state’s primary conduit to the rest of the world beyond the U.S. California
ports about two and a quarter times as much tonnage as it exports by ship, with about
0 percent of this traffic coming or going to foreign ports.61 The Port of Long Beach is
e eighth busiest port in the United States.62 It is the largest multimodal container port
n the West Coast, and the second busiest nationwide behind the Port of New York/New
rsey.63
IESEL TECHNOLOGY AND THE CALIFORNIA ECONOMY 20
In fact, container ships dominate California shipping, with only New York
exceeding California’s 49 percent share.64 This reflects the importance of multimodal
transport in California’s economy, in which containers are shipped by water, rail and
road.
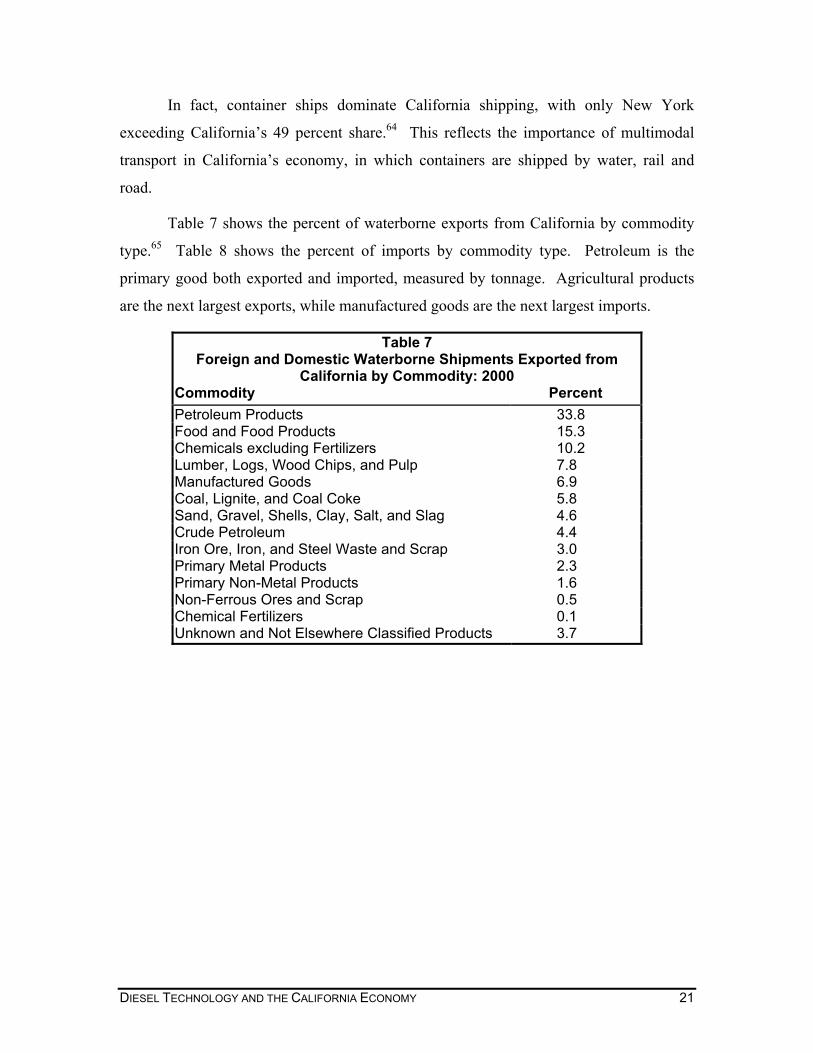
Table 7 shows the percent of waterborne exports from California by commodity
type.65 Table 8 shows the percent of imports by commodity type. Petroleum is the
primary good both exported and imported, measured by tonnage. Agricultural products
are the next largest exports, while manufactured goods are the next largest imports.
Table 7 Foreign and Domestic Waterborne Shipments Exported from
California by Commodity: 2000
Commodity Percent Petroleum Products 33.8 Food and Food Products 15.3 Chemicals excluding Fertilizers 10.2 Lumber, Logs, Wood Chips, and Pulp 7.8 Manufactured Goods 6.9 Coal, Lignite, and Coal Coke 5.8 Sand, Gravel, Shells, Clay, Salt, and Slag 4.6 Crude Petroleum 4.4 Iron Ore, Iron, and Steel Waste and Scrap 3.0 Primary Metal Products 2.3 Primary Non-Metal Products 1.6 Non-Ferrous Ores and Scrap 0.5 Chemical Fertilizers 0.1 Unknown and Not Elsewhere Classified Products 3.7
DIESEL TECHNOLOGY AND THE CALIFORNIA ECONOMY 21
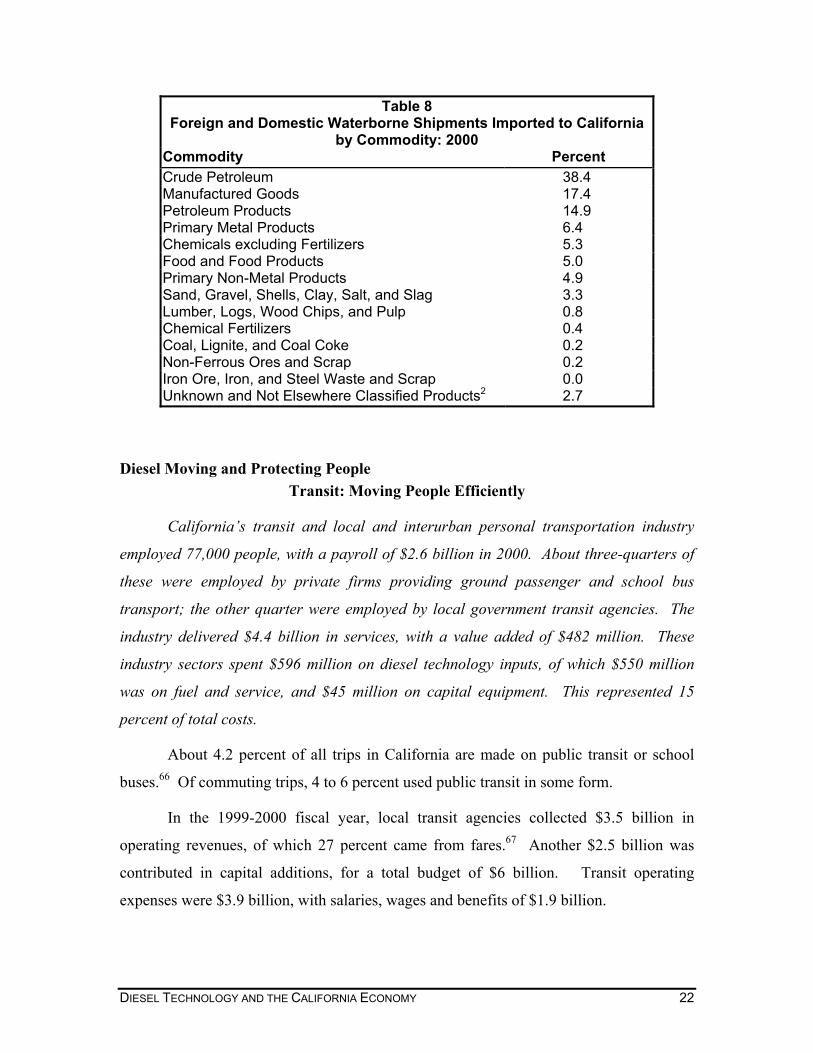
Table 8 Foreign and Domestic Waterborne Shipments Imported to California
by Commodity: 2000
Commodity Percent Crude Petroleum 38.4 Manufactured Goods 17.4 Petroleum Products 14.9 Primary Metal Products 6.4 Chemicals excluding Fertilizers 5.3 Food and Food Products 5.0 Primary Non-Metal Products 4.9 Sand, Gravel, Shells, Clay, Salt, and Slag 3.3 Lumber, Logs, Wood Chips, and Pulp 0.8 Chemical Fertilizers 0.4 Coal, Lignite, and Coal Coke 0.2 Non-Ferrous Ores and Scrap 0.2 Iron Ore, Iron, and Steel Waste and Scrap 0.0 Unknown and Not Elsewhere Classified Products2 2.7
Diesel Moving and Protecting People Transit: Moving People Efficiently
California’s transit and local and interurban personal transportation industry
employed 77,000 people, with a payroll of $2.6 billion in 2000. About three-quarters of
these were employed by private firms providing ground passenger and school bus
transport; the other quarter were employed by local government transit agencies. The
industry delivered $4.4 billion in services, with a value added of $482 million. These
industry sectors spent $596 million on diesel technology inputs, of which $550 million
was on fuel and service, and $45 million on capital equipment. This represented 15
percent of total costs.
About 4.2 percent of all trips in California are made on public transit or school
buses.66 Of commuting trips, 4 to 6 percent used public transit in some form.
In the 1999-2000 fiscal year, local transit agencies collected $3.5 billion in
operating revenues, of which 27 percent came from fares.67 Another $2.5 billion was
contributed in capital additions, for a total budget of $6 billion. Transit operating
expenses were $3.9 billion, with salaries, wages and benefits of $1.9 billion.
DIESEL TECHNOLOGY AND THE CALIFORNIA ECONOMY 22
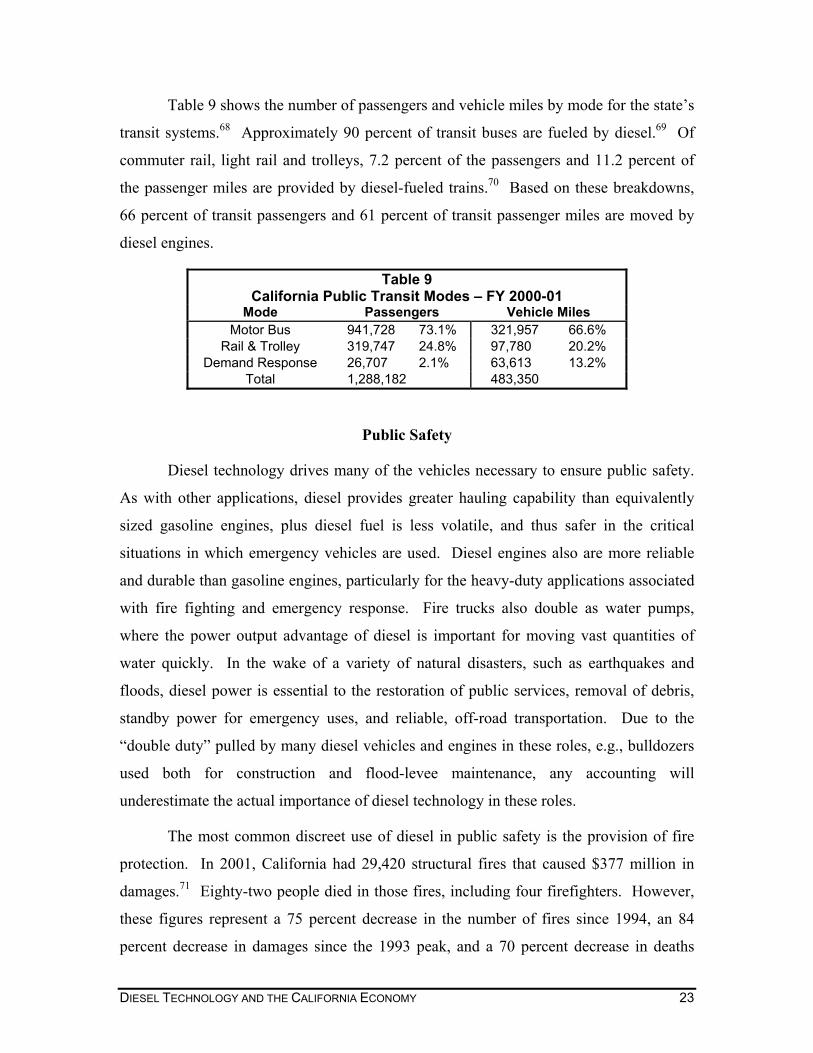
Table 9 shows the number of passengers and vehicle miles by mode for the state’s
transit systems.68 Approximately 90 percent of transit buses are fueled by diesel.69 Of
commuter rail, light rail and trolleys, 7.2 percent of the passengers and 11.2 percent of
the passenger miles are provided by diesel-fueled trains.70 Based on these breakdowns,
66 percent of transit passengers and 61 percent of transit passenger miles are moved by
diesel engines.
Table 9 California Public Transit Modes – FY 2000-01
Mode Passengers Vehicle Miles Motor Bus 941,728 73.1% 321,957 66.6%
Rail & Trolley 319,747 24.8% 97,780 20.2% Demand Response 26,707 2.1% 63,613 13.2%
Total 1,288,182 483,350
Public Safety
Diesel technology drives many of the vehicles necessary to ensure public safety.
As with other applications, diesel provides greater hauling capability than equivalently
sized gasoline engines, plus diesel fuel is less volatile, and thus safer in the critical
situations in which emergency vehicles are used. Diesel engines also are more reliable
and durable than gasoline engines, particularly for the heavy-duty applications associated
with fire fighting and emergency response. Fire trucks also double as water pumps,
where the power output advantage of diesel is important for moving vast quantities of
water quickly. In the wake of a variety of natural disasters, such as earthquakes and
floods, diesel power is essential to the restoration of public services, removal of debris,
standby power for emergency uses, and reliable, off-road transportation. Due to the
“double duty” pulled by many diesel vehicles and engines in these roles, e.g., bulldozers
used both for construction and flood-levee maintenance, any accounting will
underestimate the actual importance of diesel technology in these roles.
The most common discreet use of diesel in public safety is the provision of fire
protection. In 2001, California had 29,420 structural fires that caused $377 million in
damages.71 Eighty-two people died in those fires, including four firefighters. However,
these figures represent a 75 percent decrease in the number of fires since 1994, an 84
percent decrease in damages since the 1993 peak, and a 70 percent decrease in deaths
DIESEL TECHNOLOGY AND THE CALIFORNIA ECONOMY 23
since 1995. According to the California Department of Forestry (CDF), from 1998 to
2003, there was an average of 5,900 wildland fires covering 130,848 acres, with total
damages amounting to $90 million annually in its jurisdiction.72
To protect against fires, California spent $3.6 billion on fire protection services in
the 1999-2000 fiscal year.73 Local agencies employed 27,250 firefighters in that period.74
CDF hired 10,800 full-time, seasonal and local government firefighters and staff, and
used another 4,300 inmates in its fire crews to patrol 31 million acres.75
and nthis ccouldreduccertacustogenerlimitscurtaon.
constdeple
gener94.5%
polluwouldiesefleet.pounAccooxidein moemisslikelyuponrun o
short
withi
DIESEL T
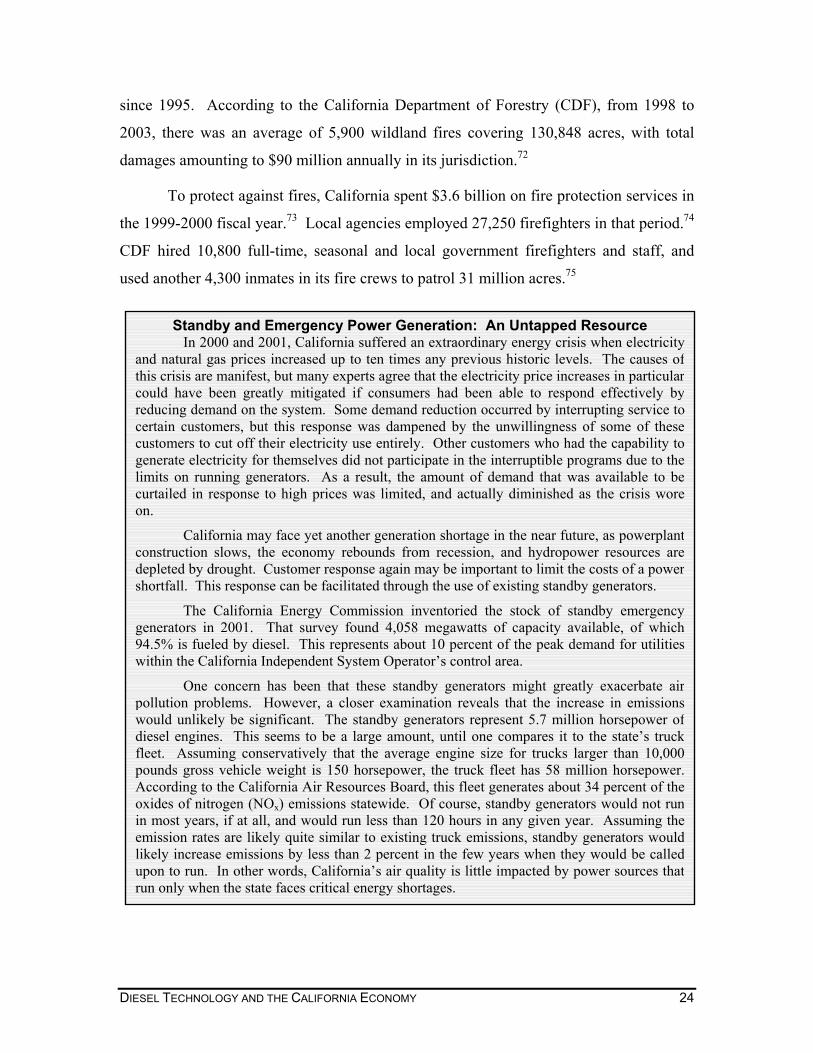
Standby and Emergency Power Generation: An Untapped Resource In 2000 and 2001, California suffered an extraordinary energy crisis when electricity
atural gas prices increased up to ten times any previous historic levels. The causes ofrisis are manifest, but many experts agree that the electricity price increases in particular have been greatly mitigated if consumers had been able to respond effectively bying demand on the system. Some demand reduction occurred by interrupting service to
in customers, but this response was dampened by the unwillingness of some of thesemers to cut off their electricity use entirely. Other customers who had the capability toate electricity for themselves did not participate in the interruptible programs due to the on running generators. As a result, the amount of demand that was available to be
iled in response to high prices was limited, and actually diminished as the crisis wore
California may face yet another generation shortage in the near future, as powerplantruction slows, the economy rebounds from recession, and hydropower resources areted by drought. Customer response again may be important to limit the costs of a po
l. This response can be facilitated through the use of existing standby generators.
The California Energy Commission inventoried the stock of standby emergencyators in 2001. That survey found 4,058 megawatts of capacity available, of which is fueled by diesel. This represents about 10 percent of the
he California Independent System Operator’s control area.
One concern has been that these standby generators might greatly exacerbate airtion problems. However, a closer examination reveals that the increase in emissionsd unlikely be significant. The standby generators represent 5.7 million horsepower ofl engines. This seems to be a large amount, until one compares it to the state’s truck Assuming conservatively that the average engine size for trucks larger than 10,000ds gross vehicle weight is 150 horsepower, the truck fleet has 58 million horsepower.rding to the California Air Resources Board, this fleet generates about 34 percent of thes of nitrogen (NOx) emissions statewide. Of course, standby generators would not runst years, if at all, and would run less than 120 hours in any given year. Assuming theion rates are likely quite similar to existing truck emissions, standby generators would increase emissions by less than 2 percent in the few years when they would be called
to run. In other words, California’s air quality is little impacted by power sources thatnly when the state faces critical energy shortages.
werfal
peak demand for utilitiesn t
ECHNOLOGY AND THE CALIFORNIA ECONOMY 24
State and local agencies had 18,230 heavy-duty emergency vehicles in use in
2001.76 Among these vehicles, the CDF has more than 3,000 emergency response and
resource protection vehicles.77 Of heavy-duty vehicles used for emergency services, such
as fire and tow trucks, 58 percent use diesel.78
SUMMING UP: THE VALUE ADDED TO THE CALIFORNIA ECONOMY
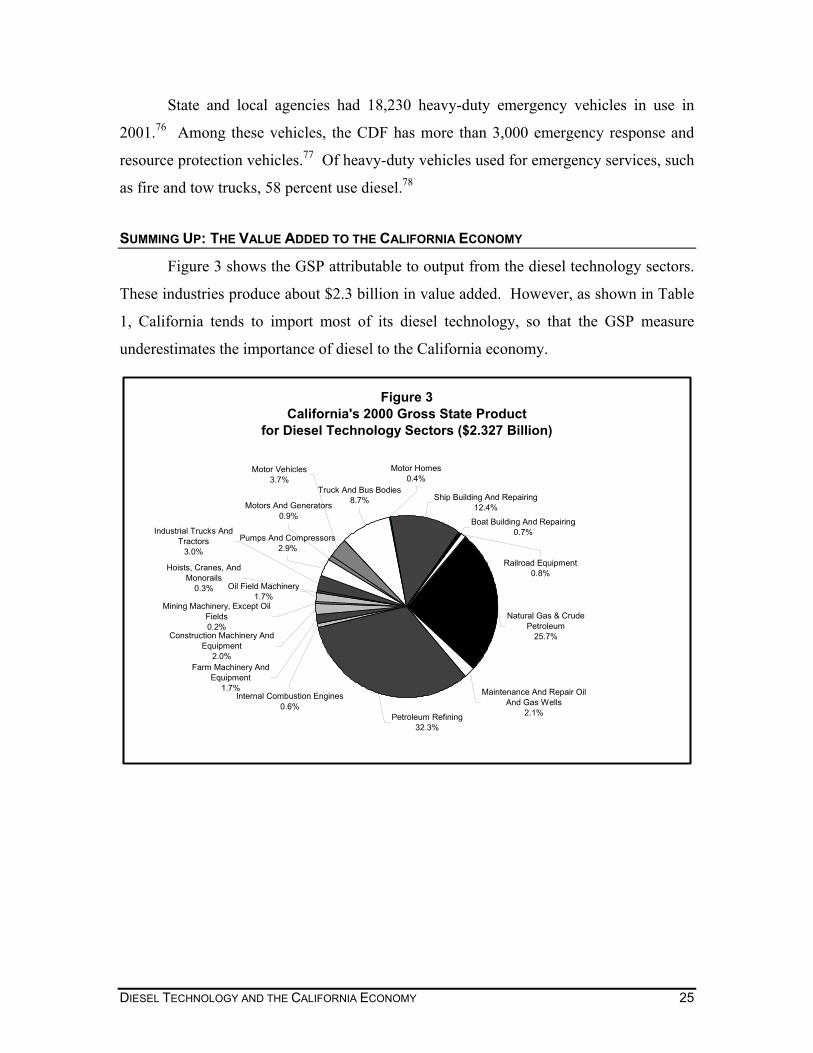
Figure 3 shows the GSP attributable to output from the diesel technology sectors.
These industries produce about $2.3 billion in value added. However, as shown in Table
1, California tends to import most of its diesel technology, so that the GSP measure
underestimates the importance of diesel to the California economy.
Figure 3California's 2000 Gross State Product
for Diesel Technology Sectors ($2.327 Billion)
Ship Building And Repairing12.4%
Boat Building And Repairing0.7%
Truck And Bus Bodies8.7%
Motor Homes0.4%
Pumps And Compressors2.9%
Mining Machinery, Except Oil Fields0.2%
Industrial Trucks And Tractors
3.0%
Hoists, Cranes, And Monorails
0.3%
Farm Machinery And Equipment
1.7%Internal Combustion Engines
0.6%
Railroad Equipment0.8%
Natural Gas & Crude Petroleum
25.7%
Petroleum Refining32.3%
Construction Machinery And Equipment
2.0%
Oil Field Machinery1.7%
Motors And Generators0.9%
Motor Vehicles3.7%
Maintenance And Repair Oil And Gas Wells
2.1%
DIESEL TECHNOLOGY AND THE CALIFORNIA ECONOMY 25
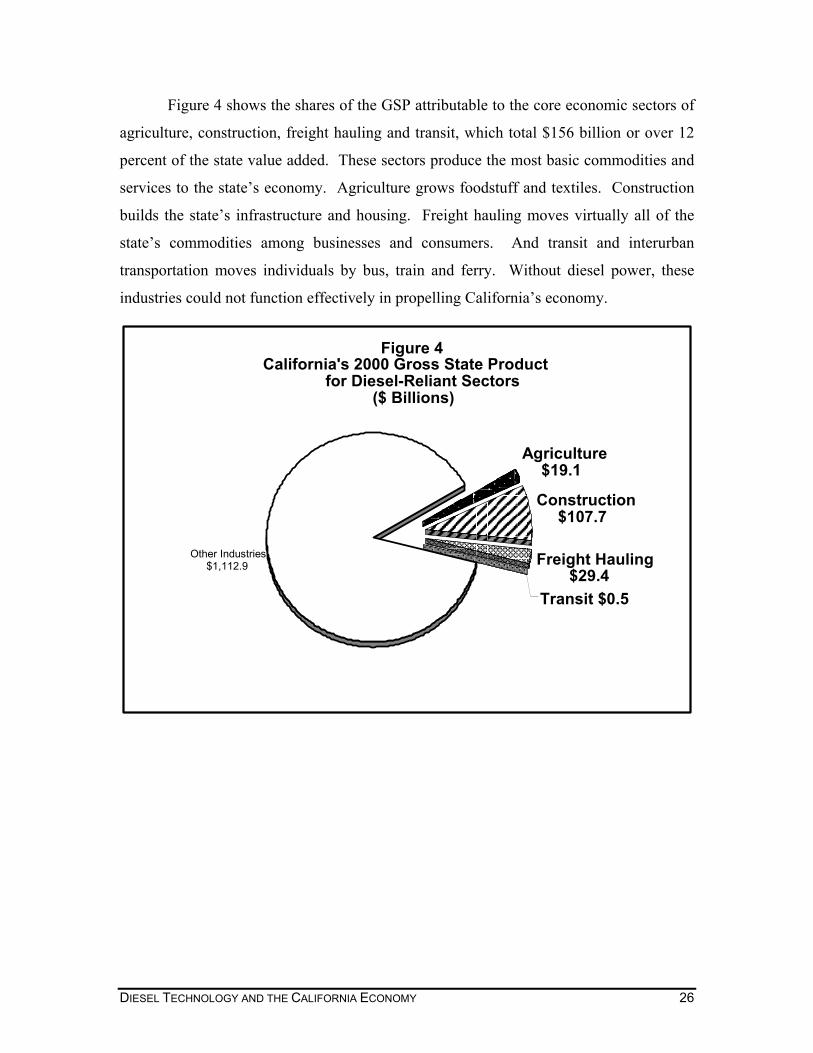
Figure 4 shows the shares of the GSP attributable to the core economic sectors of
agriculture, construction, freight hauling and transit, which total $156 billion or over 12
percent of the state value added. These sectors produce the most basic commodities and
services to the state’s economy. Agriculture grows foodstuff and textiles. Construction
builds the state’s infrastructure and housing. Freight hauling moves virtually all of the
state’s commodities among businesses and consumers. And transit and interurban
transportation moves individuals by bus, train and ferry. Without diesel power, these
industries could not function effectively in propelling California’s economy.
Figure 4California's 2000 Gross State Product
for Diesel-Reliant Sectors($ Billions)
Other Industries $1,112.9
Transit $0.5
Freight Hauling $29.4
Construction $107.7
Agriculture $19.1
DIESEL TECHNOLOGY AND THE CALIFORNIA ECONOMY 26
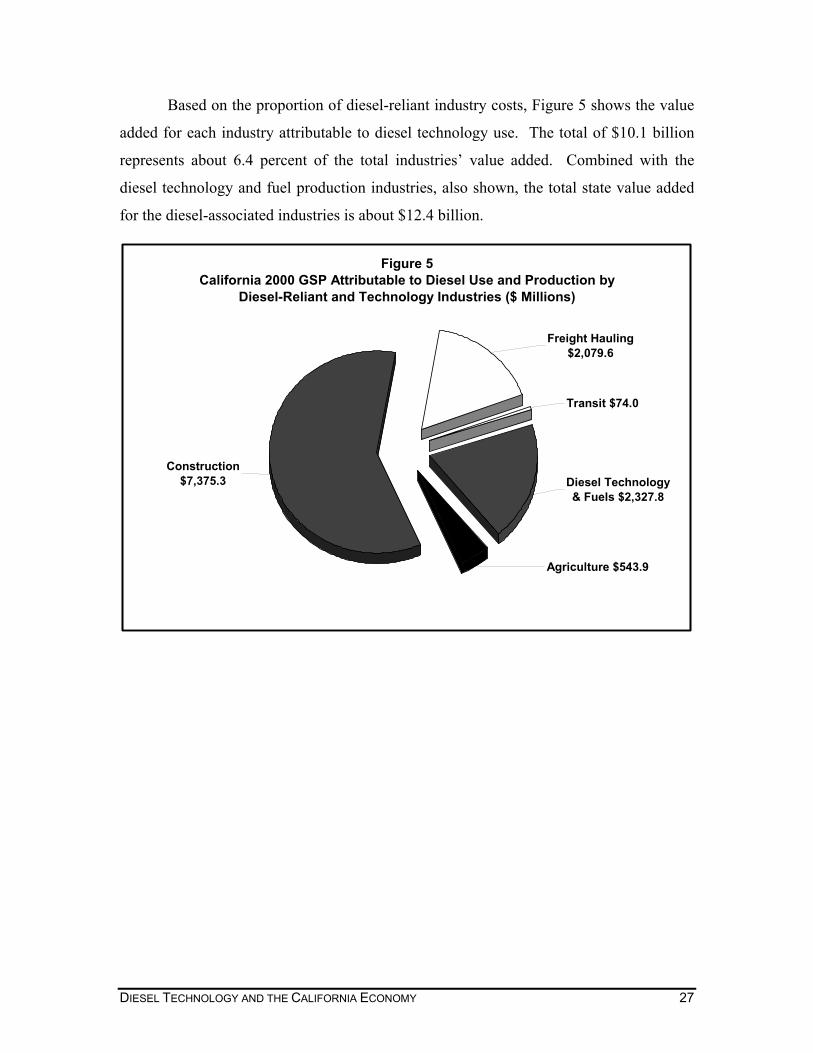
Based on the proportion of diesel-reliant industry costs, Figure 5 shows the value
added for each industry attributable to diesel technology use. The total of $10.1 billion
represents about 6.4 percent of the total industries’ value added. Combined with the
diesel technology and fuel production industries, also shown, the total state value added
for the diesel-associated industries is about $12.4 billion.
Figure 5California 2000 GSP Attributable to Diesel Use and Production by
Diesel-Reliant and Technology Industries ($ Millions)
Diesel Technology & Fuels $2,327.8
Transit $74.0
Agriculture $543.9
Freight Hauling $2,079.6
Construction $7,375.3
DIESEL TECHNOLOGY AND THE CALIFORNIA ECONOMY 27
DIES
Cecevthagpofuinprmansuincoinm
* UsPo
California Without Diesel: Potential Costs of Replacing Diesel Technology alifornians for a Sound Fuel Strategy commissioned a study in 2000 to examine theonomic implications of possible air quality rules restricting diesel use.* The studyaluated two alternative proposals to mandate that all new, as well as all, diesel engines in e state be converted to natural gas, with the exception of off-road vehicles used in the ricultural and construction sectors, locomotives and marine vessels. Under the examinedlicies, truck owners/operators would be forced to purchase higher-cost non-diesel vehicles; eling and service stations would have to make substantial investments in new natural gas frastructure, including upgrading their electrical systems; growers would have toematurely retire their diesel-powered pumps, and instead rely on higher-cost electric otors; oil refiners would be forced to export diesel–or greatly reduce in-state production–d recover a greater share of their costs from other fuels, such as gasoline; and natural gasppliers may need to build additional pipeline capacity in California. The cost increasesduced by the potential policies would be felt throughout the economy. And an unintendednsequence could be greater traffic congestion as more, smaller trucks could be usedstead. The analysis follows an analytic method that derives the least-cost approach to eeting the stated objectives (i.e., it is conservative).
Under a new truck only scenario, in which all new truck purchases would consist of non-diesel-powered vehicles, truck owner/operators would be forced to spend $8.2 billion over a ten year period to pay for higher-cost alternative-fueled vehicles and associated natural gas infrastructure.
Under the replacement scenario, in which all diesel trucks would have to be retrofitted to alternative fuels or retired out-of-state by 2006, the direct costs to the state economy would increase substantially more for heavy-duty vehicles and fuel infrastructure–$34.7 billion between 2001 and 2010.
Large-scale reductions in diesel fuel use would act to “strand” existing diesel-related infrastructure, including refining capacity, fueling systems, repair stations, and newly-installed, state-of-the-art underground storage tanks. As a result of the scenario-induced diesel surplus—and excluding the costs associated with other infrastructure madeobsolete under the scenario—refineries would be forced to sell excess fuel outside California, or reduce overall production and spread their fixed costs across a smaller fuelstream. As a result, and within the overall cost estimates, refineries would face $1.9 billion in ten-year costs under the new truck only scenario, and $3.4 billion under thereplacement truck scenario.
The state’s agricultural sector would be hard hit under the replacement scenario. Excluding the costs associated with policies directed at other diesel-powered on-farm equipment (e.g., tractors), growers would be forced to spend approximately $66 million ayear as a result of the need to switch to non-diesel-powered water pumps.
The cost increases would ripple through the California economy, reducing job growthand income. Under the new truck scenario the state would attract 33,000 fewer jobs ayear in 2010, with associated personal income loses of $2.1 billion annually. Declines inemployment growth would be even higher and immediate under the existing truckscenario: 157,000 fewer jobs a year in 2005, and a $1.3 billion decline in annual income.Almost 1,000 jobs would be lost in the agricultural sector alone under the existing truckscenario.
Steven J. Moss et al., Analysis of Potential Economic Impacts from Proposed Restrictions on Diesel e in California (San Francisco, California: Prepared by M.Cubed for Californians for a Sound Fuellicy, June, 2000).
EL TECHNOLOGY AND THE CALIFORNIA ECONOMY 28
APPENDIX A - VALUE ADDED AND THE GSP; AND INPUT-OUTPUT MODELING, BRIEFLY
The economic significance of diesel technology to the California economy can be
assessed using an input-output model of the California economy based on the IMPLAN
system of regional economic accounts.79 The IMPLAN data set is derived from U.S.
Bureau of Economic Affairs data. IMPLAN’s statewide economic database is used to
construct a system of inter-industry transaction accounts and an associated social
accounts matrix (SAM) for tracing the economic relationships among the state’s
industries and tracking transfers of income among institutions (households, enterprises
and governments). The key feature of the IMPLAN system (and other input-output
models such as RIMS) is its system of multipliers that translates initial changes in an
industry’s output or final demand for its products into values reflecting the recirculation
of income and spending through the economy. The process of recirculation results in a
multiple expansion (or contraction, in the case of a decline in initial output or demand) of
earnings, output and employment that is the result of households and other economic
units changing spending due to the “stimulus” of the initial change in output or demand.
This economic principle is known as the “multiplier effect”—spending one dollar may
multiply into two or three dollars of increased economic activity throughout the state or
nation.
The IMPLAN model’s multipliers apply to such variables as industry output (or
gross sales), labor income (employee compensation and self-employed proprietors’
earnings), other property ownership-related income (corporate profits, dividends, rents
and other returns on capital assets), indirect business taxes (mainly sales and property
taxes), and employment (full- and part-time jobs). The labor and property income and
indirect tax variables together comprise the concept of “value added,” which represents
the activity’s contribution to regional, state and national gross product—the usual
measure of the value of all new goods and services produced in a year.
Value added is the economic value added to a product by an industry beyond the
costs of purchasing the necessary inputs from other industries. Each step of the
production, delivery and service process adds incremental value. The cumulative value
added across these industries will equal the total cost to provide the final product to the
end consumer. The sum of all of this value added that was produced within the state for
DIESEL TECHNOLOGY AND THE CALIFORNIA ECONOMY 29
California is known as the “Gross State Product” or GSP. The state's GSP excludes
materials and services imported from out-of-state. The GSP is directly analogous to the
U.S. Gross Domestic Product or GDP, whose growth rate is followed closely in the
business and economic press.
The multiplier process involves three stages of effects through the state’s
economy: direct, indirect and induced.
The direct effect is the initial change in an industry’s output or demand for its
product (commodity or service). It involves the factors of production –
employees, property and other resources – directly producing the initial good or
service.
The indirect effect involves the suppliers of goods and services to the sectors that
are realizing the direct effect or initial change, as the latter sectors replace their
inventories drawn down by sales to the initial direct effect industry.
Finally, the induced effect involves the economic institutions and industries
receiving expenditures by households and other institutions earning income at the
direct and indirect stages. Spending on consumer goods and services out of the
wages, salaries, and other earnings of the direct and indirect stage factors of
production circulates and recirculates through the economy until it is dissipated
through “leakages” in the form of savings and payments for goods and services
from outside the local economy. All told, the cumulative changes in income and
employment are a multiple of the initial direct effect.a
The system of multipliers also makes it possible to estimate the values of income
and employment throughout the economy that are supported, directly and indirectly, by a
given industry’s outlays for labor, capital, and inputs of goods (e.g., diesel fuel) and
a The IMPLAN multipliers are the so-called “Type SAM” (social accounting matrix) multipliers which account not only for Leontief inter-industry transactions (the Type I multiplier between the direct and indirect stages) and household income and expenditures (commonly referred to as Type II multipliers, which encompass the induced stage), but also for inter-institutional transfers among households and other institutions, including such transfers as Social Security payments and receipts, income tax payments, and earnings outflows to non-residents. Accounting for the inter-institutional transfers permits the analysis of induced effects to be confined to resident households’ consumption spending of disposable income after netting out savings and tax payments, thus reducing potential over-estimation of the total multiplier effect.
DIESEL TECHNOLOGY AND THE CALIFORNIA ECONOMY 30
services. For example, if Industry X produces and sells $100 million worth of goods and
services in a year and, per the IMPLAN model, that industry’s Total Output multiplier is
2.50, then the indirect and induced economic activity supported by Industry X’s $100
million of direct output would be worth another $150 million, for a total contribution to
the state’s gross output of $250 million. Similar multipliers are provided for the other
parameters of economic activity, namely value added (i.e., labor income, other property
income and indirect business taxes) and employment. These multipliers, in conjunction
with the model’s database of inputs consumed by industry sectors (their “intermediate
inputs”) in the process of producing their final products also enable analysts to calculate
the fractional value of economic effects that can be associated with utilization of a given
input (e.g., diesel fuel).
DIESEL TECHNOLOGY AND THE CALIFORNIA ECONOMY 31
REFERENCES
1 Charles River Associates, Diesel Technology and the American Economy, D02738-00 (Washington, D.C.: Prepared for the Diesel Technology Forum, October 2000). 2 IMPLAN® (IMpact PLANning) is a proprietary software product of the Minnesota IMPLAN Group, Inc., of Stillwater, Minnesota. 3 IMPLAN California data set for 2000. 4 U.S. Bureau of the Census, Statistical Abstract of the United States: 2001, 121st Edition (Washington, D.C.: U.S. Government Printing Office, 2001), Tables 1327 and 1339. 5 IMPLAN California data set for 2000. 6 Based on national data presented in Charles River Associates, op.cit., Appendix A, except where noted below. 7 California Department of Conservation, 2001 Annual Report of the State Oil & Gas Supervisor, PR-06 (Sacramento, California: Division of Oil, Gas, and Geothermal Resources, September, 2002), available at http://www.consrv.ca.gov/DOG/ qh_publications.htm. 8 California Energy Commission, 1999 Refinery Report, (Sacramento, California, 2003), available at http://www.energy.ca.gov/oil/refinery_output/ 1999_refinery_report.html. 9 Booz-Allen & Hamilton, Socio-Economic Survey of Nonroad Construction Equipment Operators in Southern California, Final Report (Los Angeles, California: Prepared for the Construction Industry Air Quality Coalition, March 30, 1999). 10 California Energy Commission, “Vehicle Registration Data,” Mhsum01--R4--Diesel.xls, (Sacramento, California, February 2003). 11 California Department of Conservation, op. cit. 12 Based on California Department of Conservation, 2001 Annual Report of the State Oil & Gas Supervisor, and prices for Kern River 13o gravity crude oil from Energy Information Administration, Petroleum Marketing Annual 2001, DOE/EIA-0487(2001) (Washington, D.C.: U.S. Department of Energy, Office of Oil and Gas, September 2001). 13 California Department of Conservation, Division of Oil and Gas, op. cit. 14 CEC, “Vehicle Registration Data,” op.cit. 15 CEC, 1999 Refinery Report, op. cit. 16 Energy Information Administration, State Energy Data Report-1999, DOE/EIA-0214(09) (Washington, D.C.: U.S. Department of Energy, May 2001), Table 41. 17 California Energy Commission, Base Case Forecast for California Transportation Demand, P600-01-019, Staff Draft Report (Sacramento, California: Prepared for AB2076 Petroleum Dependence Proceedings, December 2001). 18 CEC, Base Case Forecast, op.cit. 19 California State Board of Equalization, Agency Planning and Research Division, Statistics Section, (Sacramento, California, 2000.) 20 California Trucking Association, “Average Rack/Retail Diesel Prices as of 6/02/03,” http://www.caltrux.org/diesel.asp, (West Sacramento, California, June 2003.) 21 Based on IMPLAN California data set for 2000 for selected industries within each sector. 22 Farm receipts: California Department of Food and Agriculture, Agriculture Statistical Review, (Sacramento, California, 2001.) 23 Kuminoff, Nicolai V., et.al., The Measure of California Agriculture 2000, Davis, California: University of California Agricultural Issues Center, December 2001.) 24 Ibid, Table 50. 25 National Agricultural Statistics Service, 1997 Census of Agriculture, (Washington, D.C.: U.S.
DIESEL TECHNOLOGY AND THE CALIFORNIA ECONOMY 32
DIESEL TECHNOLOGY AND THE CALIFORNIA ECONOMY 33
Department of Agriculture, 2001), Volume 1; and Bureau of Economic Analysis, National Income and Product Accounts, (Washington, D.C.: U.S. Department of Commerce, 2001.) 26 Kuminoff, et al, op.cit. 27 Ibid. 28 California Agricultural Statistics Service, Summary of County Agricultural Commissioners’ Reports, (Sacramento, California, August 2002). 29 California Department of Food and Agriculture, Agricultural Statistical Review, (Sacramento, California, 2001). 30 Kuminoff, et al, op.cit. 31 Charles River Associates, op.cit. 32 Natural Resources and Environment Division, Agricultural Resources and Environmental Indicators, Production Inputs (Washington, D.C.: U.S. Department of Agriculture, 1995), pages 135-6. 33 Sung Won Sohn, Wells Fargo Bank, March 25, 2003. 34 U.S. Census Bureau, Economics and Statistics Administration, California 1997 Economic Census, Transportation, EC97TCF-CA, (Washington, D.C.: U.S. Department of Commerce, December 1999). 35 U.S. Environmental Protection Agency, Final Regulatory Analysis: Control of Emissions from Non-Road Diesel Engines, (Washington, D.C., 1997). 36 California Air Resources Board, Public Meeting to Consider Approval of California's Emissions Inventory for Off-Road Large Compression-Ignited (CI) Engines (>25 HP) (Sacramento, California: Mobile Source Control Division, January, 2000), with adjusted Construction inventory to reflect California’s share of US GDP at 15%, rather than 10%. 37 National Agricultural Statistical Service, 1998 Ranch and Farm Irrigation Survey, (Washington, D.C.: U.S. Department of Agriculture, 2000), Table 17. 38 U.S. Census Bureau, 1997 Economic Census: Construction-California, EC97C23-CA, (Washington, D.C.: U.S. Department of Commerce, March 2000), Table 1. 39 Ibid. Table 3. 40 CEC, Vehicle Registration Data, op. cit. 41 Booz-Allen & Hamilton, op. cit. 42 California Air Resources Board, op. cit., with adjusted Construction inventory to reflect California’s share of US GDP at 15%, rather than 10%. 43 U.S. Census Bureau, 1997 Economic Census—Vehicle Inventory and Use Survey, EC97TV-CA, (Washington, D.C.: U.S. Department of Commerce, March 1999), Table 1b. 44 U.S. Census Bureau, 1997 Transportation Commodity Flow Survey-California, EC97TCF-CA, (Washington, D.C.: U.S. Department of Commerce, 1999), Table 5. 45 U.S. Department of Transportation, Bureau of Transportation Statistics and U.S. Census Bureau, 1997 Commodity Flow Survey: California, EC97TCF-CA, (Washington, D.C.: U.S. Department of Commerce, 1999), table 1a; and Maritime Administration, Waterborne Databank, (Washington, D.C.: U.S. Department of Transportation, 1999). 46 Ibid, Table 1c; and California Department of Transportation, California Motor Vehicle Stock, Travel and Fuel Forecast (Sacramento, California: Division of Transportation System Information, November 2002), Table 2. 47 California Department of Transportation, Truck Kilometers of Travel on the California State Highway System: 1984-1999 (Sacramento, California: Division of Transportation System Information, December, 2002); California Department of Finance, California Statistical Abstract (Sacramento, California, November 2002), Table D-1. 48 CEC, Vehicle Registration Data, op. cit. 49 Ibid.
DIESEL TECHNOLOGY AND THE CALIFORNIA ECONOMY 34
50 CalTrans, op.cit., Table-2. 51 U.S. Census Bureau, 1997 Economic Census: Transportation and Warehousing-California, EC97T48A-CA, (Washington, D.C.: U.S. Department of Commerce, January 2000), Table 1. 52 U.S. Census Bureau, County Business Patterns, op. cit.; California Trucking Association, Trucking in California, (West Sacramento, California, 1998). 53 U.S. Census Bureau, op.cit. 54 CTA, op.cit. 55 The Surface Transportation Board, the federal agency responsible for economic regulation of the rail industry, classifies railroads by their operating revenue levels. For 1998, Class 1 railroads were defined as those with operating revenues of $259 million or more. Association of American Railroads, “Freight Railroads Operating in California,” January 2002; Association of American Railroads, Railroad Facts, (Washington, D.C., October 1999. 56 1997 Commodity Flow Survey: California, op. cit. 57 U.S. Census Bureau, California, 1997 Economic Census, Transportation, EC97TCF-CA, (Washington, D.C.: U.S. Department of Commerce, December 1999.) 58 Ibid. 59 Charles River Associates (2000), op.cit. 60 Ibid. 61 U.S. Army Corps of Engineers, Waterborne Commerce Statistics Center, Origin and Destination of Waterborne Commerce of the United States, 2000, (http://www.wrsc.usace.army.mil, February 12, 2002.) 62 Ibid. 63 U.S. Department of Transportation, Maritime Administration, Waterborne Databank 1999, (Washington, D.C.: U.S. Department of Commerce, http://www.marad.dot.gov/, November 5, 2001.) 64 Ibid. 65 US ACE, op. cit. 66 NuStats, 2000-2001 California Statewide Household Travel Survey, Final Report (Austin, Texas: Prepared for the California Department of Transportation, June 2002). 67 California State Controller, Transit Operators and Non-Transit Claimants Annual Report (Sacramento, California, January 2002), Figure 5. 68 Ibid, Figure 15. 69 CEC, Vehicle Registration Data, op. cit. 70 California State Controller, op. cit.; California Department of Transportation, California State Rail Plan: 2001-02 to 2010-11 (Sacramento, California, January 2002). 71 California State Fire Marshal, California Fire Incident Reporting System: Fires In California, (Sacramento, California, February 7, 2003.) 72 California Department of Forestry and Fire Protection, CDF Jurisdiction Fires, Acres and Dollar Damage, (Sacramento, California, 2003.), available at http://www.fire.ca.gov/FireEmergencyResponse/HistoricalStatistics/PDF/Firehistory.pdf. 73 U.S. Census Bureau, “State and Local Government Finances: 1999-2000, Expenditures for California,” (Washington, D.C.: U.S. Department of Commerce, 2001.) 74 U.S. Census Bureau, “Public Employment Data: State and Local Governments in California,” (Washington, D.C.: U.S. Department of Commerce, 2001.) 75 California Department of Forestry and Fire Protection, Fire and Emergency Response, (Sacramento, California, 2003.), available at http://www.fire.ca.gov/FireEmergencyResponse/pdf/fireandemerg.pdf, 2003. 76 CEC, Vehicle Registration Data, op. cit.
DIESEL TECHNOLOGY AND THE CALIFORNIA ECONOMY 35
77 California Department of Forestry and Fire Protection, Mobile Equipment, (Sacramento, California, 2003.), available at http://www.fire.ca.gov/FireEmergencyResponse/MobileEquipment/MobileEquipment.asp., 2003. 78 Ibid. 79 IMPLAN® (IMpact PLANning) is a proprietary software product of the Minnesota IMPLAN Group, Inc., of Stillwater, Minnesota.


Diesel Technology Forum5210 Chairman’s Court, Suite 2-B
Frederick, MD 21703Tel: 301/668-7230 Fax: 301/668-7234