Embed Size (px)
DESCRIPTION
Dielectric Properties
Citation preview
Physica C 469 (2009) 182–187
Contents lists available at ScienceDirect
Physica C
journal homepage: www.elsevier .com/ locate /physc
Dielectric response of Cu0.5Tl0.5Ba2(Ca2�yMgy)(Cu0.5Zn2.5)O10�d bulksuperconductor to frequency and temperature
M. Mumtaz *, Nawazish A. KhanMaterials Science Laboratory, Department of Physics, Quaid-i-Azam University, Islamabad 45320, Pakistan
a r t i c l e i n f o a b s t r a c t
Article history:Received 14 September 2008Received in revised form 1 January 2009Accepted 18 January 2009Available online 29 January 2009
PACS:74.70.�b74.72.Jt74.62.Bf74.25.Qt
Keywords:Cu0.5Tl0.5Ba2Ca2�yMgyCu0.5Zn2.5O10�d
superconductorsDielectric constantPolarizationCapacitanceConductance
0921-4534/$ - see front matter � 2009 Elsevier B.V. Adoi:10.1016/j.physc.2009.01.010
* Corresponding author. Tel.: +92 52 90642122/519210256.
E-mail address: [email protected] (M. Mum
The dielectric properties of Cu0.5Tl0.5Ba2Ca2�yMgyCu0.5Zn2.5O10�d (y = 0, 0.5, 1.0, 1.5) superconductor sam-ples were studied at 79 and 290 K by means of capacitance (C) and conductance (G) measurements withthe test frequency (f) in the range of 10 KHz to 10 MHz. A negative capacitance (NC) phenomenon hasbeen observed, which is most likely arising due to higher Fermi level of ceramic superconductor samplesthan metal electrodes. Also the NC may be due to the space charge located at the multiple insulator–superconductor interfaces (grain boundaries) in the materials. The negative dielectric constant (e0) andloss factor (tand) show strong dispersion at low frequencies. The lower thermal agitation at 79 K mayenhance the polarizability and hence the dielectric constants (e0 and e00).
� 2009 Elsevier B.V. All rights reserved.
1. Introduction
Although the cuprate superconductors have extensively beencharacterized but there is a very little work done on their dielectricproperties. In the homologous series of Cu0.5Tl0.5Ba2Can�1Cun
O2n+4�d superconductors, the most attractive candidate is Cu0.5Tl0.5
Ba2Ca2Cu3O10�d (CuTl-1223) due its lower anisotropy, higher criti-cal temperature (Tc) and higher critical current density (Jc) [1,2].This compound has Cu0.5Tl0.5Ba2O4�d charge reservoir layer andthree conducting CuO2 planes. The normal pressure synthesis ofbulk (CuTl-1223) superconductor is very simple and economicalfor large-scale production of this material for device fabrication.Bulk as well as thin films of (CuTl-1223) superconductor have beenprepared and extensively characterized [1–5]. The Ca atoms sepa-rate the conducting CuO2 planes and consequently the wave func-tion of the Ca atoms develops a correlation among the carriers invarious CuO2 planes. Also the coupling between the CuO2 planesin oxide superconductors plays very important role in enhancingthe superconducting volume fraction. The coupling strength of mo-
ll rights reserved.
90642091 (Lab); fax: +92 51
taz).
bile carriers in CuO2 planes determines the length of Fermi vectorKF = (3p2N/V)1/3, the coherence length along c-axis nc = ⁄KF/2mDand ultimately the superconductivity order parameters. In previ-ous studies, the substitution of Mg+2 at Ca+2 site in Cu0.5Tl0.5Ba2Ca2-Cu3O10�d and Cu0.5Tl0.5Ba2Ca3Cu4O12�d superconductors has beenfound to improve the inter-plane coupling, which is most likelyaccomplished due its smaller ionic size and higher electronegativ-ity of Mg atoms [6–13]. Following the previous methodology, theinter-plane coupling among ZnO2/CuO2 planes of Cu0.5Tl0.5Ba2Ca2
(Cu0.5Zn2.5)O10�d superconductor has been enhanced by substitut-ing Mg at the Ca sites [14,15]. The effects of enhanced inter-planecoupling on the dielectric properties of this compound have beenstudied in this article. For these studies, we have selected Cu0.5Tl0.5
Ba2Ca2�yMgyCu0.5Zn2.5O10�d (y = 0, 0.5, 1.0, 1.5) superconductorsamples.
There are four primary mechanisms of polarization in materials:(1) electronic polarization, (2) atomic and ionic polarization, (3)dipolar or oriental polarization, and (4) interfacial polarizationand each mechanism involves a short-range motion of chargesand contributes to the total polarization of the material.
The electronic polarization (ae) is observed at very high fre-quency of the order of �1015 Hz (i.e. in ultraviolet optical range)and an atomic and ionic polarization (aa) takes place at the
M. Mumtaz, N.A. Khan / Physica C 469 (2009) 182–187 183
frequencies in the infrared range of 1010–1013 Hz. The dipolar ororiental polarization (ao), which occurs in the sub-infrared rangeof frequencies (103–106 Hz) mainly contributes to the dielectricproperties of the materials and the interfacial polarization (ai) ismore sensitive in the low frequency range of 103 Hz and may ex-tend to few kilohertz range [16].
The last two sources of polarization (i.e. dipolar or orientalpolarization and interfacial polarization) play a main role in thedielectric measurements of samples.
To the best of our knowledge, there are few reports related todielectric measurements on oxide high temperature superconduc-tors [17–27]. A relatively higher value of dielectric constants ofTl2Ba2Ca2Cu3Ox [17], Tl2Ba2CaCu2Ox [17], Bi2Ba2Nd1.6Ce0.4Cu2O10+d
[18] and Bi1.84Pb0.34Sr1.9Ca2.03Cu3.06InxOy [19] superconductorshave been reported and their frequency dependent dielectric prop-erties have been studied. In this article we report the measure-ments of the dielectric constants (e0 and e 0), dielectric loss factor(tand) and ac-conductivity (rac) of Cu0.5Tl0.5Ba2Ca2�yMgyCu0.5
Zn2.5O10�d (y = 0, 0.5, 1.0, 1.5) bulk superconductor samples bymeans of capacitance (C) and conductance (G) measurements withthe test frequency (f) in the range of 10 KHz to 10 MHz and attemperatures 79 K and 290 K.
2. Experimental
The Cu0.5Tl0.5Ba2Ca2�yMgyCu0.5Zn2.5O10�d samples are preparedby solid-state reaction method accomplished in two stages. At thefirst stage Cu0.5Ba2Ca2�yMgyCu0.5Zn2.5O10�d (y = 0, 0.5, 1.0, 1.5) pre-cursor material is synthesized by using Ba(NO3)2 (99%, Merck),Ca(NO3)2 (99%, Merck), MgO (99%, BDH Chemical Ltd. Poole Eng-land), Cu2(CN)2 (99%, BDH Chemical Ltd. Poole England) and ZnO(99.7%, BDH Chemical Ltd. Poole England) as starting compounds.These compounds are mixed in appropriate ratios and grinded in aquartz mortar and pestle for about an hour. After grinding, thematerial is loaded in a quartz boat for firing in a furnace at860 �C. The material is fired twice following one hour intermediategrinding. The precursor material is then mixed with Tl2O3 (99%,Merck) to give Cu0.5Tl0.5Ba2Ca2�yMgyCu0.5Zn2.5O10�d (y = 0, 0.5,
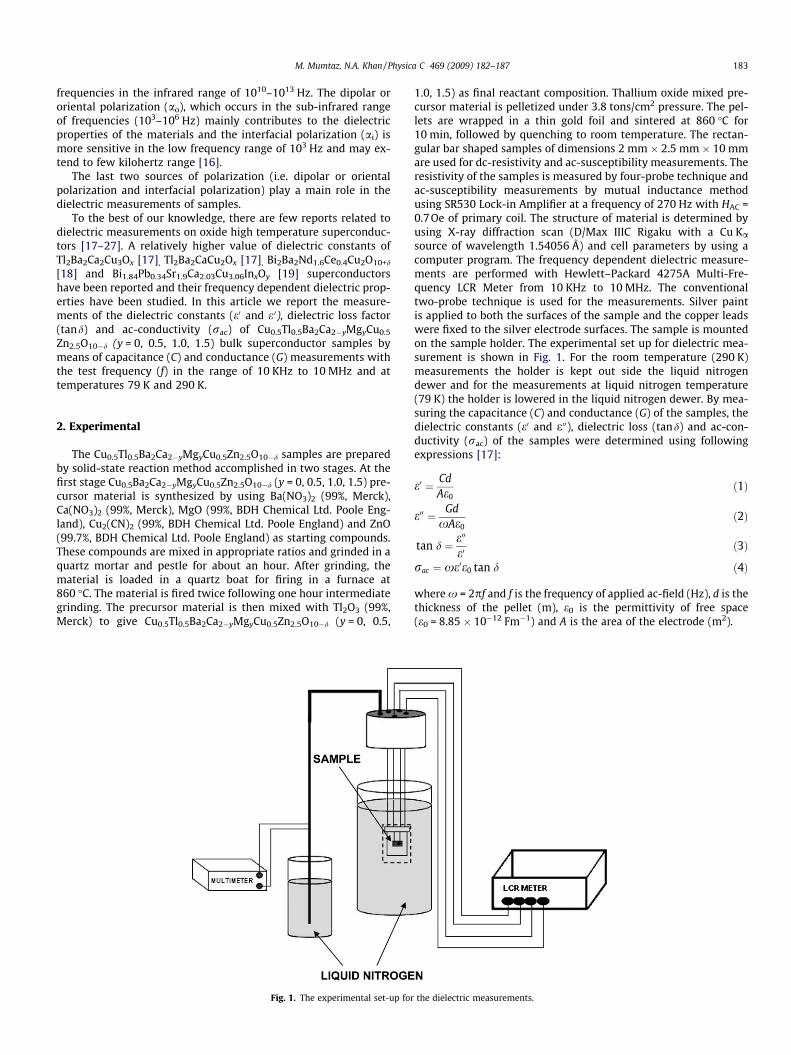
Fig. 1. The experimental set-up for
1.0, 1.5) as final reactant composition. Thallium oxide mixed pre-cursor material is pelletized under 3.8 tons/cm2 pressure. The pel-lets are wrapped in a thin gold foil and sintered at 860 �C for10 min, followed by quenching to room temperature. The rectan-gular bar shaped samples of dimensions 2 mm � 2.5 mm � 10 mmare used for dc-resistivity and ac-susceptibility measurements. Theresistivity of the samples is measured by four-probe technique andac-susceptibility measurements by mutual inductance methodusing SR530 Lock-in Amplifier at a frequency of 270 Hz with HAC =0.7Oe of primary coil. The structure of material is determined byusing X-ray diffraction scan (D/Max IIIC Rigaku with a Cu Kasource of wavelength 1.54056 Å) and cell parameters by using acomputer program. The frequency dependent dielectric measure-ments are performed with Hewlett–Packard 4275A Multi-Fre-quency LCR Meter from 10 KHz to 10 MHz. The conventionaltwo-probe technique is used for the measurements. Silver paintis applied to both the surfaces of the sample and the copper leadswere fixed to the silver electrode surfaces. The sample is mountedon the sample holder. The experimental set up for dielectric mea-surement is shown in Fig. 1. For the room temperature (290 K)measurements the holder is kept out side the liquid nitrogendewer and for the measurements at liquid nitrogen temperature(79 K) the holder is lowered in the liquid nitrogen dewer. By mea-suring the capacitance (C) and conductance (G) of the samples, thedielectric constants (e0 and e00), dielectric loss (tand) and ac-con-ductivity (rac) of the samples were determined using followingexpressions [17]:
e0 ¼ CdAe0
ð1Þ
e00 ¼ GdxAe0
ð2Þ
tan d ¼ e00
e0ð3Þ
rac ¼ xe0e0 tan d ð4Þ
where x = 2pf and f is the frequency of applied ac-field (Hz), d is thethickness of the pellet (m), e0 is the permittivity of free space(e0 = 8.85 � 10�12 Fm�1) and A is the area of the electrode (m2).
the dielectric measurements.
100 150 200 250 3000.00
0.09
0.18
0.27
0.36
0.45
80 90 100 110 120 130-36-30
-24-18
-12-60
6
y = 0 y = 0.5 y = 1.0 y = 1.5
χac
(em
u/g
m)
Temperature (K)
ρ(Ω
−cm
)
Temperature (K)
y = 0 y = 0.5 y = 1.0 y = 1.5
Fig. 3. Resistivity versus temperature measurements of Cu0.5Tl0.5Ba2Ca2�y
MgyCu0.5Zn2.5O10�d (y = 0, 0.5, 1.0, 1.5) superconductors; (inset ac-susceptibilityversus temperature measurements of Cu0.5Tl0.5Ba2Ca2�yMgyCu0.5Zn2.5O10�d (y = 0,0.5, 1.0, 1.5) superconductors).
184 M. Mumtaz, N.A. Khan / Physica C 469 (2009) 182–187
3. Results and discussion
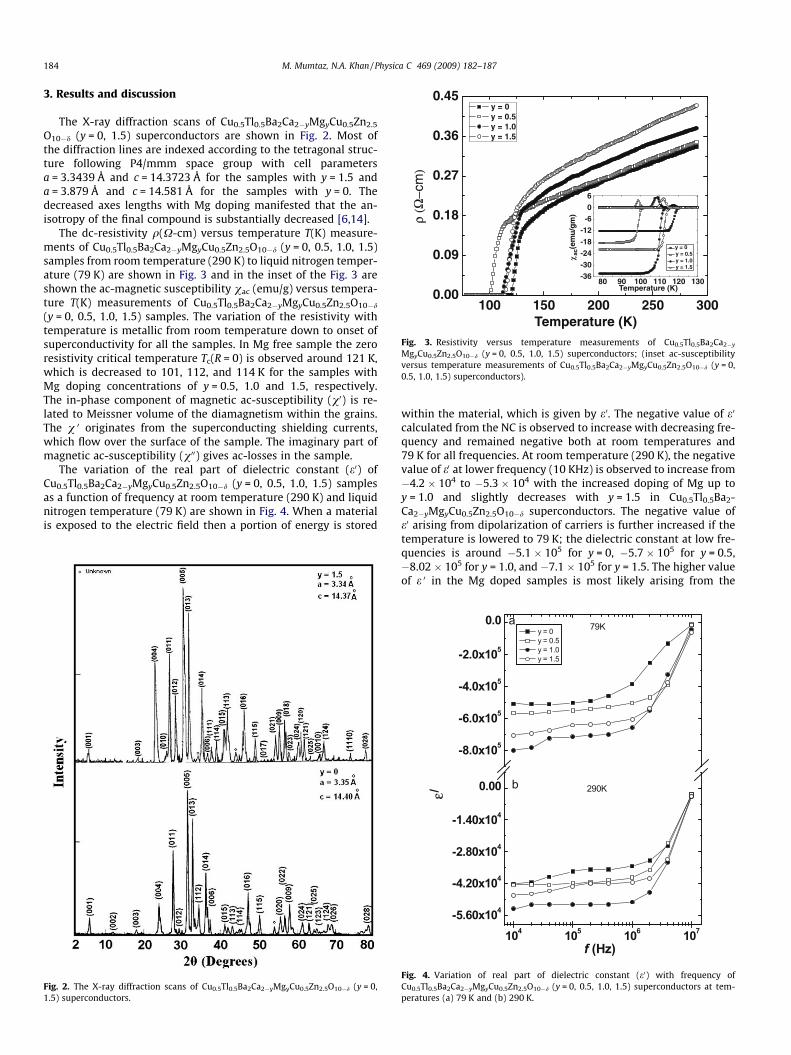
The X-ray diffraction scans of Cu0.5Tl0.5Ba2Ca2�yMgyCu0.5Zn2.5
O10�d (y = 0, 1.5) superconductors are shown in Fig. 2. Most ofthe diffraction lines are indexed according to the tetragonal struc-ture following P4/mmm space group with cell parametersa = 3.3439 Å and c = 14.3723 Å for the samples with y = 1.5 anda = 3.879 Å and c = 14.581 Å for the samples with y = 0. Thedecreased axes lengths with Mg doping manifested that the an-isotropy of the final compound is substantially decreased [6,14].
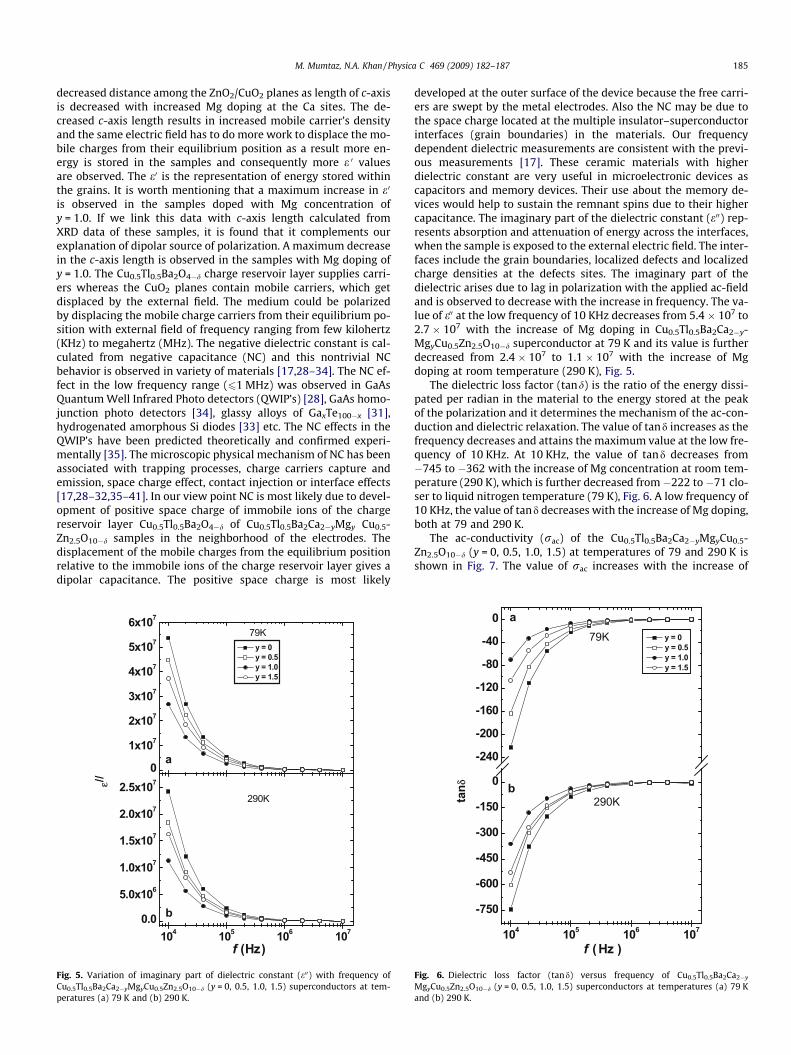
The dc-resistivity q(X-cm) versus temperature T(K) measure-ments of Cu0.5Tl0.5Ba2Ca2�yMgyCu0.5Zn2.5O10�d (y = 0, 0.5, 1.0, 1.5)samples from room temperature (290 K) to liquid nitrogen temper-ature (79 K) are shown in Fig. 3 and in the inset of the Fig. 3 areshown the ac-magnetic susceptibility vac (emu/g) versus tempera-ture T(K) measurements of Cu0.5Tl0.5Ba2Ca2�yMgyCu0.5Zn2.5O10�d
(y = 0, 0.5, 1.0, 1.5) samples. The variation of the resistivity withtemperature is metallic from room temperature down to onset ofsuperconductivity for all the samples. In Mg free sample the zeroresistivity critical temperature Tc(R = 0) is observed around 121 K,which is decreased to 101, 112, and 114 K for the samples withMg doping concentrations of y = 0.5, 1.0 and 1.5, respectively.The in-phase component of magnetic ac-susceptibility (v0) is re-lated to Meissner volume of the diamagnetism within the grains.The v 0 originates from the superconducting shielding currents,which flow over the surface of the sample. The imaginary part ofmagnetic ac-susceptibility (v00) gives ac-losses in the sample.
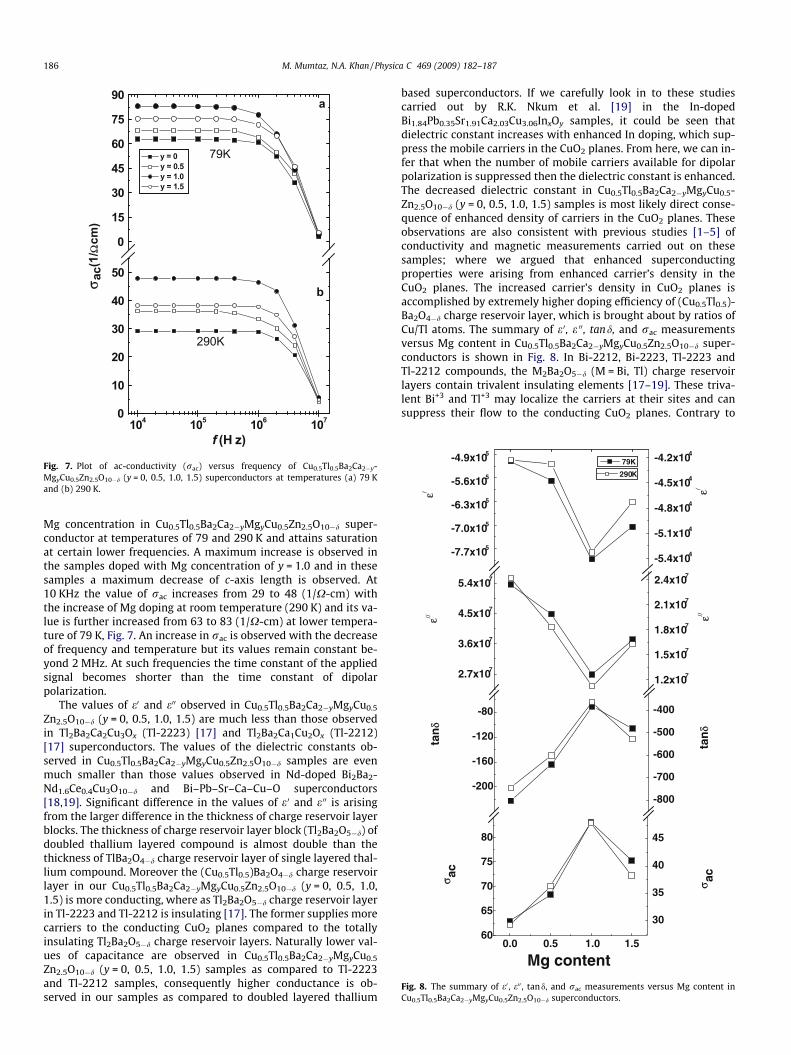
The variation of the real part of dielectric constant (e0) ofCu0.5Tl0.5Ba2Ca2�yMgyCu0.5Zn2.5O10�d (y = 0, 0.5, 1.0, 1.5) samplesas a function of frequency at room temperature (290 K) and liquidnitrogen temperature (79 K) are shown in Fig. 4. When a materialis exposed to the electric field then a portion of energy is stored
Fig. 2. The X-ray diffraction scans of Cu0.5Tl0.5Ba2Ca2�yMgyCu0.5Zn2.5O10�d (y = 0,1.5) superconductors.
within the material, which is given by e0. The negative value of e0
calculated from the NC is observed to increase with decreasing fre-quency and remained negative both at room temperatures and79 K for all frequencies. At room temperature (290 K), the negativevalue of e0 at lower frequency (10 KHz) is observed to increase from�4.2 � 104 to �5.3 � 104 with the increased doping of Mg up toy = 1.0 and slightly decreases with y = 1.5 in Cu0.5Tl0.5Ba2-Ca2�yMgyCu0.5Zn2.5O10�d superconductors. The negative value ofe0 arising from dipolarization of carriers is further increased if thetemperature is lowered to 79 K; the dielectric constant at low fre-quencies is around �5.1 � 105 for y = 0, �5.7 � 105 for y = 0.5,�8.02 � 105 for y = 1.0, and �7.1 � 105 for y = 1.5. The higher valueof e 0 in the Mg doped samples is most likely arising from the
-8.0x10⁵
-6.0x10⁵
-4.0x10⁵
-2.0x10⁵
0.0
104 105 106 107
-5.60x10⁴
-4.20x10⁴
-2.80x10⁴
-1.40x10⁴
0.00
a
b 290K
79K y = 0 y = 0.5 y = 1.0 y = 1.5
ε/
f (Hz)
Fig. 4. Variation of real part of dielectric constant (e0) with frequency ofCu0.5Tl0.5Ba2Ca2�yMgyCu0.5Zn2.5O10�d (y = 0, 0.5, 1.0, 1.5) superconductors at tem-peratures (a) 79 K and (b) 290 K.
M. Mumtaz, N.A. Khan / Physica C 469 (2009) 182–187 185
decreased distance among the ZnO2/CuO2 planes as length of c-axisis decreased with increased Mg doping at the Ca sites. The de-creased c-axis length results in increased mobile carrier’s densityand the same electric field has to do more work to displace the mo-bile charges from their equilibrium position as a result more en-ergy is stored in the samples and consequently more e 0 valuesare observed. The e0 is the representation of energy stored withinthe grains. It is worth mentioning that a maximum increase in e0
is observed in the samples doped with Mg concentration ofy = 1.0. If we link this data with c-axis length calculated fromXRD data of these samples, it is found that it complements ourexplanation of dipolar source of polarization. A maximum decreasein the c-axis length is observed in the samples with Mg doping ofy = 1.0. The Cu0.5Tl0.5Ba2O4�d charge reservoir layer supplies carri-ers whereas the CuO2 planes contain mobile carriers, which getdisplaced by the external field. The medium could be polarizedby displacing the mobile charge carriers from their equilibrium po-sition with external field of frequency ranging from few kilohertz(KHz) to megahertz (MHz). The negative dielectric constant is cal-culated from negative capacitance (NC) and this nontrivial NCbehavior is observed in variety of materials [17,28–34]. The NC ef-fect in the low frequency range (61 MHz) was observed in GaAsQuantum Well Infrared Photo detectors (QWIP’s) [28], GaAs homo-junction photo detectors [34], glassy alloys of GaxTe100�x [31],hydrogenated amorphous Si diodes [33] etc. The NC effects in theQWIP’s have been predicted theoretically and confirmed experi-mentally [35]. The microscopic physical mechanism of NC has beenassociated with trapping processes, charge carriers capture andemission, space charge effect, contact injection or interface effects[17,28–32,35–41]. In our view point NC is most likely due to devel-opment of positive space charge of immobile ions of the chargereservoir layer Cu0.5Tl0.5Ba2O4�d of Cu0.5Tl0.5Ba2Ca2�yMgy Cu0.5-Zn2.5O10�d samples in the neighborhood of the electrodes. Thedisplacement of the mobile charges from the equilibrium positionrelative to the immobile ions of the charge reservoir layer gives adipolar capacitance. The positive space charge is most likely
0
1x10⁷
2x10⁷
3x10⁷
4x10⁷
5x10⁷
6x10⁷
104 105 106 1070.0
5.0x10⁶
1.0x10⁷
1.5x10⁷
2.0x10⁷
2.5x10⁷
f (Hz)
290K
79K
a
y = 0 y = 0.5 y = 1.0 y = 1.5
b
ε//
Fig. 5. Variation of imaginary part of dielectric constant (e00) with frequency ofCu0.5Tl0.5Ba2Ca2�yMgyCu0.5Zn2.5O10�d (y = 0, 0.5, 1.0, 1.5) superconductors at tem-peratures (a) 79 K and (b) 290 K.
developed at the outer surface of the device because the free carri-ers are swept by the metal electrodes. Also the NC may be due tothe space charge located at the multiple insulator–superconductorinterfaces (grain boundaries) in the materials. Our frequencydependent dielectric measurements are consistent with the previ-ous measurements [17]. These ceramic materials with higherdielectric constant are very useful in microelectronic devices ascapacitors and memory devices. Their use about the memory de-vices would help to sustain the remnant spins due to their highercapacitance. The imaginary part of the dielectric constant (e00) rep-resents absorption and attenuation of energy across the interfaces,when the sample is exposed to the external electric field. The inter-faces include the grain boundaries, localized defects and localizedcharge densities at the defects sites. The imaginary part of thedielectric arises due to lag in polarization with the applied ac-fieldand is observed to decrease with the increase in frequency. The va-lue of e00 at the low frequency of 10 KHz decreases from 5.4 � 107 to2.7 � 107 with the increase of Mg doping in Cu0.5Tl0.5Ba2Ca2�y-MgyCu0.5Zn2.5O10�d superconductor at 79 K and its value is furtherdecreased from 2.4 � 107 to 1.1 � 107 with the increase of Mgdoping at room temperature (290 K), Fig. 5.
The dielectric loss factor (tand) is the ratio of the energy dissi-pated per radian in the material to the energy stored at the peakof the polarization and it determines the mechanism of the ac-con-duction and dielectric relaxation. The value of tand increases as thefrequency decreases and attains the maximum value at the low fre-quency of 10 KHz. At 10 KHz, the value of tand decreases from�745 to �362 with the increase of Mg concentration at room tem-perature (290 K), which is further decreased from �222 to �71 clo-ser to liquid nitrogen temperature (79 K), Fig. 6. A low frequency of10 KHz, the value of tand decreases with the increase of Mg doping,both at 79 and 290 K.
The ac-conductivity (rac) of the Cu0.5Tl0.5Ba2Ca2�yMgyCu0.5-Zn2.5O10�d (y = 0, 0.5, 1.0, 1.5) at temperatures of 79 and 290 K isshown in Fig. 7. The value of rac increases with the increase of
-240
-200
-160
-120
-80
-40
0
104 105 106 107
-750
-600
-450
-300
-150
0 b290K
79K
ay = 0 y = 0.5 y = 1.0 y = 1.5
tan δ
f (Hz )
Fig. 6. Dielectric loss factor (tand) versus frequency of Cu0.5Tl0.5Ba2Ca2�y
MgyCu0.5Zn2.5O10�d (y = 0, 0.5, 1.0, 1.5) superconductors at temperatures (a) 79 Kand (b) 290 K.
0
15
30
45
60
75
90
104 105 106 1070
10
20
30
40
50
290K
79K
a
y = 0 y = 0.5 y = 1.0 y = 1.5
bσac
( 1/Ω
cm)
f (H z)
Fig. 7. Plot of ac-conductivity (rac) versus frequency of Cu0.5Tl0.5Ba2Ca2�y-MgyCu0.5Zn2.5O10�d (y = 0, 0.5, 1.0, 1.5) superconductors at temperatures (a) 79 Kand (b) 290 K.
-7.7x10⁵
-7.0x10⁵
-6.3x10⁵
-5.6x10⁵
-4.9x10⁵
-5.4x10⁴
-5.1x10⁴
-4.8x10⁴
-4.5x10⁴
-4.2x10⁴
2.7x10⁷
3.6x10⁷
4.5x10⁷
5.4x10⁷
1.2x10⁷
1.5x10⁷
1.8x10⁷
2.1x10⁷
2.4x10⁷
-200
-160
-120
-80
-800
-700
-600
-500
-400
0.0 0.5 1.0 1.560
65
70
75
80
30
35
40
45
ε/
ε/ε//
tan
δ
tan
δε//
σ ac
σ ac
79K
290K
Mg content
Fig. 8. The summary of e0 , e00 , tand, and rac measurements versus Mg content inCu0.5Tl0.5Ba2Ca2�yMgyCu0.5Zn2.5O10�d superconductors.
186 M. Mumtaz, N.A. Khan / Physica C 469 (2009) 182–187
Mg concentration in Cu0.5Tl0.5Ba2Ca2�yMgyCu0.5Zn2.5O10�d super-conductor at temperatures of 79 and 290 K and attains saturationat certain lower frequencies. A maximum increase is observed inthe samples doped with Mg concentration of y = 1.0 and in thesesamples a maximum decrease of c-axis length is observed. At10 KHz the value of rac increases from 29 to 48 (1/X-cm) withthe increase of Mg doping at room temperature (290 K) and its va-lue is further increased from 63 to 83 (1/X-cm) at lower tempera-ture of 79 K, Fig. 7. An increase in rac is observed with the decreaseof frequency and temperature but its values remain constant be-yond 2 MHz. At such frequencies the time constant of the appliedsignal becomes shorter than the time constant of dipolarpolarization.
The values of e0 and e00 observed in Cu0.5Tl0.5Ba2Ca2�yMgyCu0.5
Zn2.5O10�d (y = 0, 0.5, 1.0, 1.5) are much less than those observedin Tl2Ba2Ca2Cu3Ox (Tl-2223) [17] and Tl2Ba2Ca1Cu2Ox (Tl-2212)[17] superconductors. The values of the dielectric constants ob-served in Cu0.5Tl0.5Ba2Ca2�yMgyCu0.5Zn2.5O10�d samples are evenmuch smaller than those values observed in Nd-doped Bi2Ba2-Nd1.6Ce0.4Cu3O10�d and Bi–Pb–Sr–Ca–Cu–O superconductors[18,19]. Significant difference in the values of e 0 and e 00 is arisingfrom the larger difference in the thickness of charge reservoir layerblocks. The thickness of charge reservoir layer block (Tl2Ba2O5�d) ofdoubled thallium layered compound is almost double than thethickness of TlBa2O4�d charge reservoir layer of single layered thal-lium compound. Moreover the (Cu0.5Tl0.5)Ba2O4�d charge reservoirlayer in our Cu0.5Tl0.5Ba2Ca2�yMgyCu0.5Zn2.5O10�d (y = 0, 0.5, 1.0,1.5) is more conducting, where as Tl2Ba2O5�d charge reservoir layerin Tl-2223 and Tl-2212 is insulating [17]. The former supplies morecarriers to the conducting CuO2 planes compared to the totallyinsulating Tl2Ba2O5�d charge reservoir layers. Naturally lower val-ues of capacitance are observed in Cu0.5Tl0.5Ba2Ca2�yMgyCu0.5
Zn2.5O10�d (y = 0, 0.5, 1.0, 1.5) samples as compared to Tl-2223and Tl-2212 samples, consequently higher conductance is ob-served in our samples as compared to doubled layered thallium
based superconductors. If we carefully look in to these studiescarried out by R.K. Nkum et al. [19] in the In-dopedBi1.84Pb0.35Sr1.91Ca2.03Cu3.06InxOy samples, it could be seen thatdielectric constant increases with enhanced In doping, which sup-press the mobile carriers in the CuO2 planes. From here, we can in-fer that when the number of mobile carriers available for dipolarpolarization is suppressed then the dielectric constant is enhanced.The decreased dielectric constant in Cu0.5Tl0.5Ba2Ca2�yMgyCu0.5-Zn2.5O10�d (y = 0, 0.5, 1.0, 1.5) samples is most likely direct conse-quence of enhanced density of carriers in the CuO2 planes. Theseobservations are also consistent with previous studies [1–5] ofconductivity and magnetic measurements carried out on thesesamples; where we argued that enhanced superconductingproperties were arising from enhanced carrier’s density in theCuO2 planes. The increased carrier’s density in CuO2 planes isaccomplished by extremely higher doping efficiency of (Cu0.5Tl0.5)-Ba2O4�d charge reservoir layer, which is brought about by ratios ofCu/Tl atoms. The summary of e0, e 00, tand, and rac measurementsversus Mg content in Cu0.5Tl0.5Ba2Ca2�yMgyCu0.5Zn2.5O10�d super-conductors is shown in Fig. 8. In Bi-2212, Bi-2223, Tl-2223 andTl-2212 compounds, the M2Ba2O5�d (M = Bi, Tl) charge reservoirlayers contain trivalent insulating elements [17–19]. These triva-lent Bi+3 and Tl+3 may localize the carriers at their sites and cansuppress their flow to the conducting CuO2 planes. Contrary to
M. Mumtaz, N.A. Khan / Physica C 469 (2009) 182–187 187
these compounds, our Cu0.5Tl0.5Ba2Ca2�yMgyCu0.5Zn2.5O10�d (y = 0,0.5, 1.0, 1.5) superconductor with (Cu0.5Tl0.5)Ba2O4�d charge reser-voir layer having partially insulating/conducting character mostlikely enhances the doping efficiency of carriers to CuO2/ZnO2
planes.
4. Conclusion
It is concluded that the dielectric constants (e0 and e00), dielectricloss (tand) and ac-conductivity (rac) of Cu0.5Tl0.5Ba2Ca2�yMgyCu0.5
Zn2.5O10�d (y = 0, 0.5, 1.0, 1.5) samples are strongly dependent ontemperature and external applied ac-field frequency. At 10 KHz,the real and the imaginary parts of the dielectric constants (e0
and e00) and ac-conductivity (rac) are found to increase in Cu0.5-Tl0.5Ba2Ca2�yMgyCu0.5Zn2.5O10�d (y = 0, 0.5, 1.0, 1.5) samples withthe increase of Mg doping, which consequently decreases the losstand both at room temperature (290 K) and 79 K. The dielectricconstants e0 and e00 are most likely arising from the dielectric polar-ization originating from the displacement of mobile electroniccharges present in the conducting CuO2 planes from the equilib-rium position relative to Cu0.5Tl0.5Ba2O4�d charge reservoir layers.The increased values of e0 and e00 in Cu0.5Tl0.5Ba2Ca2�y-Mg
yCu0.5Zn2.5O10�d (y = 0, 0.5, 1.0, 1.5) samples can be viewed in
term of enhanced carrier concentration in the conducting CuO2
planes arising from decreased c-axis length with increased Mgdoping. At higher frequencies (10 MHz) the dielectric polarizationarising from the displacement of mobile carriers in CuO2 planesrelative to Cu0.5Tl0.5Ba2O4�d charge reservoir becomes negligibleand the dielectric constants approach to negligible values. At suchfrequencies the characteristic time of dipolar polarization (0.67 ls)becomes longer than the time constant of applied signal. Thesestudies have shown that the role of mobile carriers in conductingCuO2/ZnO2 planes is primary in determining certain dielectriccharacteristics of the material and their dielectric constants (e0
and e00) arising from dipolar polarization of carriers.
References
[1] H. Ihara, A Iyo, K. Tanaka, K. Tokiwa, K. Ishida, N. Terada, M. Tokumoto, Y.Sekita, T. Tsukamoto, T. Watanabe, M. Umeda, Physica C 282–287 (1997) 1973.
[2] H. Ihara, K. Tokiwa, H. Ozawa, M. Hirabyashi, H. Matuhata, A. Negishi, Y.S. Song,Jpn. J. Appl. Phys. 33 (1994) L308.
[3] Nawazish A. Khan, A.A. Khurram, Asim Javed, Physica C 422 (2005) 9.
[4] Nawazish A. Khan, M. Mumtaz, M.M. Ahadian, Azam Iraji-zad, Physica C 449(2007) 47.
[5] A.A. Khurram, M. Mumtaz, Nawazish A. Khan, M.M. Ahadian, Azam Iraji-zad,Supercond. Sci. Technol. 20 (2007) 742.
[6] Nawazish A. Khan, A.A. Khurram, Appl. Phys. Lett. 86 (2005) 152502.[7] Nawazish A. Khan, A.A. Khurram, Mushtaq Ahmed, J. Supercond. Magn. 20
(2007) 343.[8] A.A. Khurram, Nawazish A. Khan, M.M. Ahadian, Azam Iraji-zad, Physica C 468
(2008) 405–410.[9] Nawazish A. Khan, Najmul Hassan, Physica C 466 (2007) 106.
[10] Nawazish A. Khan, Shahid Nawaz, IEEE Trans. Appl. Supercond. 16 (2006) 2.[11] Nawazish A. Khan, M. Irfan, Shahid Nawaz, Physica C 455 (2007) 63.[12] Nawazish A. Khan, M. Irfan, J. Alloys Compd. 432 (2007) 49.[13] Nawazish A. Khan, Asim Javaid, A.A. Khurram, Naghma Haider, Physica C 425
(2005) 90.[14] Nawazish A. Khan, M. Mumtaz, Matter Lett. 62 (2008) 659.[15] M. Mumtaz, Nawazish A. Khan, J. Appl. Phys. 103 (2008) 083913.[16] L.L. Hench, J.L. West, Principles of Electronic Ceramics, Willey, New York, 1990.[17] S. Cavdar, H. Koralay, N. Tugluoglu, A. Gunen, Supercond. Sci. Technol. 18
(2005) 1204.[18] X. Xu, Z. Jiao, M. Fu, L. Feng, K. Xu, R. Zuo, X. Chen, Physica C 417 (2005)
166.[19] R.K. Nkum, M.O. Gyekye, F. Boakye, Solid State Commun. 122 (2002)
569.[20] J. Konopka, R. Jose, M. Wolcyrz, Physica C 435 (2006) 53.[21] G.P. Mazzara, S. Skirius, G. Cao, G. Chern, R.J. Clark, J.E. Crow, H. Mathias, J.W. O’
Reilly, L.R. Testardi, Phys. Rev. B 47 (1993) 8119.[22] C.M. Rey, H. Mathias, L.R. Testardi, S. Skirius, Phys. Rev. B 45 (1992)
10639.[23] D. Reagor, E. Ahrens, S.-W. Cheong, A. Migliori, Z. Fisk, Phys. Rev. Lett. 62
(1989) 2048.[24] G. Cao, J.W. O’ Reilly, J.E. Crow, L.R. Testardi, Phys. Rev. B 47 (1993) 11510.[25] L.R. Testardi, W.G. Moulton, H. Mathias, H.K. Ng, C.M. Rey, Phys. Rev. B 37
(1988) 2324.[26] J.W. Chen, J.C. Wang, Y.F. Chen, Physica C 289 (1997) 131.[27] J.B. Shi, Physica C 305 (1998) 35.[28] M. Ershov, H.C. Liu, L. Li, M. Buchanan, Z.R. Wasileweki, V. Ryzhii, Appl. Phys.
Lett. 70 (1997) 1828.[29] N.C. Chen, P.Y. Wang, J.F. Chen, Appl. Phys. Lett. 72 (1998) 1081.[30] J. Allison, V.R. Dave, Electron. Lett. 7 (1971) 706.[31] F. Lemmi, N.M. Johnson, Appl. Phys. Lett. 74 (1999) 251.[32] B.S. Doyle, J. Phys. D 19 (1986) 1129.[33] M. Ilyas, M. Zulfequar, M. Husain, Physica B 271 (1999) 125.[34] A.G.U. Perera, W.Z. Shen, M. Ershov, H.C. Liu, M. Buchanan, W.J. Schaff, Appl.
Phys. Lett. 74 (1999) 3167.[35] M. Ershov, H.C. Liu, L. Li, M. Buchanan, Z.R. Wasileweki, A.K. Jonscjer, IEEE
Trans. Electron. Dev. 45 (1998) 2196.[36] G.B. Parravicini, A. Stella, M.C. Ungureanu, R. Kofman, Appl. Phys. Lett. 85
(2004) 302.[37] N.A. Penin, Semiconductors 30 (1996) 340.[38] A.K. Jonscher, J. Chem. Soc. 82 (1986) 75.[39] M. Beale, P. Mackay, Philos. Mag. B 65 (1992) 47.[40] J.-C. M’Peko, Appl. Phys. Lett. 71 (1997) 3730.[41] J. Bisquert, G. Garcia-Belmonte, A. Pitarch, H.J. Bolink, Chem. Phys. Lett. 422
(2006) 184.