Embed Size (px)
Citation preview
ELSEVIER Soil & Tillage Research 30 (1994) 3-17
Soil &
Dicamba mobility in conventionally tilled and non-tilled soil
J o n K . H a l l *'a, R a l p h O. M u m m a b
aDepartment of Agronomy, Pennsylvania State University, University Park, PA 16802, USA bDepartment of Entomology, Pennsylvania State University, University Park, PA 16802, USA
(Accepted 11 May 1992)
Abstract
Root zone leaching losses ofdicamba (3,6-dichloro-2-methoxybenzoic acid) were eval- uated over 5 years (1984-1988) under conventional tillage (CT) and no-tillage (NT) corn (Zea mays L.) management from postemergence application date in June of each year through December. Pan lysimeters embedded 1.2 m deep were used to collect root zone percolates. Dicamba losses in runoff water were evaluated through September. Land slope ranged from 3 to 5% within tillage areas. Dicamba was applied at the recommended rate (0.56 kg a.i. ha- ~ ) on Hagerstown silty clay loam (Typic Hapludalf). Leaching events, sample numbers and leachate volumes were greater under NT than CT management. In general, dicamba concentrations in leachates were greater under NT conditions, and di- camba residues were detected in leachates from both tillage systems as late as 6 months after application during several seasons. Entrapment and translocation within the micro- pore matrix of this well-drained soil were postulated as being critical factors involved in the atypical residence time and late season 'breakthrough' of this anionic, low persistence herbicide. Mean areal leaching losses ranged from 0 to 3.3 g ha -~ (CT) and 2.2 to 31.2 g ha-~ (NT), accounting for maximum losses of 0.6% (CT) and 5.7% (NT) of the amount applied. More runoffwas recorded from the CT area and dicamba losses ranged from 0.01 to 4.6 g ha -1 (CT) and from less than 0.01 to 0.7 g ha -~ (NT). Maximum runofflosses were 0.8% and 0.1% of the rate applied for CT and NT, respectively. Yearly differences in the magnitude of losses by each transport process were strongly related to rainfall distri- bution and number of leaching and runoff events proximal to the spray date of dicamba.
Key words." Dicamba; Herbicide; Leaching; Typic Hapludalf; Zea mays
*Corresponding author.
0167-1987/94/$07.00 © 1994 Elsevier Science B.V. All rights reserved SSDI 0167-1987 ( 93 ) 09000-J
4 J.K. Hall, R.O. Mumma ~Soil& TillageResearch 30 (1994) 3-17
1. Introduction
Dicamba (3,6-dichloro-2-methoxybenzoic acid) is used to control many an- nual broadleaf weeds or provide growth suppression of many perennial broadleaf weeds commonly found in corn (Zea mays L.). It may be applied as an early postemergence spray in all tillage systems. Based upon the reactivity of dicamba in soils, its mobility potential by leaching and runoff would be predictably high. Dicamba is anionic in character (Burnside and Lavy, 1966; Grover and Smith, 1974); Freundlich constants (Kf) for sorption ranged from 0 to 0.08 in Ap-hori- zon samples of five Canadian soils ranging from a sandy loam to a heavy clay (Grover and Smith, 1974 ); similar results (Kf= 0) were obtained for Ap- and Bt- horizon samples of a Hagerstown clay loam (Murray and Hall, 1989); studies using soil thin layer chromatography have shown dicamba to be highly diffusive in Hagerstown silty clay loam and Ca-montmorillonite and kaolinite (Helling, 1971 ). Harris (1967) showed that dicamba mobility was similar in Hagerstown silty clay loam and Lakeland sandy loam using soil columns.
On the other hand, the potential for dicamba 'loading' of soil percolates would be dependent upon its rate of detoxification and dissipation in soil. Smith (1973 ) showed that over 80% of dicamba had dissipated in 8-14 days from three soils at field moisture capacity when temperatures ranged from 15 to 20°C. Dicamba dissipated in 9-16 weeks when sprayed on grassland soils of Texas at 0.56 kg ha- 1 (Scifres and Allen, 1973 ). Dissipation rates were generally greater on heavy tex- tured soils when moisture and temperature conditions were optimized and rates were greater in Ap-horizon than in Bt-horizon samples (Burnside and Lavy, 1966; Hahn et al., 1969). These researchers attributed the rapid dissipation ofdicamba to microbial transformations. Recently, Krueger et al. (1989) isolated from soil with a past history of repeated dicamba applications, several strains of bacteria which were capable of using this herbicide as a sole C source. Alton and Stritzke ( 1973 ) calculated an average half-life of 25 days for dicamba in three soils. Krue- ger et al. ( 1991 ) reported a half-life of 31 days in a typical midwestern agricul- tural soil under aerobic conditions; after the soil was made anaerobic at 30 days, the half-life of dicamba was 58 days. The primary metabolite of dicamba in soils is 3, 6-dichlorosalicylic acid (Smith, 1974; Krueger et al., 1991 ).
Despite the influence that rapid dissipation of dicamba may have on its mobil- ity in soils or translocation from site of application, few studies have examined the transport potential of this herbicide under field conditions. The objective of this study was to evaluate the magnitude of dicamba loss by leaching and runoff following recommended, postemergence application to conventional-till and no- till planted corn.
2. Materials and methods
Conventional tillage (CT) and no-tillage (NT) plot areas (0.3 ha) were estab- lished on a Hagerstown silty clay loam (Typic Hapludalf) in Centre County,
J.K. Hall, R.O, Mumma ~Soil & Tillage Research 30 (1994) 3-17 5
Pennsylvania. The CT area was moldboard plowed, disked and harrowed during the spring of each year. The only soil disturbance within the NT area resulted from the slit created by the fluted coulter on the NT planter. The Hagerstown soil, developed from limestone residuum, is a deep, well-drained soil of moderate permeability and high available water capacity (Braker, 1981 ). The Ap-horizon possesses a fine, granular structure, while the Bt-horizon is characterized by a sub-angular blocky to blocky structure. Soil pH of representative fractions of the Ap (0-15 cm) and Bt (45-60 cm) horizons on the experimental site were 6.7 and 5.5, respectively. Organic C content was 1.2% and 0.2% and CEC (cation exchange capacity) was 7.5 cmol kg- 1 and 8.2 cmol kg- t, respectively.
Soil test prescribed fertilizer was applied to both areas prior to tilling (CT) and corn planting each year. Dicamba was applied postemergence at the recom- mended rate of 0.56 kg a.i. ha -~. Annual applications were made when the corn was in the four to five leaf stage which varied from June 2 to June 22 during the time span of the study (1984-1988).
Within each tillage area, three soil pits were excavated and framed to provide safe access to three pan lysimeters (PL) in each pit. These water sampling devices were embedded in the 'soil wall', perpendicular to the corn rows, at a depth of 1.2 m. Percolates collected each year from the nine PL in each tillage area were mon- itored for dicamba residues. Collection periods extended from application date to 31 December. Dicamba quantities leached were calculated from its concentra- tion in water and corresponding percolate volume. These data were used to cal- culate mean areal leaching discharge and percentage loss of dicamba within the corn root zone of each tillage area. A more comprehensive discussion of the study area, including PL placement, soil and crop management and sampling proce- dures is presented elsewhere (Hall et al., 1989 ).
In order to evaluate dicamba losses in runoff, the experimental site was sur- veyed to establish the natural drainage 'outlet' of each tillage area and soil mounds were constructed as barriers around the periphery of and between each tillage area. Land slope, calculated from the developed topographic map, ranged from 3.0 to 4.0% within the CT area and from 3.5 to 5.0% within the NT area. A flume and automated recording and sampling equipment were installed in 1985 at each outlet to facilitate collection of runoff water during erosive rainfall. Dicamba concentrations in runoff water and total runoff volume were used to calculate total herbicide losses during the growing season, which for sampling purposes extended from application date to 30 September.
Water samples were analyzed for dicamba residues using a slightly modified procedure of Arjmand et al., 1988. Amino (NH2) solid phase extraction (spe) columns were positioned on a vacuum manifold and conditioned by passing three 3-ml aliquots of 1.0 M acetic acid, followed by 3 ml of deionized water through each column, taking care that the columns never went to dryness. If necessary, leachate samples were vacuum filtered through a 0.45/tm nylon membrane filter with a glass micro fiber prefilter (Whatman GF-D). A 30-50 ml aliquot of each leachate sample was suction-filtered through the spe column at a drip rate of 5-7 ml m i n - 1. The columns were dried for 20 min by drawing air through them using
6 J.K. Hall, R.O. Mumma/ Soil & Tillage Research 30 (1994) 3-17
the vacuum manifold. Dicamba was eluted from each column with four 0.5-ml aliquots of 0.1 M dibasic potassium phosphate. The eluate was adjusted to 2.0 ml with deionized water and subsequently analyzed by high-performance liquid chromatography (Arjmand et al., 1988 ). Two points need to be emphasized with regard to proper functioning of the spe columns. Since the anion concentration in leachates will compete with dicamba for column exchange sites and elate sorbed dicamba, the size of the sample aliquot used depends on the nature of the water collected from each field site. Previous work with this method showed that 100- ml aliquots of leachates collected from sandy-textured soils caused no problems; however, lower sample aliquots were an absolute requirement for leachates col- lected from the limestone derived, fine-textured soil of this study to maintain functional integrity of the columns. In a related sense, spe columns seemingly vary between lots; it is important, therefore, to use dicamba-spiked, field-col- lected water to determine the tolerances of column sets.
Dicamba detection sensitivity was 2.0 #g l- 1 and standard recoveries from water ranged from 61 to 146% (SD = 19) within a concentration range of 2 to 2000 #g l-1. Percent recoveries of 61-63%, and 146% were recorded for four standard samples; consequently, these recoveries were 'outliers' in a narrower extraction range. Over two-thirds of the total standard 'spikes' fell within recovery limits of 75-110%. Dicamba concentrations in leachates were not corrected for recovery.
Compilation of means, standard error of means and mean separation between tillage systems (two sample 't'-test) were determined on leaching data using the programs of the Statistical Analysis Systems Institute, Inc., Cary, North Carolina and Minitab Inc., State College, Pennsylvania as recommended by the Statistical Consulting Center of the University.
3. Results and discussion
3.1. Leaching summary and dicamba concentrations and amounts in leachates
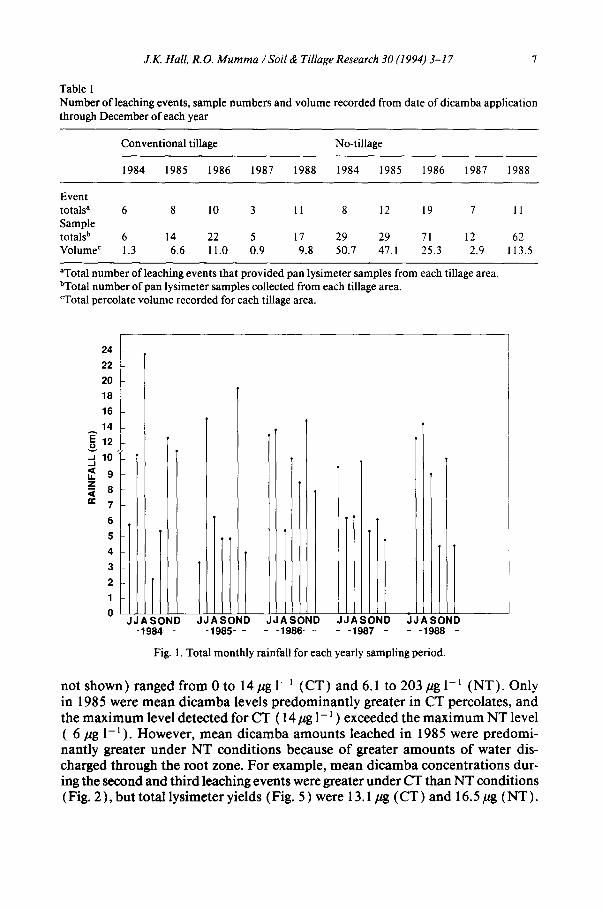
The total number of leaching events and samples collected, and total leachate volumes were greater each year under NT compared with CT conditions (Table 1 ). Number of samples collected and total leachate discharged were not predict- able based on the amount of precipitation, particularly under NT management (Fig. 1 ). For example, 47.1 1 of leachate and 29 samples were collected in 1985 (NT) from 58 cm of rain, while 113.5 l and 62 samples were collected in 1988 from 55 cm of rain. Moreover, 74 cm of rain in 1986 yielded 71 samples and 25.3 1 of percolate from the NT area. Sample output based upon measured precipita- tion was more predictable under CT management except for 1984 conditions where 71 cm of rain yielded 1.3 1 in six samples for the 7 month period. Despite greater percolate volumes collected under NT management, dilution of dicamba residues was not strongly evident compared with CT management. In general, both greater mean dicamba concentrations and amounts were detected in NT percolates in most seasons (Figs. 2-7 ). Maximum concentrations detected (data
J.K. Hall, R. O. Mumma / Soil & Tillage Research 30 (1994) 3-17 7
Table 1 Number of leaching events, sample numbers and volume recorded from date of dicamba application through December of each year
Conventional tillage No-tillage
1984 1985 1986 1987 1988 1984 1985 1986 1987 1988
Event totals a 6 8 10 3 11 8 12 19 7 11 Sample totals b 6 14 22 5 17 29 29 71 12 62 Volume c 1.3 6.6 11.0 0.9 9.8 50.7 47.1 25.3 2.9 113.5
aTotal number of leaching events that provided pan lysimeter samples from each tillage area. bTotal number of pan lysimeter samples collected from each tillage area. ¢Total percolate volume recorded for each tillage area.
24
22 20 18
16
14
12 i ~ 10 ..1
~ 9 U. Z ~ 6 ee 7
I JJASOND
- - 1984 - -
1 JJASOND
- - 1985 - -
JJASq pND JJASOND ~JJASq tND - 1986 . . . . 1987 - - - 1988 - -
Fig. 1. Total monthly rainfall for each yearly sampling period.
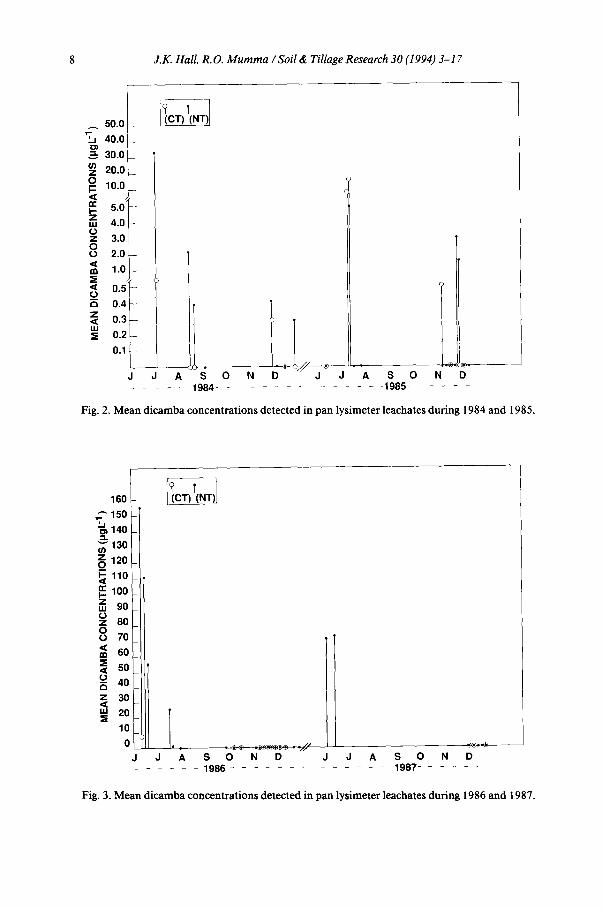
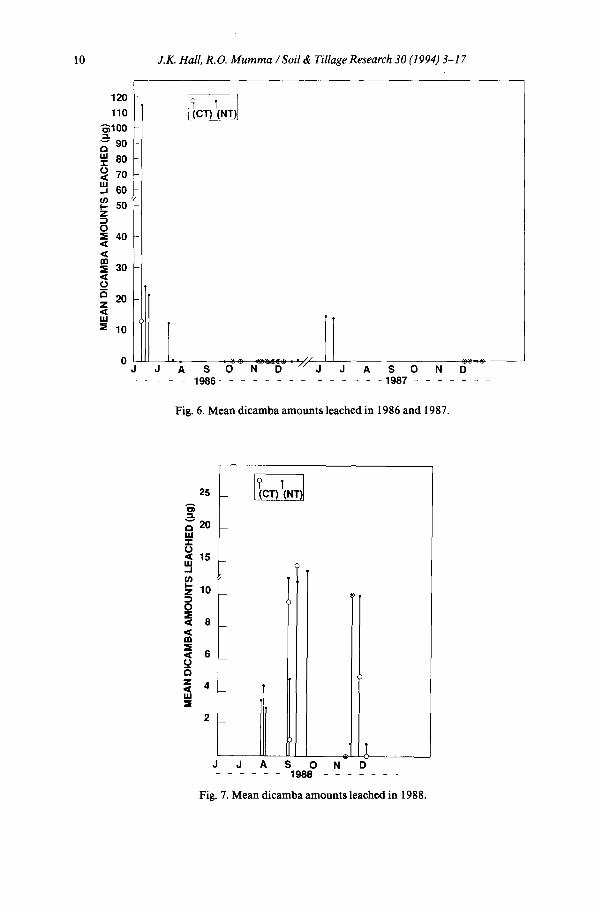
not shown) ranged from 0 to 14/tg 1-1 (CT) and 6.1 to 203/tg 1-1 (NT). Only in 1985 were mean dicamba levels predominantly greater in CT percolates, and the maximum level detected for CT ( 14 #g 1- ~ ) exceeded the maximum NT level ( 6 gg 1-1). However, mean dicamba amounts leached in 1985 were predomi- nantly greater under NT conditions because of greater amounts of water dis- charged through the root zone. For example, mean dicamba concentrations dur- ing the second and third leaching events were greater under CT than NT conditions (Fig. 2 ), but total lysimeter yields (Fig. 5 ) were 13.1/tg (CT) and 16.5 pg (NT).
8 J.K. Hall, R.O. Mumma ~Soil & TillageResearch 30 (1994) 3-17
50.0
~'- 40.0 z~
30.0
20.0
10.0 ,,,¢ t r 5.0; I-- 2: uJ 4.0
2: 3.0 0 o 2.0
m 1.0
0.5'
a 0.4 z ,,¢ 0.3 U.I
0.2
0.1
J A S O N J A S O D J N D . . . . . 1984 . . . . . . . . . . . . . 1985 . . . . .
Fig. 2, Mean dicamba concentrations detected in pan lysimeter leachates during 1984 and 1985,
160
150
~ 1 4 0
~" 130
2:120 O ~ 110
100
9o
z 80 O 0 70
m 60
~ 5o ~ 4O a z 3O ~ 20
10 0 ~ - -
J J A S O N D J J A S O N D . . . . . . 1986 . . . . . . . . . . . . . . 1987 . . . . . . .
Fig. 3. Mean dicamba concentrations detected in pan lysimeter leachates during 1986 and 1987.
J.K. Hall, R. O. Mum ma /Soi l & Tillage Research 30 (1994) 3-17 9
50
40 , , 30
u) 20 Z _o 10 p -
I'-- z w 4 o z 0 o < 3 I11
_.9. 2 a z
i (CT)(N'I ')I
f
J A S O N D . . . . . . 1988 . . . . .
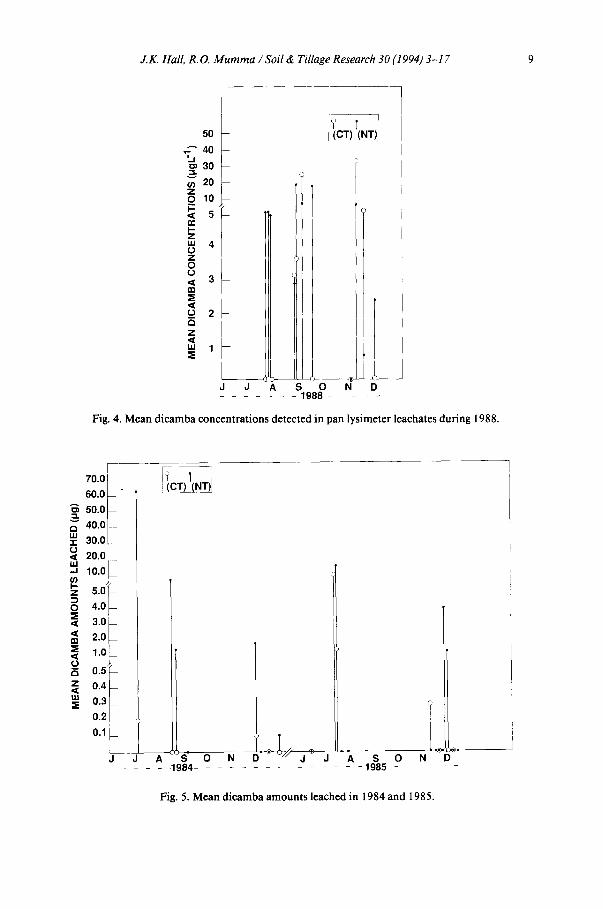
Fig. 4. Mean dicamba concentrat ions detected in pan lysimeter leachates during 1988.
70.01
60.0
"~ 50.0 ,,.1
~" 40.0
30.0 0 <[ 20.0 U J
-J 10.0
I - . z 5 . 0 '
O 4.0
,,~ 3.0
< 2.0
=E 1.0 O GI Z
tl.t =E
m
0.5 7
0.4
0.3
0.2
J
!(CT) (NT)J
A S O N D J J A S O N D - - 1 9 8 4 . . . . . . . . . . . . . 1 9 8 5 . . . . .
Fig. 5. Mean dicamba amounts leached in 1984 and 1985.
10 J.K. Hall, R.O. Mumma /Soil & Tillage Research 30 (1994) 3-17
120
110
"~100
N 90 ~: 80 ,~ 70
N 6o
~- so Z
0 ~ 40
ii1 ~ 30
" 20 z
~ 10
J J A S O N D "/~/" J J A S O N D . . . . . 1986 . . . . . . . . . . . . . . 1987 . . . . . . .
Fig. 6. M e a n d i c a m b a a m o u n t s leached in 1986 and 1987.
25 A
v a 20 _ MJ
o '~ 15 I , l . I . J
z 10
0
< 8
m
< 6 _~ -
~m 4
2
J J A S O N D . . . . . . 1988 . . . . . . .
Fig. 7. M e a n d i camba a m o u n t s leached in 1988.
J.K. Hall, R, O. Mum ma /Soil & Tillage Research 30 (1994) 3-17 11
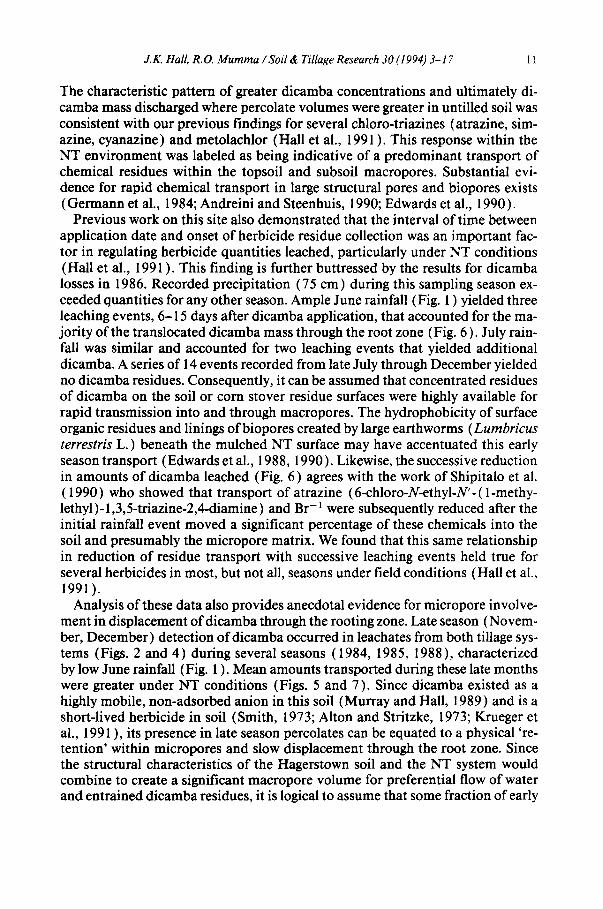
The characteristic pattern of greater dicamba concentrations and ultimately di- camba mass discharged where percolate volumes were greater in untilled soil was consistent with our previous findings for several chloro-triazines (atrazine, sim- azine, cyanazine) and metolachlor (Hall et al., 1991 ). This response within the NT environment was labeled as being indicative of a predominant transport of chemical residues within the topsoil and subsoil macropores. Substantial evi- dence for rapid chemical transport in large structural pores and biopores exists (Germann et al., 1984; Andreini and Steenhuis, 1990; Edwards et al., 1990).
Previous work on this site also demonstrated that the interval of time between application date and onset of herbicide residue collection was an important fac- tor in regulating herbicide quantities leached, particularly under NT conditions (Hall et al., 1991 ). This finding is further buttressed by the results for dicamba losses in 1986. Recorded precipitation (75 cm) during this sampling season ex- ceeded quantities for any other season. Ample June rainfall (Fig. 1 ) yielded three leaching events, 6-15 days after dicamba application, that accounted for the ma- jority of the translocated dicamba mass through the root zone (Fig. 6 ). July rain- fall was similar and accounted for two leaching events that yielded additional dicamba. A series of 14 events recorded from late July through December yielded no dicamba residues. Consequently, it can be assumed that concentrated residues of dicamba on the soil or corn stover residue surfaces were highly available for rapid transmission into and through macropores. The hydrophobicity of surface organic residues and linings ofbiopores created by large earthworms (Lurnbricus terrestris L. ) beneath the mulched NT surface may have accentuated this early season transport (Edwards et al., 1988, 1990). Likewise, the successive reduction in amounts of dicamba leached (Fig. 6 ) agrees with the work of Shipitalo et al. (1990) who showed that transport of atrazine (6-chloro-N-ethyl-N'-( l-methy- lethyl)- 1,3,5-triazine-2,4-diamine) and Br- 1 were subsequently reduced after the initial rainfall event moved a significant percentage of these chemicals into the soil and presumably the micropore matrix. We found that this same relationship in reduction of residue transport with successive leaching events held true for several herbicides in most, but not all, seasons under field conditions (Hall et al., 1991).
Analysis of these data also provides anecdotal evidence for micropore involve- ment in displacement of dicamba through the rooting zone. Late season (Novem- ber, December) detection ofdicamba occurred in leachates from both tillage sys- tems (Figs. 2 and 4) during several seasons (1984, 1985, 1988), characterized by low June rainfall (Fig. 1 ). Mean amounts transported during these late months were greater under NT conditions (Figs. 5 and 7). Since dicamba existed as a highly mobile, non-adsorbed anion in this soil (Murray and Hall, 1989 ) and is a short-lived herbicide in soil (Smith, 1973; Alton and Stritzke, 1973; Krueger et al., 1991 ), its presence in late season percolates can be equated to a physical 're- tention' within micropores and slow displacement through the root zone. Since the structural characteristics of the Hagerstown soil and the NT system would combine to create a significant macropore volume for preferential flow of water and entrained dicamba residues, it is logical to assume that some fraction of early
12 J.K. Hall, R.O. Mumrna / Soil & Tillage Research 30 (I 994) 3-17
season dicamba residues equilibrated with micropore water within aggregates and peds directly or during macropore flow to account for this late season 'carryover'. Lateral movement of water and Br- from macropores into the soil matrix was reported by Germann et al., 1984. Also, once the dicamba was translocated out of the biological zone and into the subsoil, detoxification to its primary metabo- lite would be reduced (Hahn et al., 1969; Krueger et al., 1991 ). These conditions would enhance its longevity and account for its 5-6 month residence time. On the other hand, the inherently greater soil moisture content typically found be- neath the mulched, untilled surface will not only enhance chemical equilibration and transport of dicamba within micropores, but also foster diffusive 'exchange' of unbound herbicide molecules to macropores. Consequently, increased resi- dence time in this soil and the higher amounts discharged under NT management at the end of the year could have resulted from micropore water displacement and from transport in macropores following 'exchange' to this pore network.
Other researchers (Scifres and Allen, 1973) reported dicamba recovery from depths of 1.2-1.5 m in several Texas soils but concluded that dicamba residues would not persist in soil through the growing season from spring applications at 0.56 kg ha -~ or less. Krueger et al. (1991) also shared that their evidence for anaerobic metabolism of dicamba would have little significance in agricultural soils since rapid aerobic transformation of this herbicide would limit its translo- cation to anaerobic zones. Conversely, our data show that dicamba can persist in soil beyond the growing season at the 0.56 kg ha- ~ rate of application and as a result a limited fraction may reach shallow ground water.
3.2. Areal and percent losses o f dicamba in leachates
A comparative summary of leaching losses between tillage systems is presented in Table 2. The high standard errors recorded for most data categories can be attributed to soil spatial variability and the limited number of observations be- tween PL sampling points. These characteristics placed limitations on the degree of statistical significance achieved for mean categories between tillage areas. This fact was particularly evident in 1984 where mean concentrations, total amounts and areal losses on a mass and percent basis were substantially greater in NT than in CT but confidence intervals in most cases were less than 79% (P< 0.21 ) which was the lower limit used for comparison among these data. However, differences in magnitude between tillage systems in 1986 were significant at the 99% confi- dence interval (P=0.01). Likewise, mass quantities and percentage of applied dicamba transported in 1988 under NT compared with CT conditions would be expected to be different approximately 80% of the time if similar experimental and environmental conditions prevailed.
Collectively, these results indicated that greater quantities of dicamba are translocated through a non-tilled than moldboard-plowed soil profile in most sea- sons. Areal losses ranged from 2.2 to 31.2 g ha -~ (NT) compared with 0 to 3.3 g ha-~ (CT). Maximum areal losses within each tillage system were 5.6 and 0.6% of the dicamba rate applied. Under NT management, a greater percentage of the
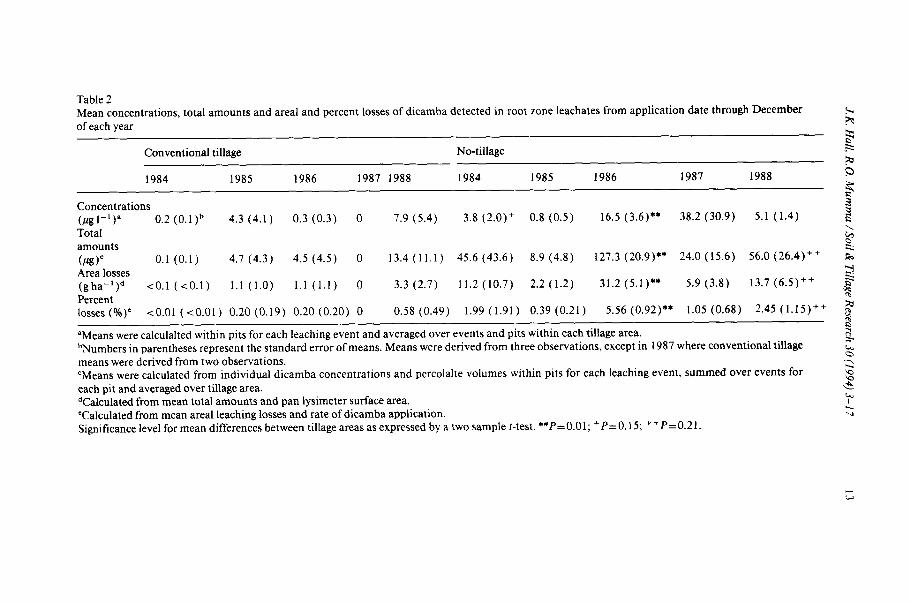
Table 2 Mean concentrations, total amounts and areal and percent losses of dicamba detected in root zone leachates from application date through December of each year
Conventional tillage No-tillage
1984 1985 1986 1987 1988 1984 1985 1986 1987 1988
Concentrations ( / tg l - I ) a 0.2 (0.1) b 4.3 (4.1) 0.3 (0.3) 0 7.9 (5.4) 3.8 (2.0) + 0.8 (0.5) 16.5 (3.6)** 38.2 (30.9) Total amounts (pg)C 0.1 (0.1) 4.7 (4.3) 4.5 (4.5) 0 13.4(11.1) 45.6 (43.6) 8.9(4.8) 127.3 (20.9)** 24.0 (15.6)
Area losses (gha-~) d < 0 . 1 ( < 0 . 1 ) 1.1 (1.0) 1.1 (1.1) 0 3.3(2.7) l l .2 (10.7) 2.2 (1.2) 31.2(5.1)** 5.9(3.8) Percent losses (%)e <0.01 (<0 .01) 0.20 (0.19) 0.20 (0.20) 0 0.58 (0.49) 1.99 (1.91) 0.39 (0.21) 5.56 (0.92)** 1.05 (0.68)
5.1 (1.4)
56.0 (26.4) ++
13.7 (6.5) ++
2.45 (1.15) ++
"Means were calculalted within pits for each leaching event and averaged over events and pits within each tillage area. bNumbers in parentheses represent the standard error of means. Means were derived from three observations, except in 1987 where conventional tillage means were derived from two observations. CMeans were calculated from individual dicamba concentrations and percolalte volumes within pits for each leaching event, summed over events for each pit and averaged over tillage area. dCalculated from mean total amounts and pan lysimeter surface area. ~Calculated from mean areal leaching losses and rate of dicamba application. Significance level for mean differences between tillage areas as expressed by a two sample t-test, **P=0.01; +P= 0.15; + +P= 0.21.
I
"-,4
14 J.K. Hall, R.O. Mumma / Soil & Tillage Research 30 (1994) 3-17
applied dicamba was leached in 1984 than in 1985 (Table 2) although percolate volumes were similar (Table 1 ). These differences emphasized again the spray date-leaching event interval as a critical factor in determining ultimate herbicide mass discharged beneath a rooting zone. This interval was 12 days in 1984 and 29 days in 1985. This timing factor is further exemplified by comparing leachate volumes recorded in 1986 and 1988. During the last year, water volume collected was approximately 4.5 times greater than in 1986 (Table 1 ), yet the percentage of applied dicamba leached was less than half of that recorded in 1986 (Table 2 ). Limited rainfall after dicamba application in 1988 provided conditions for entry of dicamba into the topsoil but the initial leachate discharge occurred 42 days following application. Dicamba 'breakthrough' occurred during three leaching events in late July under NT management, but not until late August and early September under CT management. If losses from both systems occurred within the macropore network, then these results would be expected since tillage disrup- tion would have a minimal effect on macropore continuity under NT compared with CT management. Delayed movement of dicamba through a friable, tilled surface when rainfall is reduced may foster a greater equilibria of sprayed chem- icals within granular aggregates. Consequently, the rate of transmission of herbi- cide residues in superfluous water through the root zone in this system would be limited by micropore-macropore transfer and the more discontinuous network of large voids due to tillage disruption. Displacement of 'entrapped' dicamba within and through subsoil micropores may have also accounted for these leached dicamba residues as speculated previously for the late season residue collections.
3.3. Runoff losses of dicamba
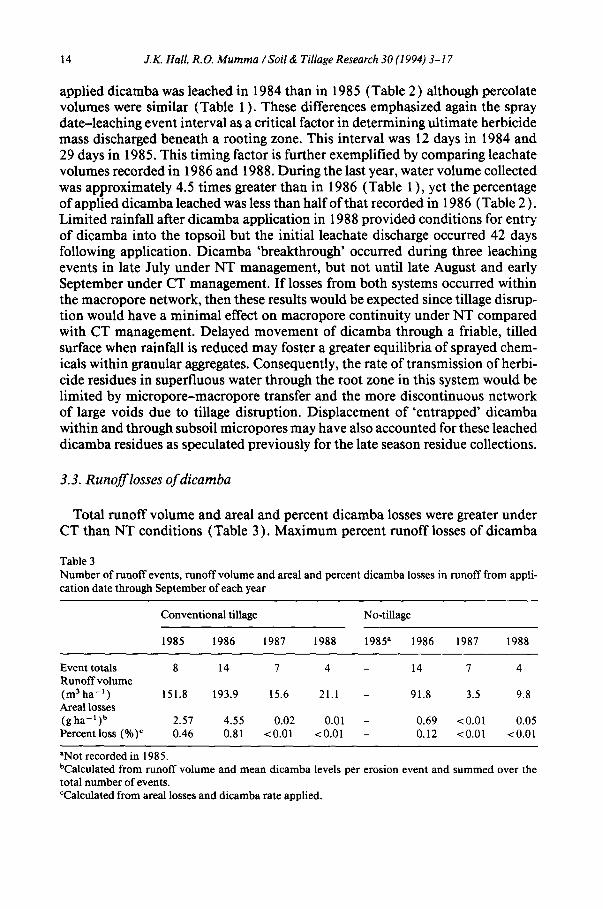
Total runoff volume and areal and percent dicamba losses were greater under CT than NT conditions (Table 3 ). Maximum percent runoff losses of dicamba
Table 3 Number of runoff events, runoff volume and areal and percent dicamba losses in runoff from appli- cation date through September of each year
Conventional tillage No-tillage
1985 1986 1987 1988 1985 a 1986 1987 1988
Event totals 8 14 7 4 - 14 7 4 Runoff volume (m3ha -~) 151.8 193.9 15.6 21.1 - 91.8 3.5 9.8 Areal losses (gha-~) b 2.57 4.55 0.02 0.01 - 0.69 <0.01 0.05 Percent loss (%)¢ 0.46 0.81 <0.01 <0.01 - 0.12 <0.01 <0.01
aNot recorded in 1985, bCalculated from runoff volume and mean dicamba levels per erosion event and summed over the total number of events. ¢Caleulated from areal losses and dicamba rate applied.
J.K. Hall, R. O. Mumma ~Soil& Tillage Research 30 (1994) 3-17 15
were 0.8% and 0.1% under CT and NT management, respectively, in 1986. Total mean losses (leaching plus runoff) under NT management ranged from 5.9 to 31.9 g ha- 1 ( 1986-1988 ). The percentage of total losses due to runoff were 0.1 - 2.2%. In comparison, total mean losses under CT management ranged from 0.02 to 5.7 g ha -1. Only in 1988 were runoff losses from CT (0.01 g ha -1 ) less than leaching losses (3.3 g ha- ~ ), accounting for CT surface losses (0.3%) more typi- cal of NT management. In contrast, the percent of total dicamba losses due to runoff on CT ranged from 70 to 100% in the other years. Consequently, on a deep, well-drained soil with a land slope of 3-5%, greater losses of dicamba can be expected in most seasons by leaching than by runoff under NT management. This conclusion is also consistent with results for other herbicides on this site (Hall et al., 1991 ).
The time interval between application of dicamba and leaching event onset, previously emphasized as being a critical factor in regulating dicamba 'loading' of leachates under NT conditions, also strongly regulated surface transport of dicamba as reported previously for other herbicides (Triplett et al., 1978; Hall et al., 1983). In 1986, total runofflosses of 4.55 and 0.69 g ha -l from CT and NT, respectively, resulted from six erosion events that occurred from June 5 to June 19 after dicamba application on June 3. Dicamba losses in runoff for individual storm events during this period ranged from 0.03 to 2.32 g ha-~ (CT) and from less than 0.01 to 0.32 g ha- t (NT). Losses by leaching were I. l g ha- t (CT) and 30.1 g ha-1 (NT) for the same period. If we assume that the rate of microbial detoxification is similar among these tillage practices, then more 'runoff-avail- able' dicamba was present in the CT system during the 17 day period following application. This point would support the earlier premise that sprayed dicamba may diffuse into micropores of aggregates in this more friable surface and mass transport in leachates would be limited by 'retention' in this small pore matrix, degree of residue attenuation by microbial transformation, rate of water displace- ment through micropores or rate of diffusive equilibration with macropores which would be more discontinuous in this system compared with NT. However, where only four runoffevents occurred in 1988 and the first event was recorded on July 27, 47 days after application, total dicamba discharged by runoff from both til- lage practices was markedly less than in 1986. Since 12.4 cm of rain followed application, prior to the initial runoff event, and more than one dicamba 'half- life' had elapsed, 'runoff-available' residues of this herbicide were of a lower mag- nitude and probably deeper within the topsoil of both tillage systems. This asser- tion does not explain the slightly greater runoff losses from NT compared with CT in 1988, but the fact that leaching losses were four times greater in NT than in CT emphasizes again that herbicide residue transfer between and through the pore network in the NT system is unique, especially since soil bulk densities and total porosity in continuous, NT cornland are substantially different compared with yearly tilled areas (Edwards et al., 1988 ).
16 J.K. Hall, R.O. Mumma /Soil & Tillage Research 30 (1994) 3-17
4. Conclusions
Recommended herbicide application rates in CT and NT corn production practices are designed to maximize yields and minimize contamination of water resources. However, 'tradc-offs' exist with each tillage practice. The NT-mulchcd surface markedly reduces runoff, but its undisturbed matrix promotes more leaching of herbicides, presumably by preferential macroporc flow as considera- ble evidence indicates. Conversely, the disrupted macroporc matrix in the CT surface limits herbicide leaching, but the lack of mulch predisposes the surface to more runoff. With respect to chemical mobility in soil, as measured by leaching and runoff transport, these variances in tillage system character arc consistent over time for herbicide compounds representing different herbicide classes, namely, chloro-triazines and substituted amides (Hall ct al., 1991 ) and now a substituted benzoic acid, dicamba. Quality and quantity assessments of herbicide mobility vary between transport processes, temporally, and between and within herbicide classes. However, in a broad sense, each tillage environment and ma- trix influenced these processes uniformly on an annual basis in this well-drained, Hagcrstown soil. Despite the dissimilar nature of these tillage practices, deter- mining the transport process that has the greatest impact on water quality is dif- ficult to assess since widely diverse opinions exist on which process may be more detrimental to water resources. In keeping with mandates to define best manage- ment practices for herbicide use in agricultural production, alternatives and com- promise practices should be tested to blend the best characteristics of these tillage systems in reducing chemical mobility and maintaining yield standards in con- tinuous and rotational corn production systems.
Acknowledgments
This research was supported by funds from the Northeast Region of the Na- tional Pesticide Impact Assessment Program (NAPIAP). The authors arc grate- ful to Maricllcn Pfcil for her expertise in method modification and analysis of samples.
References
Alton, J.D. and Stritzke, J.F., 1973. Degradation of dicamba, picloram, and four phenoxy herbicides in soils. Weed Sci., 21: 556-560.
Andreini, M.S. and Steenhuis, T.S., 1990. Preferential paths of flow under conventional and conser- vation tillage. Geoderma, 46: 85-102.
Arjmand, M., Spittler, T.D. and Mumma, R.O., 1988. Analysis of dicamba from water using solid- phase extraction and ion-pair high-performance liquid chromatography. J. Agric. Food Chem., 36: 492-494.
Braker, W.L., 198 I. Soil survey of Centre Co., Pennsylvania. USDA-SCS and PA State Univ., College of Agric. and PA Dep. Environ. Res., Harrisburg, PA, 162 pp.
J.K. Hall, R.O. Mumma ~Soil& Tillage Research 30 (1994) 3-17 1"7
Burnside, O.C. and Lavy, T.L., 1966. Dissipation of dicamba. Weeds, 14:211-214. Edwards, W.M., Norton, L.D. and Redmond, C.E., 1988. Characterizing macropores that affect infil-
tration into nontilled soil. Soil Sci. Soc. Am. J., 52: 483-487. Edwards, W.M., Shipitalo, M.J., Owens, L.B. and Norton, L.D., 1990. Effect of Lumbricus terrestris
L. burrows on hydrology of continuous no-till corn fields. Geoderma, 46: 73-84. Germann, P.F., Edwards, W.M. and Owens, L.B., 1984. Profiles of bromide and increased soil mois-
ture after infiltration into soils with macropores. Soil Sci. Soc. Am. J., 48: 237-244. Grover, R. and Smith, A.E., 1974. Adsorption studies with the acid and dimethylamine forms of 2, 4-
D and dicamba. Can. J. Soil Sci., 54: 179-186. Hahn, R.R., Burnside, O.C. and Lavy, T.L., 1969. Dissipation and phytotoxicity of dicamba. Weed
Sci., 17: 3-8. Hall, J.K., Hartwig, N.L. and Hoffman, L.D., 1983. Application mode and alternate cropping effects
on atrazine losses from a hillside. J. Environ. Qual., 12: 336-340. Hall, J.K., Murray, M.R. and Hartwig, N.L., 1989. Herbicide leaching and distribution in tilled and
untilled soil. J. Environ. Qual., 18: 439-445. Hall, J.K., Mumma, R.O. and Watts, D.W., 1991. Leaching and runoff losses of herbicides in a tilled
and untilled field. Agric. Ecosystems Environ., 37:303-314. Harris, C.I., 1967. Movement of herbicides in soil. Weeds, 15:214-216. Helling, C.S., 1971. Pesticide mobility in soils II. Application of soil thin-layer chromatography. Soil
Sci. Soc. Am. Proc., 35: 737-743. Krueger, J.P., Butz, R.G., Atallah, Y.H. and Cork, D.J., 1989. Isolation and identification of micro-
organisms for the degradation of dicamba. J. Agric. Food Chem., 37:534-538. Krueger, J.P., Butz, R.G. and Cork, D.J., 1991. Aerobic and anaerobic soil metabolism of dicamba.
J. Agric. Food Chem., 39: 995-999. Murray, M.R. and Hall, J.K., 1989. Sorption-desorption of dicamba and 3,6-dichlorosalicylic acid in
soils. J. Environ. Qual., 18: 51-57. Scifres, C.J. and Allen, T.J., 1973. Dissipation of dicamba from grassland soils of Texas. Weed Sci.,
21: 393-396. Shipitalo, M.J., Edwards, W.M., Dick, W.A. and Owens, L.B., 1990. Initial storm effects on macro-
pore transport of surface-applied chemicals in no-till soil. Soil Sci. Soc. Am. J., 54:1530-1536. Smith, A.E., 1973. Transformation of dicamba in Regina heavy clay. J. Agric. Food Chem., 21: 708-
710. Smith, A.E., 1974. Breakdown of the herbicide dicamba and its degradation product 3,6-dichlorosal-
icylic acid in prairie soils. J. Agric. Food Chem., 22: 601-605. Triplett, Jr., G.B., Conner, B.J. and Edwards, W.M., 1978. Transport of atrazine and simazine in
runoff from conventional and no-tillage corn. J. Environ. Quah, 7: 77-84.