Embed Size (px)
Citation preview

Training:
RCA – Root Cause Analysis

The purpose of using the Ishikawa
Diagram?
Focuses the team on root causes not symptoms
•A Visual Tool to identify, explore and graphically display, allthe Possible Causes related to a problem or condition, to discover its Root Causes
Focuses team on the content of the problem Creates a snapshot of the collective knowledge of team Creates consensus of the causes of a problem Builds support for resulting solutions
•What is an Ishikawa Diagram?

The purpose of using the Ishikawa
Diagram?
•Starting from a well defined problem statement the fishbone tool is an effective and simple way of deriving the real root causes of a problem.
•What is the big idea?

How do we select a problem?

DADA loop
Data
Analysis
Decision
Action•Continuous improvement

Collect data
Documenting current state
• Process flow diagrams
• KPI„s
• Photographs and videotape
• Performance metrics
• Written procedures
• Survey and audit findings
lll7
Data
Analysis
Decision
Action Continuous improvement

Pareto Diagram
Focused efforts
• • 7
D B C A E Misc.
•80%
Helps leverage team’s time and energy by focusing on resolving 20 percent of the contributors that account for 80 percent of the occurences
Efforts concentrated on eliminating the root cause(s) for the few categories that account for the majority of the issues

What is the basic structure of an
Ishikawa diagram
•Problem /•Desired
•Improvement
•Causes •Effect
•Main Categories
•Measurements •Materials •People
•Environment •Methods •Machines
Also know as “Fishbone” or “Cause and Effect” diagrams
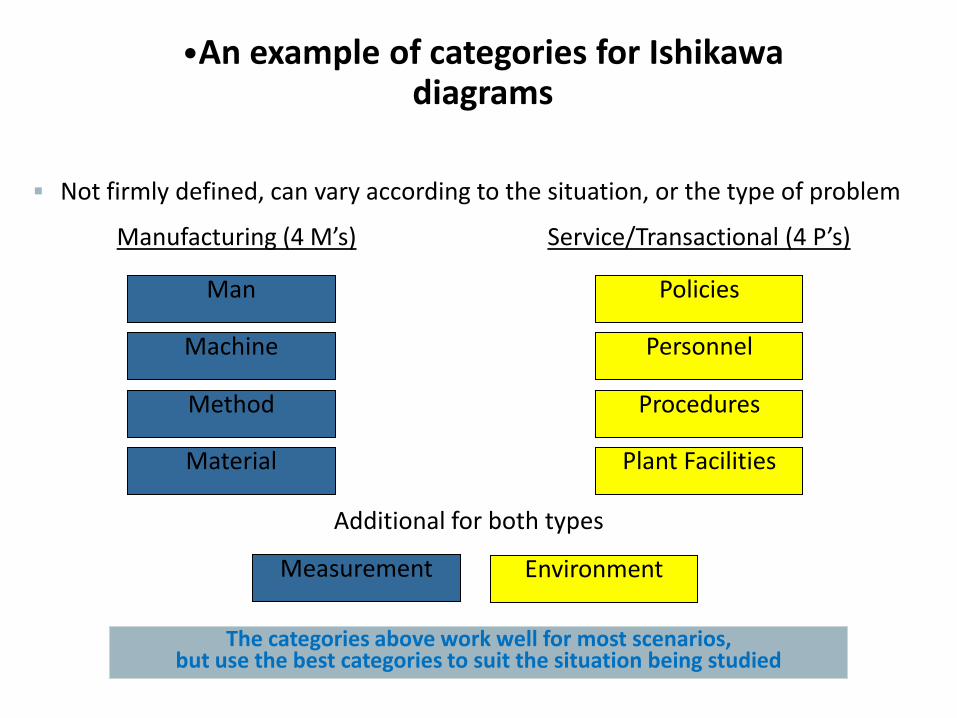
Not firmly defined, can vary according to the situation, or the type of problem
Manufacturing (4 M’s) Service/Transactional (4 P’s)
Man
Machine
Method
Material
Policies
Personnel
Procedures
Plant Facilities
Additional for both types
Measurement Environment
The categories above work well for most scenarios, but use the best categories to suit the situation being studied
•An example of categories for Ishikawa diagrams

• Start with a well stated problem: a problem well stated is a problem half
solved. This can be easier said than done therefore some items to bear in
mind when creating a problem statement are mentioned below:
• 1) A factual statement of the problem, using the “SMART” rules: Specific,
measurable, achievable (acceptable), realistic , trackable
• 2) The problem statement is likely to be KPI-driven, or cost-driven from the
results plan
• 3) Even objective statements need to be sense-checked. The sponsor and
attendees need confidence that this is a real issue and worth going after
• Therefore the head of the fish should always contain a statement like the
following:
Introduction of new products increased the queue for
the quality control from 2 hrs to 5 hrs.
KEY PRINCINPES

• The problem statement as such has to be defined before starting the root
cause analysis
• Everyone involved in the RCA has to agree on the problem statement
• Practical preparation:
• Prepare a set of “empty” fishbones on brown paper in function of the
number of problem statements: each fishbone consists out of a “head”
(for the problem statement) and several major cause categories (see
template)
• Post its to collect causes/Marker Pens
• Explain your approach and be sure that everyone understands:
• Explain that you will be challenging the mentioned causes: only by
detecting the real causes, change becomes possible
PRE - REQUISITIES

• Step 1 - Place a problem statement in the head of the fish.
• Step 2 - Set major cause categories – ideally these are detected during
the definition of the problem in a previous step and foresee an “other”
category (for example: process, knowledge, organisation, method, people,
material, procedure, policies (but this can be more specific depending on
what subject you‟re working on)
• Step 3 - Start up a brainstorm to detect the causes – keep the
participants focused by asking them:• Determine one or two causes on all of the major causes
• Think of a cause as: “what will change with regard to the problem if this cause is
solved” (not yet solution!)
KEY STEPS IN THE PROCESS

• Step 4 - Collect the brainstormed causes in the appropriate category – do
it an a fast way, to have an overview of the kind of causes/the variety (make
this clear during your introduction); cluster them in groupings, use those in
the workshop to assist with this.
• Step 5 - Start with a major cause category and take a cluster on which the
causes seem to be most important.
Start with a clear statement and challenge it by:• Asking why 5 times
• Checking the relationship with the problem statement: “what will change if this
cause is solved?” (but no solutions yet)
• Complete this for all the collected causes
• Step 6 - When the “real root cause” is reached, make clear that you want to
switch to solution mode on these causes. • Ask “How can this be solved” and ask for the expected result with regard to
the problem
• “In what way can we measure the effect of this solution? “
KEY STEPS IN THE PROCESS

5 WHYs
• It helps reveal the root cause of a problem
• Accomplished by asking “why” several times until you
have determined the ultimate reason for the problem
• It keeps teams from talking only about symptoms and
from automatically accepting the initial response they
receive about what the problem is
• Encourages team members to uncover the deeper
issues that are causing problems

• An action log should be completed for each of the root causes
• These should have a clear link with the KPIs, because they should improve
by taking these actions.
• Very important: behave as the devil’s advocate and make it clear upfront
that you will act that way. This will set the expectation and avoid attendees
feeling uncomfortable or attacked in any way.
• Be sure to end up with causes out of the different major categories; in
general 4 to 6 real root causes for one fish is OK;
• Capturing of results on the why‟s or on the actions is best done by a second
facilitator
• Timing aspects:• In general: think on 40% prep – 20 % acting – 40% post processing
• The duration of one session depends on the phase of the project and the
complexity of the problem.
WHAT TO DO WITH THE RESULTS?
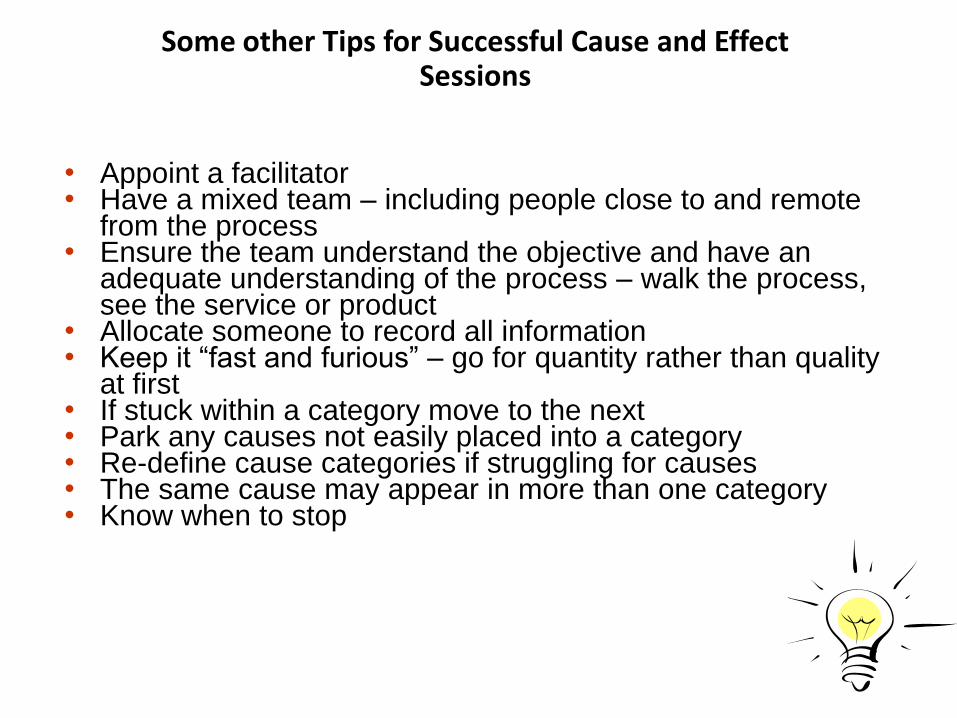
• Appoint a facilitator • Have a mixed team – including people close to and remote
from the process• Ensure the team understand the objective and have an
adequate understanding of the process – walk the process, see the service or product
• Allocate someone to record all information• Keep it “fast and furious” – go for quantity rather than quality
at first• If stuck within a category move to the next• Park any causes not easily placed into a category• Re-define cause categories if struggling for causes• The same cause may appear in more than one category• Know when to stop
Some other Tips for Successful Cause and Effect Sessions

EXAMPLES

Insufficient process
„Dealing with
developers“
Process
Procedures
System
Infrastructure
Developer
ORG People
Lacking automation /
System support
Lacking tool for
project management
Lacking accesibility
of basic information
about project
as well as clients
Lacking electronic
transfer of documents
Excessive administration
Manual document preparation
Required contracts
Not standardised offer
(lack of marketing support)
Excessive waiting times
Not clear role
of project manager
(especially on branch)
Unclear split of roles among
Developers centre and branch
Lack og R/E agency
(for full service)
Unclear insertion of
developers centre
to org. structure
D1
D2
D2
D3
D3
D3
D4
D4
D5
D5
Bad image of developers
centre in HB branches
Previous experiences
Not clear role od DC
Increased work on branch
(support for others branches)
D2
Lack of processes for cooperation
among developers centre and branches
D2
Missing strategy
„How to deal with developers“
Lack of strategy for cooperation
(ČSOB R/E Financing, SME, Developers
centre, ČSOB and HB branches
Missing strategy for developers centre
Lack of motivation for SME
firm bankers (info about new projects)
Issues/causes
D1
Excessive waiting times
D2
Incompleteness of connected
processes
D3
Lacking automation / system support
D4
Excessive administration
D5
Missing agreed strategy/concept
D6
Lacking process standardisation
D1
Excessive waiting times
D2
Incompleteness of connected
processes
D3
Lacking automation / system support
D4
Excessive administration
D5
Missing agreed strategy/concept
D6
Lacking process standardisation
D5
D5
Lacking process
standardisationD6
D6
Rules for evaluation
of financial situation
are not clearD6
Example of a completed Ishikawa
diagram
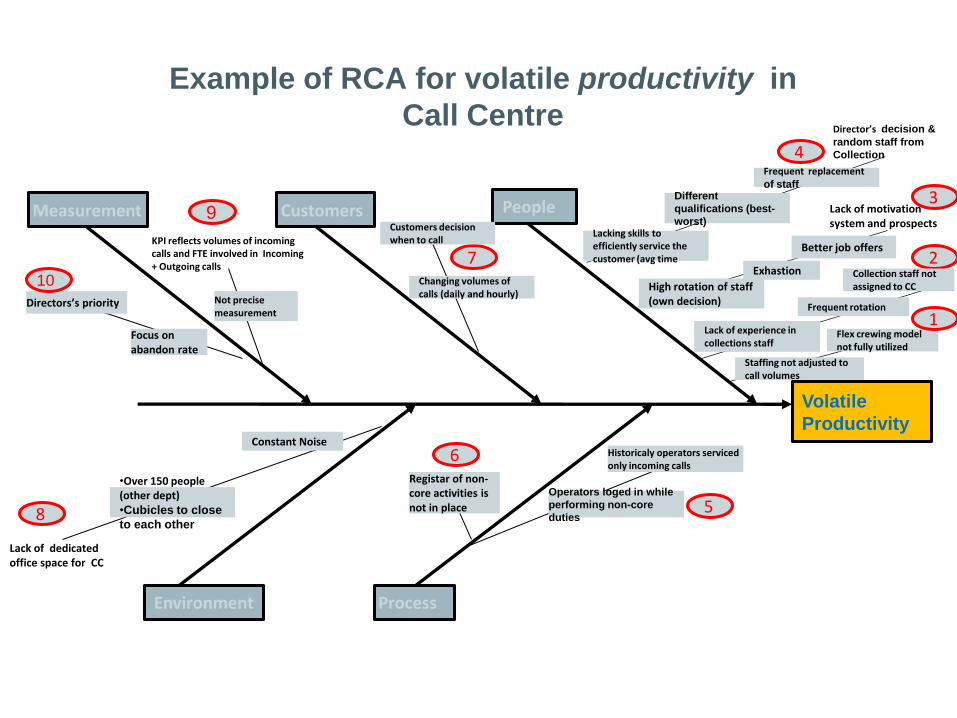
Example of RCA for volatile productivity in
Call Centre
Volatile
Productivity
People
Environment
Measurement Customers
Process
Different
qualifications (best-
worst)
Director’s decision &
random staff from
Collection
Lack of motivation system and prospects
KPI reflects volumes of incoming calls and FTE involved in Incoming + Outgoing calls
Lack of dedicated office space for CC
9
2
3
4
5
6
7
8
Lacking skills to efficiently service the customer (avg time
Frequent replacement of staff
Better job offers
Exhastion
Lack of experience in collections staff
Frequent rotation
Collection staff not assigned to CC
Flex crewing model not fully utilized
Staffing not adjusted to call volumes
Changing volumes of calls (daily and hourly)
Customers decision when to call
Not precise measurement
Constant Noise
•Over 150 people (other dept) •Cubicles to close
to each other
Operators loged in while
performing non-core
duties
Historicaly operators serviced only incoming calls
High rotation of staff(own decision)
Registar of non-core activities is not in place
Directors’s priority
Focus on abandon rate
10
1

Prioritization of root causes for volatile
productivity
HIGH
LOW
LOW HIGH
Effort
3
6
7
1
2
4
5
8
9
10
1. Flex crewing model not fully utilized
2. Collection staff not assigned to CC
3. Lack of motivation system and prospects
4. Frequent replacement of staff
5. Operators loged in while performing non-core duties
6. Registar of non-core activities is not in place
7. Changing volumes of calls (daily and hourly)
8. Lack of dedicated office space for CC
9. KPI reflects volumes of incoming calls and FTE involved in Incoming + Outgoing calls
10. Focus on abandon rate

•Causes •Effect
•Known as “Fishbone” or “Ishikawa” diagram
•Environment
•Systems and Processes
•People
•Material •Machines
•Unstable•planning

•Causes •Effect
•Known as “Fishbone” or “Ishikawa” diagram
•Environment
•Systems and Processes
•People
•Material •Machines
•Unstable•planning
•Communication between departments
•5S
•Lay out
•Pallets
•Machines aren’t suitable for products
•Leadership
•Quality Packing material
•Planning
•New products
•Training
•Human error
•Plant’s conditions
•Standards:
• Maintenance
• Production
• Quality
•Reports
•Lead time
•Products aren’t suitable for machines
•Documentation:
• Late
• Production
• Quality
•Late material
•General quality
•Products portfolio
•Late QC
•Too small:
• Prod. orders
• 6 packs
•Equipment:
• Lacking
• Old
• Bad quality
• Sensitive
•Lack of personnel / new personnel

•Known as “Fishbone” or “Ishikawa” diagram
•10
•9
•1
•8
•5
•6
•1•3
•4
•3
•Environment
•Systems and
Processes
•People
•Material •Machines
•13 •12
•Unstable•planning
•Communication between
departments
•Pallets
•Machines aren’t suitable for products
•Leadership
•Quality Packing material
•Planning
•New products
•Training
•Resources
•Plant’s conditions
•Standards:
• Maintenance
• Production
• Quality
•Reports
•Lead time
•Products aren’t
suitable for machines
•Documentation:
• Late
• Production
• Quality
•Late material
•General quality
•Products portfolio
•Late QC
•Too small:
• Prod. orders
• 6 packs
•Equipment:
• Lacking
• Old
• Bad quality
• Sensitive
•14•11
•1•Brainstorm solutions
•Lack of personnel / new personnel
•Lack of cooperation with
customers
•Unstable forecast

Summary of RCA workshop (example):
“Production plan not executed in production”
1. Root cause - Roles & responsibility
• A) Change of plan……
• B) More involvement from R/D when its
products problems
• C) Waiting for products
• D) Missing forecast/sales info.
• E) Unclear responsibility
• F) Cooperation between
marketing/sales,PD/Technologist,
production, between shifts
• Not clear procedures roles , responsibility in
prod. department management.
• Wrong placed responsibility in production
department.
• Wrong purchasing.
Why, why, why..?
A) Machine problems
A) Set up time
A) Information
A) Sales development not equal prognosis
A) Lack of raw materials
A) Direct only for sales?
B) Not interested.
B) Prefer to make new products.
C) Wrong purchasing
C) Staging to late.
C) Follow up purchasing plan
D) Missing info from customers
D) Not focus.
E) Missing job description
E) Not good instructions/ and not detailed job descriptions.
F) Lack of interest about work in another’s departments.
F) Bad communication
F) Not strict rules/No clear agenda.
Lack of behaviour management “silo mindset”
Solution to solve root cause
A) Get machine operators to do the set ups
B) Make a clear agenda
C) Make clear responsibility
D)
E)
F) Improve communication.
F) Make clear agenda, Strict rules
F) Think the company/factory as one customer.
F) Trust each other.
F) Management have to learn to respect employees

Summary of RCA workshops (example):
“Production plan not executed in production”
2. Root cause: Training:
• A) Bad/Lack training politics
• B) Qualification instructors.
• C) To long changeover time
• D) Lack capacity technologist.
• E) More Knowledge about machines.
• F) More training operators.
• G) Lack of training programs for operators.
• H) Skill of people.
• I) More knowledge about production from
planning.
• J) Skills of manager/leader SAP.
Why, why, why?
A) Little time to make them.
B) Bad training program
C) Lack of focus on changeovers
D)
E) Little time to learn.
E) “Fire fighting”, not do preventive maintenance.
F) Little time.
F) No focus
G) Little time.
G) No focus
H) Focus.
I) Lack of information.
J) SAP doc. are to complex.
J) No training in SAP.
J) Little Time.
Solution to solve root cause
Individual training
Have to be aligned to production plan
Establish training program in all levels/tasks
Trainer pool in different tasks.
Individual training
Time to do training.
Rieber academy
Establish SMED program, and stick to it.

Prioritization matrix (example)
1. Producing allergens – build in parts of the Rest Filling 2. Returning raw material from Filling – must be faster, more staff,
other organising3. All products and components must be in place before the plan is
made (Packaging)4. Train operators in basic maintenance 5. Hire more people in case of sick leave (Mixing Depart.)6. Flexible staff ”everyone can run all machines”7. Improve communication between departments – both tel and
email8. Lock the production plan on a daily basis to avoid changes9. Better control of the specifications on raw material (Q+
Purchasing)10. Start up and change time11. Upgrade equipment for higher speed (electric comp.)12. Preventive maintenance and follow up.13. Preventive maintenance Process and follow up14. Preventive maintenance Mixing and follow up15. Preventive maintenance packaging to prevent wearing and
unnecessary stops16. Maintenance plans part of the production plans17. Process order ready before start – Mixing18. Service level – customer vs. work in capital
•high
•Be
ne
fits
•Effort
•High priority •Important
•Quick wins •Low Priority
•low
•hig
h•l
ow
•1
•4
•3
•2•6•5
•7•8
•10
•14
•13 •12•11
•18
•17 •16 •15
•19

•Ea
se o
f im
ple
men
tati
on
•Anticipated Benefits•High •Low
•Dif
ficu
lt•E
asy
Prioritize ideas – another way
•Priority
•Action
•Consider
•Eliminate
•P
•A
•C
•E

Summary of the key steps(RCA)
• Identify issues
• Record them
• Classify or group them
• Agree groups titles
• Drill down to the Root Cause
• Solutions Brainstorming
• Rank and prioritize topics
• Set actions
• Implementation