Embed Size (px)
Citation preview
Diablo Water District, City of BrentwoodTown of Discovery Bay, and
East Contra Costa Irrigation DistrictCalifornia Statewide
Groundwater Elevation Monitoring(CASGEM) Network Plan
December, 2011
City of Brentwood
ECCID
Discovery Bay
Diablo Water District

Diablo Water District, City of Brentwood,
Town of Discovery Bay, and East Contra Costa Irrigation
District
California Statewide Groundwater Elevation Monitoring
(CASGEM) Network Plan
June 2012

JUNE 2012 CASGEM NETWORK PLAN
LUHDORFF & SCALMANINI, CONSULTING ENGINEERS i
Table of Contents 1.0 Introduction ............................................................................................................................................. 1
1.1 CASGEM Goal ................................................................................................................................... 1
1.2 CASGEM Program Complements Ongoing Monitoring Programs .................................................... 1
1.3 Diablo Water District as Monitoring Entity ........................................................................................ 2
2.0 Northwest Tracy Subbasin Monitoring Network Area ........................................................................... 2
2.1 DWR Basin/Subbasin ......................................................................................................................... 2
2.2 Geology and Groundwater Resources ................................................................................................. 2
3.0 Previous Groundwater Studies ................................................................................................................ 3
3.1 Diablo Water District’s 2011 Groundwater Monitoring Report ......................................................... 4
3.2 Current Groundwater Conditions ........................................................................................................ 4
4.0 CASGEM Monitoring Network and Program – 2011 ............................................................................ 5
4.1 DWR Basin/Subbasin for CASGEM Program ................................................................................... 5
4.2 Diablo Water District Public Outreach ............................................................................................... 5
4.3 Selected CASGEM Wells ................................................................................................................... 5
4.4 Field Methods ..................................................................................................................................... 7
4.5 Monitoring Schedule ........................................................................................................................... 8
4.6 Groundwater Elevation Data Management and CASGEM Data Submittal ....................................... 9
5.0 References ............................................................................................................................................. 10
List of Tables Table 1 – Northwest Tracy Subbasin 2011 CASGEM Monitoring Network Table 2 – Northwest Tracy Subbasin 2011 CASGEM Monitoring Time and Frequency List of Figures Figure 1 – Location Map, CASGEM Participants and the Tracy Groundwater Subbasin Figure 2 – Well Location Map for CASGEM Monitoring Network, 2011 Appendices Appendix A – Diablo Water District 2011 CASGEM Network Well Information Appendix B – Reference Point Photos on Network Monitoring Wells Appendix C – Example Field Sheet for Groundwater Level Measurements
JUNE 2012 CASGEM NETWORK PLAN
LUHDORFF & SCALMANINI, CONSULTING ENGINEERS ii
List of Acronyms
CASGEM – California Statewide Groundwater Elevation Monitoring Program
DTW – Depth to Water
DWD – Diablo Water District
DWR – California Department of Water Resources
ECCID – East Contra Costa Irrigation District
ECWMA – East County Water Management Association
ft – feet
GWMP – Groundwater Management Plan
Int – Intermediate
Irrig – Irrigation Well
LSCE – Luhdorff & Scalmanini, Consulting Engineers
Mon- Monitoring Well
Msmt – Measurement
NAVD88 – North American Vertical Datum of 1988
PDT – Pacific Daylight Time
PST – Pacific Standard Time
RPE – Reference Point Elevation
SA – Semi-Annual
WDL – Water Data Library

JUNE 2012 CASGEM NETWORK PLAN
LUHDORFF & SCALMANINI, CONSULTING ENGINEERS 1
1.0 Introduction
1.1 CASGEM Goal In November 2009, Senate Bill SBX7-6 mandated that the groundwater elevations in all basins and subbasins in California be regularly and systematically monitored with the goal of demonstrating seasonal and long-term trends in groundwater elevations. In accordance with the mandate, the California Department of Water Resources (DWR) developed the California Statewide Groundwater Elevation Monitoring (CASGEM) program. DWR is facilitating the statewide program which began with the opportunity for local entities to apply to DWR to assume the function of regularly and systematically collecting and reporting groundwater level data for the above purpose. These entities are referred to as Monitoring Entities. The legislature added a key aspect to SBX7-6 which was to make certain elements of the groundwater level information available to the public.
1.2 CASGEM Program Complements Ongoing Monitoring Programs Wells designated for inclusion in the CASGEM program are for purposes of measuring groundwater levels on a semi-annual or more frequent basis that are representative of groundwater conditions in the state’s groundwater basins and subbasins. The wells selected by a designated Monitoring Entity may be a subset of other wells monitored by that entity and need not be inclusive of the designated entity’s entire monitoring network. Thus, the CASGEM program complements other pre-existing programs that have been developed throughout California by water districts, agencies, municipalities, counties, and others for purposes of understanding, managing, and sustaining groundwater resources. Diablo Water District (District) adopted a Groundwater Management Plan (GWMP) in 2007, which included the objective of monitoring groundwater levels, among other things. A primary focus of the District’s groundwater monitoring program is on monitoring groundwater levels in the vicinity of its production wells at the Glen Park and Stonecreek sites. Manual water level measurements are made monthly in monitoring network wells that include dedicated monitoring wells constructed by the District and private domestic wells. The District wells include monitoring wells at the Glen Park, Stonecreek, and Creekside sites, and the Glen Park, South Park, and Knightsen production wells. In addition to the wells monitored by the District for groundwater levels, the District has also integrated groundwater level data collected by other entities in the region, including the Town of Discovery Bay, East Contra Costa Irrigation District, and the City of Brentwood. The wells in the District’s current ongoing groundwater level monitoring network include shallow groundwater piezometers monitored by East Contra Costa Irrigation District (ECCID) since the 1950s and two deeper inactive irrigation wells monitored since 2005. Most of the ECCID wells are located south of the District’s boundaries. The City of Brentwood’s Wells 6, 7, 8, 9, 10A, 11, 12, 13, and 14 are also of interest for monitoring in aquifer units targeted for supply, and are typically deeper than domestic wells in the area.
JUNE 2012 CASGEM NETWORK PLAN
LUHDORFF & SCALMANINI, CONSULTING ENGINEERS 2
Coverage of groundwater wells for CASGEM monitoring is limited to existing sites with suitable accessibility. For purposes of the CASGEM program, the selected monitoring sites are sufficient to achieve the goals of determining representative groundwater level conditions for the northwest portion of the Tracy Groundwater Subbasin. If deemed necessary, future inclusion or replacement of additional monitoring well sites will be considered to fill in portions of the area not currently covered (i.e. toward Byron/Brentwood, near Dutch Slough, etc.).
1.3 Diablo Water District as Monitoring Entity In December, 2010, the District applied to the California Department of Water Resources (DWR) to become the Monitoring Entity which would designate wells as appropriate for monitoring and reporting groundwater elevations for purposes of the CASGEM program. In anticipation of confirmation of DWR’s acceptance of the District as the Monitoring Entity, the District has identified the wells to be included in the monitoring program network and prepared this CASGEM Network Plan (Plan) as required by DWR. This Plan contains the recommended components outlined by DWR, including a summary of the geology and groundwater resources in the District, Discovery Bay, Brentwood, and ECCID area. This Plan also identifies the planned CASGEM well network, the rationale for the selection of the wells, the field methods, and the monitoring schedule.
2.0 Northwest Tracy Subbasin Monitoring Network Area
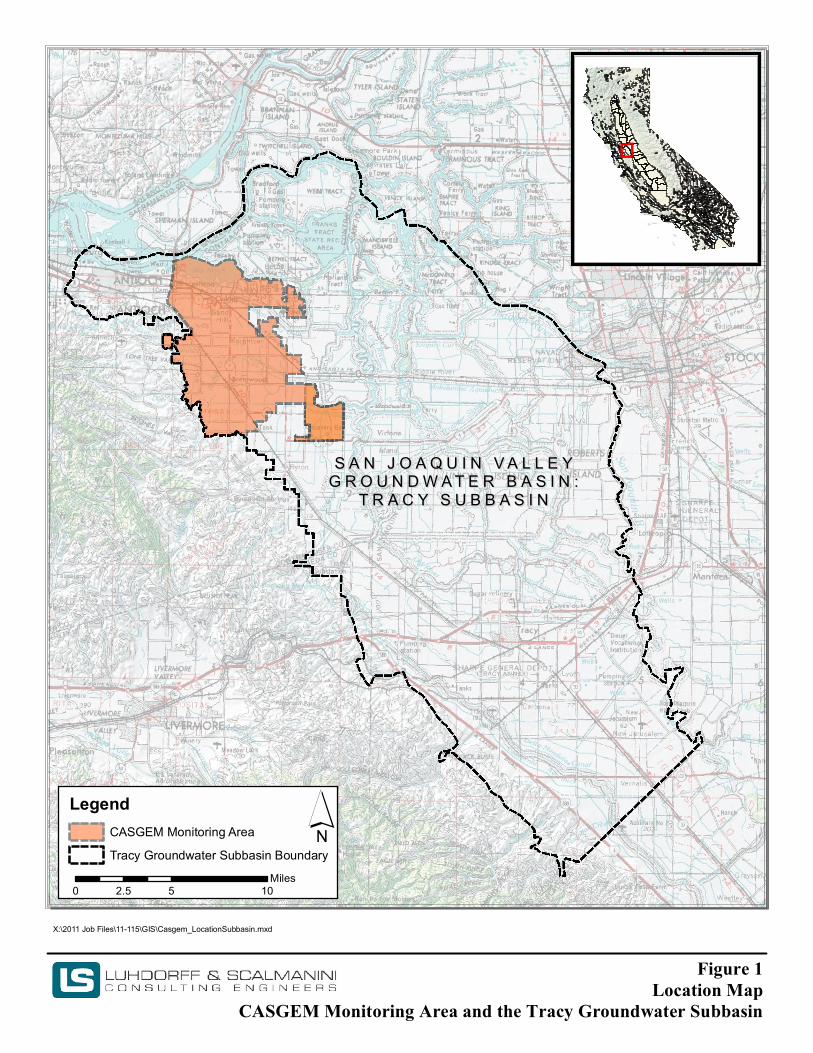
2.1 DWR Basin/Subbasin The District and other cooperating agencies overlie a portion of the San Joaquin Valley Groundwater Basin as designated by DWR Bulletin 118 (DWR, 2004). The District and other cooperating agencies are located in the northwestern portion of the Tracy Subbasin, which is one of sixteen subbasins in the San Joaquin Valley Groundwater Basin (Figure 1). The Tracy Subbasin is assigned Basin Number 5-22.15 and is described by DWR as including the northwestern most portion of the San Joaquin Valley Groundwater Basin around the Sacramento-San Joaquin Delta and extending south into the central portion of the San Joaquin Valley. Overall, population density within the Subbasin is relatively sparse, with the major cities being Tracy, Brentwood, and Oakley. Subbasin boundaries are defined by the Mokelumne and San Joaquin Rivers on the north; the San Joaquin River on the east; and the San Joaquin-Stanislaus County line on the south. The western Subbasin boundary is defined by the contact between unconsolidated sedimentary deposits and the rocks of the Diablo Range.
2.2 Geology and Groundwater Resources The geologic description of the combined monitoring network area was developed in 1999 as part of a study by Luhdorff & Scalmanini, Consulting Engineers (LSCE) in which hundreds of well logs were reviewed and interpreted to delineate hydrogeologic features in the East Contra Costa County area. In general, water resources in the region and within the monitoring network area are limited to alluvial materials to 400 or 500 feet below ground surface. Below these depths, brackish to saline water has been encountered. The characteristics of alluvium vary in the region according to the depositional environment (i.e., stream versus delta environments). The conceptual model of the alluvial material in the District area

JUNE 2012 CASGEM NETWORK PLAN
LUHDORFF & SCALMANINI, CONSULTING ENGINEERS 3
encompasses all four types of water-bearing units identified in the 1999 regional study and described below:
Fluvial Plain –Representative of the eastern portions of the Diablo Water District and southward to Discovery Bay. The depositional setting is probably similar to that which occurs in the present day area with northward flowing river channels, distributaries, and sloughs across floodplains of overbank areas. Deposits extend to depths of about 350 feet, below which occur largely fine-grained silts and clays. Delta Islands – Representative of the northeastern portion of the District and encompasses Bethel Island and vicinity. Sand and gravel beds may correlate to the Fluvial Plain, but net sand thicknesses and the number of beds appear to increase northward. The depositional environment is interpreted as multiple stream channels meandering between islands. Channels would be active with through-flowing waters, then abandoned as new channels developed. Possibly slower stream flow and tidal fluctuations allowed thicker, fine-grained sand deposits to form. Marginal Delta Dunes – Representative of the central to western portion of the District and defined by numerous thin to thick sand beds. The depositional environment is a mixture of delta fluvial distributary channels and possibly aeolian (wind-deposited) dune fields. Between Oakley and northern Brentwood, a surface deposit of rolling gentle hills representing relic sand dunes occurs. These sand dunes are believed to have been generated by strong winds blowing sand off the delta margins. Some deeper sand beds across the Marginal Delta Dunes area may be older dune fields. Alluvial Plain – Representative of greater Brentwood south of the Marginal Delta Dune and City of Oakley, and west of the Fluvial Plain. The depositional environment consists of small streams draining eastward from the Coast Range foothills to the west. Flood flows of these streams spread out from the hills depositing fine-grained materials, possibly as mudflows with high sediment content. Stream flows deposited thicker sand and gravel beds that tended to stack upon each other causing the thicker bands of sand beds. The thicker stream deposited sand and gravel bands extend eastward until the sands either pinch out or have not been reached vertically by wells. In the north, the stream deposits appear to reach into the Marginal Delta Dunes area, blending into the sand units that are present there.
3.0 Previous Groundwater Studies Diablo Water District has produced a Groundwater Monitoring Report (LSCE, 2011) and is also a member agency of the East Contra Costa County Regional Water Management Group called East County Water Management Association (ECWMA) with other entities included in this CASGEM program. The Groundwater Monitoring Report is described below. The ECWMA has been involved with the preparation and implementation of an East County Water Management Plan in 1996 (ECWMA, 1996), and more recently, the development and adoption of a Functionally Equivalent Integrated Regional Water
JUNE 2012 CASGEM NETWORK PLAN
LUHDORFF & SCALMANINI, CONSULTING ENGINEERS 4
Management Plan (ECWMA, 2005) in 2005 which has plans of evolving into a fully-integrated regional water management plan.
3.1 Diablo Water District’s 2011 Groundwater Monitoring Report The District’s Groundwater Monitoring Report (LSCE, 2011) provides an update of groundwater monitoring data compiled by the District in accordance with its 2007 GWMP. The Monitoring Report includes the following:
• District groundwater and surface water use, • Precipitation • Hydrographs for monitoring and production wells • Contours of seasonal groundwater elevations, • Land subsidence, and • Groundwater and surface water quality
3.2 Current Groundwater Conditions For purposes of evaluating groundwater level conditions in the District area, the subsurface has been divided into two aquifer units: a shallow unconfined aquifer and a deeper confined aquifer. Most domestic wells are completed in the shallow zone while the larger municipal wells are completed in the deeper units. Wells completed in the shallow zone are typically completed to less than 200 feet in depth and often less than 100 feet in depth. Wells completed in the deep aquifer are usually high capacity supply wells that are more than 200 feet in depth. Groundwater level conditions in the shallow aquifer are determined through a subset of domestic wells in the vicinity of the Glen Park production well and completed within the upper 60 feet of the shallow aquifer. Groundwater levels from these domestic wells indicate shallow water levels (depths to water of 10 to 15 feet below ground surface) with minimal seasonal fluctuations (less than 5 feet). The shallow aquifer is responsive to changes in water year type and decreases in precipitation. This was observed between 2007 and 2011; water levels dropped on the order of 1 to 2 feet, but are generally stable. Hydrographs indicate vertical hydraulic isolation between these shallow wells and effects from nearby municipal pumping in the deep aquifer. An additional group of wells in the vicinity of the Glen Park production well are considered to be intermediate wells, as they are completed in the deeper portion of the shallow aquifer (between 120 and 200 feet below ground surface). Groundwater levels in these wells indicate some hydraulic connection to both shallow and deep aquifer units. Groundwater levels in these intermediate wells exhibit composite characteristics of the shallow aquifer above it and the deeper aquifer below it, with seasonal water level fluctuations between 10 to 12 feet and a slight declining trend since 2004 (of less than 5 feet), similar to trends in water levels seen in the deeper aquifer system, and are generally stable. Groundwater level conditions in the deep aquifer reflect seasonal fluctuations from 15 to 20 feet and variations in peak water levels according to climatic trends and water year type. Seasonal fluctuations are accentuated during summer months when municipal pumping is highest, but full recovery is common

JUNE 2012 CASGEM NETWORK PLAN
LUHDORFF & SCALMANINI, CONSULTING ENGINEERS 5
during the wet winter months. Water levels in the deep aquifer are also sensitive to regional climate variability; groundwater levels have overall been stable through the somewhat limited period of record (less than a decade of record for most wells).
4.0 CASGEM Monitoring Network and Program – 2011
4.1 DWR Basin/Subbasin for CASGEM Program The District is proposing to monitor groundwater levels for the CASGEM program in the northwest portion of the Tracy Groundwater Subbasin of the San Joaquin Valley Groundwater Basin.
4.2 Diablo Water District Public Outreach The District recognizes that the success of the CASGEM program requires adequate spatial coverage of groundwater monitoring locations whenever possible. In an effort to gain the support of nearby water suppliers, the District conducted an informational meeting with representatives from the City of Brentwood, the Town of Discovery Bay, and ECCID in attendance. The purpose of the meeting was to inform the other entities of the District’s intent to become the Monitoring Entity and to gain cooperation from the nearby water suppliers in providing the collection of groundwater levels in their respective areas.
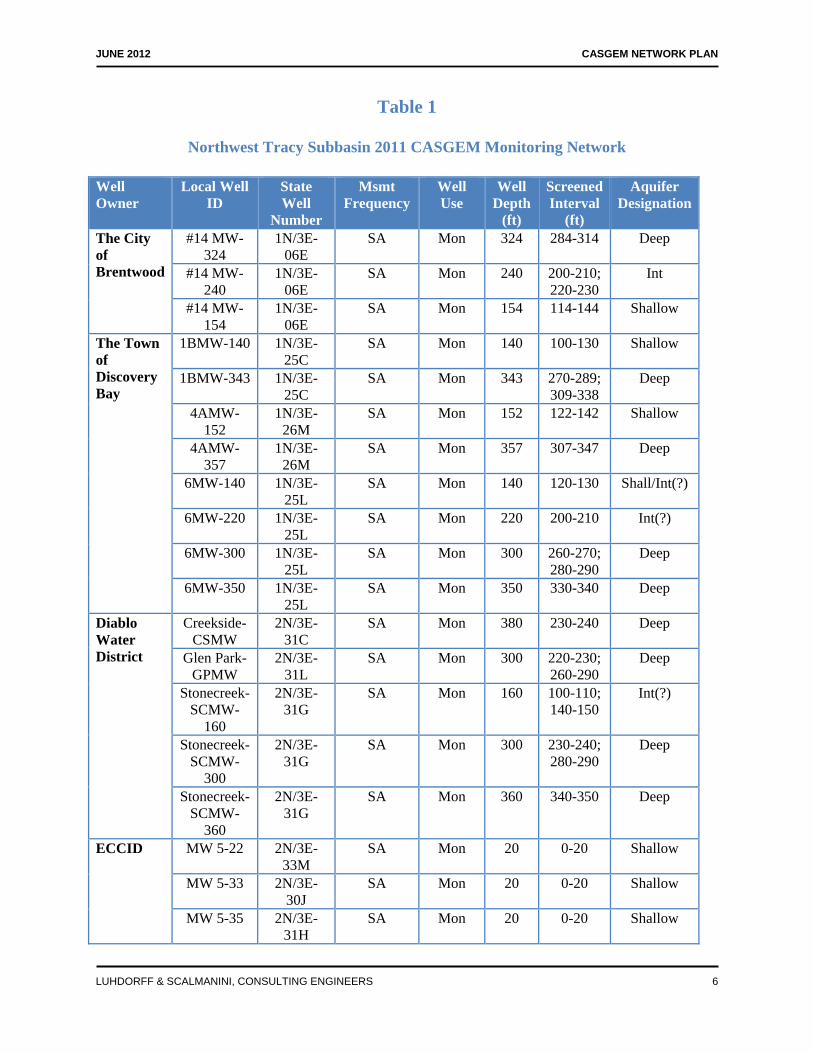
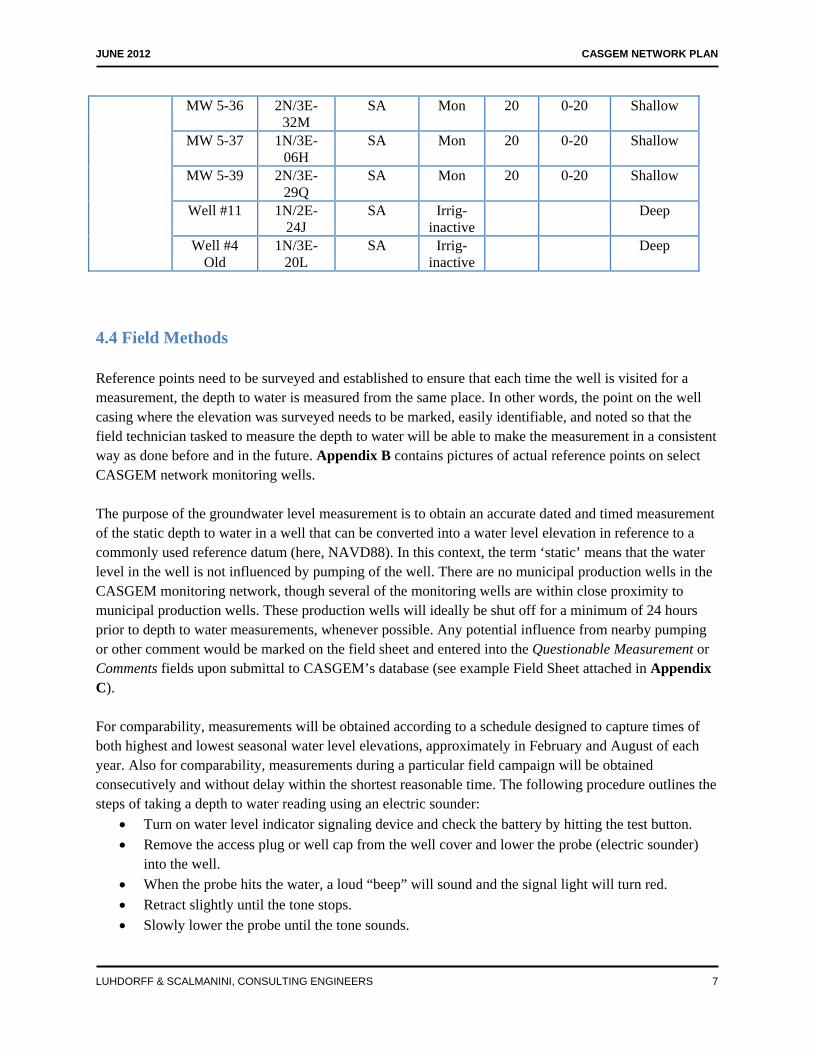
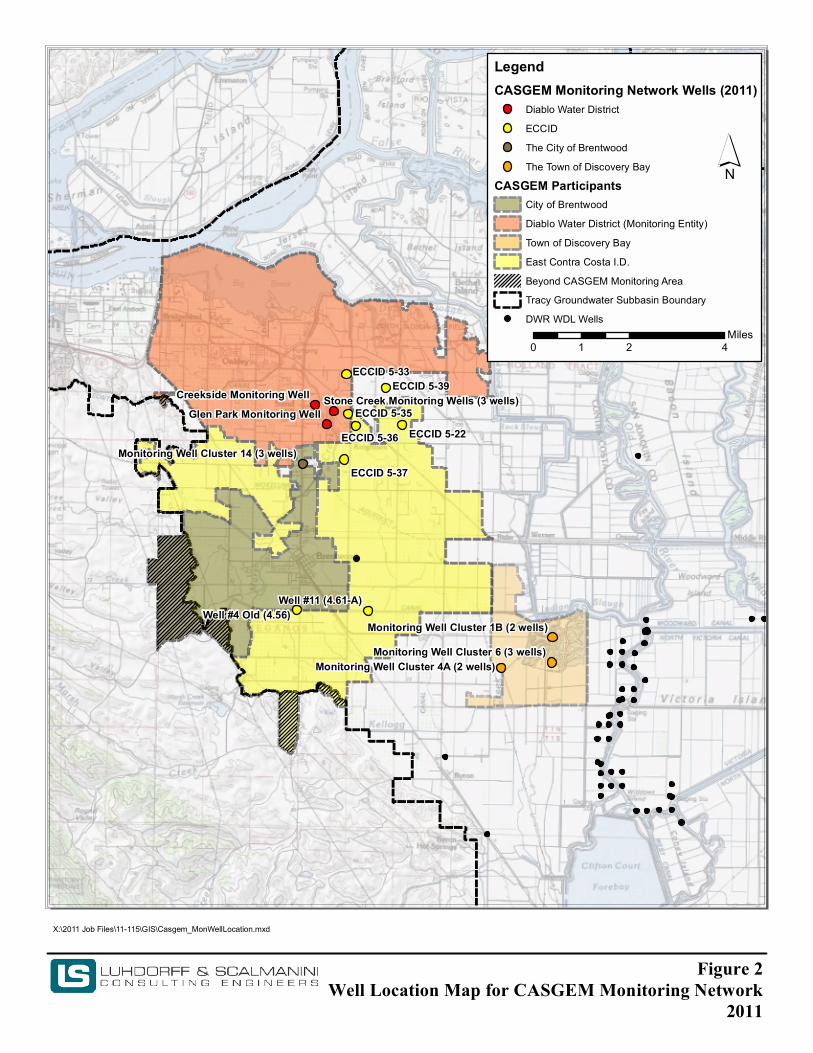
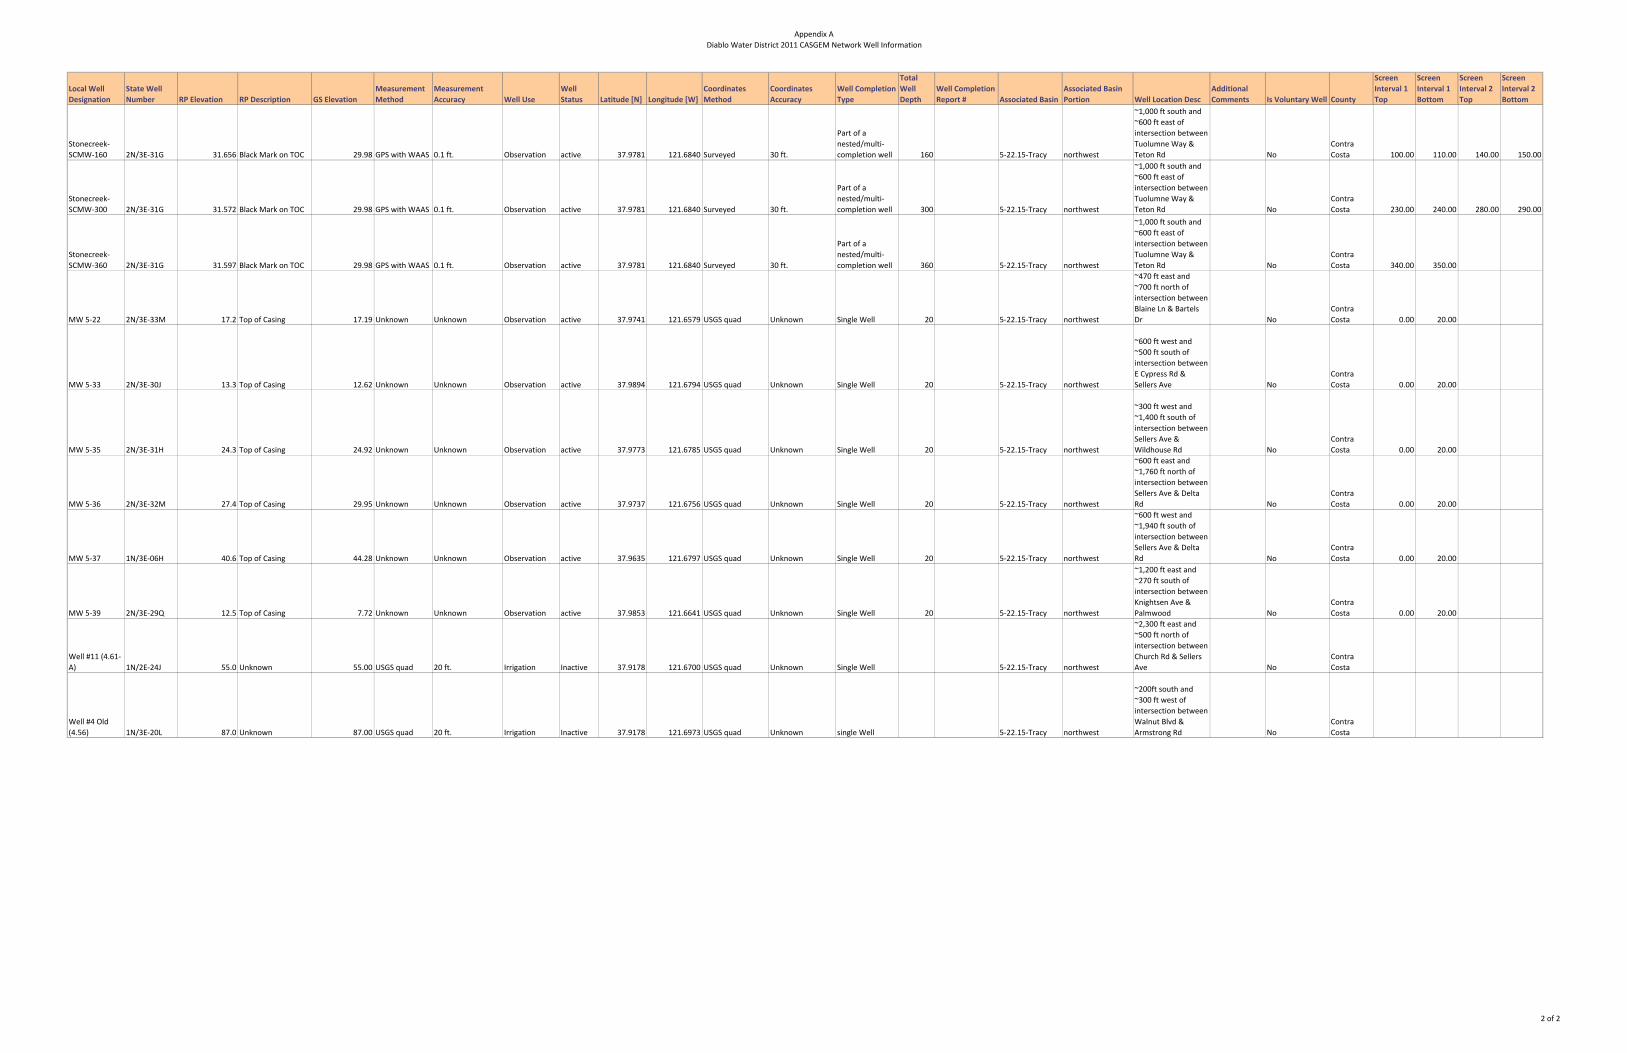
4.3 Selected CASGEM Wells Currently the CASGEM monitoring network includes wells from the City of Brentwood, the Town of Discovery Bay, the District, and ECCID, with a total of 24 wells of various completion depths and spatial distribution (Figure 2). These well locations compliment the wells that DWR has monitored and are publicly available in DWR’s Water Data Library (WDL). Several of the CASGEM well locations include nested monitoring wells (i.e., multiple well casings of differing depths in a single borehole). Depending on the results of the District’s evaluation, future actions may include removal and replacement of CASGEM wells with wells that are more representative of local groundwater conditions to better meet the objective of the CASGEM program and to meet multiple objectives of the District’s 2007 GWMP. In addition, if deemed necessary, inclusion/replacement of different well sites will be considered by the cooperating entities to fill in any portions of the area not currently covered. There are no local issues that prevent or limit groundwater monitoring, besides budgetary constraints on the part of the cooperating entities to acquire access and perform the monitoring. Well information, such as is required and/or suggested by DWR for the CASGEM program wells, along with additional information, is summarized in detail in Appendix A. Table 1 below lists the CASGEM monitoring wells as well as available construction details and aquifer designation.
JUNE 2012 CASGEM NETWORK PLAN
LUHDORFF & SCALMANINI, CONSULTING ENGINEERS 6
Table 1
Northwest Tracy Subbasin 2011 CASGEM Monitoring Network Well Owner
Local Well ID
State Well
Number
Msmt Frequency
Well Use
Well Depth
(ft)
Screened Interval
(ft)
Aquifer Designation
The City of Brentwood
#14 MW-324
1N/3E-06E
SA Mon 324 284-314 Deep
#14 MW-240
1N/3E-06E
SA Mon 240 200-210; 220-230
Int
#14 MW-154
1N/3E-06E
SA Mon 154 114-144 Shallow
The Town of Discovery Bay
1BMW-140 1N/3E-25C
SA Mon 140 100-130 Shallow
1BMW-343 1N/3E-25C
SA Mon 343 270-289; 309-338
Deep
4AMW-152
1N/3E-26M
SA Mon 152 122-142 Shallow
4AMW-357
1N/3E-26M
SA Mon 357 307-347 Deep
6MW-140 1N/3E-25L
SA Mon 140 120-130 Shall/Int(?)
6MW-220 1N/3E-25L
SA Mon 220 200-210 Int(?)
6MW-300 1N/3E-25L
SA Mon 300 260-270; 280-290
Deep
6MW-350 1N/3E-25L
SA Mon 350 330-340 Deep
Diablo Water District
Creekside-CSMW
2N/3E-31C
SA Mon 380 230-240 Deep
Glen Park-GPMW
2N/3E-31L
SA Mon 300 220-230; 260-290
Deep
Stonecreek-SCMW-
160
2N/3E-31G
SA Mon 160 100-110; 140-150
Int(?)
Stonecreek-SCMW-
300
2N/3E-31G
SA Mon 300 230-240; 280-290
Deep
Stonecreek-SCMW-
360
2N/3E-31G
SA Mon 360 340-350 Deep
ECCID MW 5-22 2N/3E-33M
SA Mon 20 0-20 Shallow
MW 5-33 2N/3E-30J
SA Mon 20 0-20 Shallow
MW 5-35 2N/3E-31H
SA Mon 20 0-20 Shallow
JUNE 2012 CASGEM NETWORK PLAN
LUHDORFF & SCALMANINI, CONSULTING ENGINEERS 7
MW 5-36 2N/3E-32M
SA Mon 20 0-20 Shallow
MW 5-37 1N/3E-06H
SA Mon 20 0-20 Shallow
MW 5-39 2N/3E-29Q
SA Mon 20 0-20 Shallow
Well #11 1N/2E-24J
SA Irrig-inactive
Deep
Well #4 Old
1N/3E-20L
SA Irrig-inactive
Deep
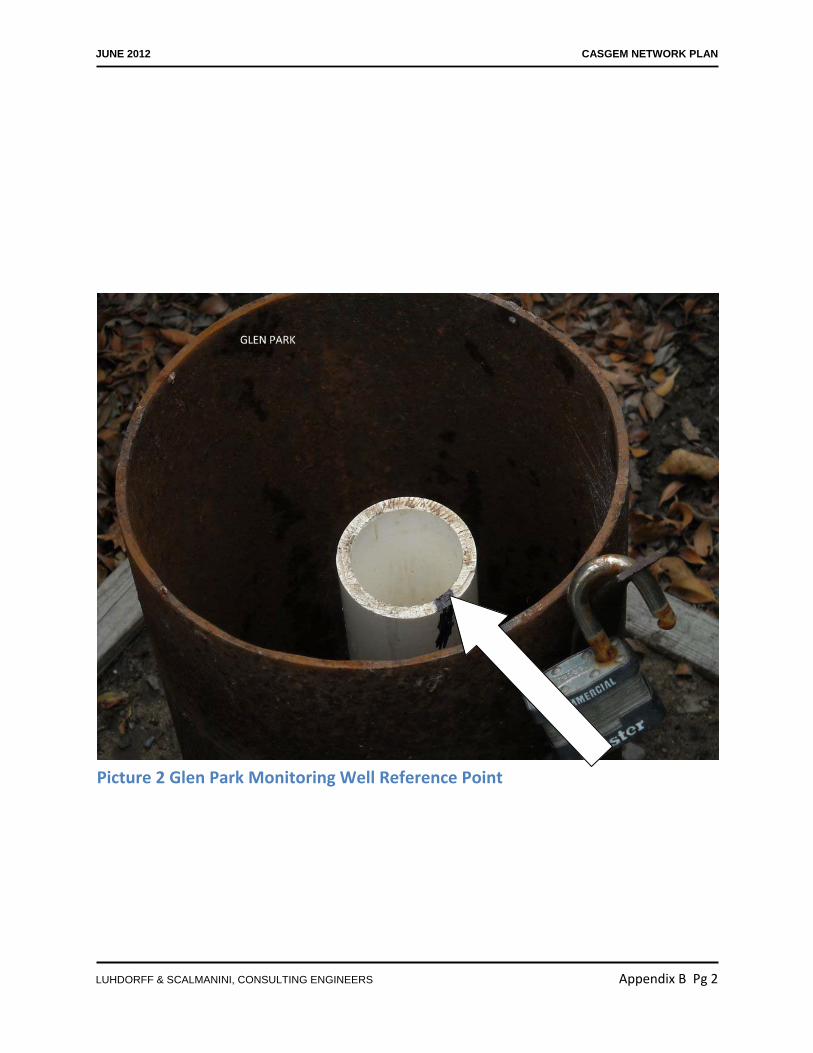
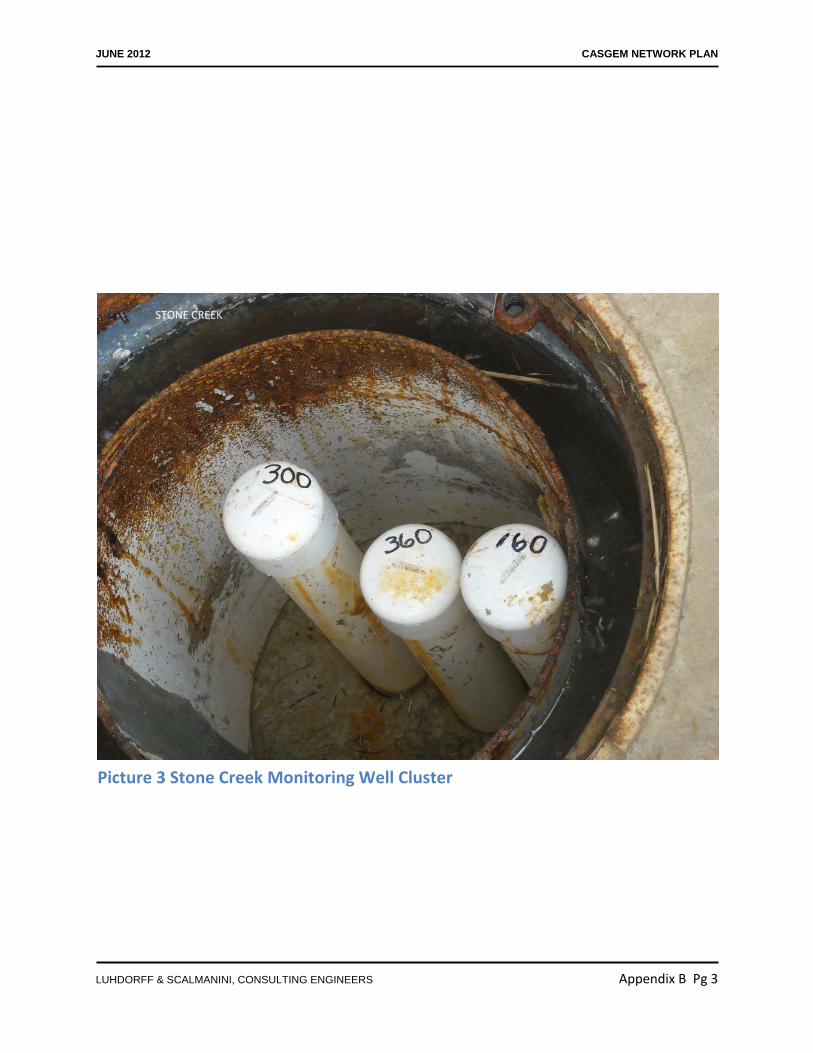
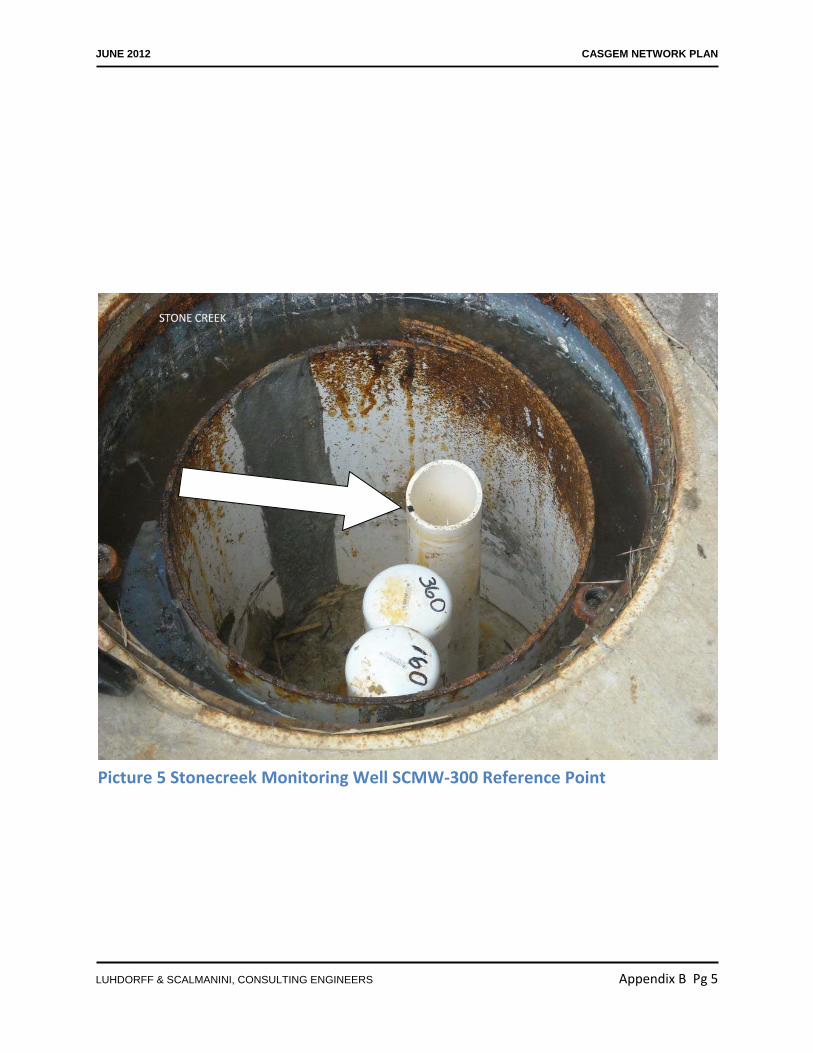
4.4 Field Methods Reference points need to be surveyed and established to ensure that each time the well is visited for a measurement, the depth to water is measured from the same place. In other words, the point on the well casing where the elevation was surveyed needs to be marked, easily identifiable, and noted so that the field technician tasked to measure the depth to water will be able to make the measurement in a consistent way as done before and in the future. Appendix B contains pictures of actual reference points on select CASGEM network monitoring wells. The purpose of the groundwater level measurement is to obtain an accurate dated and timed measurement of the static depth to water in a well that can be converted into a water level elevation in reference to a commonly used reference datum (here, NAVD88). In this context, the term ‘static’ means that the water level in the well is not influenced by pumping of the well. There are no municipal production wells in the CASGEM monitoring network, though several of the monitoring wells are within close proximity to municipal production wells. These production wells will ideally be shut off for a minimum of 24 hours prior to depth to water measurements, whenever possible. Any potential influence from nearby pumping or other comment would be marked on the field sheet and entered into the Questionable Measurement or Comments fields upon submittal to CASGEM’s database (see example Field Sheet attached in Appendix C). For comparability, measurements will be obtained according to a schedule designed to capture times of both highest and lowest seasonal water level elevations, approximately in February and August of each year. Also for comparability, measurements during a particular field campaign will be obtained consecutively and without delay within the shortest reasonable time. The following procedure outlines the steps of taking a depth to water reading using an electric sounder:
• Turn on water level indicator signaling device and check the battery by hitting the test button. • Remove the access plug or well cap from the well cover and lower the probe (electric sounder)
into the well. • When the probe hits the water, a loud “beep” will sound and the signal light will turn red. • Retract slightly until the tone stops. • Slowly lower the probe until the tone sounds.
JUNE 2012 CASGEM NETWORK PLAN
LUHDORFF & SCALMANINI, CONSULTING ENGINEERS 8
• Note depth measurement at the designated reference point to the nearest 0.01 feet and rewind the probe completely out of the well.
• Remove excess water and lower probe once again into the well and make another measurement. • If the difference is within +- 0.02 feet of the first measurement, record the measurement. • If the difference is greater than +- 0.02 feet, repeat the same procedure until three consecutive
measurements are recorded within +- 0.02 feet. • Rewind and remove the probe from the well and replace the access plug or well cap in the well
cover. • Clean and dry the measuring device/probe and continue to the next well.
For each well measurement, the following information should be recorded:
1. Name of field technician making the measurement 2. Unique identification of well 3. Time and date of measurement 4. Depth to water 5. Any other pertinent comments (e.g., sounder hangs up at 33 feet, thus no measurement; or: fifth
measurement of ~55.68 feet in a row… residual water in end cap?; etc.)
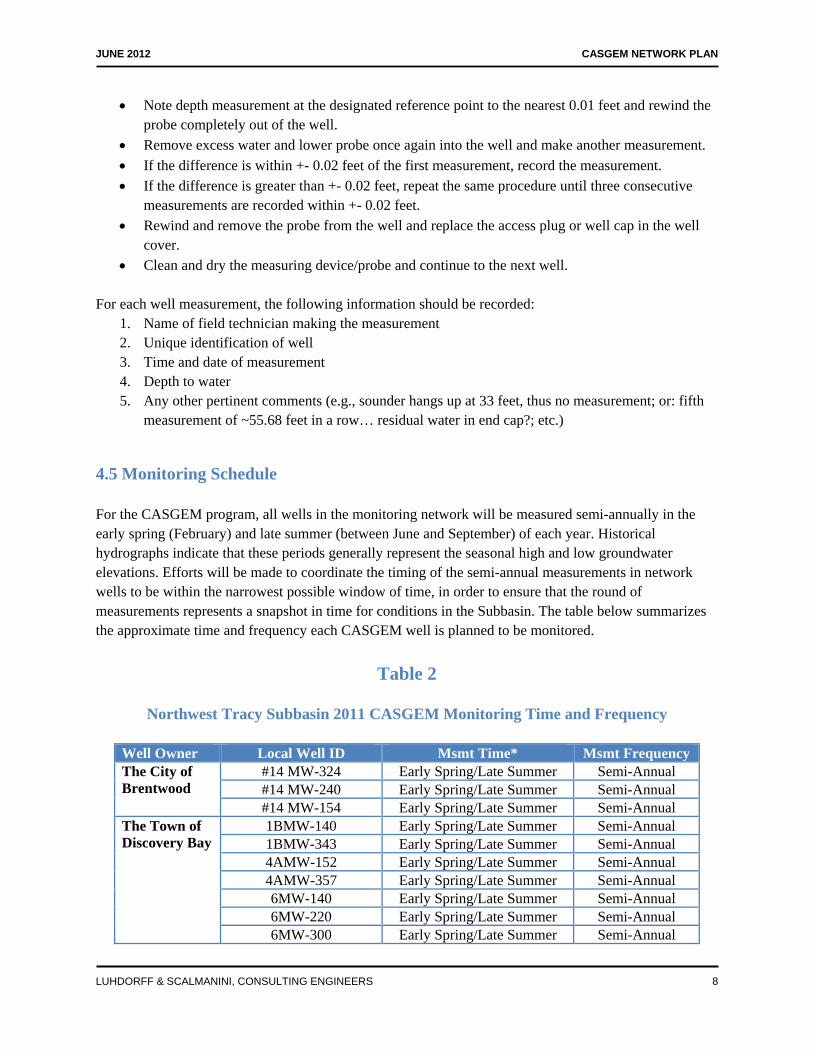
4.5 Monitoring Schedule For the CASGEM program, all wells in the monitoring network will be measured semi-annually in the early spring (February) and late summer (between June and September) of each year. Historical hydrographs indicate that these periods generally represent the seasonal high and low groundwater elevations. Efforts will be made to coordinate the timing of the semi-annual measurements in network wells to be within the narrowest possible window of time, in order to ensure that the round of measurements represents a snapshot in time for conditions in the Subbasin. The table below summarizes the approximate time and frequency each CASGEM well is planned to be monitored.
Table 2
Northwest Tracy Subbasin 2011 CASGEM Monitoring Time and Frequency
Well Owner Local Well ID Msmt Time* Msmt Frequency The City of Brentwood
#14 MW-324 Early Spring/Late Summer Semi-Annual #14 MW-240 Early Spring/Late Summer Semi-Annual #14 MW-154 Early Spring/Late Summer Semi-Annual
The Town of Discovery Bay
1BMW-140 Early Spring/Late Summer Semi-Annual 1BMW-343 Early Spring/Late Summer Semi-Annual 4AMW-152 Early Spring/Late Summer Semi-Annual 4AMW-357 Early Spring/Late Summer Semi-Annual 6MW-140 Early Spring/Late Summer Semi-Annual 6MW-220 Early Spring/Late Summer Semi-Annual 6MW-300 Early Spring/Late Summer Semi-Annual

JUNE 2012 CASGEM NETWORK PLAN
LUHDORFF & SCALMANINI, CONSULTING ENGINEERS 9
6MW-350 Early Spring/Late Summer Semi-Annual Diablo Water District
Creekside-CSMW Early Spring/Late Summer Semi-Annual Glen Park-GPMW Early Spring/Late Summer Semi-Annual
Stonecreek-SCMW-160 Early Spring/Late Summer Semi-Annual Stonecreek-SCMW-300 Early Spring/Late Summer Semi-Annual Stonecreek-SCMW-360 Early Spring/Late Summer Semi-Annual
ECCID MW 5-22 Early Spring/Late Summer Semi-Annual MW 5-33 Early Spring/Late Summer Semi-Annual MW 5-35 Early Spring/Late Summer Semi-Annual MW 5-36 Early Spring/Late Summer Semi-Annual MW 5-37 Early Spring/Late Summer Semi-Annual MW 5-39 Early Spring/Late Summer Semi-Annual Well #11 Early Spring/Late Summer Semi-Annual
Well #4 Old Early Spring/Late Summer Semi-Annual *DWD wells are also sometimes monitored on a monthly basis, but for the purpose of mandatory CASGEM monitoring, semi-annual measurements will be consistently measured and reported. Other wells in this table may be monitored for water levels more frequently than semi-annually, and those measurements will be submitted to the CASGEM database in addition to the semi-annual measurements.
4.6 Groundwater Elevation Data Management and CASGEM Data Submittal As part of the District’s 2007 GWMP, a database of groundwater level and water quality data was compiled. That database is updated with monitoring results, most recently for the 2011 Groundwater Monitoring Report (LSCE, 2011). Per DWR’s CASGEM program reporting requirements, the following information related to each of the designated CASGEM monitoring network wells will be submitted online at the end of each calendar year:
• Well identification number (DWR state well number in online format) • Measurement dates • Reference point elevation of the well (feet) using NAVD88 vertical datum • Elevation of land surface at the well (feet) using NAVD88 vertical datum • Depth to water below reference point (feet) (unless no measurement was taken) • Method of measuring water depth • Measurement quality codes1 • Measuring agency identification (Diablo Water District as the Monitoring Entity, City of
Brentwood, etc.) • Measurement time (PST/PDT with military time/24 hour format) • Comments about measurement, if applicable
1 Measurement quality codes examples include: 1) If no measurement is taken, a specified “no measurement” code, must be recorded. 2) If the quality of a measurement is uncertain, a “questionable measurement” code can be recorded. Standard codes will be provided by DWR’s online system.
JUNE 2012 CASGEM NETWORK PLAN
LUHDORFF & SCALMANINI, CONSULTING ENGINEERS 10
5.0 References California Department of Water Resources (DWR), San Joaquin Valley Groundwater Basin, Tracy
Subbasin, California’s Groundwater, Bulletin 118, 2004. East County Water Management Association (ECWMA), 1996. East County Water Management Plan. ECWMA, 2005. Functionally Equivalent Integrated Regional Water Management Plan. Luhdorff & Scalmanini, Consulting Engineers (LSCE), 1999. Investigation of Ground-Water Resources
in the East Contra Costa Area. Woodland, CA. LSCE, 2007. Diablo Water District Groundwater Management Plan for AB3030. Woodland, CA. LSCE, 2011. Groundwater Monitoring Report, Diablo Water District. Woodland, CA.

FIGURES
S A N J O A Q U I N V A L L E YS A N J O A Q U I N V A L L E YG R O U N D W A T E R B A S I N :G R O U N D W A T E R B A S I N :
T R A C Y S U B B A S I NT R A C Y S U B B A S I N
Figure 1Location Map
CASGEM Monitoring Area and the Tracy Groundwater Subbasin
X:\2011 Job Files\11-115\GIS\Casgem_LocationSubbasin.mxd
0 5 102.5Miles
´LegendCASGEM Monitoring AreaTracy Groundwater Subbasin Boundary
Creekside Monitoring WellGlen Park Monitoring Well
Stone Creek Monitoring Wells (3 wells)
ECCID 5-37
ECCID 5-22ECCID 5-36ECCID 5-35
ECCID 5-39ECCID 5-33
Monitoring Well Cluster 14 (3 wells)
Monitoring Well Cluster 6 (3 wells)Monitoring Well Cluster 1B (2 wells)
Monitoring Well Cluster 4A (2 wells)
Well #11 (4.61-A)Well #4 Old (4.56)
Figure 2Well Location Map for CASGEM Monitoring Network
2011
X:\2011 Job Files\11-115\GIS\Casgem_MonWellLocation.mxd
0 2 41Miles
LegendCASGEM Monitoring Network Wells (2011)
Diablo Water DistrictECCIDThe City of BrentwoodThe Town of Discovery Bay
CASGEM ParticipantsCity of BrentwoodDiablo Water District (Monitoring Entity)Town of Discovery BayEast Contra Costa I.D.Beyond CASGEM Monitoring AreaTracy Groundwater Subbasin BoundaryDWR WDL Wells

Appendix A Diablo Water District
2011 CASGEM Network Well Information
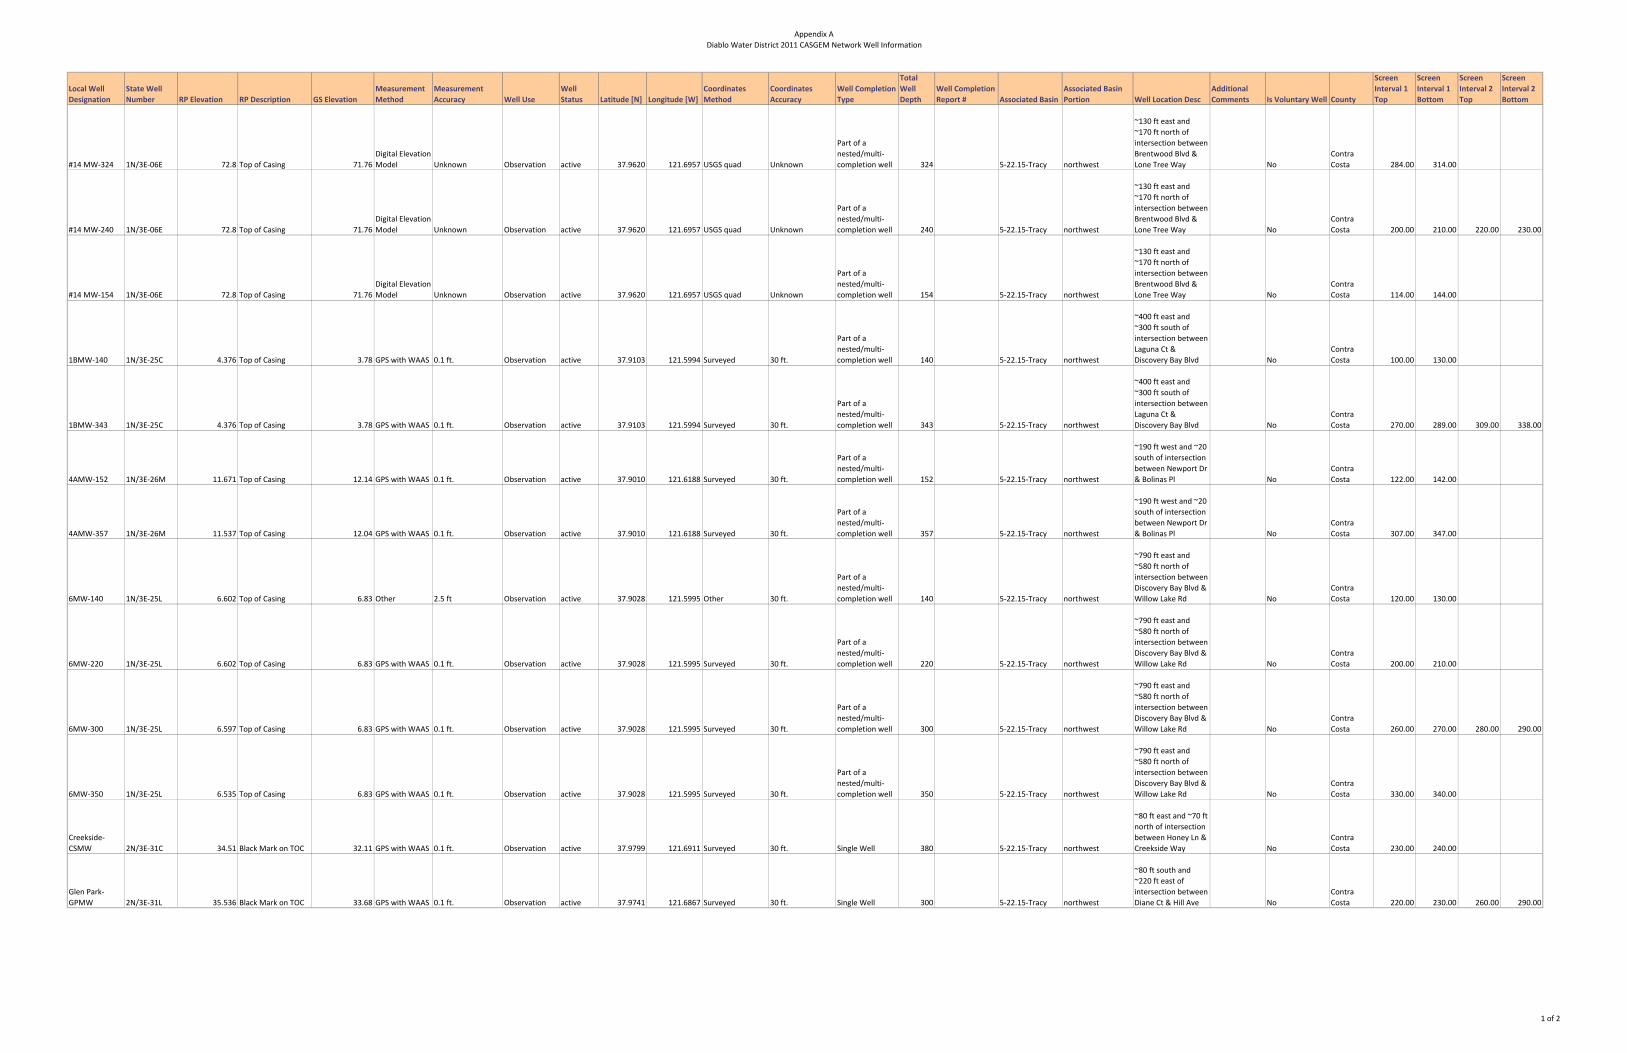
Appendix ADiablo Water District 2011 CASGEM Network Well Information
Local Well Designation
State Well Number RP Elevation RP Description GS Elevation
Measurement Method
Measurement Accuracy Well Use
Well Status Latitude [N] Longitude [W]
Coordinates Method
Coordinates Accuracy
Well Completion Type
Total Well Depth
Well Completion Report # Associated Basin
Associated Basin Portion Well Location Desc
Additional Comments Is Voluntary Well County
Screen Interval 1 Top
Screen Interval 1 Bottom
Screen Interval 2 Top
Screen Interval 2 Bottom
#14 MW‐324 1N/3E‐06E 72.8 Top of Casing 71.76Digital Elevation Model Unknown Observation active 37.9620 121.6957 USGS quad Unknown
Part of a nested/multi‐completion well 324 5‐22.15‐Tracy northwest
~130 ft east and ~170 ft north of intersection between Brentwood Blvd & Lone Tree Way No
Contra Costa 284.00 314.00
#14 MW‐240 1N/3E‐06E 72.8 Top of Casing 71.76Digital Elevation Model Unknown Observation active 37.9620 121.6957 USGS quad Unknown
Part of a nested/multi‐completion well 240 5‐22.15‐Tracy northwest
~130 ft east and ~170 ft north of intersection between Brentwood Blvd & Lone Tree Way No
Contra Costa 200.00 210.00 220.00 230.00
#14 MW‐154 1N/3E‐06E 72.8 Top of Casing 71.76Digital Elevation Model Unknown Observation active 37.9620 121.6957 USGS quad Unknown
Part of a nested/multi‐completion well 154 5‐22.15‐Tracy northwest
~130 ft east and ~170 ft north of intersection between Brentwood Blvd & Lone Tree Way No
Contra Costa 114.00 144.00
1BMW‐140 1N/3E‐25C 4.376 Top of Casing 3.78 GPS with WAAS 0.1 ft. Observation active 37.9103 121.5994 Surveyed 30 ft.
Part of a nested/multi‐completion well 140 5‐22.15‐Tracy northwest
~400 ft east and ~300 ft south of intersection between Laguna Ct & Discovery Bay Blvd No
Contra Costa 100.00 130.00
1BMW‐343 1N/3E‐25C 4.376 Top of Casing 3.78 GPS with WAAS 0.1 ft. Observation active 37.9103 121.5994 Surveyed 30 ft.
Part of a nested/multi‐completion well 343 5‐22.15‐Tracy northwest
~400 ft east and ~300 ft south of intersection between Laguna Ct & Discovery Bay Blvd No
Contra Costa 270.00 289.00 309.00 338.00
4AMW‐152 1N/3E‐26M 11.671 Top of Casing 12.14 GPS with WAAS 0.1 ft. Observation active 37.9010 121.6188 Surveyed 30 ft.
Part of a nested/multi‐completion well 152 5‐22.15‐Tracy northwest
~190 ft west and ~20 south of intersection between Newport Dr & Bolinas Pl No
Contra Costa 122.00 142.00
4AMW‐357 1N/3E‐26M 11.537 Top of Casing 12.04 GPS with WAAS 0.1 ft. Observation active 37.9010 121.6188 Surveyed 30 ft.
Part of a nested/multi‐completion well 357 5‐22.15‐Tracy northwest
~190 ft west and ~20 south of intersection between Newport Dr & Bolinas Pl No
Contra Costa 307.00 347.00
6MW‐140 1N/3E‐25L 6.602 Top of Casing 6.83 Other 2.5 ft Observation active 37.9028 121.5995 Other 30 ft.
Part of a nested/multi‐completion well 140 5‐22.15‐Tracy northwest
~790 ft east and ~580 ft north of intersection between Discovery Bay Blvd & Willow Lake Rd No
Contra Costa 120.00 130.00
6MW‐220 1N/3E‐25L 6.602 Top of Casing 6.83 GPS with WAAS 0.1 ft. Observation active 37.9028 121.5995 Surveyed 30 ft.
Part of a nested/multi‐completion well 220 5‐22.15‐Tracy northwest
~790 ft east and ~580 ft north of intersection between Discovery Bay Blvd & Willow Lake Rd No
Contra Costa 200.00 210.00
6MW‐300 1N/3E‐25L 6.597 Top of Casing 6.83 GPS with WAAS 0.1 ft. Observation active 37.9028 121.5995 Surveyed 30 ft.
Part of a nested/multi‐completion well 300 5‐22.15‐Tracy northwest
~790 ft east and ~580 ft north of intersection between Discovery Bay Blvd & Willow Lake Rd No
Contra Costa 260.00 270.00 280.00 290.00
6MW‐350 1N/3E‐25L 6.535 Top of Casing 6.83 GPS with WAAS 0.1 ft. Observation active 37.9028 121.5995 Surveyed 30 ft.
Part of a nested/multi‐completion well 350 5‐22.15‐Tracy northwest
~790 ft east and ~580 ft north of intersection between Discovery Bay Blvd & Willow Lake Rd No
Contra Costa 330.00 340.00
Creekside‐CSMW 2N/3E‐31C 34.51 Black Mark on TOC 32.11 GPS with WAAS 0.1 ft. Observation active 37.9799 121.6911 Surveyed 30 ft. Single Well 380 5‐22.15‐Tracy northwest
~80 ft east and ~70 ft north of intersection between Honey Ln & Creekside Way No
Contra Costa 230.00 240.00
Glen Park‐GPMW 2N/3E‐31L 35.536 Black Mark on TOC 33.68 GPS with WAAS 0.1 ft. Observation active 37.9741 121.6867 Surveyed 30 ft. Single Well 300 5‐22.15‐Tracy northwest
~80 ft south and ~220 ft east of intersection between Diane Ct & Hill Ave No
Contra Costa 220.00 230.00 260.00 290.00
1 of 2
Appendix ADiablo Water District 2011 CASGEM Network Well Information
Local Well Designation
State Well Number RP Elevation RP Description GS Elevation
Measurement Method
Measurement Accuracy Well Use
Well Status Latitude [N] Longitude [W]
Coordinates Method
Coordinates Accuracy
Well Completion Type
Total Well Depth
Well Completion Report # Associated Basin
Associated Basin Portion Well Location Desc
Additional Comments Is Voluntary Well County
Screen Interval 1 Top
Screen Interval 1 Bottom
Screen Interval 2 Top
Screen Interval 2 Bottom
Stonecreek‐SCMW‐160 2N/3E‐31G 31.656 Black Mark on TOC 29.98 GPS with WAAS 0.1 ft. Observation active 37.9781 121.6840 Surveyed 30 ft.
Part of a nested/multi‐completion well 160 5‐22.15‐Tracy northwest
~1,000 ft south and ~600 ft east of intersection between Tuolumne Way & Teton Rd No
Contra Costa 100.00 110.00 140.00 150.00
Stonecreek‐SCMW‐300 2N/3E‐31G 31.572 Black Mark on TOC 29.98 GPS with WAAS 0.1 ft. Observation active 37.9781 121.6840 Surveyed 30 ft.
Part of a nested/multi‐completion well 300 5‐22.15‐Tracy northwest
~1,000 ft south and ~600 ft east of intersection between Tuolumne Way & Teton Rd No
Contra Costa 230.00 240.00 280.00 290.00
Stonecreek‐SCMW‐360 2N/3E‐31G 31.597 Black Mark on TOC 29.98 GPS with WAAS 0.1 ft. Observation active 37.9781 121.6840 Surveyed 30 ft.
Part of a nested/multi‐completion well 360 5‐22.15‐Tracy northwest
~1,000 ft south and ~600 ft east of intersection between Tuolumne Way & Teton Rd No
Contra Costa 340.00 350.00
MW 5‐22 2N/3E‐33M 17.2 Top of Casing 17.19 Unknown Unknown Observation active 37.9741 121.6579 USGS quad Unknown Single Well 20 5‐22.15‐Tracy northwest
~470 ft east and ~700 ft north of intersection between Blaine Ln & Bartels Dr No
Contra Costa 0.00 20.00
MW 5‐33 2N/3E‐30J 13.3 Top of Casing 12.62 Unknown Unknown Observation active 37.9894 121.6794 USGS quad Unknown Single Well 20 5‐22.15‐Tracy northwest
~600 ft west and ~500 ft south of intersection between E Cypress Rd & Sellers Ave No
Contra Costa 0.00 20.00
MW 5‐35 2N/3E‐31H 24.3 Top of Casing 24.92 Unknown Unknown Observation active 37.9773 121.6785 USGS quad Unknown Single Well 20 5‐22.15‐Tracy northwest
~300 ft west and ~1,400 ft south of intersection between Sellers Ave & Wildhouse Rd No
Contra Costa 0.00 20.00
MW 5‐36 2N/3E‐32M 27.4 Top of Casing 29.95 Unknown Unknown Observation active 37.9737 121.6756 USGS quad Unknown Single Well 20 5‐22.15‐Tracy northwest
~600 ft east and ~1,760 ft north of intersection between Sellers Ave & Delta Rd No
Contra Costa 0.00 20.00
MW 5‐37 1N/3E‐06H 40.6 Top of Casing 44.28 Unknown Unknown Observation active 37.9635 121.6797 USGS quad Unknown Single Well 20 5‐22.15‐Tracy northwest
~600 ft west and ~1,940 ft south of intersection between Sellers Ave & Delta Rd No
Contra Costa 0.00 20.00
MW 5‐39 2N/3E‐29Q 12.5 Top of Casing 7.72 Unknown Unknown Observation active 37.9853 121.6641 USGS quad Unknown Single Well 20 5‐22.15‐Tracy northwest
~1,200 ft east and ~270 ft south of intersection between Knightsen Ave & Palmwood No
Contra Costa 0.00 20.00
Well #11 (4.61‐A) 1N/2E‐24J 55.0 Unknown 55.00 USGS quad 20 ft. Irrigation Inactive 37.9178 121.6700 USGS quad Unknown Single Well 5‐22.15‐Tracy northwest
~2,300 ft east and ~500 ft north of intersection between Church Rd & Sellers Ave No
Contra Costa
Well #4 Old (4.56) 1N/3E‐20L 87.0 Unknown 87.00 USGS quad 20 ft. Irrigation Inactive 37.9178 121.6973 USGS quad Unknown single Well 5‐22.15‐Tracy northwest
~200ft south and ~300 ft west of intersection between Walnut Blvd & Armstrong Rd No
Contra Costa
2 of 2
Appendix B Reference Point Photos on DWD
Network Monitoring Wells

JUNE 2012 CASGEM NETWORK PLAN
LUHDORFF & SCALMANINI, CONSULTING ENGINEERS Appendix B Pg 1
Picture 1 Creekside Monitoring Well Reference Point
JUNE 2012 CASGEM NETWORK PLAN
LUHDORFF & SCALMANINI, CONSULTING ENGINEERS Appendix B Pg 2
Picture 2 Glen Park Monitoring Well Reference Point
JUNE 2012 CASGEM NETWORK PLAN
LUHDORFF & SCALMANINI, CONSULTING ENGINEERS Appendix B Pg 3
Picture 3 Stone Creek Monitoring Well Cluster

JUNE 2012 CASGEM NETWORK PLAN
LUHDORFF & SCALMANINI, CONSULTING ENGINEERS Appendix B Pg 4
Picture 4 Stonecreek Monitoring Well SCMW‐160 Reference Point
JUNE 2012 CASGEM NETWORK PLAN
LUHDORFF & SCALMANINI, CONSULTING ENGINEERS Appendix B Pg 5
Picture 5 Stonecreek Monitoring Well SCMW‐300 Reference Point

JUNE 2012 CASGEM NETWORK PLAN
LUHDORFF & SCALMANINI, CONSULTING ENGINEERS Appendix B Pg 6
Picture 6 Stonecreek Monitoring Well SCMW‐360 Reference Point
Appendix C Example Field Sheet for
Groundwater Level Measurements
JUNE 2012 CASGEM NETWORK PLAN
LUHDORFF & SCALMANINI, CONSULTING ENGINEERS Appendix C Pg 1
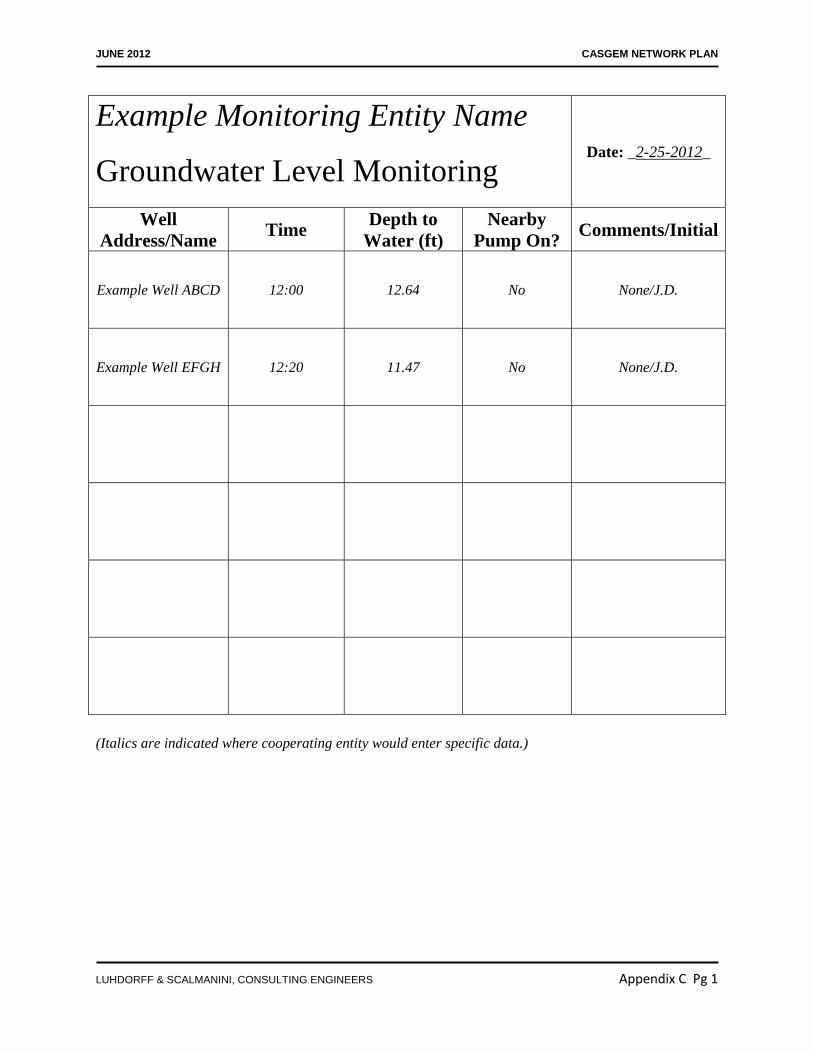
Example Monitoring Entity Name
Groundwater Level Monitoring Date: _2-25-2012_
Well Address/Name Time Depth to
Water (ft) Nearby
Pump On? Comments/Initial
Example Well ABCD 12:00 12.64 No None/J.D.
Example Well EFGH 12:20 11.47 No None/J.D.
(Italics are indicated where cooperating entity would enter specific data.)


![IELTS [Diablo]](https://img.pdfslide.us/doc/110x75/5536222c5503462c748b4913/ielts-diablo.jpg)