Embed Size (px)
Citation preview
Diabetes Management in Hospital
November 16, 2003Endocrine Fellows Conference
Paul C. Davidson, MD, FACEAtlanta Diabetes Associates
Atlanta, Georgia
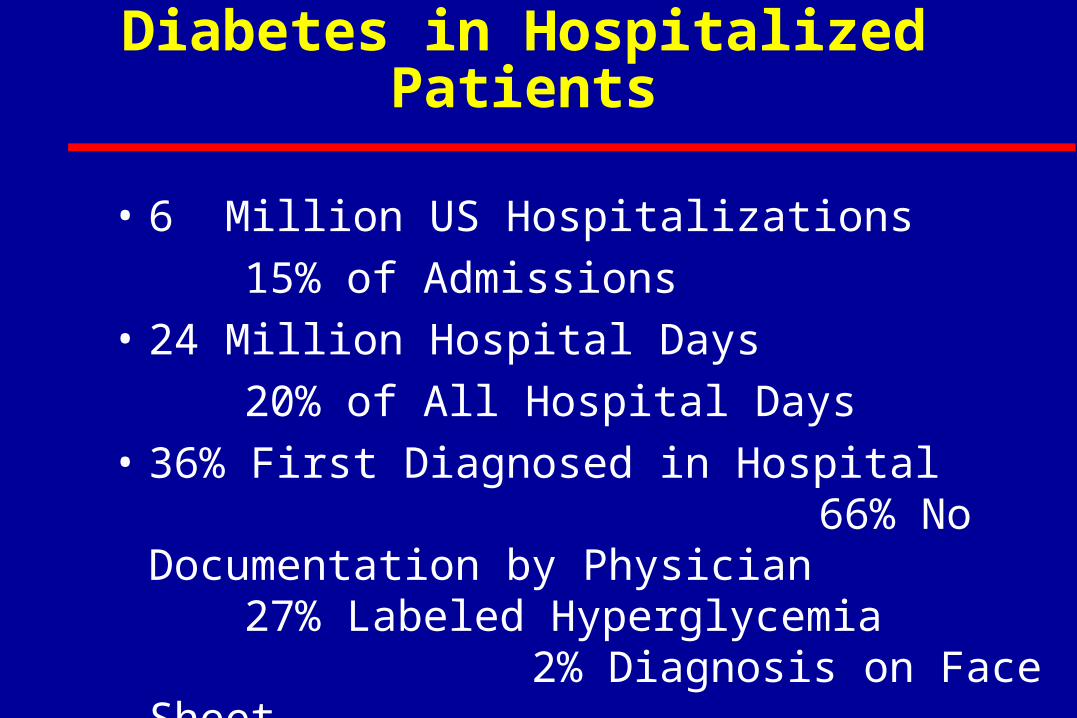
Diabetes in Hospitalized Patients
• 6 Million US Hospitalizations
15% of Admissions
• 24 Million Hospital Days
20% of All Hospital Days
• 36% First Diagnosed in Hospital 66% No Documentation by Physician
27% Labeled Hyperglycemia 2% Diagnosis on Face Sheet
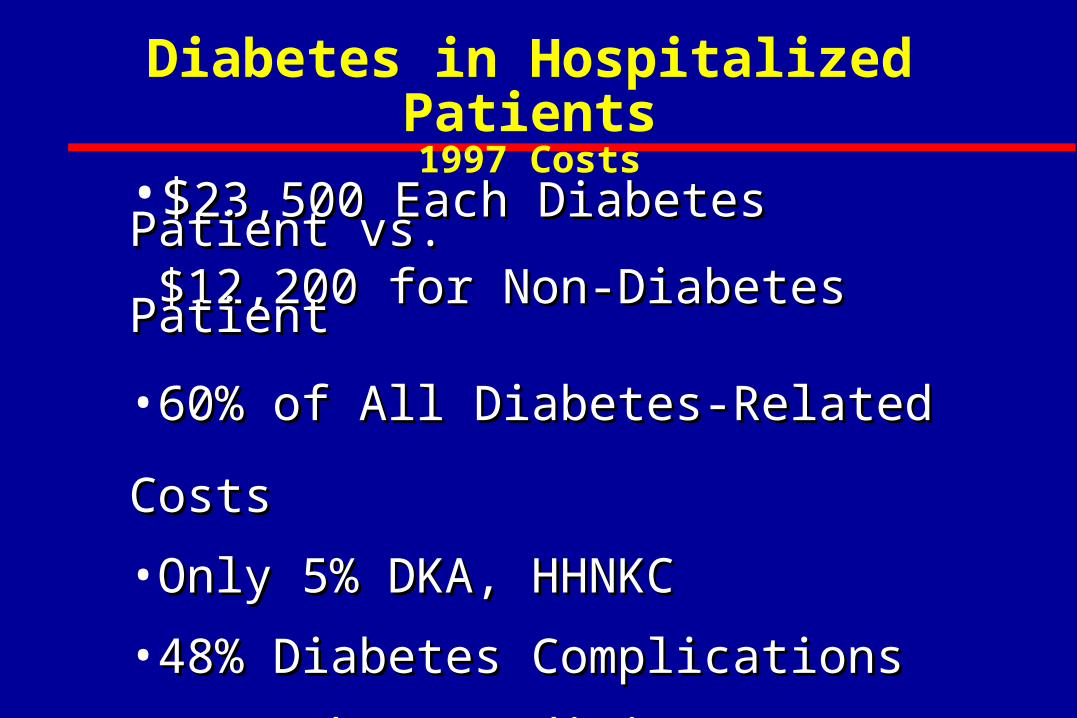
Diabetes in Hospitalized Patients1997 Costs
•$$23,500 Each Diabetes Patient vs.23,500 Each Diabetes Patient vs. $12,200 for Non-Diabetes Patient$12,200 for Non-Diabetes Patient
•60% of All Diabetes-Related Costs60% of All Diabetes-Related Costs
•Only 5% DKA, HHNKCOnly 5% DKA, HHNKC
•48% Diabetes Complications48% Diabetes Complications
•52% Other Conditions52% Other Conditions
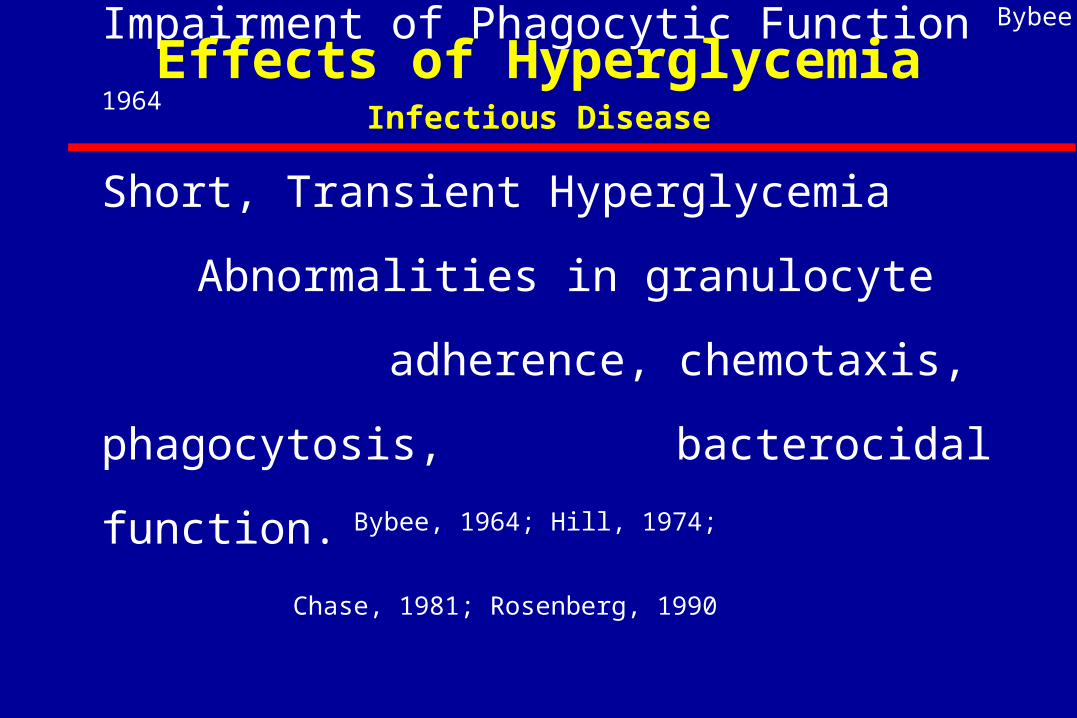
Impairment of Phagocytic Function Bybee, 1964
Short, Transient Hyperglycemia
Abnormalities in granulocyte
adherence, chemotaxis, phagocytosis,
bacterocidal function. Bybee, 1964; Hill, 1974;
Chase, 1981; Rosenberg, 1990
Effects of HyperglycemiaInfectious Disease
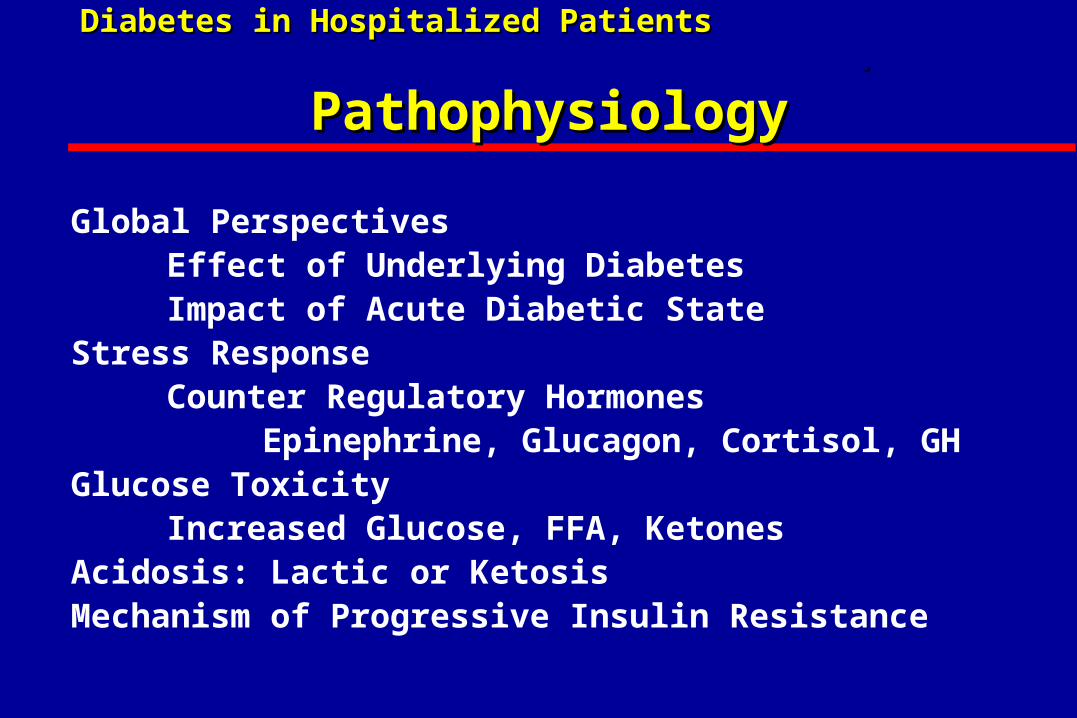
Global PerspectivesEffect of Underlying DiabetesImpact of Acute Diabetic State
Stress ResponseCounter Regulatory Hormones
Epinephrine, Glucagon, Cortisol, GHGlucose Toxicity
Increased Glucose, FFA, KetonesAcidosis: Lactic or KetosisMechanism of Progressive Insulin Resistance
Diabetes in Hospitalized Patients Diabetes in Hospitalized Patients ..
PathophysiologyPathophysiology
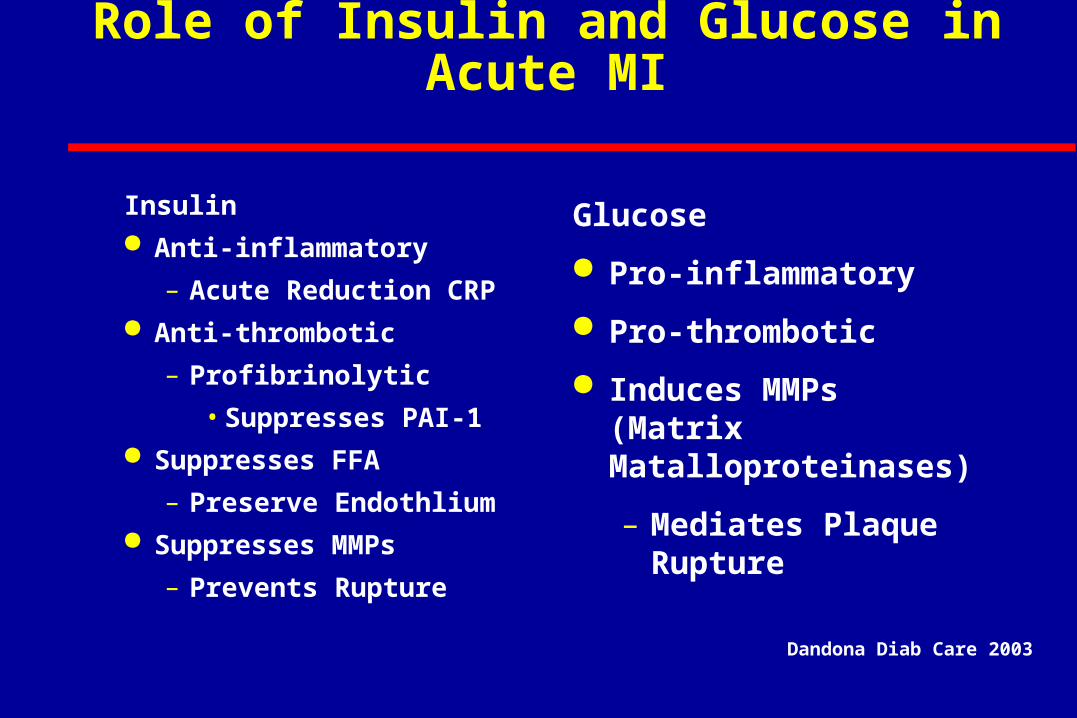
Role of Insulin and Glucose in Acute MI
Insulin Anti-inflammatory
– Acute Reduction CRP Anti-thrombotic
– Profibrinolytic
• Suppresses PAI-1 Suppresses FFA
– Preserve Endothlium Suppresses MMPs
– Prevents Rupture
Glucose
Pro-inflammatory
Pro-thrombotic
Induces MMPs (Matrix Matalloproteinases)
– Mediates Plaque Rupture
Dandona Diab Care 2003
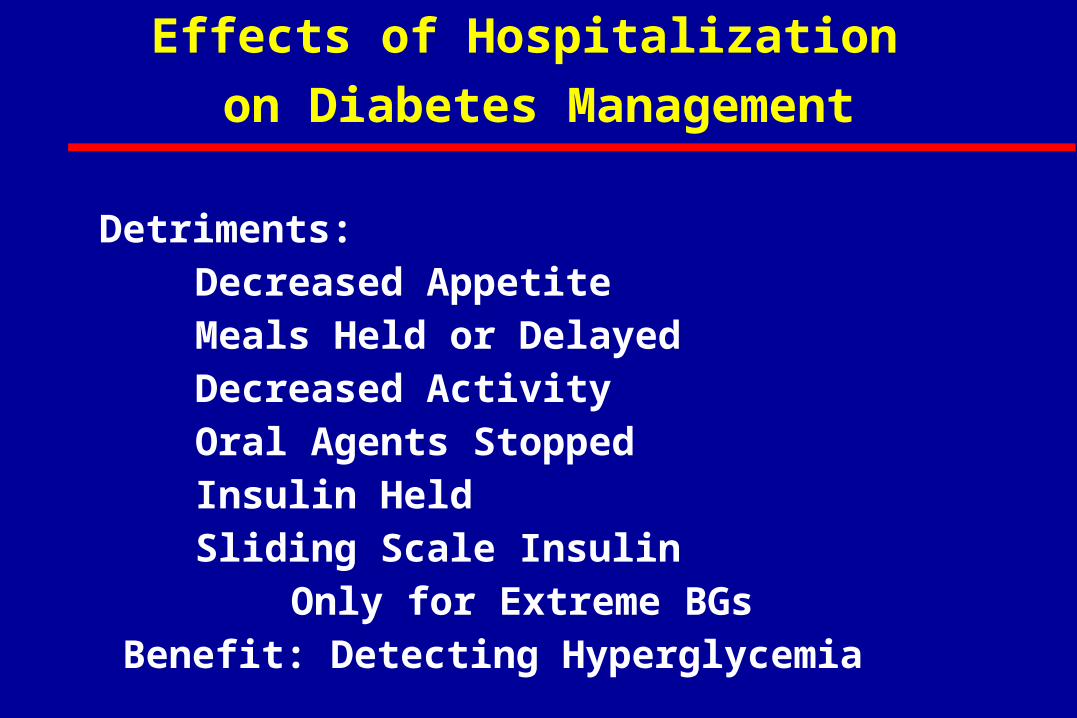
Detriments:Decreased AppetiteMeals Held or DelayedDecreased ActivityOral Agents StoppedInsulin HeldSliding Scale Insulin
Only for Extreme BGs Benefit: Detecting Hyperglycemia
Effects of Hospitalization
on Diabetes Management
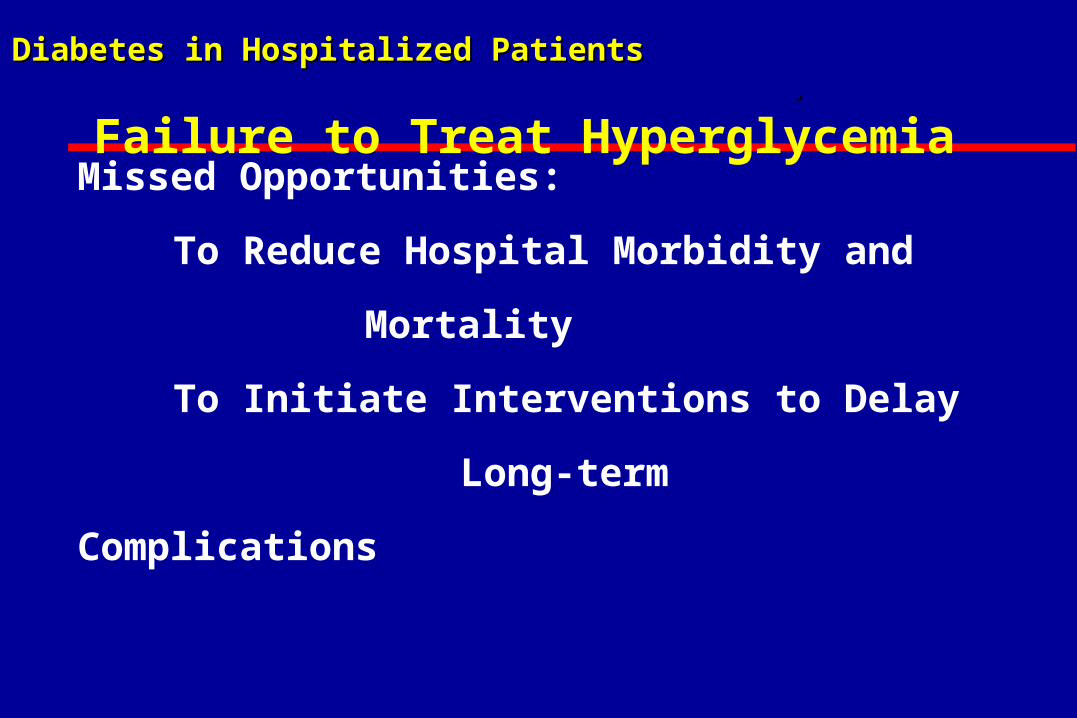
Missed Opportunities:
To Reduce Hospital Morbidity and
Mortality
To Initiate Interventions to Delay
Long-term Complications
Diabetes in Hospitalized Patients Diabetes in Hospitalized Patients ..
Failure to Treat Hyperglycemia
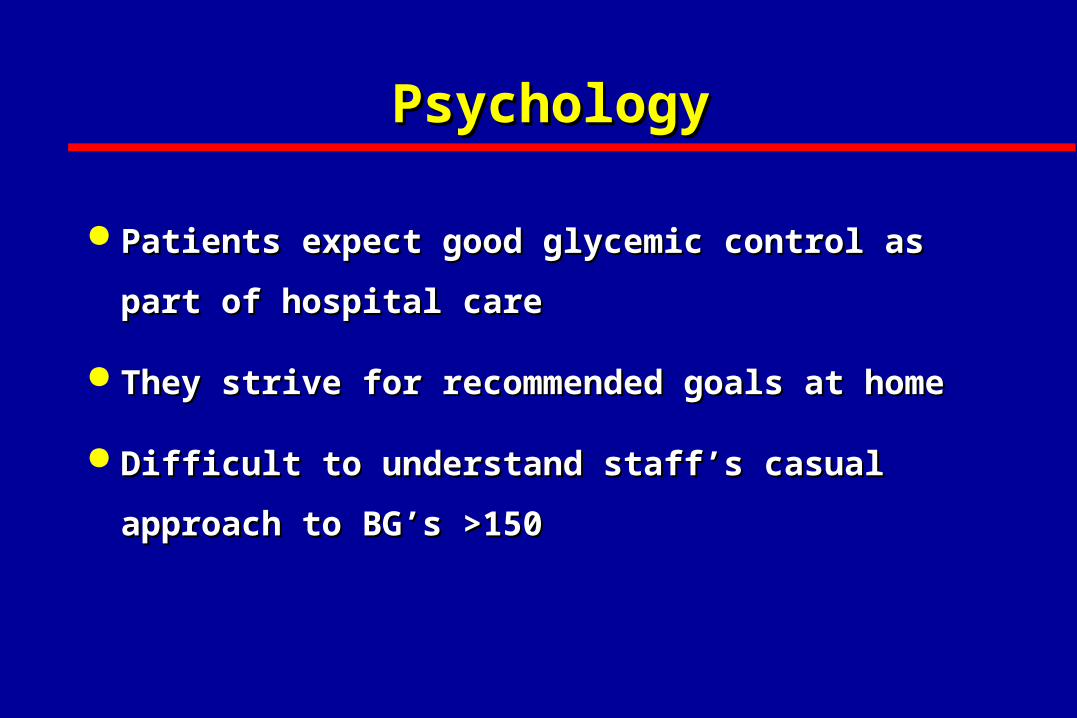
Diabetes in Hospitalized Diabetes in Hospitalized
Patients .Patients . Psychology Psychology
Patients expect good glycemic control as part of Patients expect good glycemic control as part of
hospital carehospital care
They strive for recommended goals at homeThey strive for recommended goals at home
Difficult to understand staff’s casual approach to Difficult to understand staff’s casual approach to
BG’s >150BG’s >150
Diabetes in Hospitalized Diabetes in Hospitalized Patients . Patients .
Clinical RisksClinical Risks
• High-risk for Bacterial Infection– Surgery– Catheters– Intravenous Access– Anesthesia
• Problems with wound healing
• Problems with tissue and organ perfusion
Infections in Diabetes
One BG >220 mg/dl results in 5.8 times increase in nosocomial infection rate
Two hours hyperglycemia results in impaired WBC function for weeks
Pomposelli, New England Deaconess, J Parenteral and Enteral Nutrition 22:77-81,1998
Side Effects of BG >200 mg/dl Side Effects of BG >200 mg/dl
Reduced Intravascular VolumeReduced Intravascular Volume
DehydrationDehydration
Electrolyte FluxesElectrolyte Fluxes
Impaired WBC FunctionImpaired WBC Function
Immunoglobulin InactivationImmunoglobulin Inactivation
Complement DisablingComplement Disabling
Increased Collagenase, Decreased Wound Increased Collagenase, Decreased Wound CollagenCollagen
Evidence for Immediate Benefit of Evidence for Immediate Benefit of Normoglycemia in Hospitalized PatientsNormoglycemia in Hospitalized Patients
Numerous Publications on in Vitro EvidenceNumerous Publications on in Vitro Evidence
– Neutrophil DysfunctionNeutrophil Dysfunction
– Complement InhibitionComplement Inhibition
– Altered Redox State (Pseudohypoxia)Altered Redox State (Pseudohypoxia)
– Glucose Rich Edema as Culture MediaGlucose Rich Edema as Culture Media
Recent Outcome Studies Supporting Good Glucose Control in Hospital Recent Outcome Studies Supporting Good Glucose Control in Hospital SettingSetting
Reduction in CRPReduction in CRP
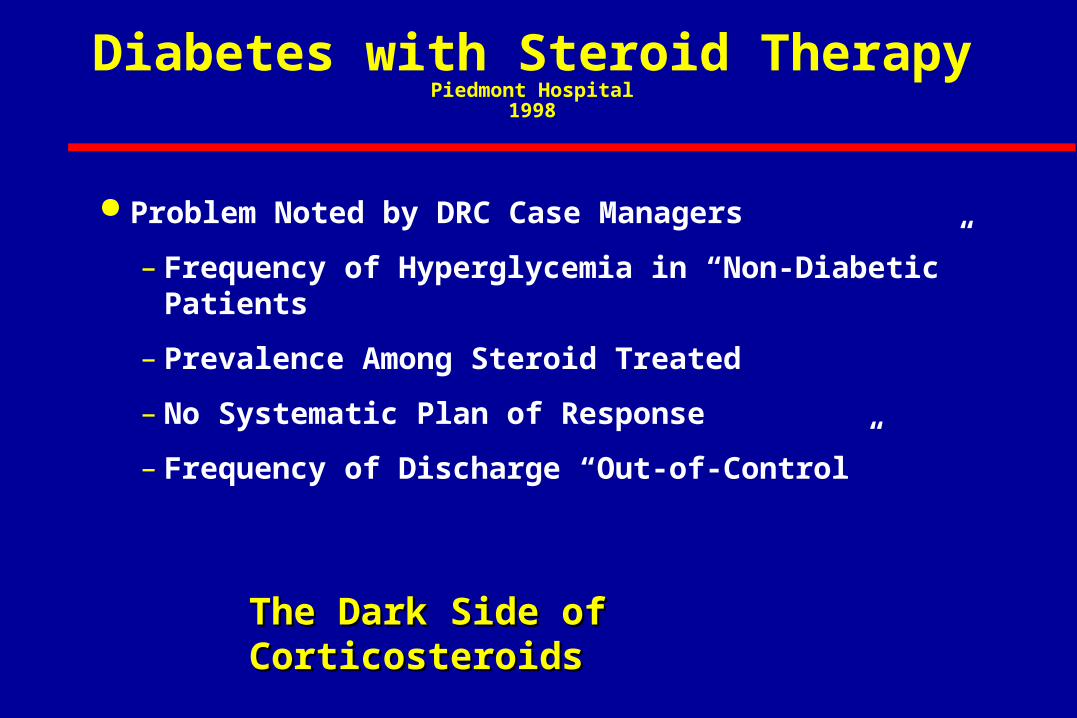
Diabetes with Steroid TherapyPiedmont Hospital
1998
Problem Noted by DRC Case Managers
– Frequency of Hyperglycemia in “Non-Diabetic” Patients
– Prevalence Among Steroid Treated
– No Systematic Plan of Response
– Frequency of Discharge “Out-of-Control”
The Dark Side of CorticosteroidsThe Dark Side of Corticosteroids
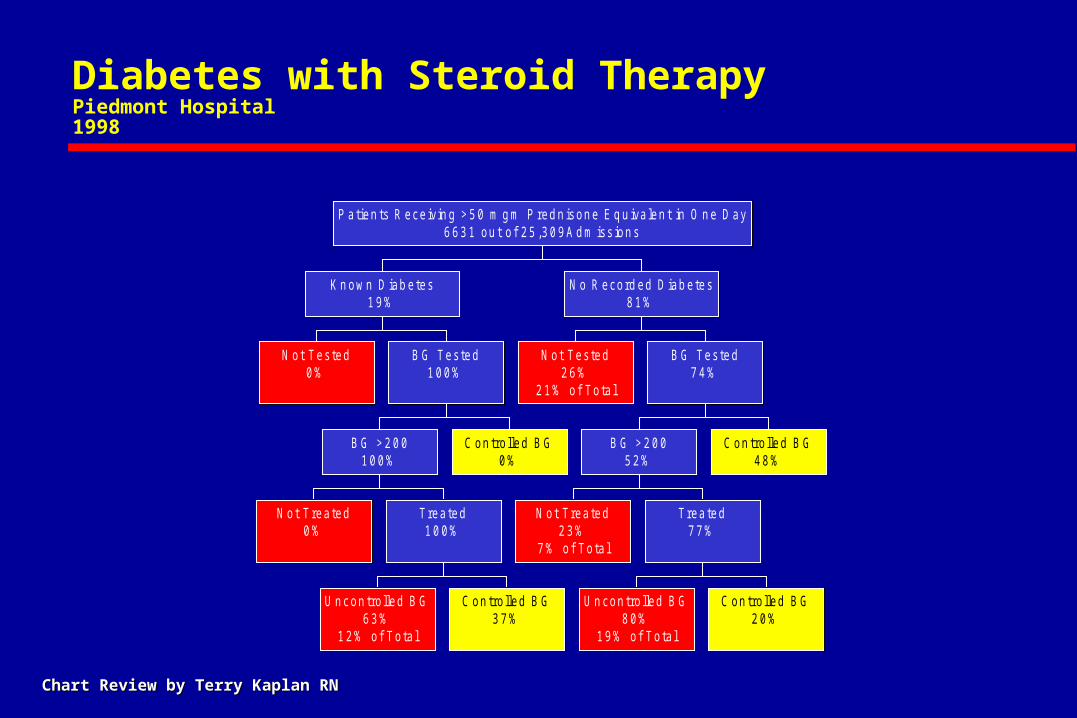
Diabetes with Steroid TherapyPiedmont Hospital1998
N ot Tes ted0 %
N ot Trea ted0 %
U n con tro lled B G6 3 %
1 2 % o f To ta l
C on tro lled B G3 7 %
Trea ted1 0 0 %
B G > 2 0 01 0 0 %
C on tro lled B G0 %
B G Tes ted1 0 0 %
K n ow n D iab e tes1 9 %
N ot Tes ted2 6 %
2 1 % o f To ta l
N o t Trea ted2 3 %
7 % o f To ta l
U n con tro lled B G8 0 %
1 9 % o f To ta l
C on tro lled B G2 0 %
Trea ted7 7 %
B G > 2 0 05 2 %
C on tro lled B G4 8 %
B G Tes ted7 4 %
N o R ecord ed D iab e tes8 1 %
P atien ts R ece ivin g > 5 0 m g m P red n ison e E q u iva len t in O n e D ay6 6 3 1 ou t o f 2 5 ,3 0 9 A d m iss ion s
Chart Review by Terry Kaplan RNChart Review by Terry Kaplan RN
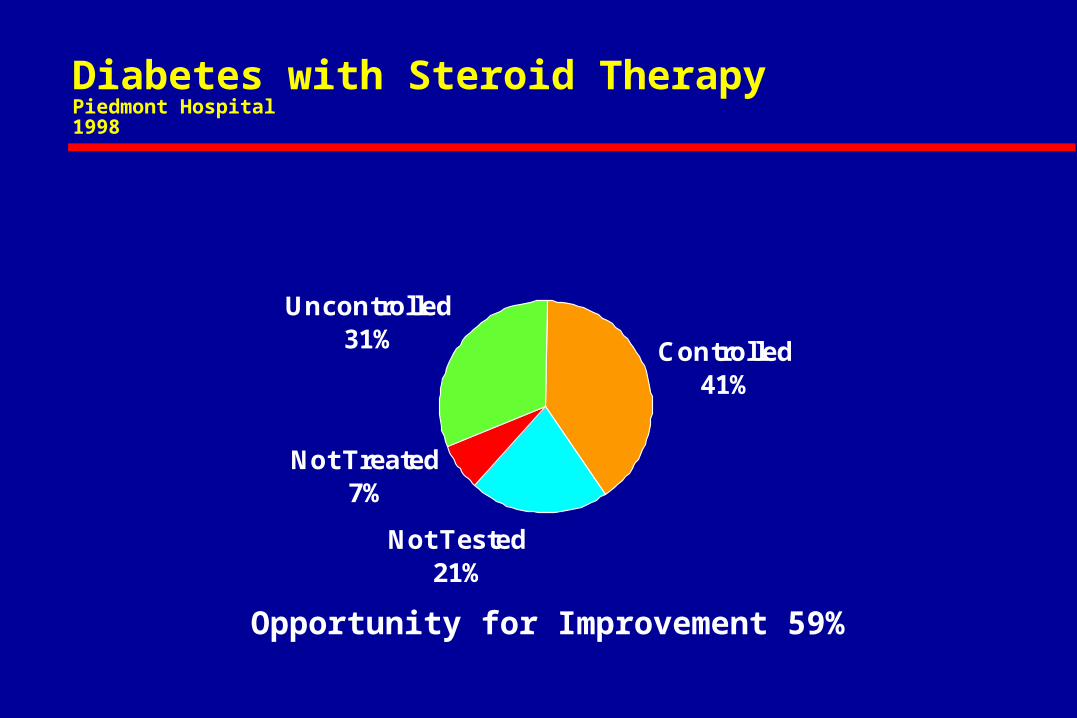
Diabetes with Steroid TherapyPiedmont Hospital1998
Controlled41%
Not Tested21%
Not Treated7%
Uncontrolled31%
Opportunity for Improvement 59%
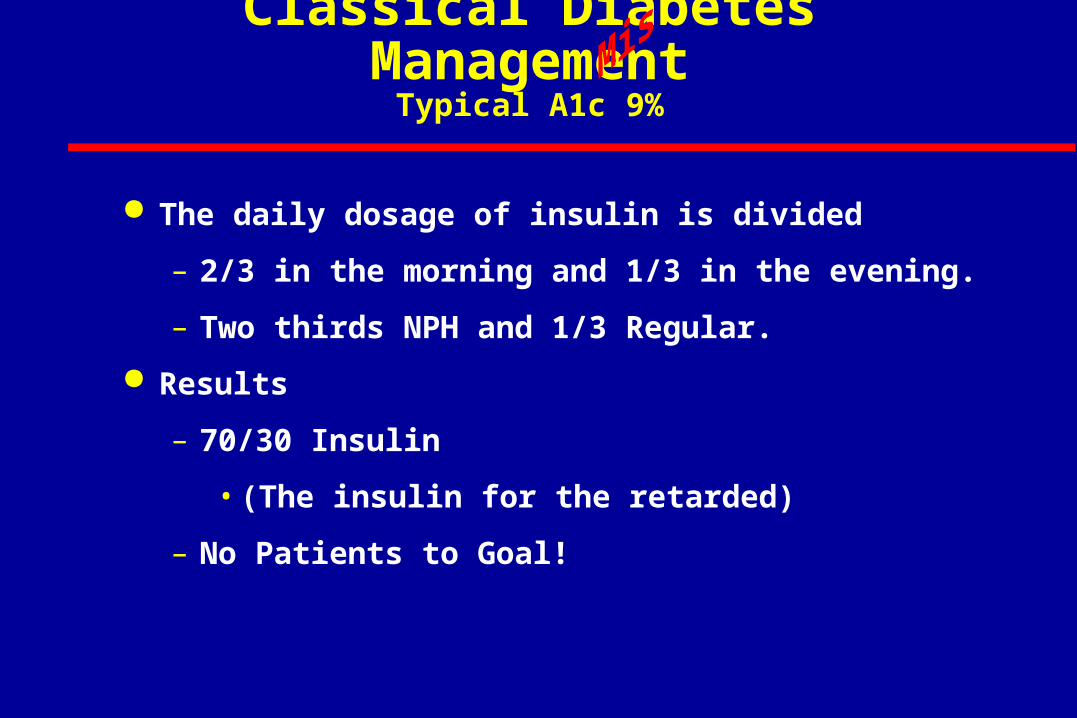
Classical Diabetes ManagementTypical A1c 9%
The daily dosage of insulin is divided
– 2/3 in the morning and 1/3 in the evening.
– Two thirds NPH and 1/3 Regular.
Results
– 70/30 Insulin
• (The insulin for the retarded)
– No Patients to Goal!
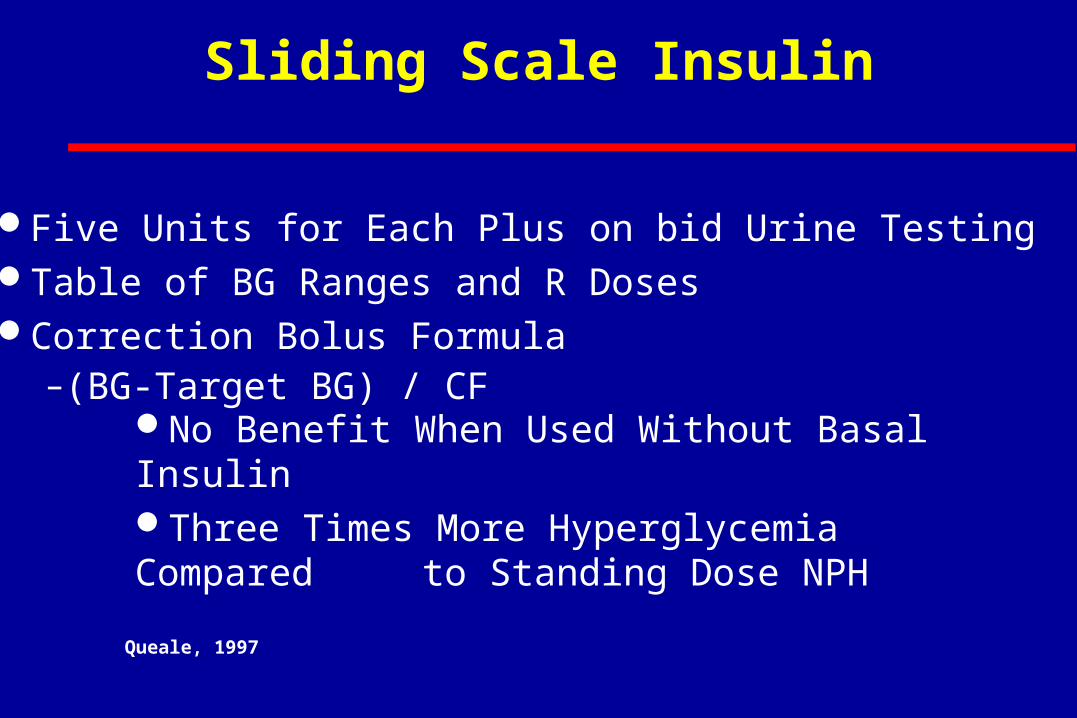
Sliding Scale Insulin
Five Units for Each Plus on bid Urine TestingTable of BG Ranges and R DosesCorrection Bolus Formula
–(BG-Target BG) / CF
No Benefit When Used Without Basal InsulinThree Times More Hyperglycemia Compared
to Standing Dose NPH
Queale, 1997
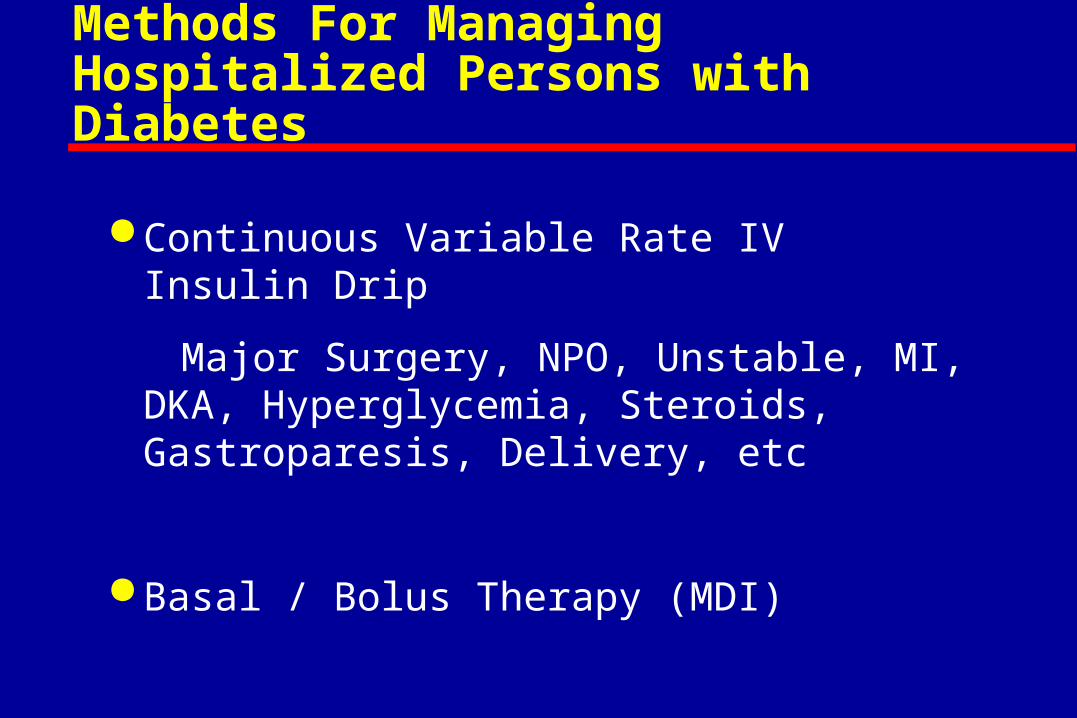
Methods For Managing Hospitalized Persons with Diabetes
Continuous Variable Rate IV Insulin Drip
Major Surgery, NPO, Unstable, MI, DKA, Hyperglycemia, Steroids, Gastroparesis, Delivery, etc
Basal / Bolus Therapy (MDI)
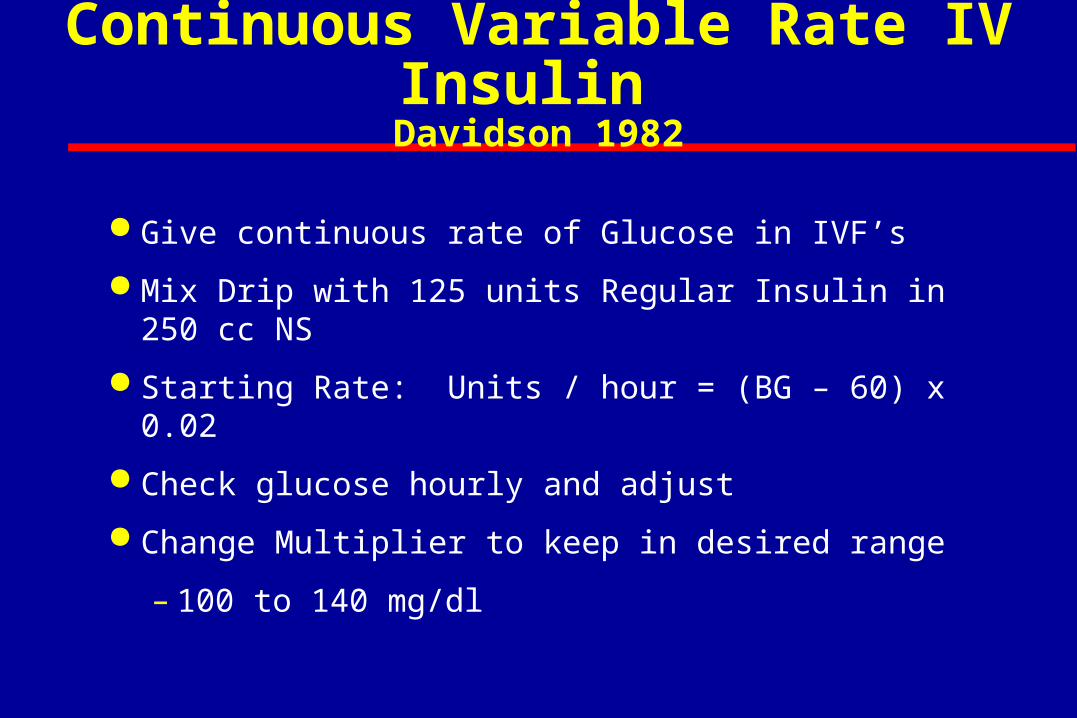
Continuous Variable Rate IV Insulin Davidson 1982
Give continuous rate of Glucose in IVF’s
Mix Drip with 125 units Regular Insulin in 250 cc NS
Starting Rate: Units / hour = (BG – 60) x 0.02
Check glucose hourly and adjust
Change Multiplier to keep in desired range
– 100 to 140 mg/dl
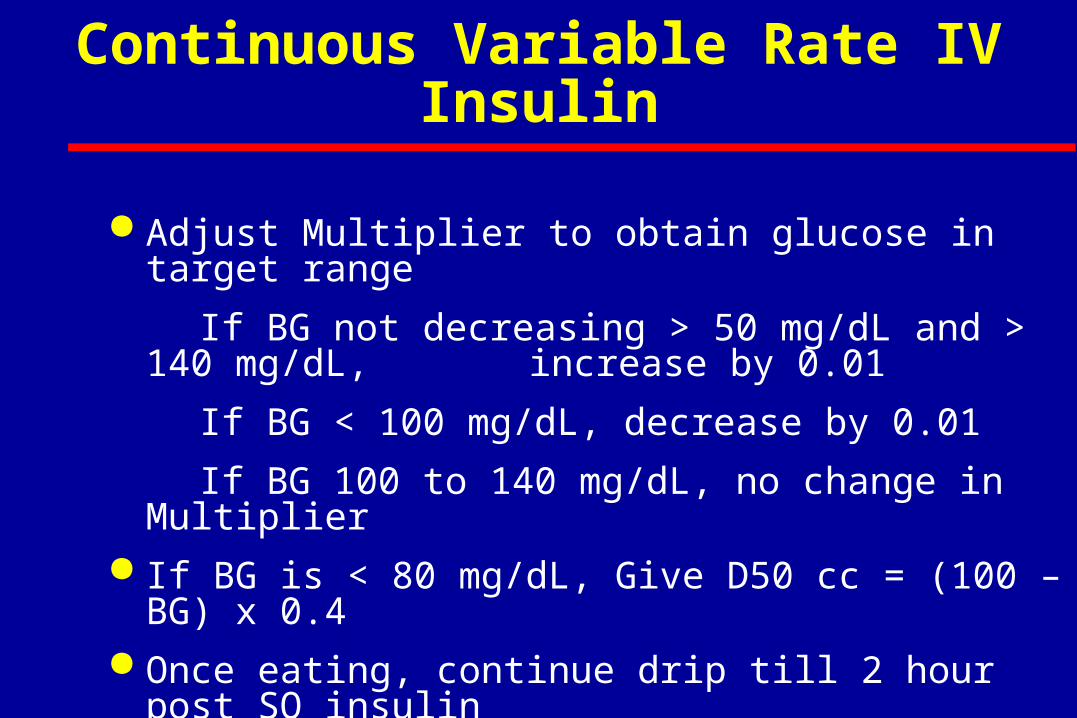
Continuous Variable Rate IV Insulin
Adjust Multiplier to obtain glucose in target range
If BG not decreasing > 50 mg/dL and > 140 mg/dL, increase by 0.01
If BG < 100 mg/dL, decrease by 0.01
If BG 100 to 140 mg/dL, no change in Multiplier If BG is < 80 mg/dL, Give D50 cc = (100 – BG) x 0.4 Once eating, continue drip till 2 hour post SQ insulin
Glucommander AN ADAPTIVE, COMPUTER-DIRECTED SYSTEM FOR IV INSULIN, SHOWN TO BE SAFE, SIMPLE, AND EFFECTIVE IN 120,618 HOURS OF OPERATION
Invented in 1984 Davidson and Steed
Based on 17 Year Experience with a Computer Based Algorithm for the Administration of IV Insulin
Developed for Marketing by MiniMed and Roche
GMS System
Shelved Pending FDA Approval of IV Use of Insulin
Useful and Safe for Any Application of IV Insulin
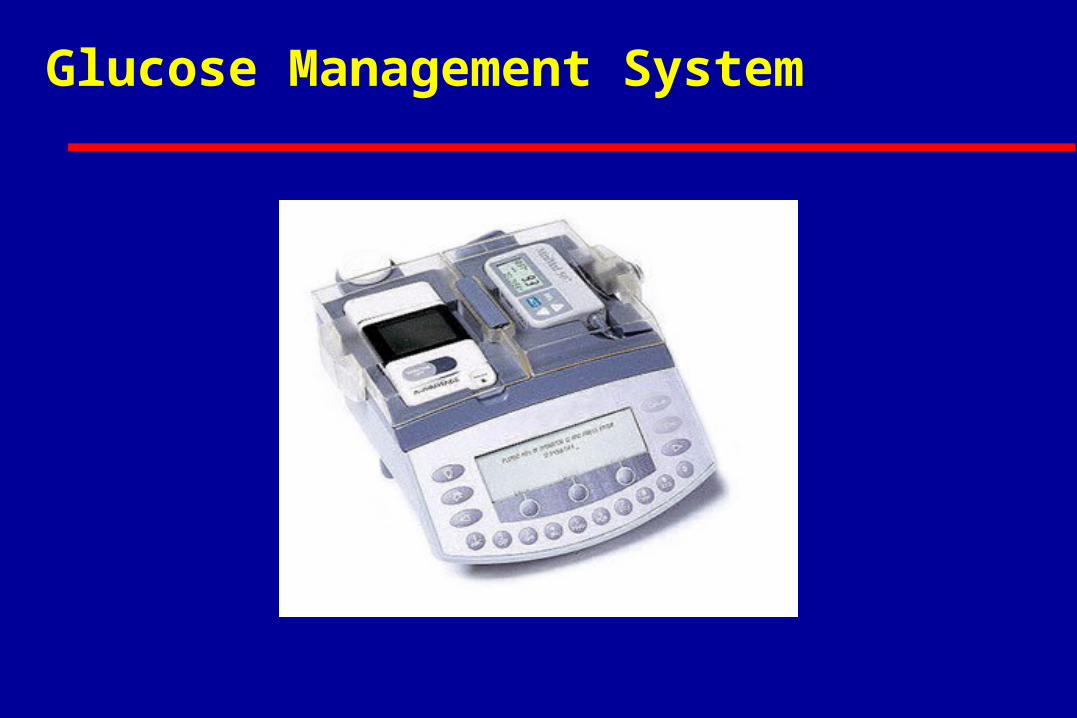
Glucose Management System
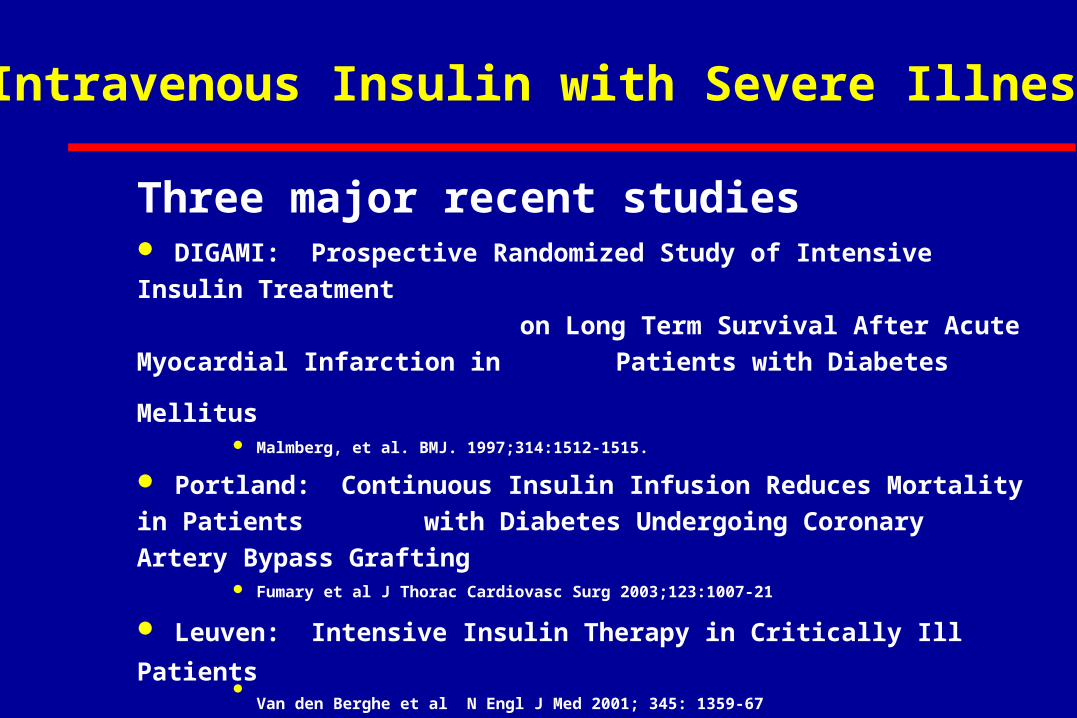
Intravenous Insulin with Severe Illness
Three major recent studies DIGAMI: Prospective Randomized Study of Intensive Insulin
Treatment on Long Term Survival
After Acute Myocardial Infarction in Patients with Diabetes
Mellitus Malmberg, et al. BMJ. 1997;314:1512-1515.
Portland: Continuous Insulin Infusion Reduces Mortality in Patients
with Diabetes Undergoing Coronary Artery Bypass Grafting Fumary et al J Thorac Cardiovasc Surg 2003;123:1007-21
Leuven: Intensive Insulin Therapy in Critically Ill Patients
Van den Berghe et al N Engl J Med 2001; 345: 1359-67
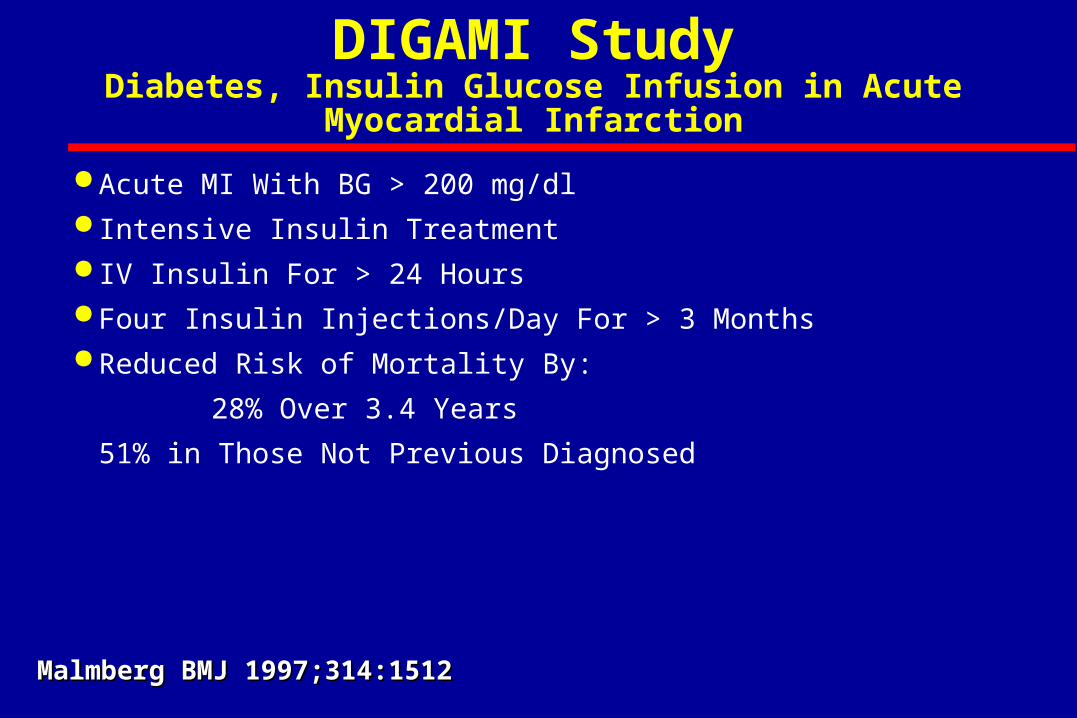
DIGAMI StudyDiabetes, Insulin Glucose Infusion in Acute Myocardial Infarction
Acute MI With BG > 200 mg/dl Intensive Insulin Treatment IV Insulin For > 24 Hours Four Insulin Injections/Day For > 3 Months Reduced Risk of Mortality By:
28% Over 3.4 Years
51% in Those Not Previous Diagnosed
Malmberg BMJ 1997;314:1512Malmberg BMJ 1997;314:1512
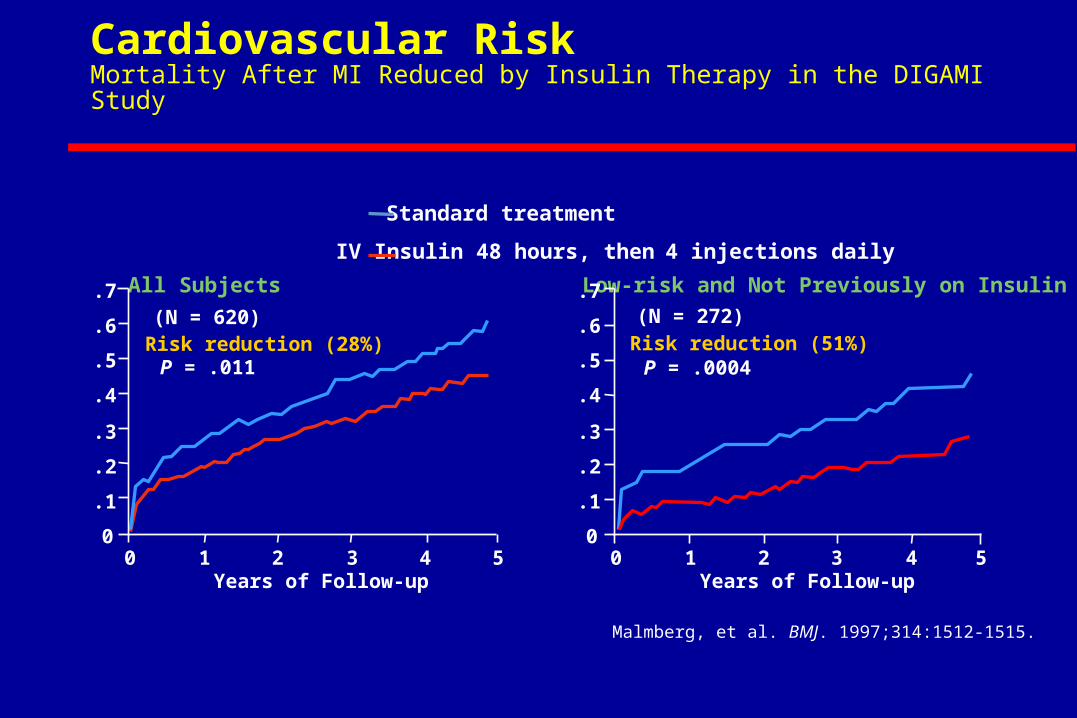
Cardiovascular RiskMortality After MI Reduced by Insulin Therapy in the DIGAMI Study
Malmberg, et al. BMJ. 1997;314:1512-1515.
All Subjects
(N = 620)Risk reduction (28%) P = .011
Standard treatment
0
.3
.2
.4
.7
.1
.5
.6
0 1Years of Follow-up
2 3 4 5
Low-risk and Not Previously on Insulin
(N = 272)Risk reduction (51%) P = .0004
IV Insulin 48 hours, then 4 injections daily
0
.3
.2
.4
.7
.1
.5
.6
0 1Years of Follow-up
2 3 4 5
6-11
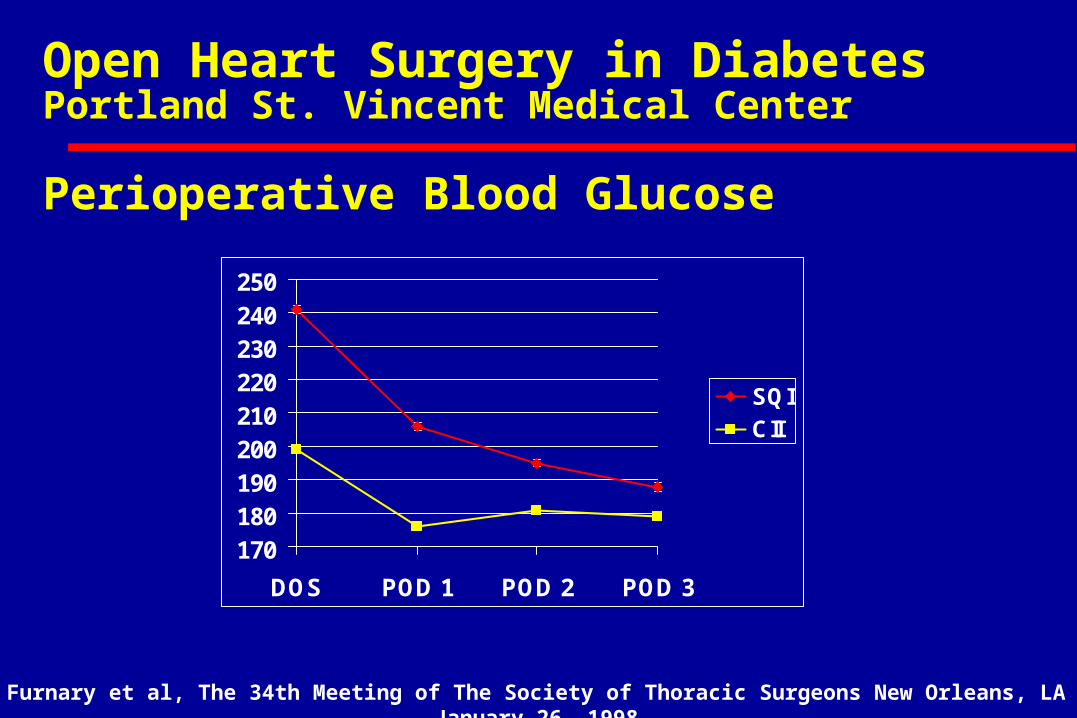
170180190200210220230240250
DOS POD 1 POD 2 POD 3
SQI
CII
Open Heart Surgery in DiabetesPortland St. Vincent Medical Center Perioperative Blood Glucose
Furnary et al, The 34th Meeting of The Society of Thoracic Surgeons New Orleans, LA January 26, 1998
0
2
4
6
8
10
12
14
16
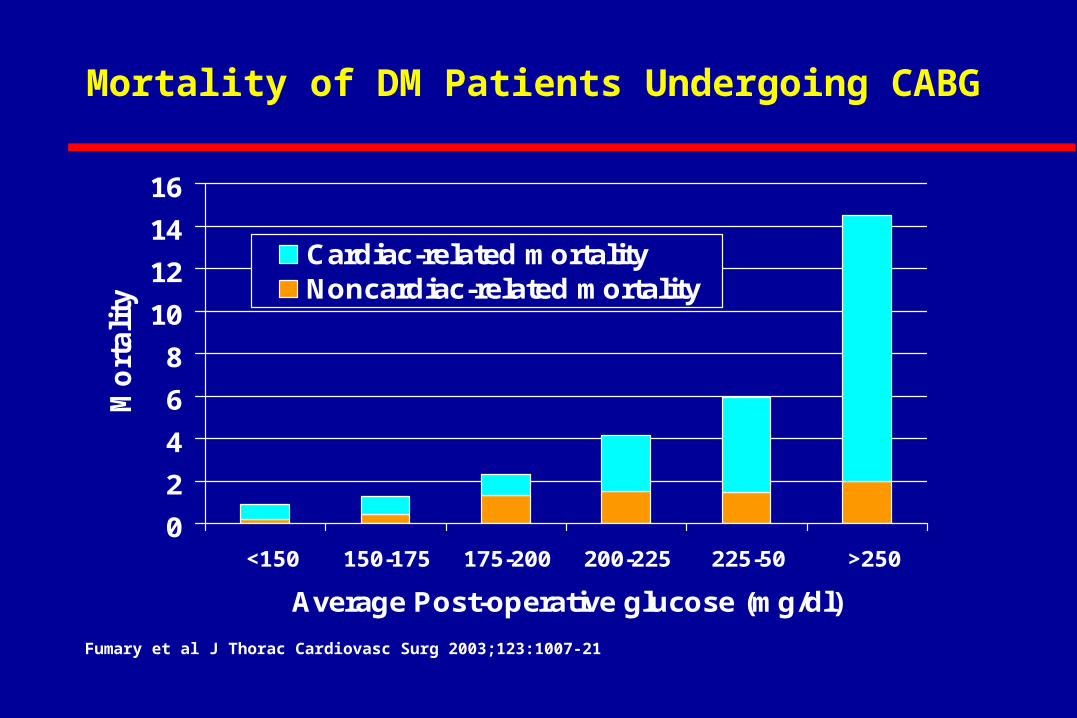
<150 150-175 175-200 200-225 225-50 >250
Average Post-operative glucose (mg/dl)
Mo
rtali
ty
Cardiac-related mortalityNoncardiac-related mortality
Mortality of DM Patients Undergoing CABG
Fumary et al J Thorac Cardiovasc Surg 2003;123:1007-21
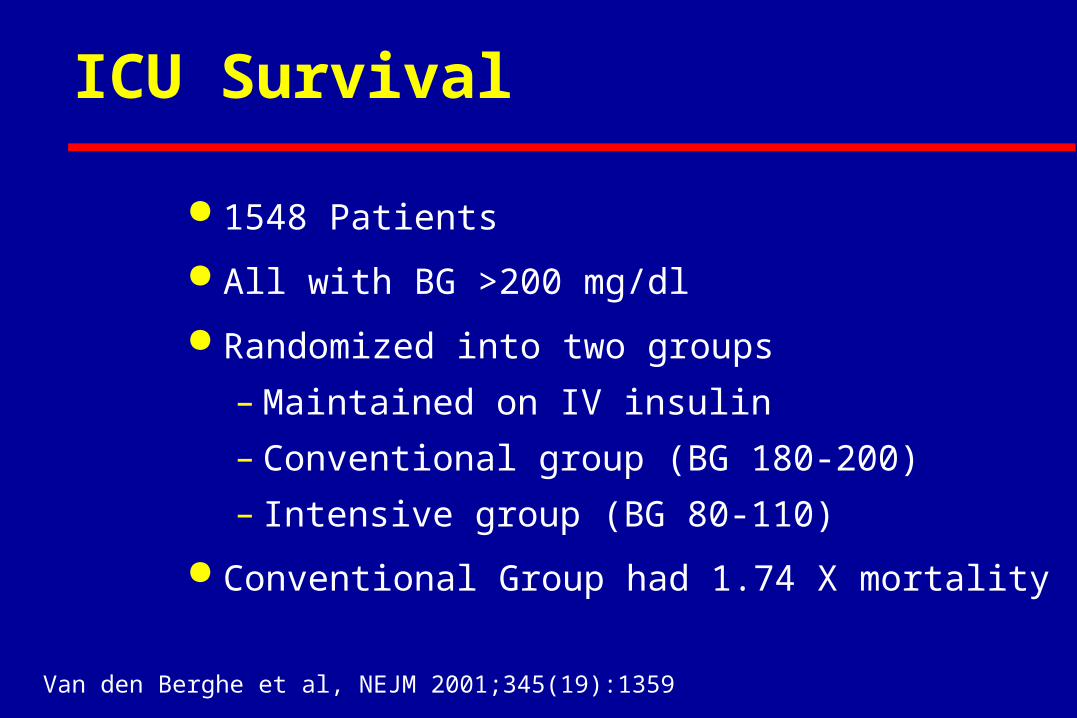
ICU Survival
1548 Patients
All with BG >200 mg/dl
Randomized into two groups
– Maintained on IV insulin
– Conventional group (BG 180-200)
– Intensive group (BG 80-110)
Conventional Group had 1.74 X mortality
Van den Berghe et al, NEJM 2001;345(19):1359
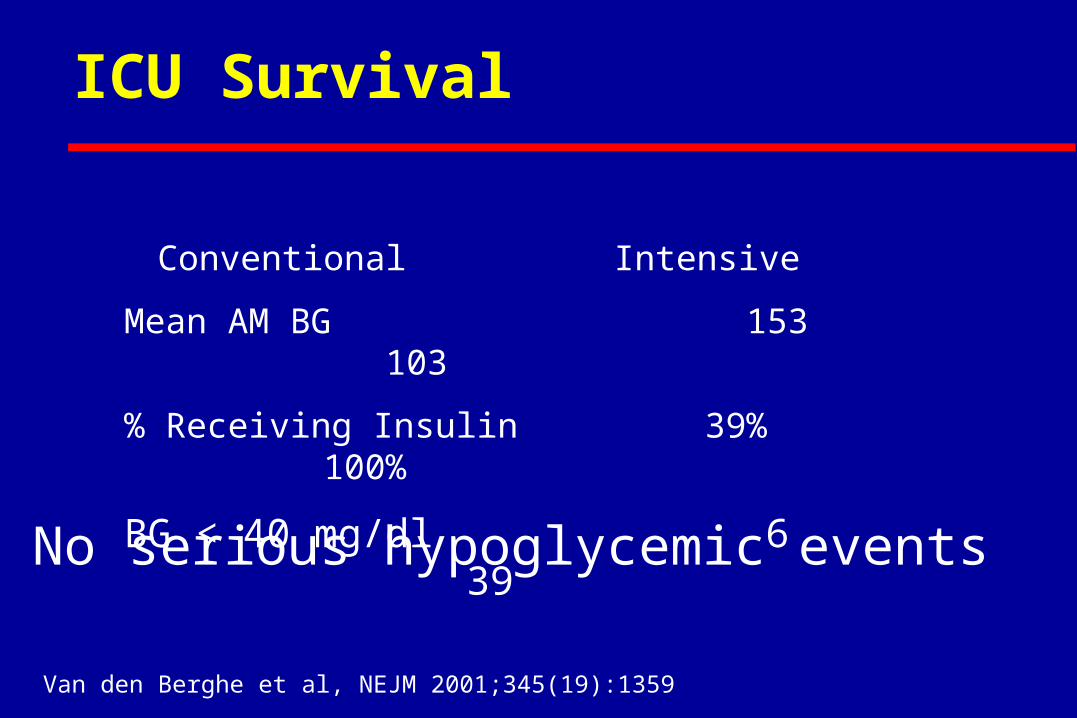
ICU Survival
Conventional Intensive
Mean AM BG 153 103
% Receiving Insulin 39% 100%
BG < 40 mg/dl 6 39
Van den Berghe et al, NEJM 2001;345(19):1359
No serious hypoglycemic events
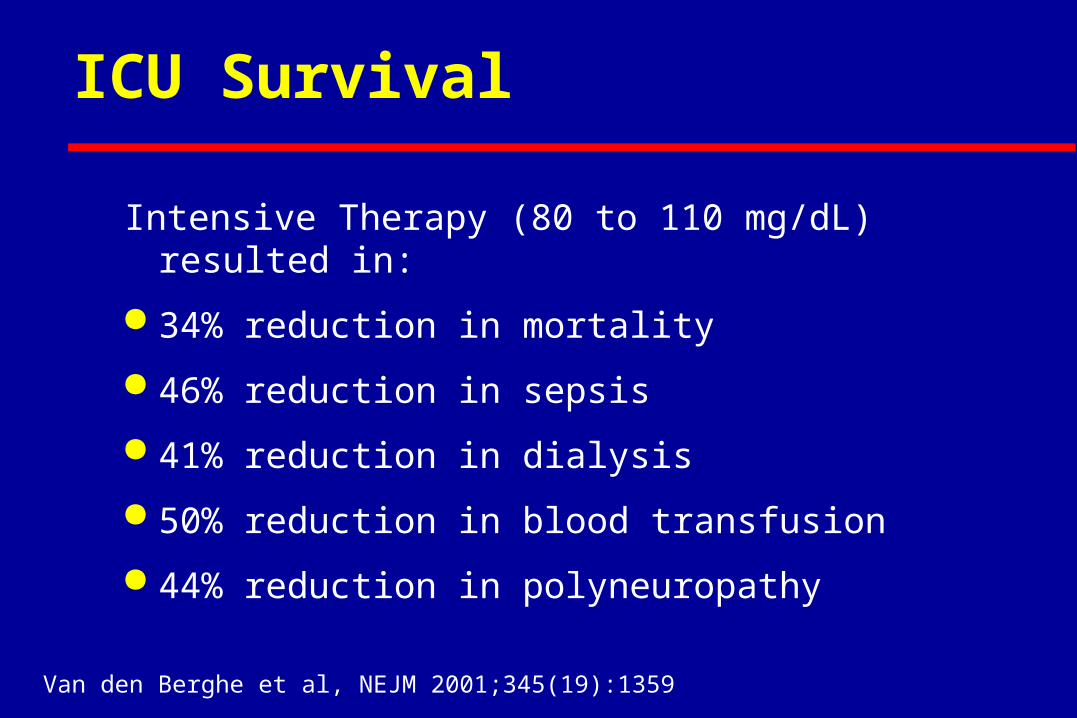
ICU Survival
Intensive Therapy (80 to 110 mg/dL) resulted in:
34% reduction in mortality
46% reduction in sepsis
41% reduction in dialysis
50% reduction in blood transfusion
44% reduction in polyneuropathy
Van den Berghe et al, NEJM 2001;345(19):1359
0
5
10
15
20
25
30
35
40
45
0 50 100 150 200 250
Days after inclusion
Cum
ulat
ive
% M
orta
lity
(in h
ospi
tal d
eath
)
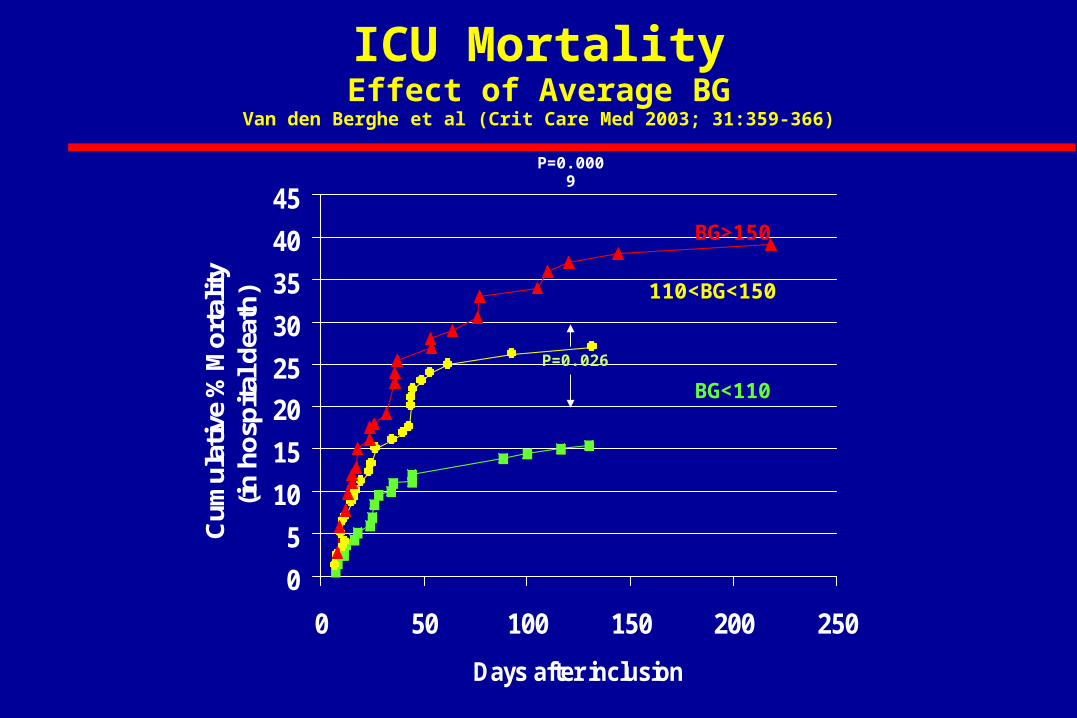
P=0.0009
P=0.026
BG<110
110<BG<150
BG>150
ICU MortalityEffect of Average BG
Van den Berghe et al (Crit Care Med 2003; 31:359-366)
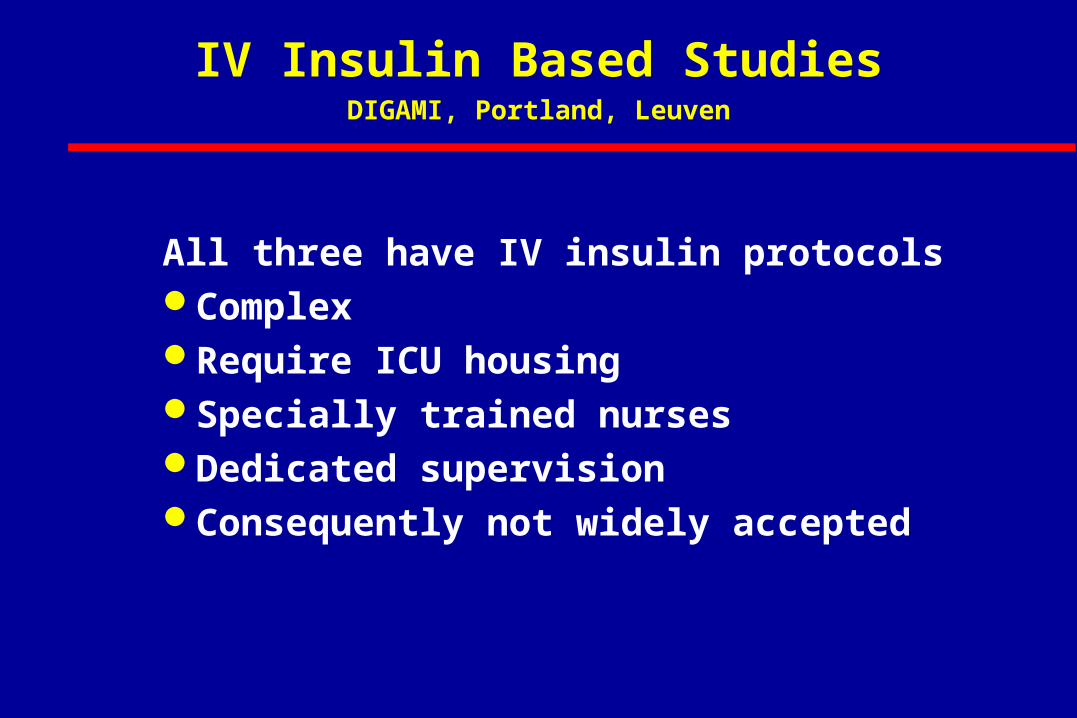
All three have IV insulin protocolsComplexRequire ICU housingSpecially trained nursesDedicated supervisionConsequently not widely accepted
IV Insulin Based StudiesDIGAMI, Portland, Leuven
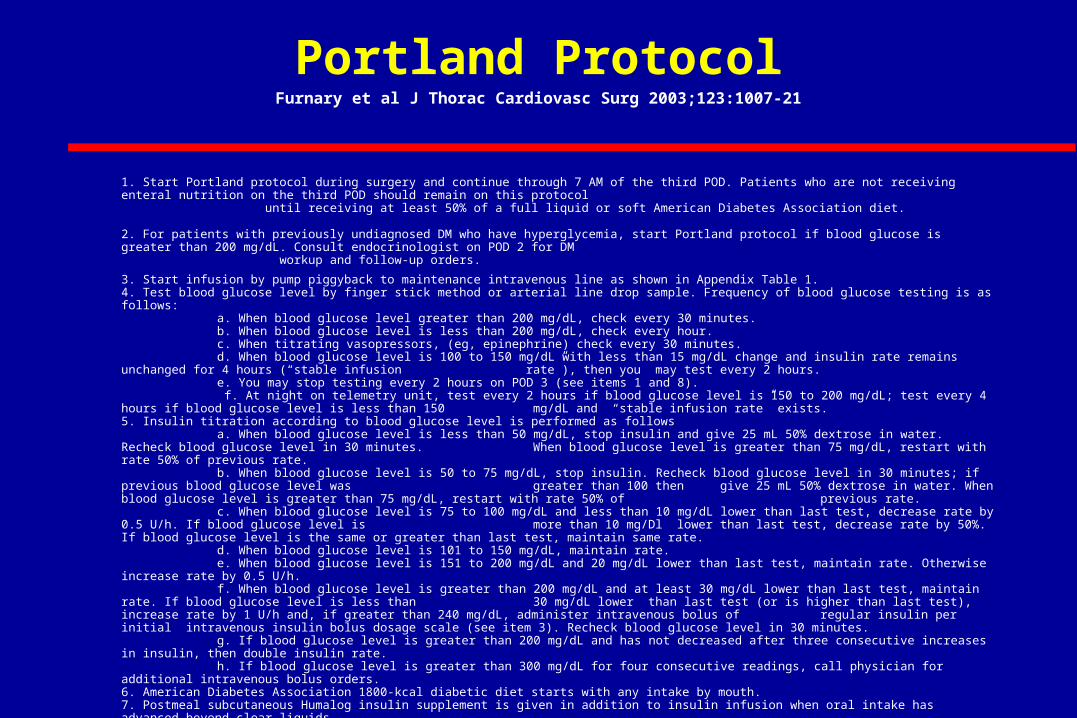
1. Start Portland protocol during surgery and continue through 7 AM of the third POD. Patients who are not receiving enteral nutrition on the third POD should remain on this protocol until receiving at least 50% of a full liquid or soft American Diabetes Association diet.
2. For patients with previously undiagnosed DM who have hyperglycemia, start Portland protocol if blood glucose is greater than 200 mg/dL. Consult endocrinologist on POD 2 for DM workup and follow-up orders.
3. Start infusion by pump piggyback to maintenance intravenous line as shown in Appendix Table 1. 4. Test blood glucose level by finger stick method or arterial line drop sample. Frequency of blood glucose testing is as follows:
a. When blood glucose level greater than 200 mg/dL, check every 30 minutes. b. When blood glucose level is less than 200 mg/dL, check every hour. c. When titrating vasopressors, (eg, epinephrine) check every 30 minutes. d. When blood glucose level is 100 to 150 mg/dL with less than 15 mg/dL change and insulin rate remains unchanged for 4 hours (“stable
infusion rate”), then you may test every 2 hours. e. You may stop testing every 2 hours on POD 3 (see items 1 and 8). f. At night on telemetry unit, test every 2 hours if blood glucose level is 150 to 200 mg/dL; test every 4 hours if blood glucose level is less than
150 mg/dL and “stable infusion rate” exists.5. Insulin titration according to blood glucose level is performed as follows
a. When blood glucose level is less than 50 mg/dL, stop insulin and give 25 mL 50% dextrose in water. Recheck blood glucose level in 30 minutes. When blood glucose level is greater than 75 mg/dL, restart with rate 50% of previous rate.
b. When blood glucose level is 50 to 75 mg/dL, stop insulin. Recheck blood glucose level in 30 minutes; if previous blood glucose level was greater than 100 then give 25 mL 50% dextrose in water. When blood glucose level is greater than 75 mg/dL, restart with rate 50% of previous rate. c. When blood glucose level is 75 to 100 mg/dL and less than 10 mg/dL lower than last test, decrease rate by 0.5 U/h. If blood glucose level is
more than 10 mg/Dl lower than last test, decrease rate by 50%. If blood glucose level is the same or greater than last test, maintain same rate. d. When blood glucose level is 101 to 150 mg/dL, maintain rate. e. When blood glucose level is 151 to 200 mg/dL and 20 mg/dL lower than last test, maintain rate. Otherwise increase rate by 0.5 U/h. f. When blood glucose level is greater than 200 mg/dL and at least 30 mg/dL lower than last test, maintain rate. If blood glucose level is less than 30 mg/dL lower than last test (or is higher than last test), increase rate by 1 U/h and, if greater than 240 mg/dL, administer intravenous bolus
of regular insulin per initial intravenous insulin bolus dosage scale (see item 3). Recheck blood glucose level in 30 minutes. g. If blood glucose level is greater than 200 mg/dL and has not decreased after three consecutive increases in insulin, then double insulin rate. h. If blood glucose level is greater than 300 mg/dL for four consecutive readings, call physician for additional intravenous bolus orders.
6. American Diabetes Association 1800-kcal diabetic diet starts with any intake by mouth. 7. Postmeal subcutaneous Humalog insulin supplement is given in addition to insulin infusion when oral intake has advanced beyond clear liquids.
a. If patient eats 50% or less of servings on breakfast, lunch, or dinner tray, then give 3 units of Humalog insulin subcutaneously immediately after that meal.
b. If patient eats more than 50% of servings on breakfast, lunch, or supper tray, then give 6 units of Humalog insulin subcutaneously immediately after that meal.
8. On third POD, restart preadmission glycemic control medication unless patient is not tolerating enteral nutrition and is still receiving an insulin drip.
Portland ProtocolFurnary et al J Thorac Cardiovasc Surg 2003;123:1007-21
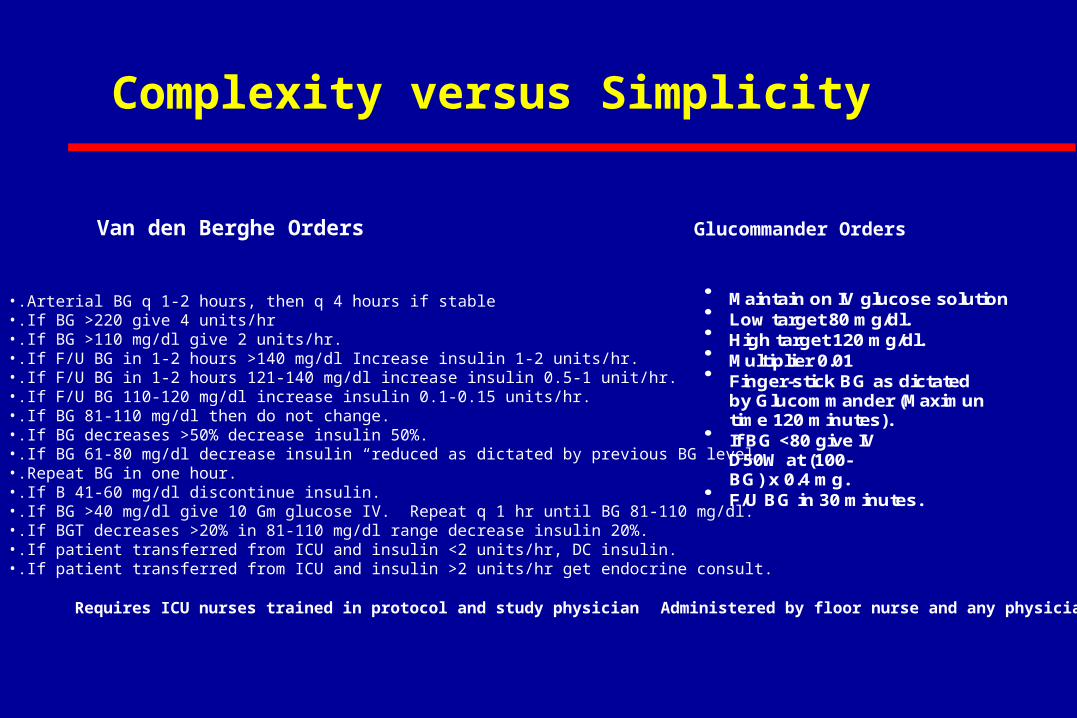
Complexity versus Simplicity
•.Arterial BG q 1-2 hours, then q 4 hours if stable•.If BG >220 give 4 units/hr•.If BG >110 mg/dl give 2 units/hr.•.If F/U BG in 1-2 hours >140 mg/dl Increase insulin 1-2 units/hr.•.If F/U BG in 1-2 hours 121-140 mg/dl increase insulin 0.5-1 unit/hr.•.If F/U BG 110-120 mg/dl increase insulin 0.1-0.15 units/hr.•.If BG 81-110 mg/dl then do not change.•.If BG decreases >50% decrease insulin 50%.•.If BG 61-80 mg/dl decrease insulin “reduced as dictated by previous BG level.•.Repeat BG in one hour.•.If B 41-60 mg/dl discontinue insulin.•.If BG >40 mg/dl give 10 Gm glucose IV. Repeat q 1 hr until BG 81-110 mg/dl.•.If BGT decreases >20% in 81-110 mg/dl range decrease insulin 20%.•.If patient transferred from ICU and insulin <2 units/hr, DC insulin.•.If patient transferred from ICU and insulin >2 units/hr get endocrine consult.
Van den Berghe Orders
Maintain on IV glucose solution Low target 80 mg/dl. High target 120 mg/dl. Multiplier 0.01 Finger-stick BG as dictated
by Glucommander (Maximuntime 120 minutes).
If BG <80 give IVD50W at (100-BG) x 0.4 mg.
F/U BG in 30 minutes.
Glucommander Orders
Requires ICU nurses trained in protocol and study physician Administered by floor nurse and any physician
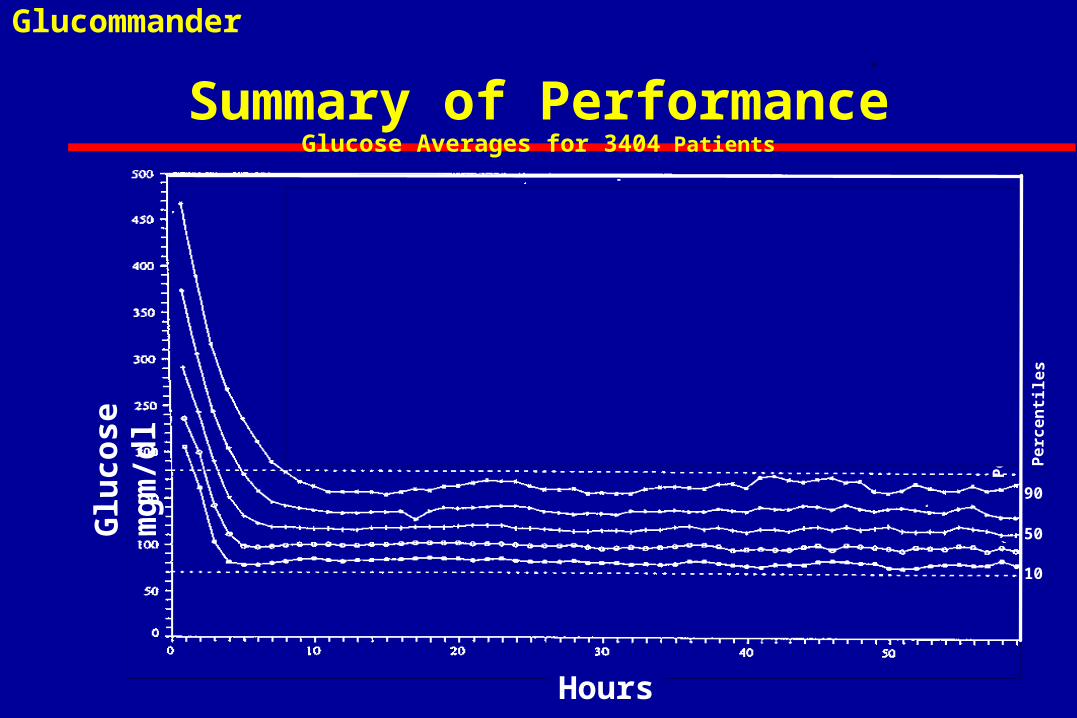
Glucommander .
Summary of PerformanceGlucose Averages for 3404 Patients
Glu
cose
m
gm
/dl
50
Pe
rce
nti
les
90
10
Hours
Pe
rce
nti
les
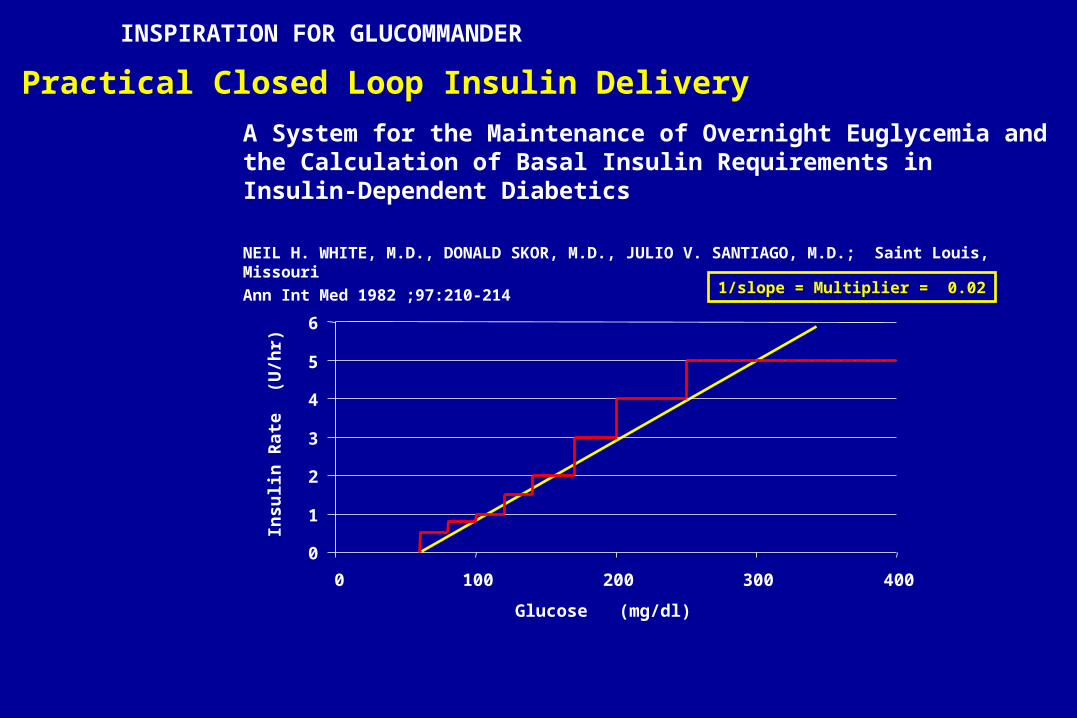
A System for the Maintenance of Overnight Euglycemia and the Calculation of Basal Insulin Requirements in Insulin-Dependent Diabetics
NEIL H. WHITE, M.D., DONALD SKOR, M.D., JULIO V. SANTIAGO, M.D.; Saint Louis, Missouri
Ann Int Med 1982 ;97:210-214
Practical Closed Loop Insulin Delivery
1/slope = Multiplier = 0.02
0
1
2
3
4
5
6
0 100 200 300 400
Glucose (mg/dl)
Insu
lin R
ate
(U
/hr)
INSPIRATION FOR GLUCOMMANDER
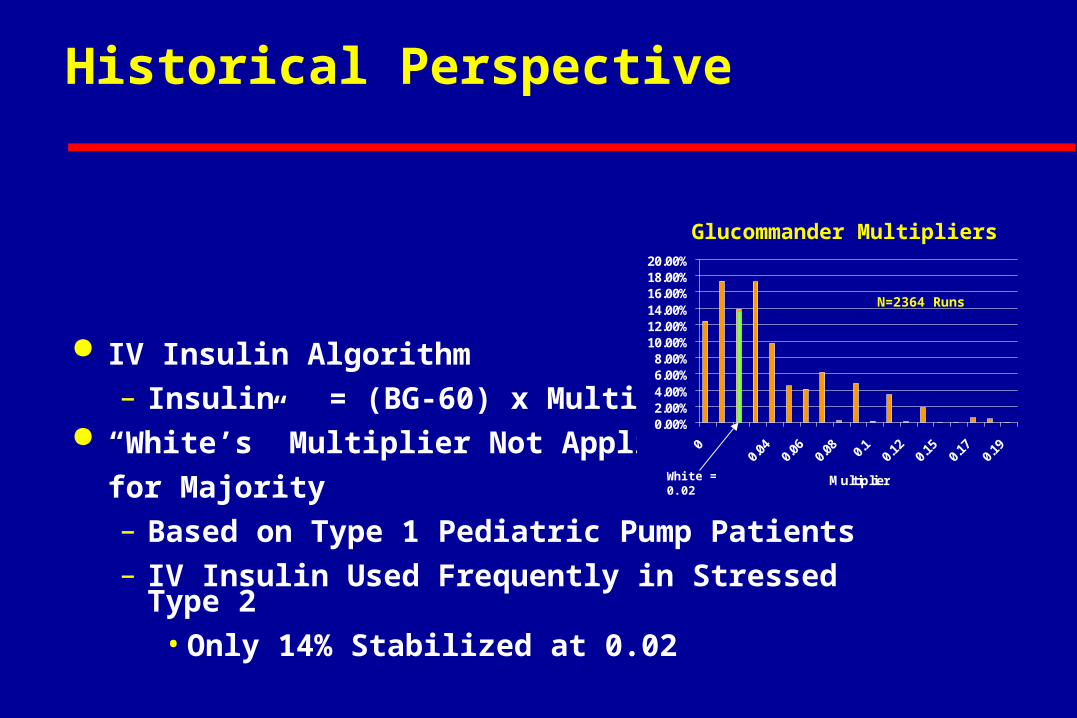
Historical Perspective
IV Insulin Algorithm– Insulin = (BG-60) x Multiplier
“White’s” Multiplier Not Applicable
for Majority– Based on Type 1 Pediatric Pump Patients– IV Insulin Used Frequently in Stressed Type 2
• Only 14% Stabilized at 0.02
0.00%2.00%4.00%6.00%8.00%
10.00%12.00%14.00%16.00%18.00%20.00%
00.
040.
060.
08 0.1
0.12
0.15
0.17
0.19
Multiplier
Glucommander Multipliers
N=2364 Runs
White = 0.02
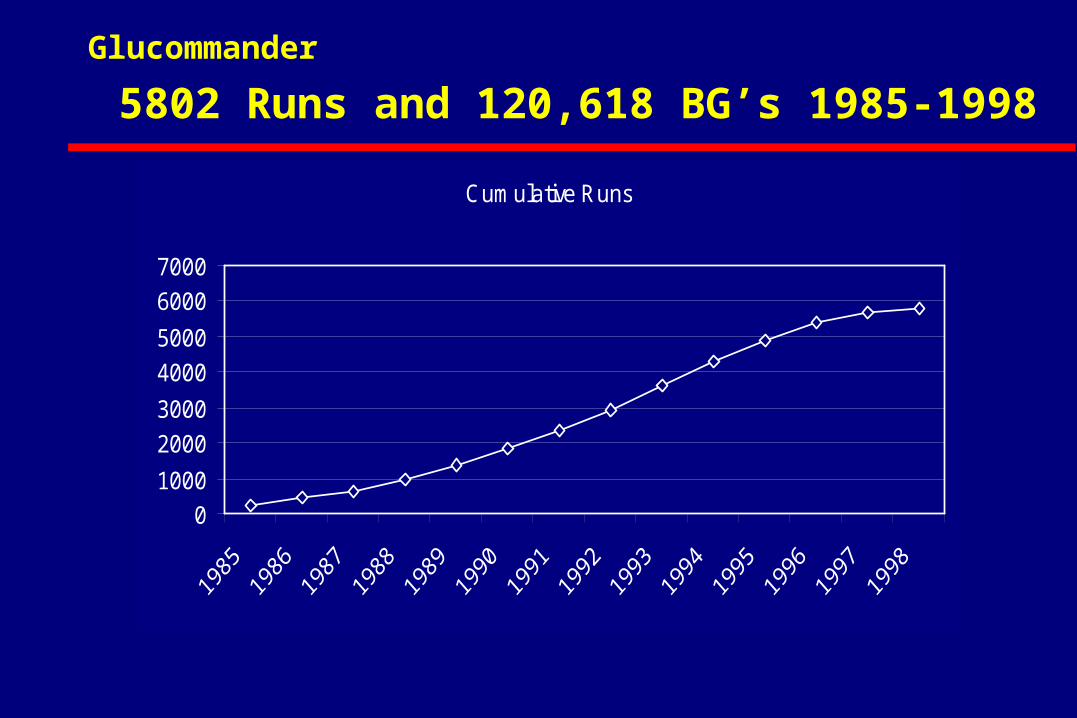
Cumulative Runs
0
1000
2000
3000
4000
5000
6000
7000
Glucommander
5802 Runs and 120,618 BG’s 1985-1998
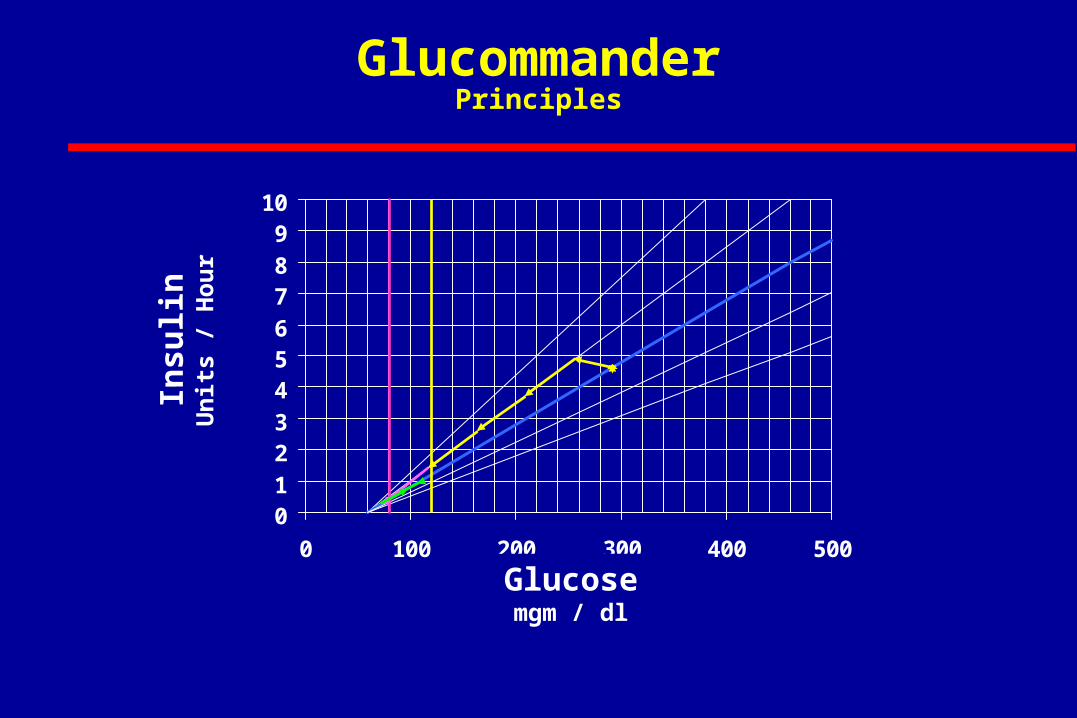
GlucommanderPrinciples
0123456789
10
0 100 200 300 400 500
Insu
lin
Un
its
/ H
ou
r
Glucosemgm / dl
0
1
2
3
4
5
6
7
0 10 20 30 40 50 60
0
0.01
0.02
0.03
0.04
0.05
0.06
50
100
150
200
250
300
350
400
Hours
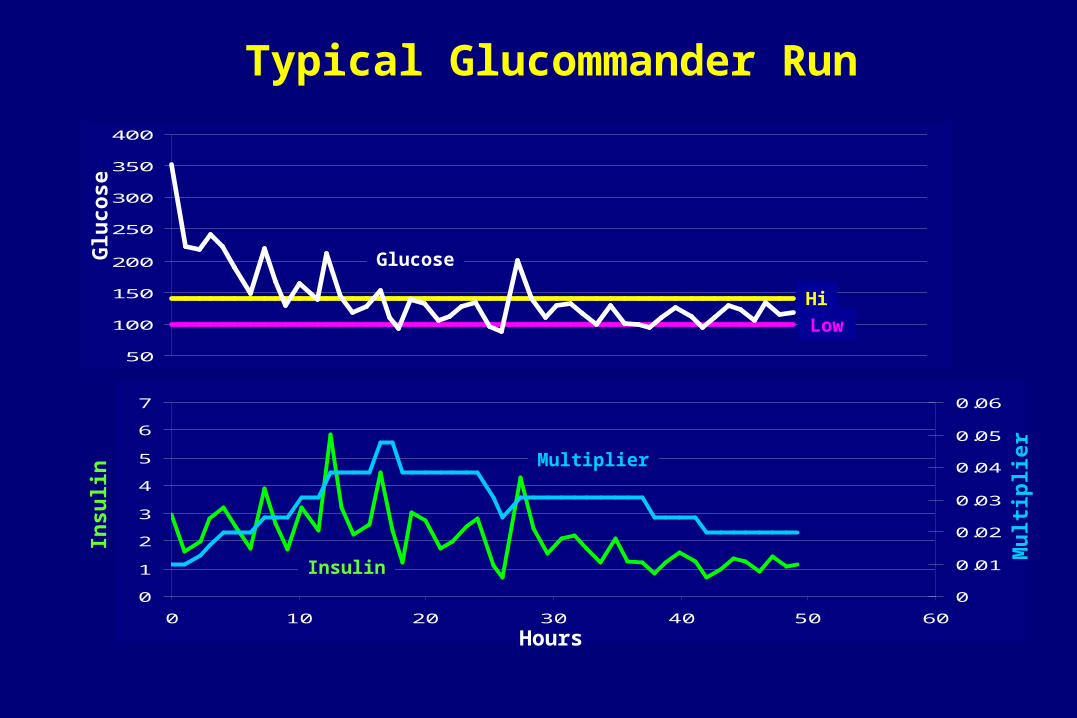
Glucose
Multiplier
Mu
ltip
lier
Insu
lin
Insulin
Glu
cose
Typical Glucommander Run
Hi
Low
0
50
100
150
200
250
300
350
400
Hours
Glu
cose
m
g/d
lm
ean
-sd
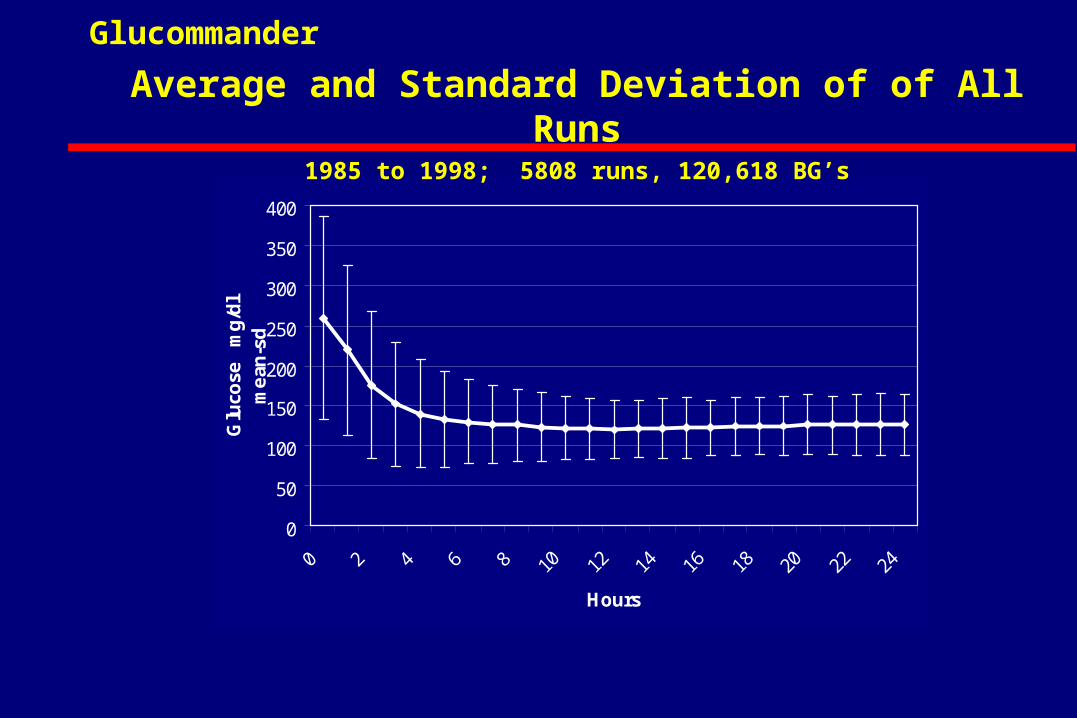
Glucommander
Average and Standard Deviation of of All Runs1985 to 1998; 5808 runs, 120,618 BG’s
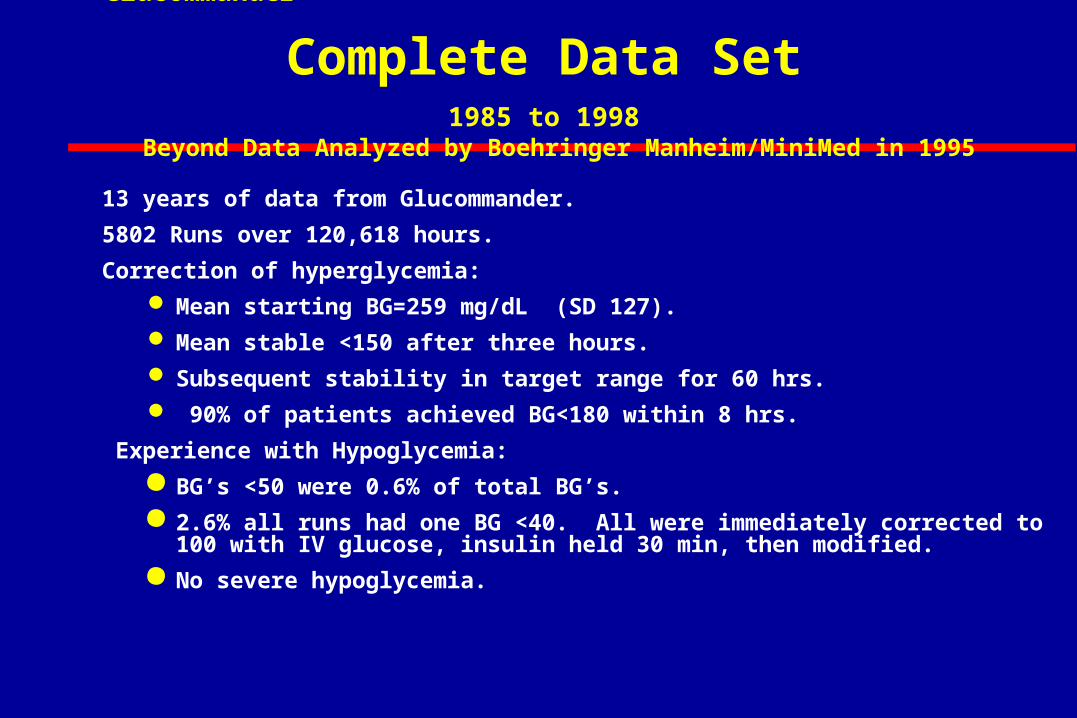
Glucommander .
Complete Data Set 1985 to 1998
Beyond Data Analyzed by Boehringer Manheim/MiniMed in 1995
13 years of data from Glucommander.
5802 Runs over 120,618 hours.
Correction of hyperglycemia:
Mean starting BG=259 mg/dL (SD 127).
Mean stable <150 after three hours.
Subsequent stability in target range for 60 hrs.
90% of patients achieved BG<180 within 8 hrs.
Experience with Hypoglycemia:
BG’s <50 were 0.6% of total BG’s.
2.6% all runs had one BG <40. All were immediately corrected to 100 with IV glucose, insulin held 30 min, then modified.
No severe hypoglycemia.
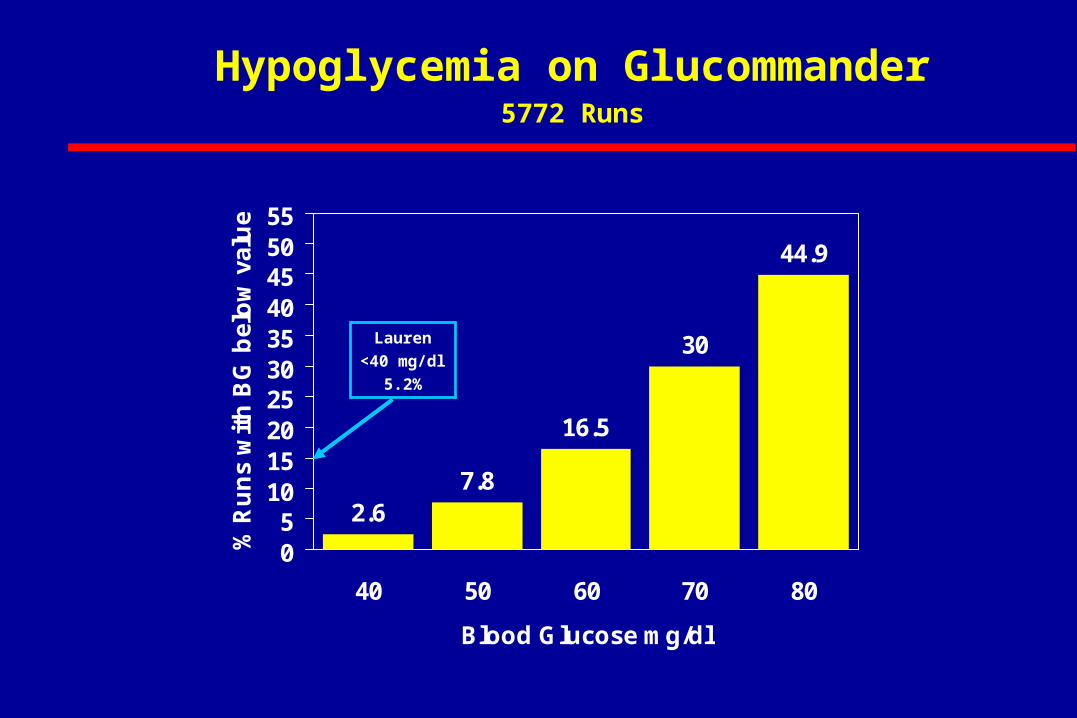
2.67.8
16.5
30
44.9
05
10152025303540455055
40 50 60 70 80
Blood Glucose mg/dl
% R
un
s w
ith
BG
bel
ow
val
ue
Lauren
<40 mg/dl
5.2%
Hypoglycemia on Glucommander5772 Runs
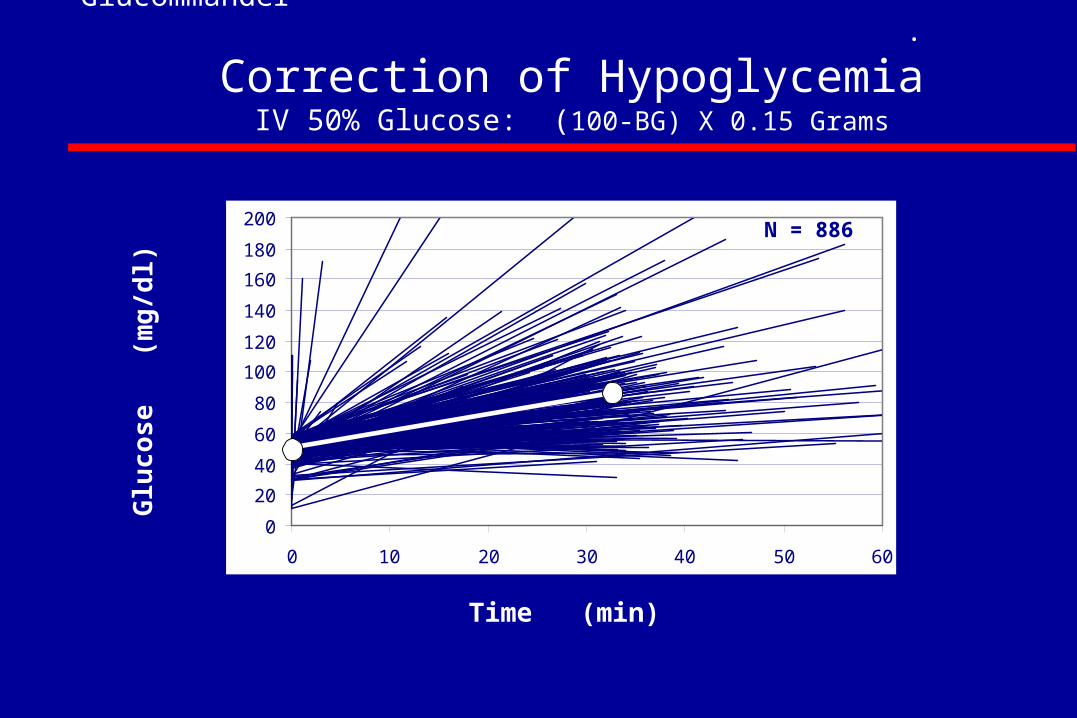
Glucommander .
Correction of HypoglycemiaIV 50% Glucose: (100-BG) X 0.15 Grams
Time (min)
Glu
co
se
(m
g/d
l )
0
20
40
60
80
100
120
140
160
180
200
0 10 20 30 40 50 60
N = 886
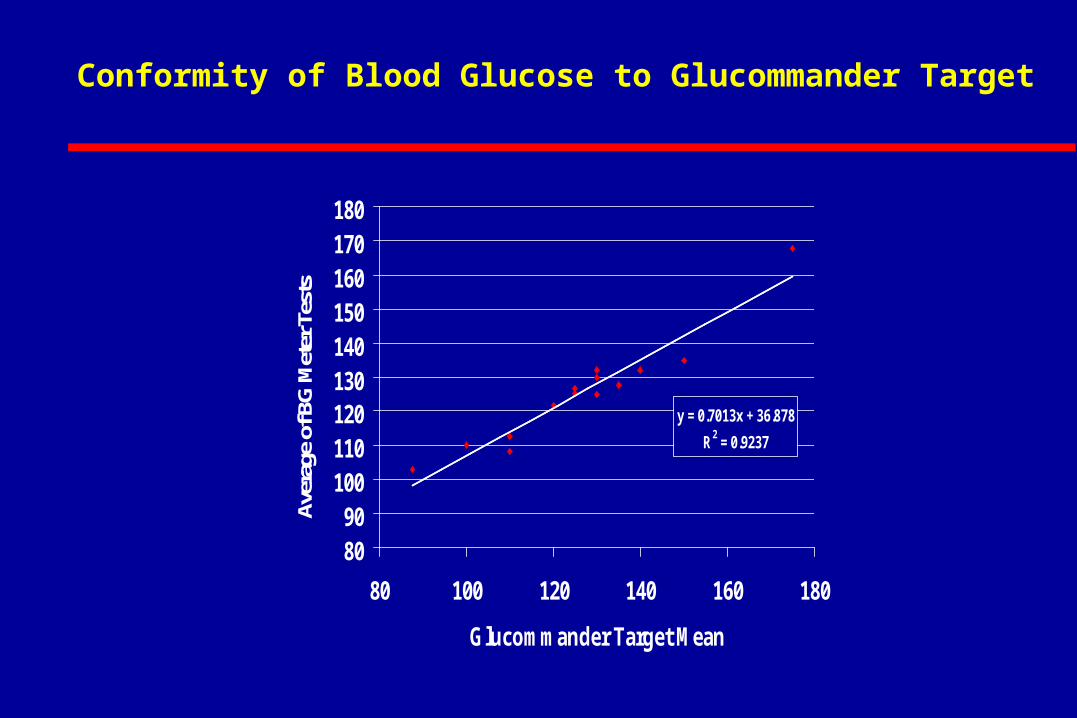
y = 0.7013x + 36.878
R2 = 0.9237
8090
100110120130140150160170180
80 100 120 140 160 180
Glucommander Target Mean
Aver
age
of B
G M
eter
Tes
ts
Conformity of Blood Glucose to Glucommander Target
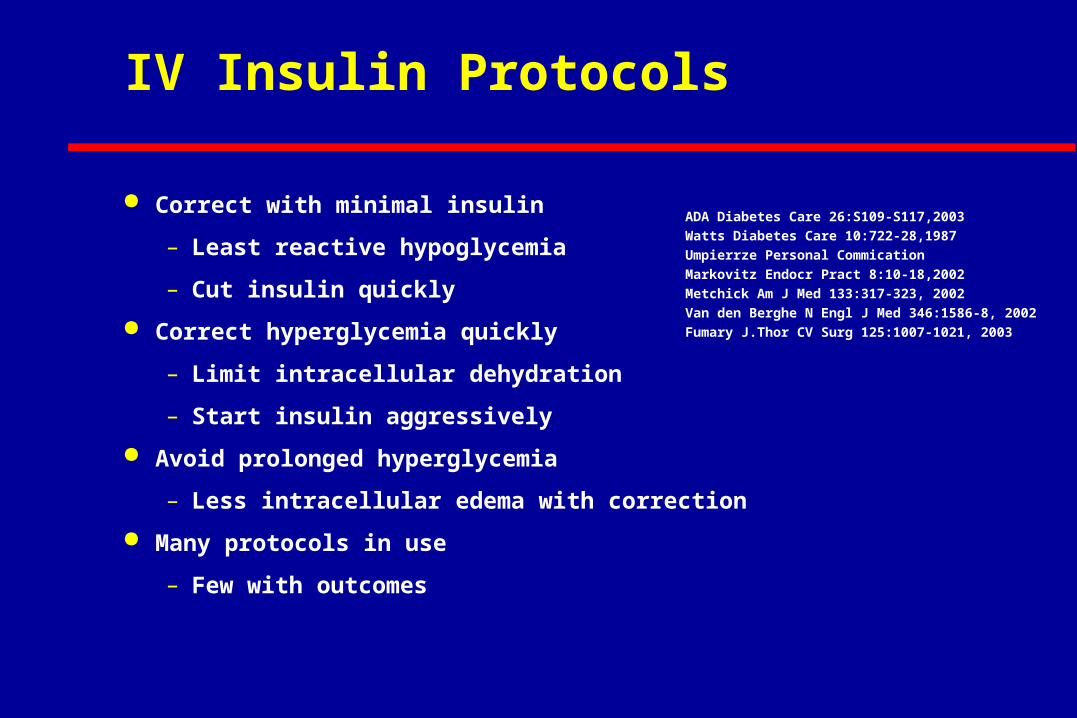
IV Insulin Protocols
Correct with minimal insulin
– Least reactive hypoglycemia
– Cut insulin quickly
Correct hyperglycemia quickly
– Limit intracellular dehydration
– Start insulin aggressively
Avoid prolonged hyperglycemia
– Less intracellular edema with correction
Many protocols in use
– Few with outcomes
ADA Diabetes Care 26:S109-S117,2003
Watts Diabetes Care 10:722-28,1987
Umpierrze Personal Commication
Markovitz Endocr Pract 8:10-18,2002
Metchick Am J Med 133:317-323, 2002
Van den Berghe N Engl J Med 346:1586-8, 2002
Fumary J.Thor CV Surg 125:1007-1021, 2003
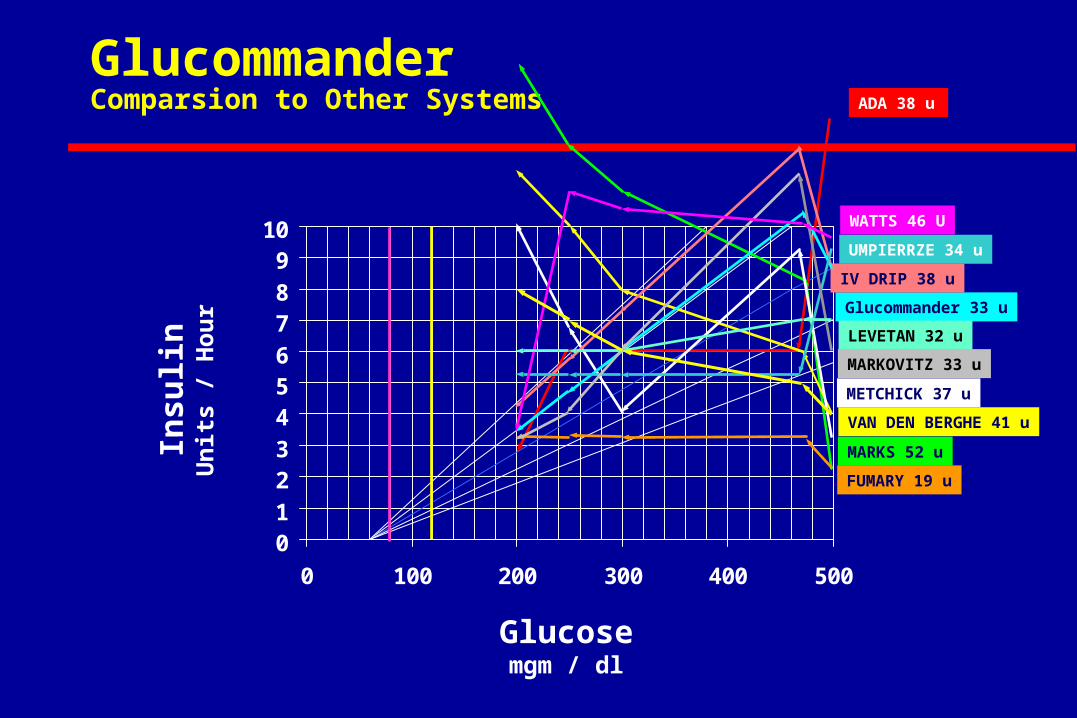
GlucommanderComparsion to Other Systems
0123456789
10
0 100 200 300 400 500
Insu
lin
Un
its
/ H
ou
r
Glucosemgm / dl
Glucommander 33 u
ADA 38 u
MARKS 52 u
FUMARY 19 u
METCHICK 37 u
VAN DEN BERGHE 41 u
IV DRIP 38 u
UMPIERRZE 34 u
MARKOVITZ 33 u
WATTS 46 U
LEVETAN 32 u
0123456789
10
0 100 200 300 400 500
Insu
lin
Un
its
/ H
ou
r
Glucosemgm / dl
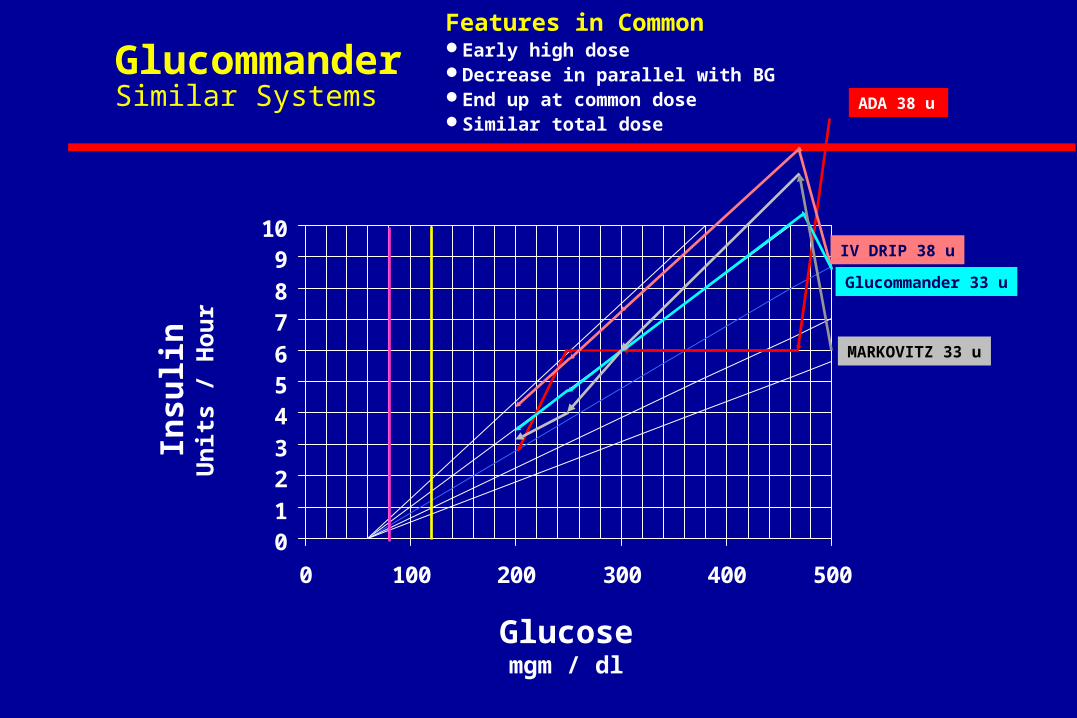
Glucommander 33 u
ADA 38 u
IV DRIP 38 u
MARKOVITZ 33 u
GlucommanderSimilar Systems
Features in CommonEarly high doseDecrease in parallel with BGEnd up at common doseSimilar total dose
0
50
100
150
200
250
300
0 5 10 15 20 25Time (hours)
Glu
cose
(m
g/dl
)
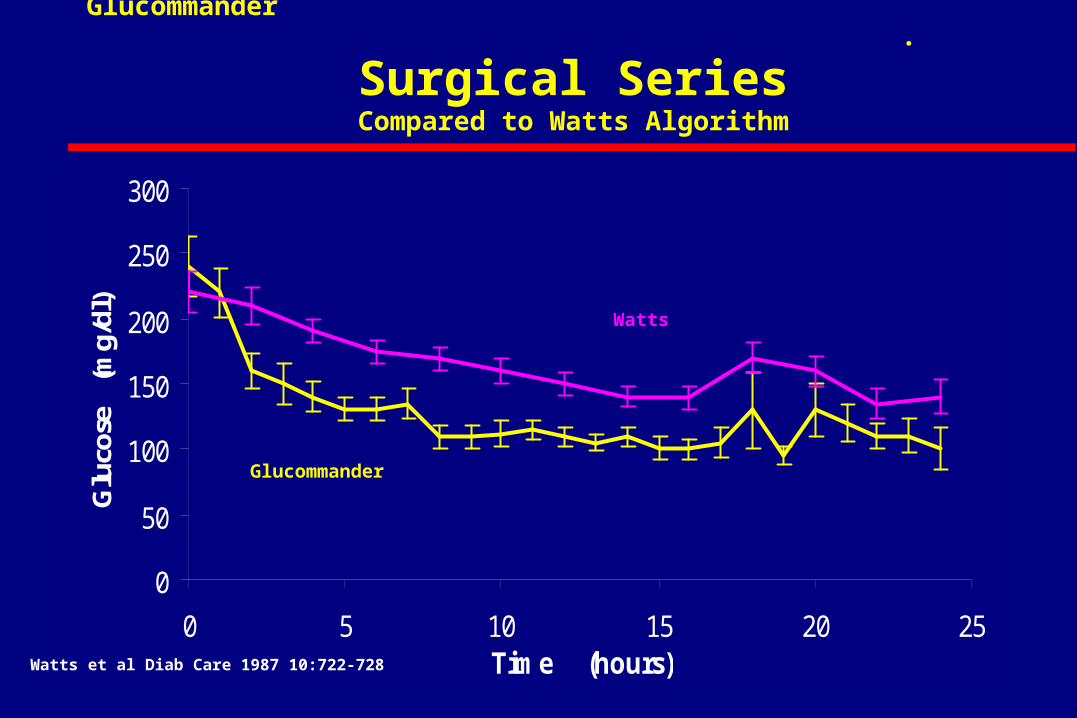
Glucommander .
Surgical SeriesCompared to Watts Algorithm
Watts
Glucommander
Watts et al Diab Care 1987 10:722-728
0
2
4
6
8
10
12
0 5 10 15 20 25Time (hours)
Insu
lin R
ate
(U
nits
/hr)
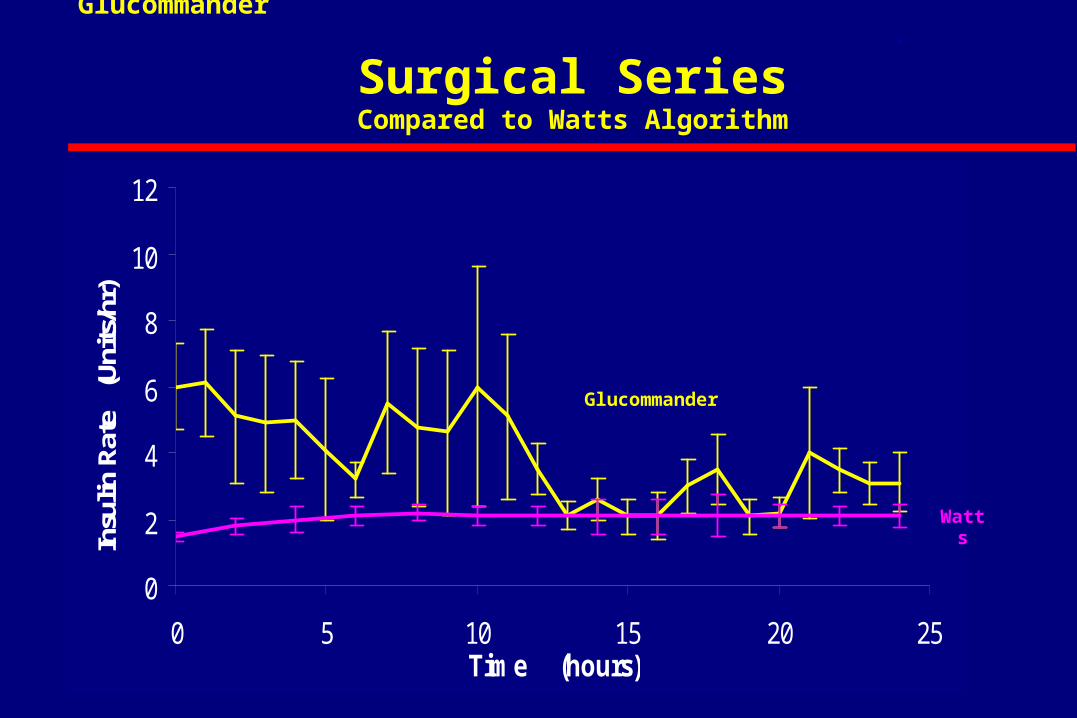
Glucommander .
Surgical SeriesCompared to Watts Algorithm
Glucommander
Watts
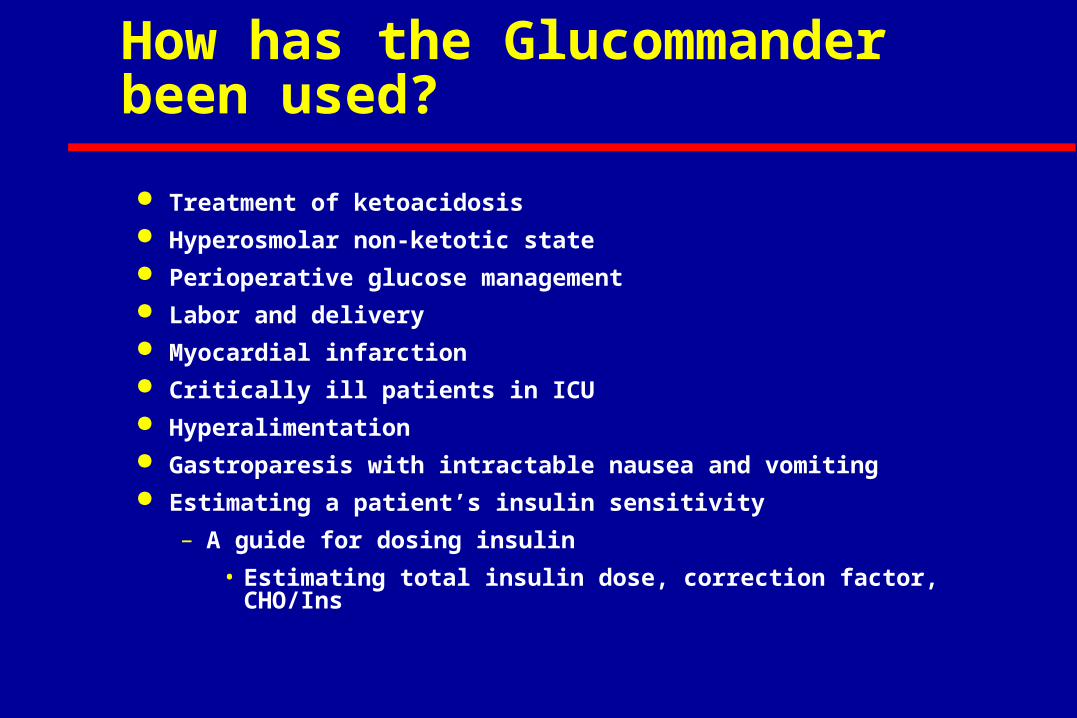
How has the Glucommander been used?
Treatment of ketoacidosis Hyperosmolar non-ketotic state Perioperative glucose management Labor and delivery Myocardial infarction Critically ill patients in ICU Hyperalimentation Gastroparesis with intractable nausea and vomiting Estimating a patient’s insulin sensitivity
– A guide for dosing insulin
• Estimating total insulin dose, correction factor, CHO/Ins
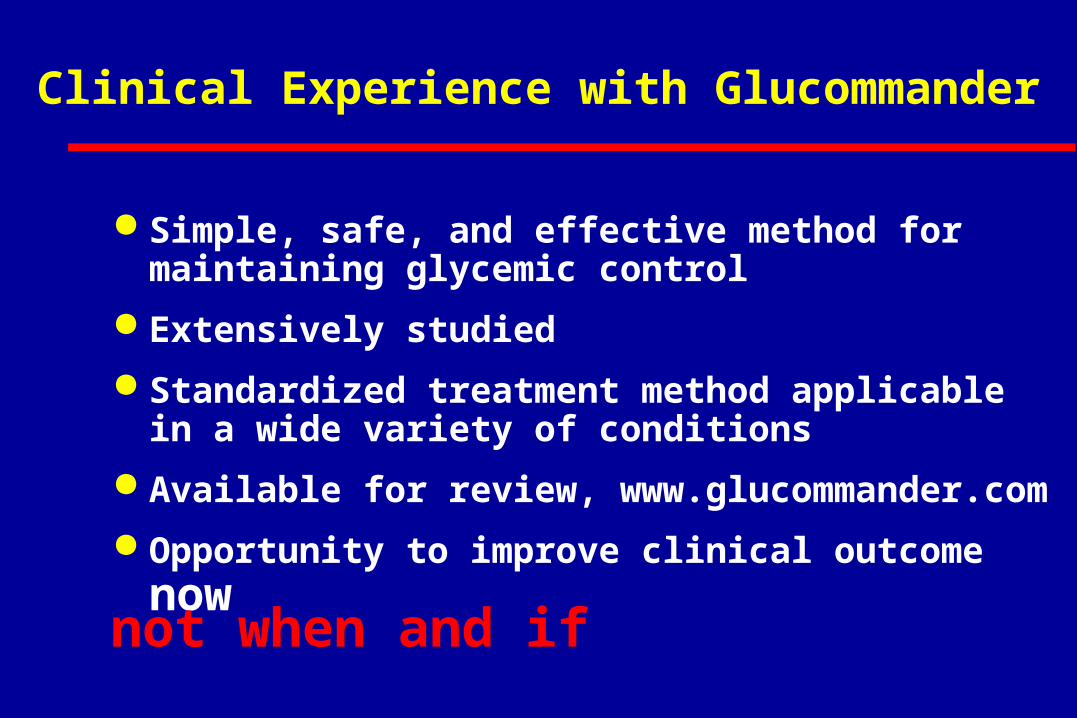
Clinical Experience with Glucommander
Simple, safe, and effective method for maintaining glycemic control
Extensively studied
Standardized treatment method applicable in a wide variety of conditions
Available for review, www.glucommander.com
Opportunity to improve clinical outcome nownot when and if
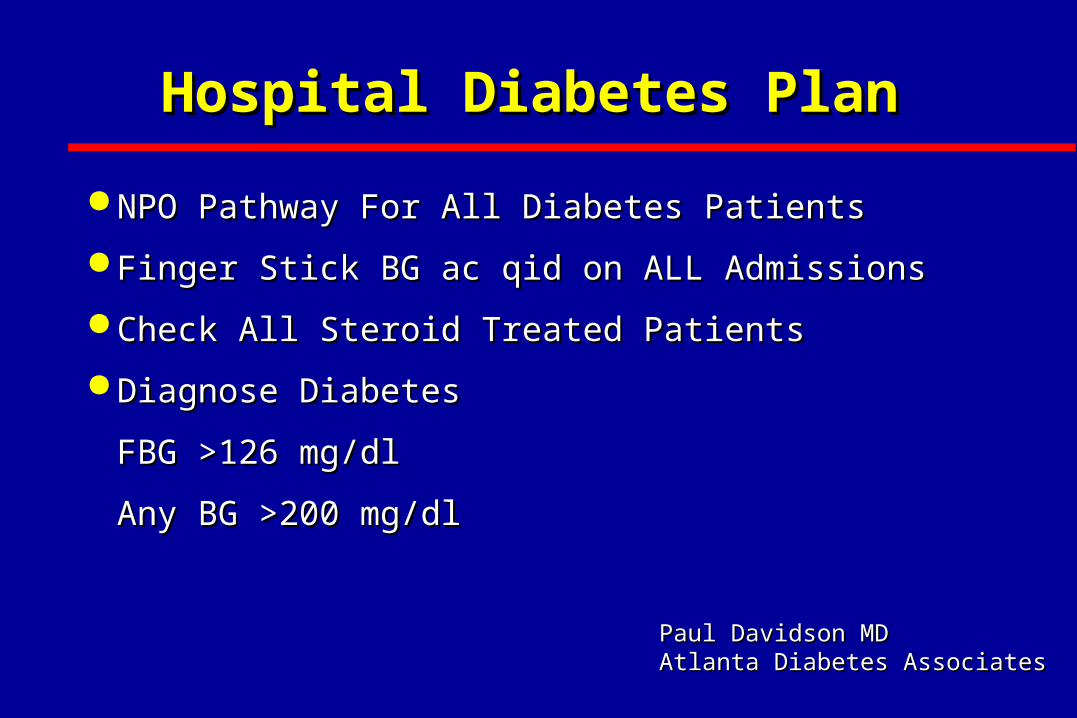
Hospital Diabetes PlanHospital Diabetes Plan
NPO Pathway For All Diabetes PatientsNPO Pathway For All Diabetes Patients
Finger Stick BG ac qid on ALL AdmissionsFinger Stick BG ac qid on ALL Admissions
Check All Steroid Treated PatientsCheck All Steroid Treated Patients
Diagnose DiabetesDiagnose Diabetes
FBG >126 mg/dlFBG >126 mg/dl
Any BG >200 mg/dlAny BG >200 mg/dl
Paul Davidson MDPaul Davidson MDAtlanta Diabetes AssociatesAtlanta Diabetes Associates
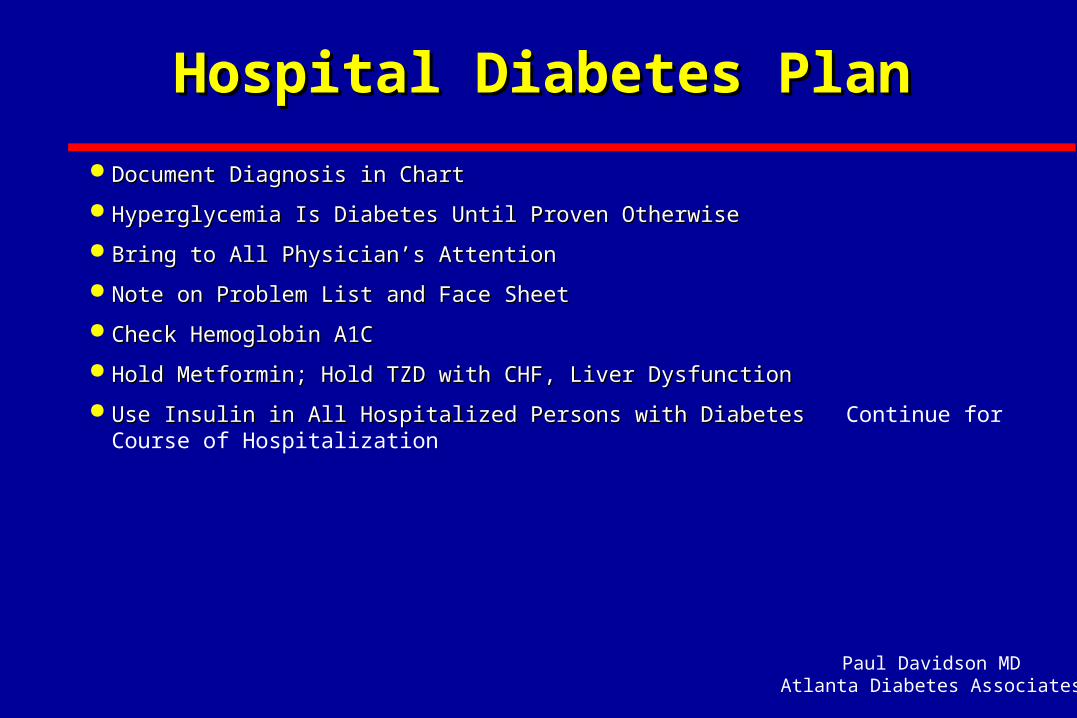
Hospital Diabetes PlanHospital Diabetes Plan
Document Diagnosis in ChartDocument Diagnosis in Chart
Hyperglycemia Is Diabetes Until Proven OtherwiseHyperglycemia Is Diabetes Until Proven Otherwise
Bring to All Physician’s AttentionBring to All Physician’s Attention
Note on Problem List and Face SheetNote on Problem List and Face Sheet
Check Hemoglobin A1CCheck Hemoglobin A1C
Hold Metformin; Hold TZD with CHF, Liver DysfunctionHold Metformin; Hold TZD with CHF, Liver Dysfunction
Use Insulin in All Hospitalized Persons with Diabetes Use Insulin in All Hospitalized Persons with Diabetes Continue for Course of Hospitalization
Paul Davidson MDAtlanta Diabetes Associates
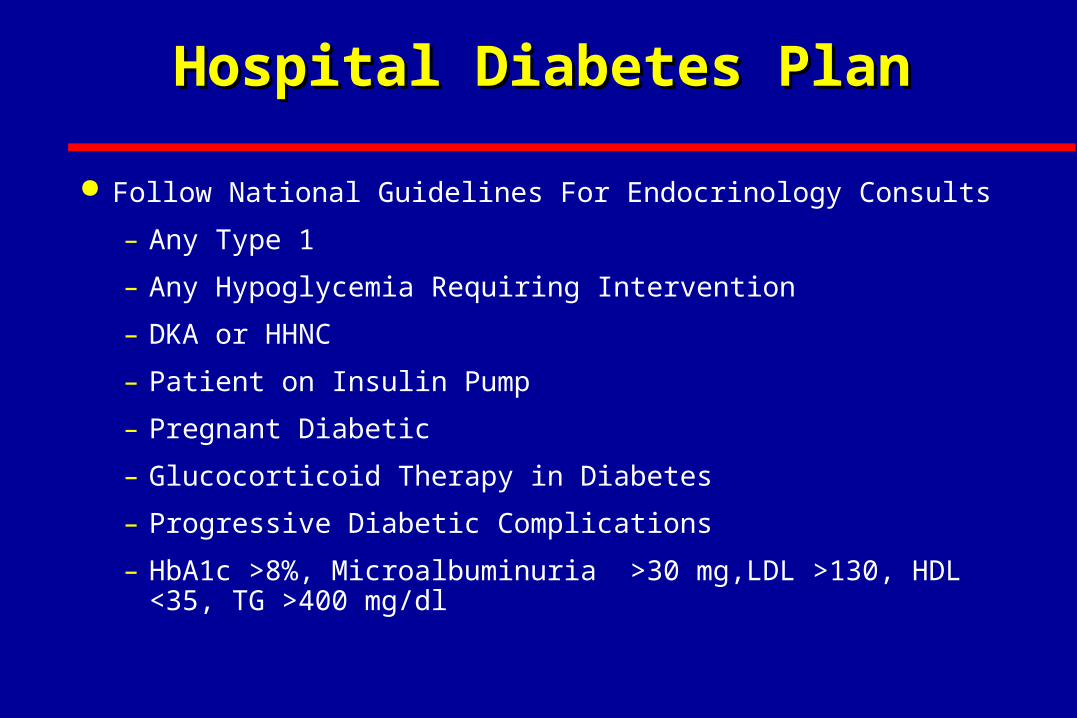
Hospital Diabetes PlanHospital Diabetes Plan
Follow National Guidelines For Endocrinology Consults
– Any Type 1
– Any Hypoglycemia Requiring Intervention
– DKA or HHNC
– Patient on Insulin Pump
– Pregnant Diabetic
– Glucocorticoid Therapy in Diabetes
– Progressive Diabetic Complications
– HbA1c >8%, Microalbuminuria >30 mg,LDL >130, HDL <35, TG >400 mg/dl
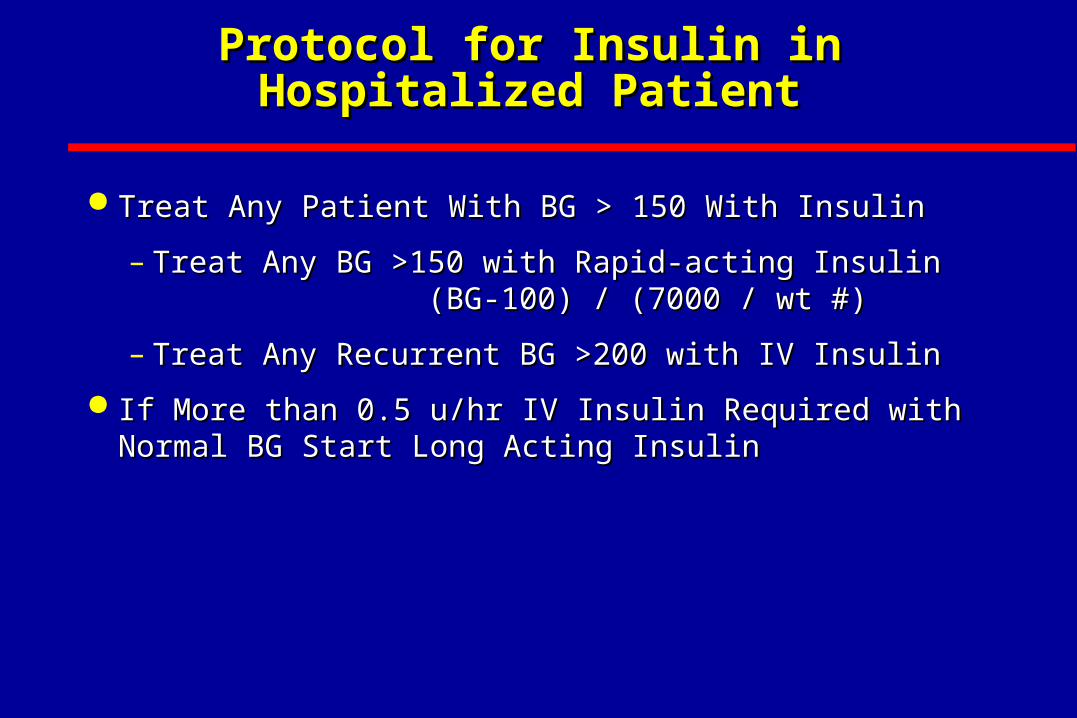
Treat Any Patient With BG > 150 With InsulinTreat Any Patient With BG > 150 With Insulin
– Treat Any BG >150 with Rapid-acting Insulin Treat Any BG >150 with Rapid-acting Insulin (BG-100) / (7000 / wt #) (BG-100) / (7000 / wt #)
– Treat Any Recurrent BG >200 with IV InsulinTreat Any Recurrent BG >200 with IV Insulin
If More than 0.5 u/hr IV Insulin Required with Normal If More than 0.5 u/hr IV Insulin Required with Normal BG Start Long Acting InsulinBG Start Long Acting Insulin
Protocol for Insulin in Hospitalized PatientProtocol for Insulin in Hospitalized Patient
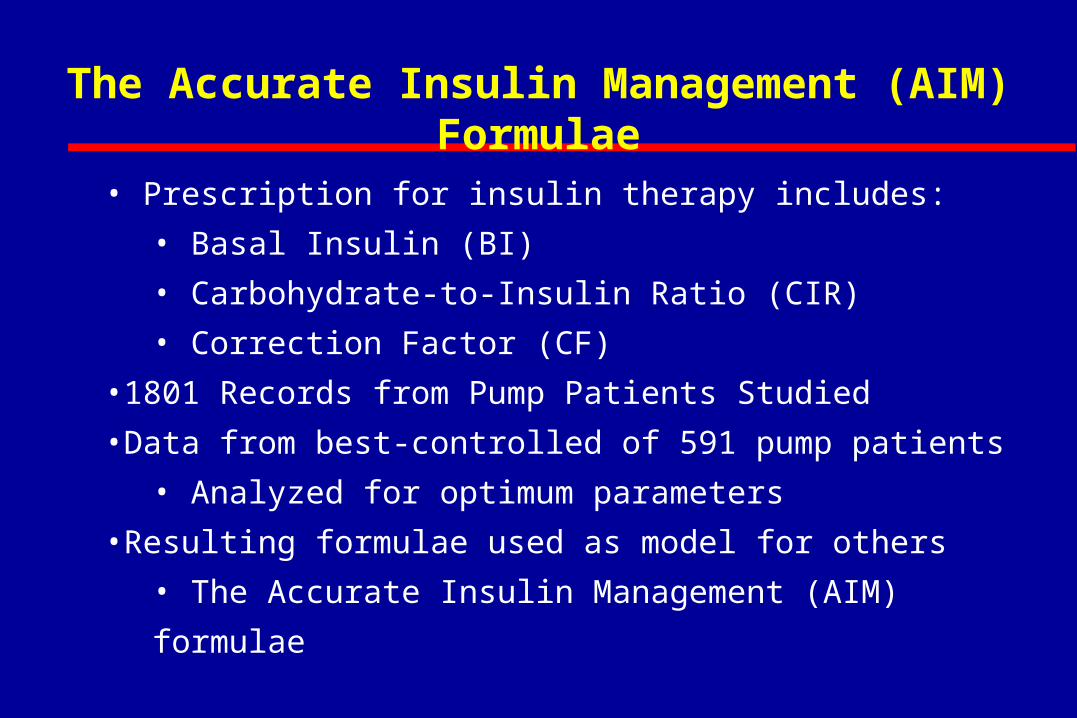
• Prescription for insulin therapy includes:
• Basal Insulin (BI)
• Carbohydrate-to-Insulin Ratio (CIR)
• Correction Factor (CF)
•1801 Records from Pump Patients Studied
•Data from best-controlled of 591 pump patients
• Analyzed for optimum parameters
•Resulting formulae used as model for others
• The Accurate Insulin Management (AIM) formulae
The Accurate Insulin Management (AIM) Formulae
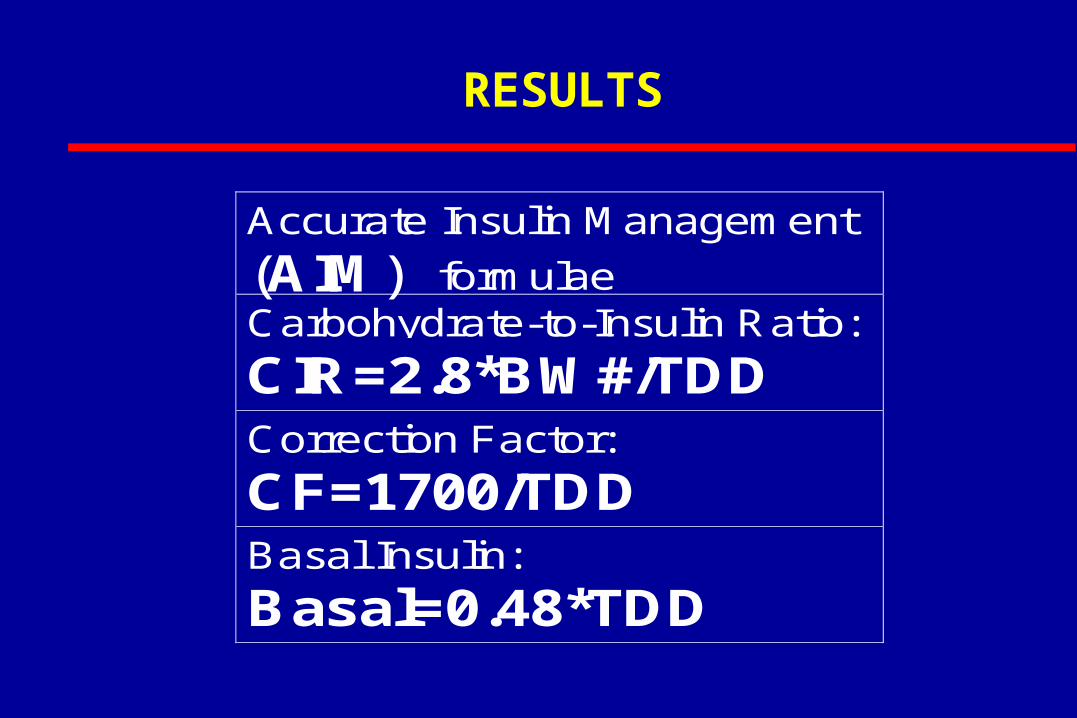
RESULTS
Accurate Insulin Management
(AIM) formulaeCarbohydrate-to-Insulin Ratio:
CIR=2.8*BW#/TDDCorrection Factor:
CF=1700/TDDBasal Insulin:
Basal=0.48*TDD
0
50
100
150
200
250
300
0 50 100 150 200
Total Daily Dose of Insulin (TDD)
Bo
dy
We
igh
t in
lbs
125
100
75
50
25
Co
r rection
Facto
r
25 20 15 12 10 9 8 7 6 5
Carbohydrate to Insulin Ratio
CF Curve
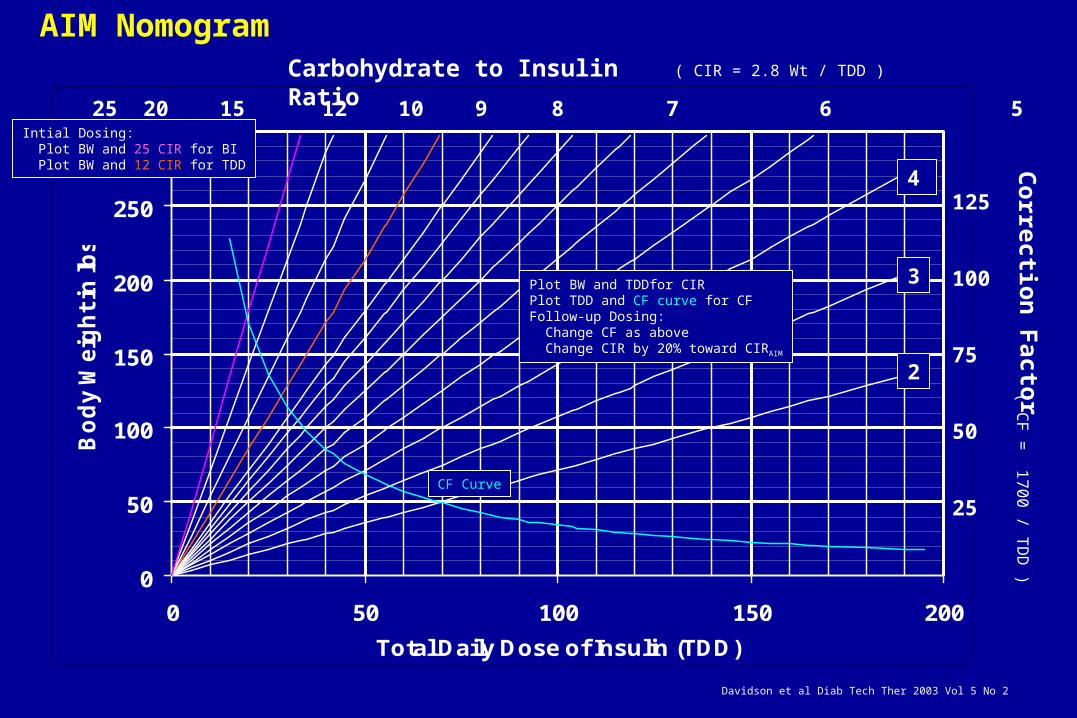
AIM Nomogram
Davidson et al Diab Tech Ther 2003 Vol 5 No 2
( CIR = 2.8 Wt / TDD )( C
F =
17
00
/ TD
D )
Intial Dosing: Plot BW and 25 CIR for BI Plot BW and 12 CIR for TDD
Plot BW and TDDfor CIRPlot TDD and CF curve for CFFollow-up Dosing: Change CF as above Change CIR by 20% toward CIRAIM
4
3
2
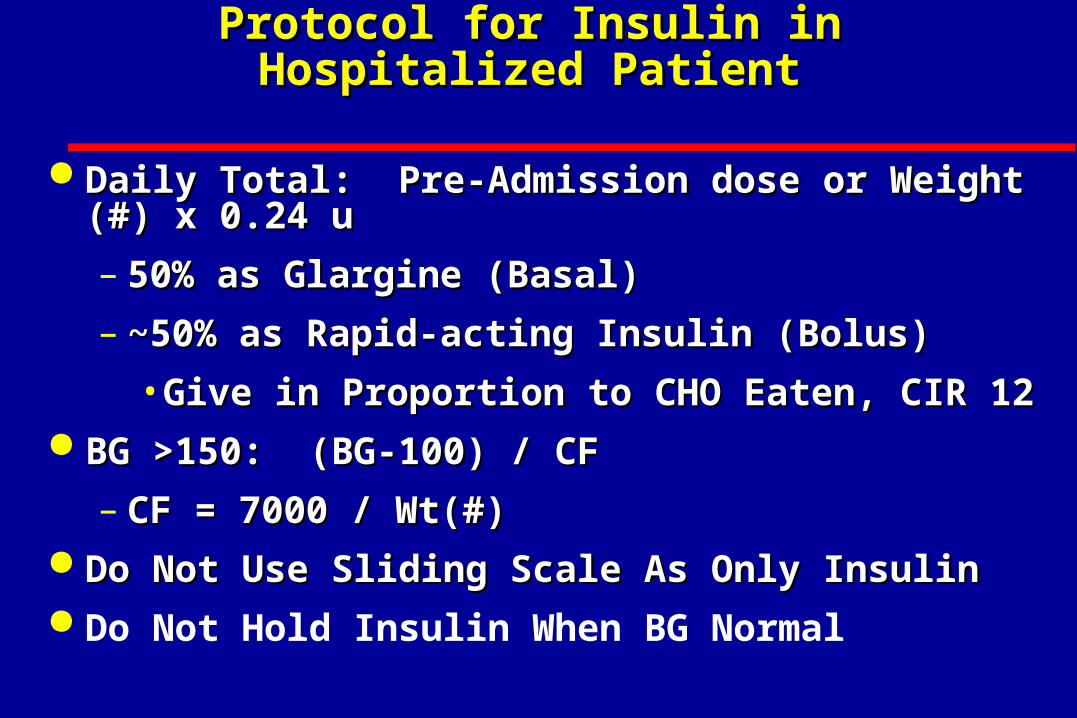
Protocol for Insulin in Hospitalized PatientProtocol for Insulin in Hospitalized Patient
Daily Total: Pre-Admission dose or Weight (#) x 0.24 uDaily Total: Pre-Admission dose or Weight (#) x 0.24 u
– 50% as Glargine (Basal) 50% as Glargine (Basal)
– ~50% as Rapid-acting Insulin (Bolus)~50% as Rapid-acting Insulin (Bolus)
• Give in Proportion to CHO Eaten, CIR 12Give in Proportion to CHO Eaten, CIR 12 BG >150: (BG-100) / CFBG >150: (BG-100) / CF
– CF = 7000 / Wt(#) CF = 7000 / Wt(#) Do Not Use Sliding Scale As Only InsulinDo Not Use Sliding Scale As Only Insulin Do Not Hold Insulin When BG Normal
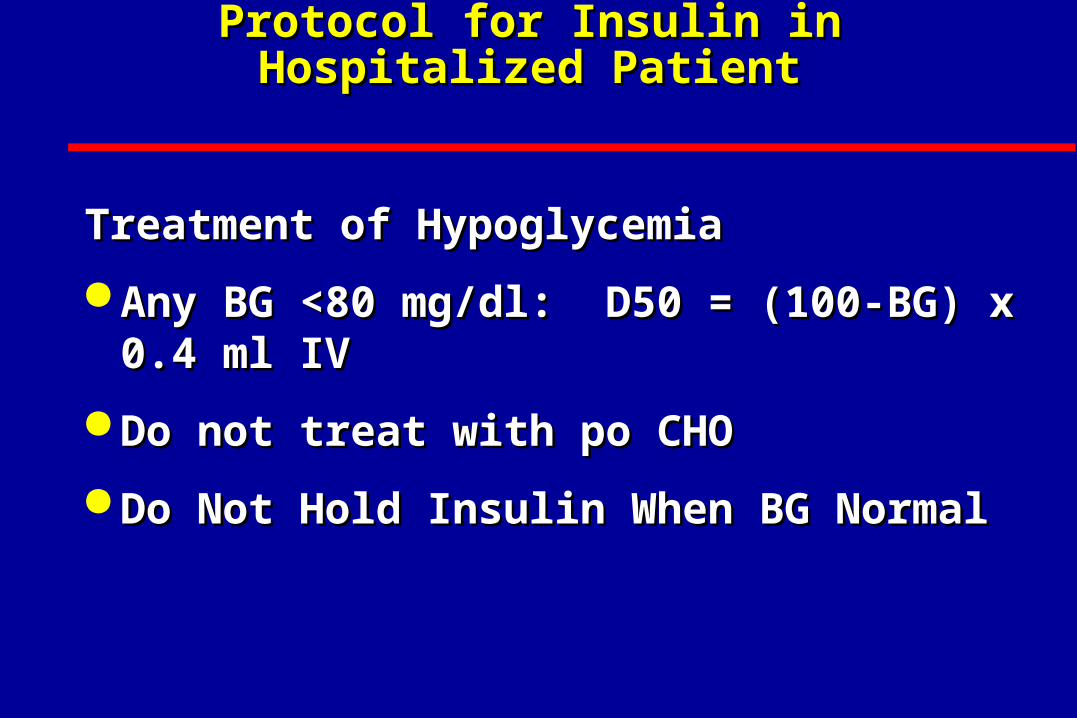
Protocol for Insulin in Hospitalized PatientProtocol for Insulin in Hospitalized Patient
Treatment of HypoglycemiaTreatment of Hypoglycemia
Any BG <80 mg/dl: D50 = (100-BG) x 0.4 ml IVAny BG <80 mg/dl: D50 = (100-BG) x 0.4 ml IV
Do not treat with po CHO Do not treat with po CHO
Do Not Hold Insulin When BG NormalDo Not Hold Insulin When BG Normal
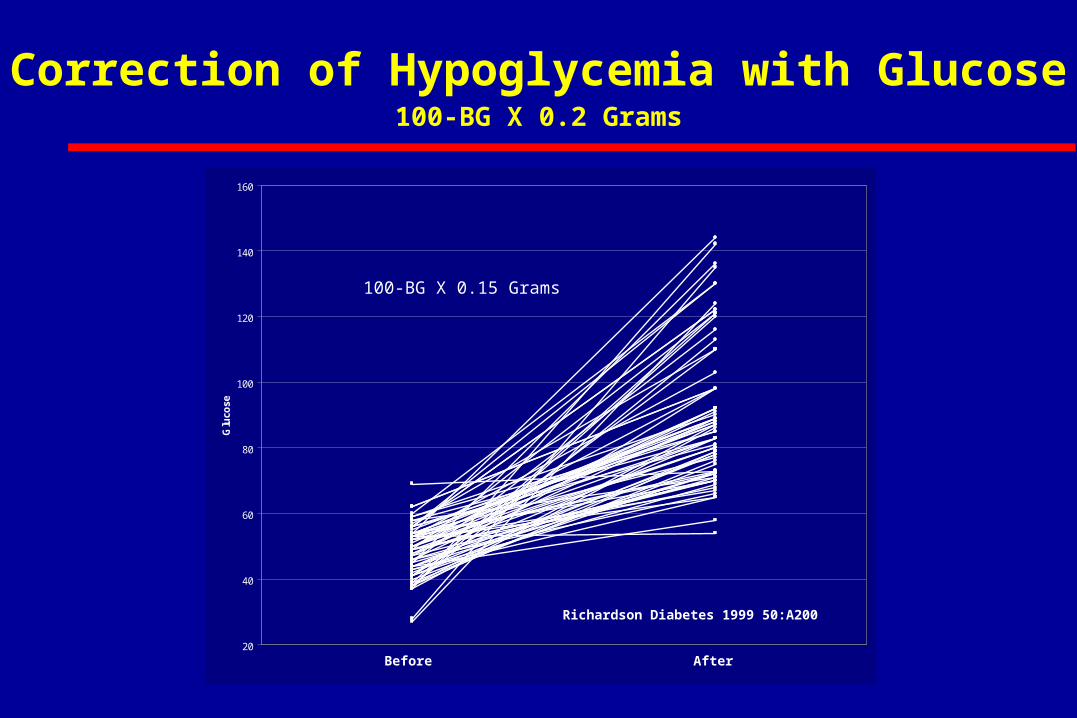
20
40
60
80
100
120
140
160
Glu
cose
Correction of Hypoglycemia with Glucose100-BG X 0.2 Grams
Before After
Richardson Diabetes 1999 50:A200
100-BG X 0.15 Grams
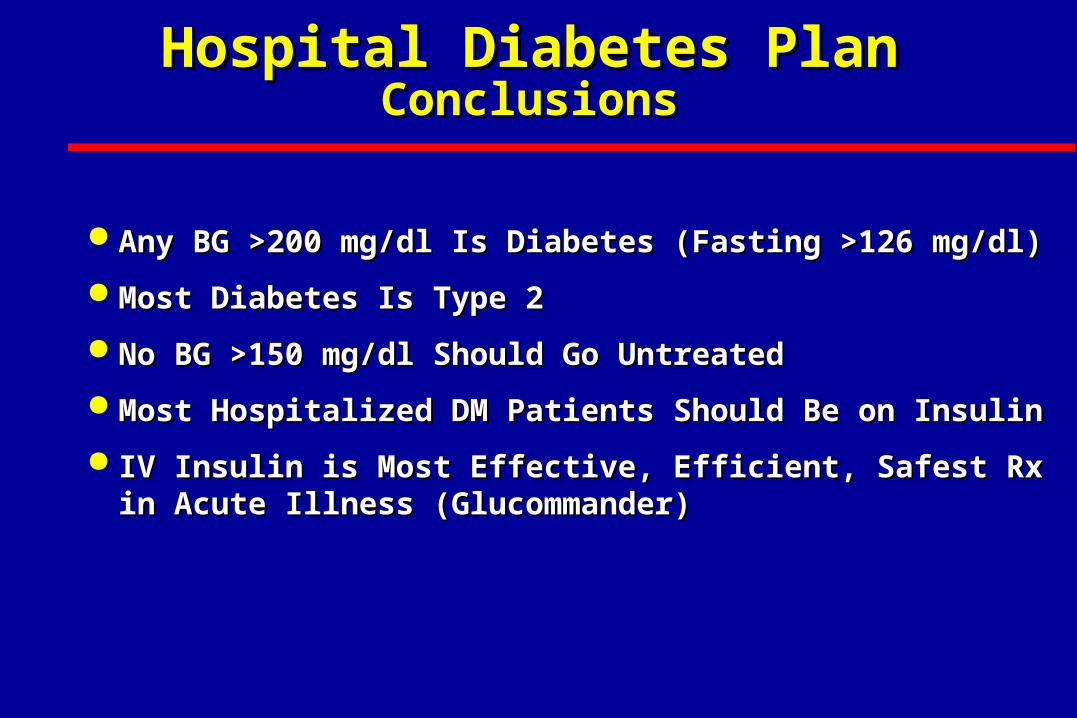
Hospital Diabetes PlanHospital Diabetes PlanConclusionsConclusions
Any BG >200 mg/dl Is Diabetes (Fasting >126 mg/dl)Any BG >200 mg/dl Is Diabetes (Fasting >126 mg/dl)
Most Diabetes Is Type 2Most Diabetes Is Type 2
No BG >150 mg/dl Should Go UntreatedNo BG >150 mg/dl Should Go Untreated
Most Hospitalized DM Patients Should Be on InsulinMost Hospitalized DM Patients Should Be on Insulin
IV Insulin is Most Effective, Efficient, Safest Rx in IV Insulin is Most Effective, Efficient, Safest Rx in Acute Illness (Glucommander)Acute Illness (Glucommander)
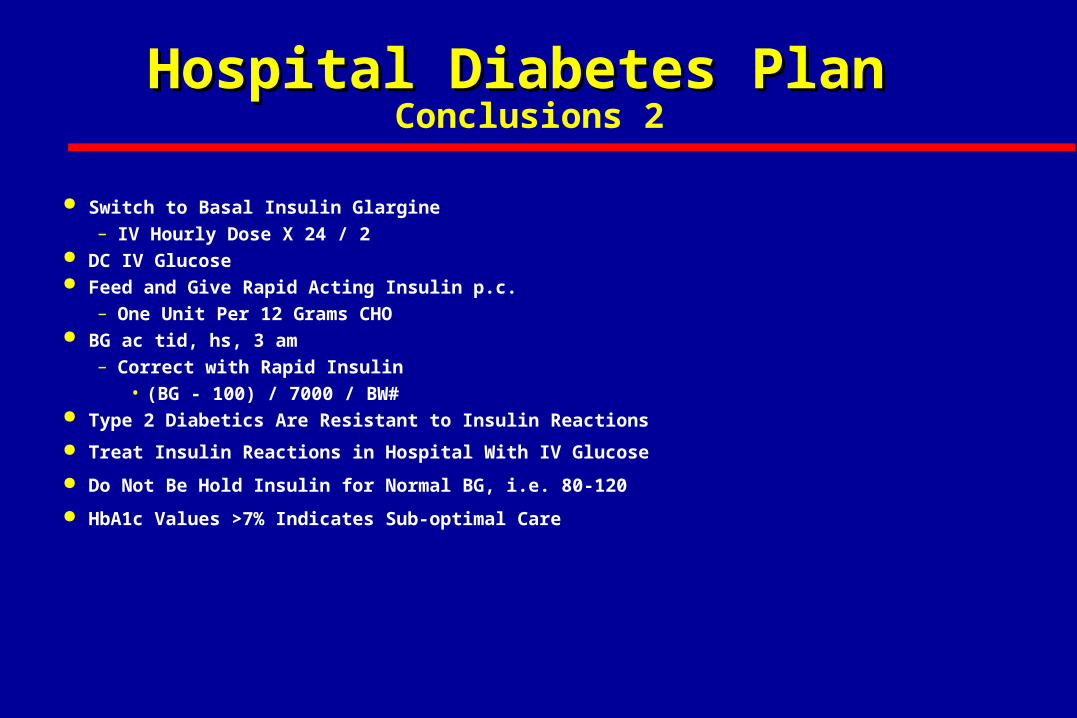
Hospital Diabetes PlanHospital Diabetes Plan Conclusions 2
Switch to Basal Insulin Glargine– IV Hourly Dose X 24 / 2
DC IV Glucose Feed and Give Rapid Acting Insulin p.c.
– One Unit Per 12 Grams CHO BG ac tid, hs, 3 am
– Correct with Rapid Insulin• (BG - 100) / 7000 / BW#
Type 2 Diabetics Are Resistant to Insulin Reactions
Treat Insulin Reactions in Hospital With IV Glucose
Do Not Be Hold Insulin for Normal BG, i.e. 80-120
HbA1c Values >7% Indicates Sub-optimal Care
The Paradigm for the MilleniumThe Paradigm for the MilleniumHyperglycemia: A “Mortal” SinHyperglycemia: A “Mortal” Sin
A blood glucose over 110 in a hospitalized patient A blood glucose over 110 in a hospitalized patient causes increased morbidity and mortality.causes increased morbidity and mortality.
In the 21st Century In the 21st Century
Neglecting BG >200 Neglecting BG >200
Is MalpracticeIs Malpractice
Conclusion
All hospital patients should have normal glucose
Insulin
The agent we have
to control glucose
only
most powerfulpowerful
QUESTIONS?
For a copy or viewing of these slides
– Contact
• www.adaendo.com
How can I get use of Glucommander?
– Available for review on internet,
• www.glucommander.com
– Contact us: