Embed Size (px)
Citation preview
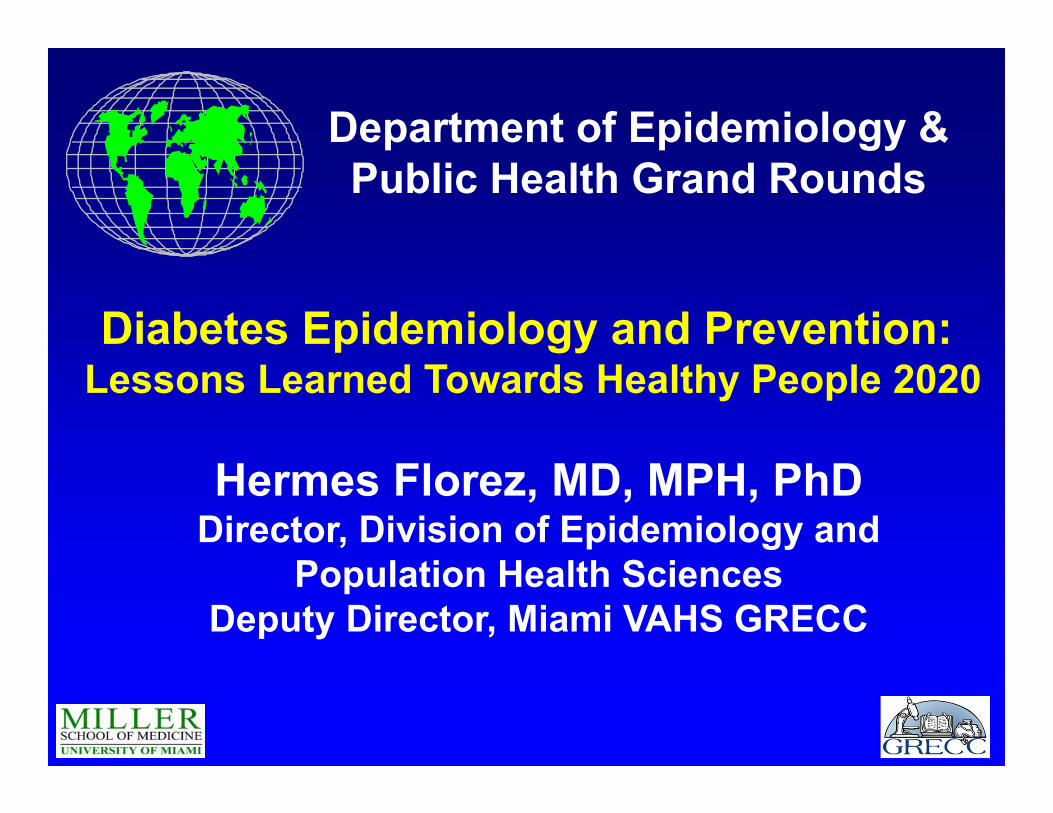
Diabetes Epidemiology and Prevention: Lessons Learned Towards Healthy People 2020
Hermes Florez, MD, MPH, PhDDirector, Division of Epidemiology and
Population Health SciencesDeputy Director, Miami VAHS GRECC
Department of Epidemiology & Public Health Grand Rounds
Objectives• Understand trends in the prevalence of diabetes
mellitus (DM) in the US and abroad.
• Explain emergent risk factors for the development of diabetes chronic complications and the impact of glycemic control among those with DM.
• Identify strategies in subjects with prediabetes that may delay type 2 DM development.
• Review strategies to prevent complications and preserve functionality in older adults with DM.
40
+43%53m
+43%
66m+20%
30m
+67% 24m+100%
52m +93% 101m
+71%
113m +47%
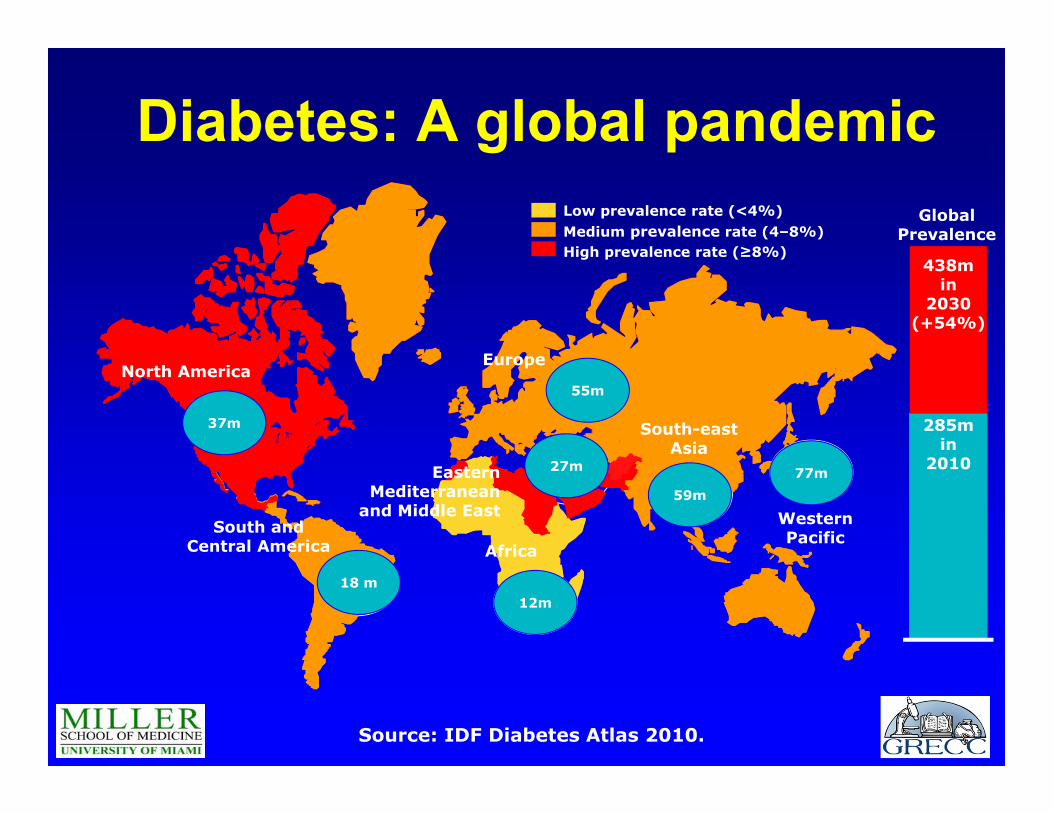
37m
18 m
55m
27m
12m
59m77m
GlobalPrevalence
438m in
2030 (+54%)
285m in
2010
Low prevalence rate (<4%)Medium prevalence rate (4–8%)High prevalence rate (≥8%)
Source: IDF Diabetes Atlas 2010.
South-east Asia
AfricaSouth and
Central America
Eastern Mediterranean
and Middle East Western Pacific
North AmericaEurope
Diabetes: A global pandemic
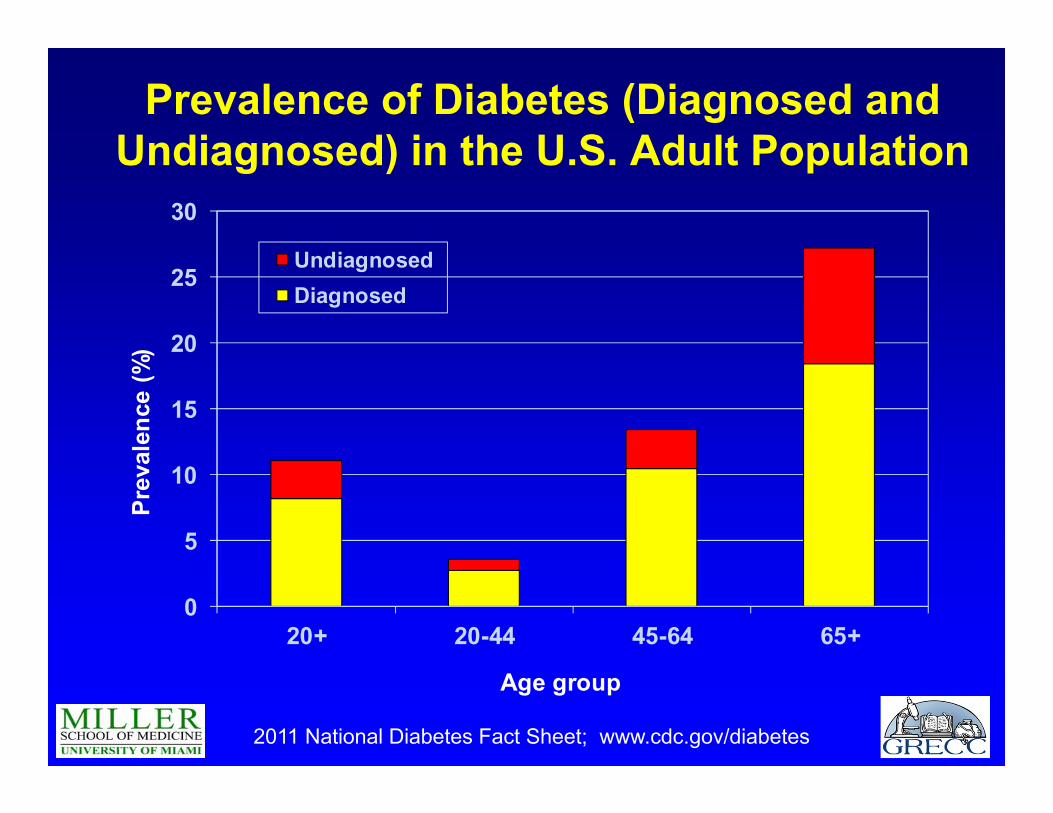
Prevalence of Diabetes (Diagnosed and Undiagnosed) in the U.S. Adult Population
2011 National Diabetes Fact Sheet; www.cdc.gov/diabetes
0
5
10
15
20
25
30
20+ 20-44 45-64 65+
Prev
alen
ce (%
)
Age group
UndiagnosedDiagnosed
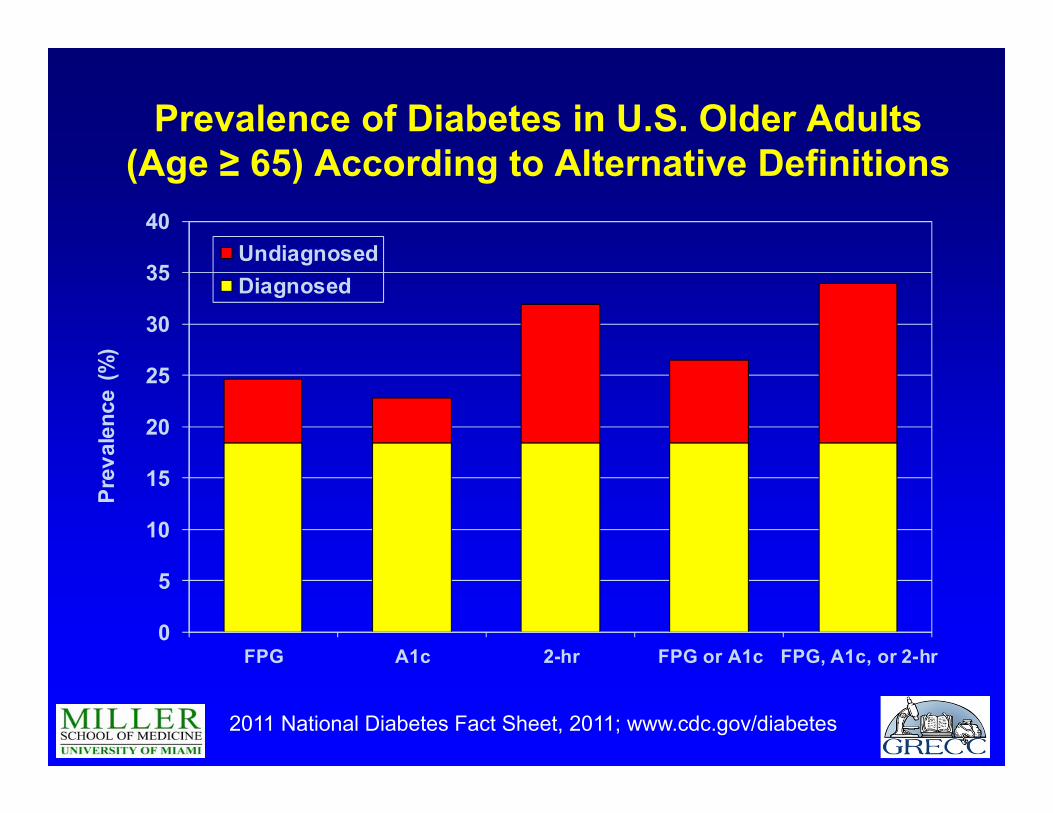
Prevalence of Diabetes in U.S. Older Adults (Age ≥ 65) According to Alternative Definitions
0
5
10
15
20
25
30
35
40
FPG A1c 2-hr FPG or A1c FPG, A1c, or 2-hr
Prev
alen
ce (
%)
UndiagnosedDiagnosed
2011 National Diabetes Fact Sheet, 2011; www.cdc.gov/diabetes
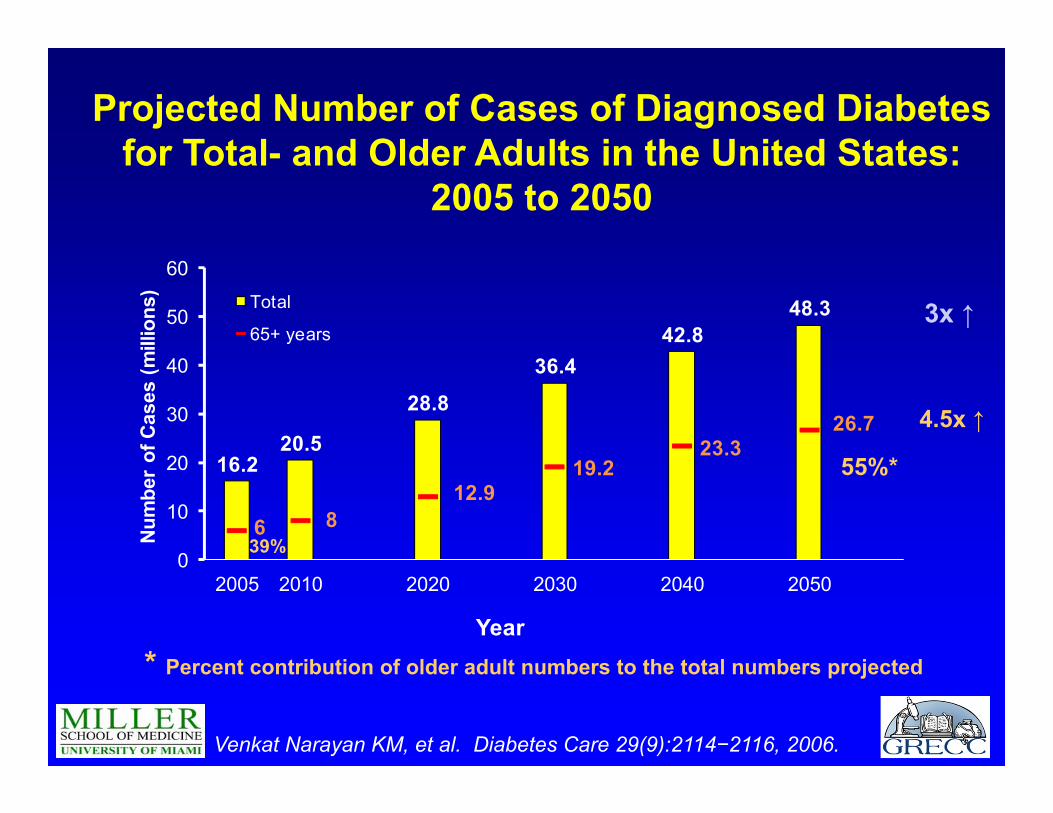
16.220.5
28.8
36.442.8
48.3
6 812.9
19.223.3
26.7
0
10
20
30
40
50
60
2005 2010 2020 2030 2040 2050
Num
ber
of C
ases
(mill
ions
)
Year
Total
65+ years
39%
55%*
Venkat Narayan KM, et al. Diabetes Care 29(9):2114−2116, 2006.
Projected Number of Cases of Diagnosed Diabetes for Total- and Older Adults in the United States:
2005 to 2050
* Percent contribution of older adult numbers to the total numbers projected
3x ↑
4.5x ↑
HP 2020: Reduce the disease and economic burden of diabetes mellitus
• Reduce the rate of all-cause mortality and
cardiovascular disease mortality in those with diabetes.
• Reduce the rate of lower extremity amputations in persons
with diabetes.
• Improve glycemic control among the population with
diagnosed diabetes
• Improve the blood pressure and lipid control in the
populations with diabetes.
healthypeople.gov/2020
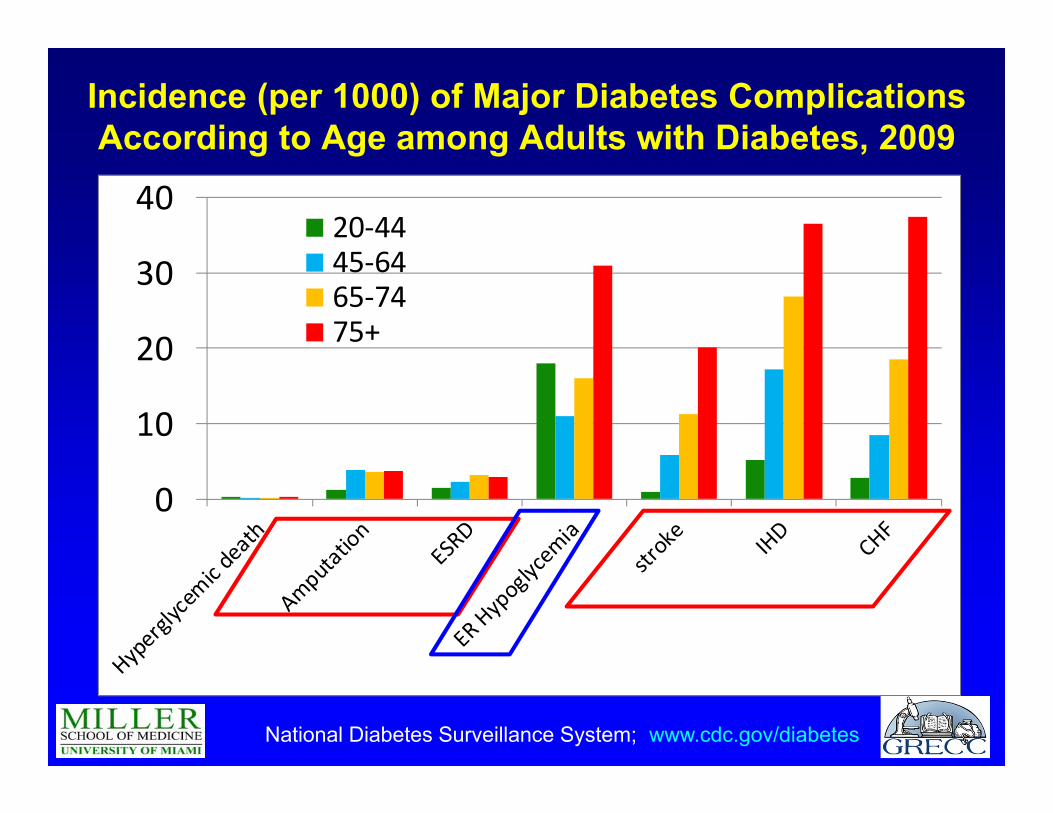
Incidence (per 1000) of Major Diabetes Complications According to Age among Adults with Diabetes, 2009
0
10
20
30
4020‐4445‐6465‐7475+
National Diabetes Surveillance System; www.cdc.gov/diabetes
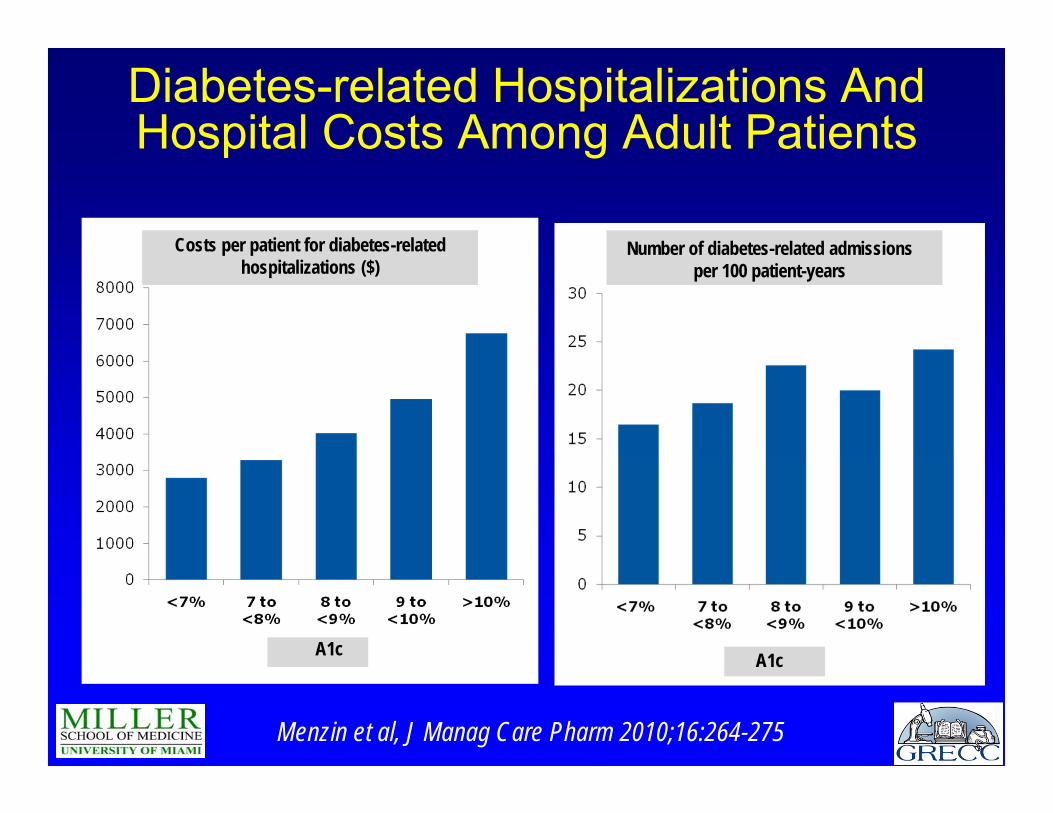
Diabetes-related Hospitalizations And Hospital Costs Among Adult Patients
n=9,887
Menzin et al, J Manag Care Pharm 2010;16:264-275
A1c A1c
Costs per patient for diabetes-related hospitalizations ($)
Number of diabetes-related admissions per 100 patient-years
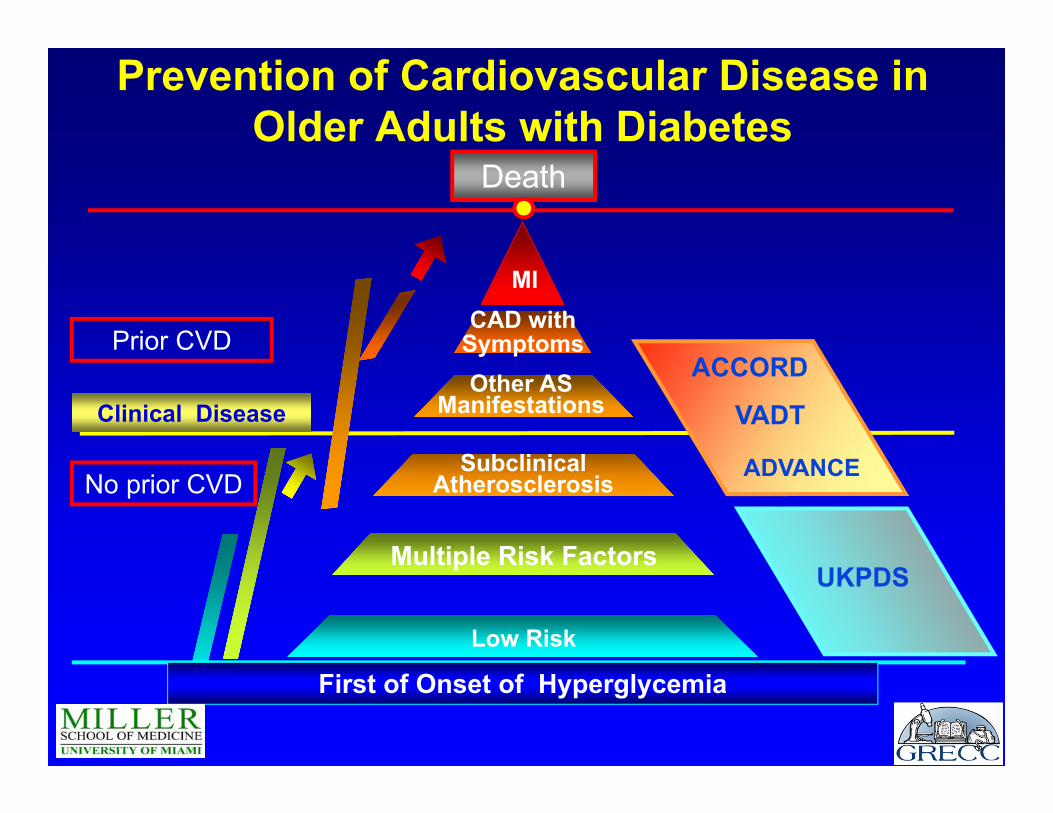
Death
Prevention of Cardiovascular Disease in Older Adults with Diabetes
Prior CVD
VADT
MICAD with
Symptoms
Subclinical Atherosclerosis
Multiple Risk Factors
Low Risk
Other ASManifestations
No prior CVD
First of Onset of Hyperglycemia
Clinical Disease
ACCORD
ADVANCE
UKPDS
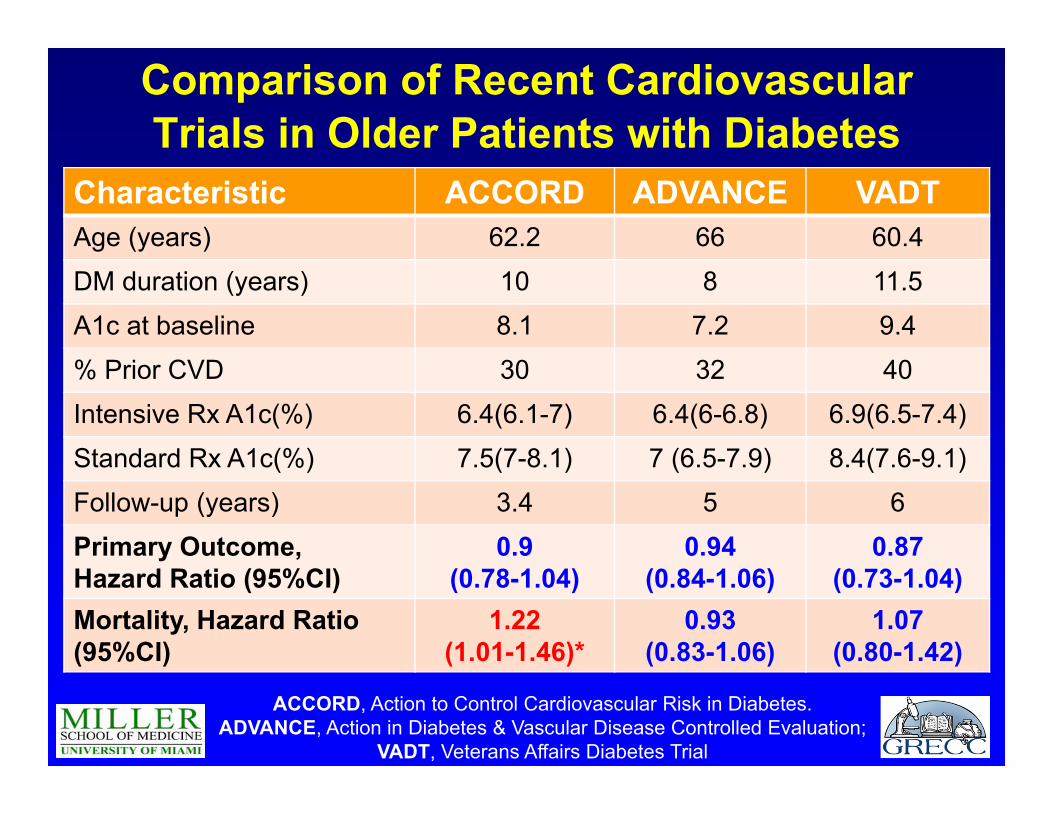
Comparison of Recent Cardiovascular Trials in Older Patients with Diabetes
Characteristic ACCORD ADVANCE VADTAge (years) 62.2 66 60.4DM duration (years) 10 8 11.5A1c at baseline 8.1 7.2 9.4
% Prior CVD 30 32 40Intensive Rx A1c(%) 6.4(6.1-7) 6.4(6-6.8) 6.9(6.5-7.4)Standard Rx A1c(%) 7.5(7-8.1) 7 (6.5-7.9) 8.4(7.6-9.1)Follow-up (years) 3.4 5 6Primary Outcome, Hazard Ratio (95%CI)
0.9(0.78-1.04)
0.94(0.84-1.06)
0.87(0.73-1.04)
Mortality, Hazard Ratio (95%CI)
1.22(1.01-1.46)*
0.93 (0.83-1.06)
1.07(0.80-1.42)
ACCORD, Action to Control Cardiovascular Risk in Diabetes. ADVANCE, Action in Diabetes & Vascular Disease Controlled Evaluation;
VADT, Veterans Affairs Diabetes Trial
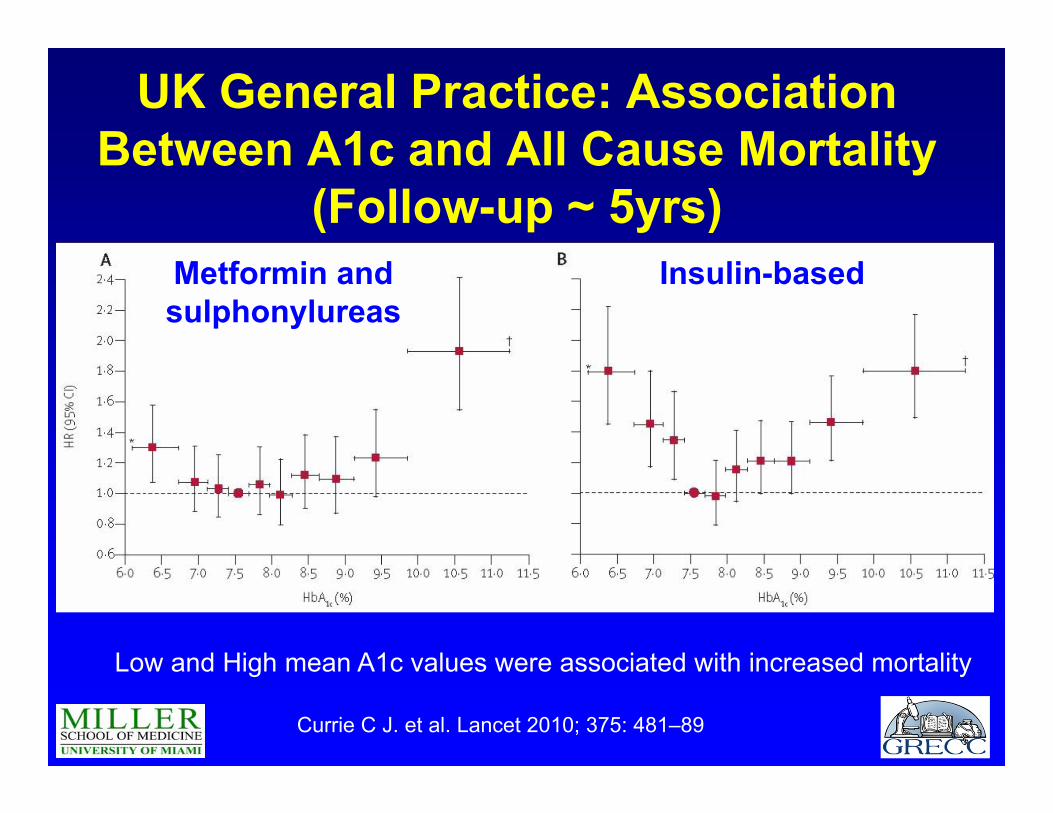
UK General Practice: Association Between A1c and All Cause Mortality
(Follow-up ~ 5yrs)
Currie C J. et al. Lancet 2010; 375: 481–89
Low and High mean A1c values were associated with increased mortality
Metformin and sulphonylureas
Insulin-based
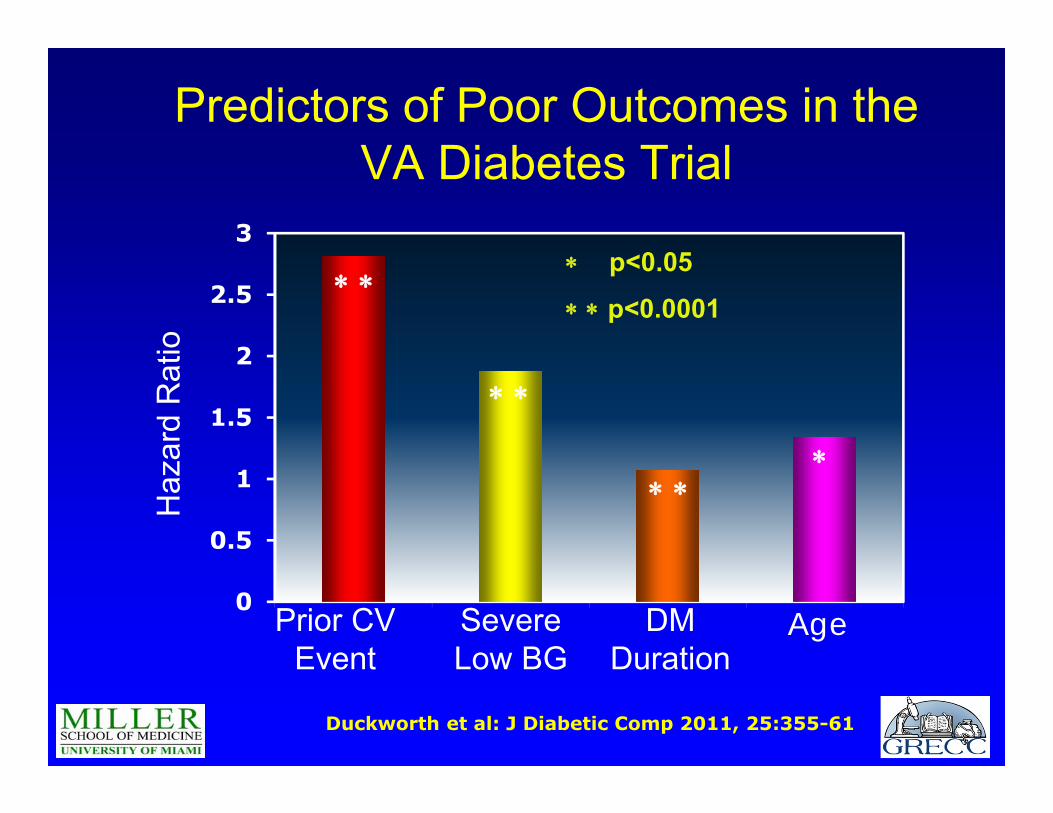
Predictors of Poor Outcomes in the VA Diabetes Trial
0
0.5
1
1.5
2
2.5
3 p<0.05
p<0.0001
Duckworth et al: J Diabetic Comp 2011, 25:355-61
Prior CV Event
AgeSevere Low BG
DM Duration
Haz
ard
Rat
io
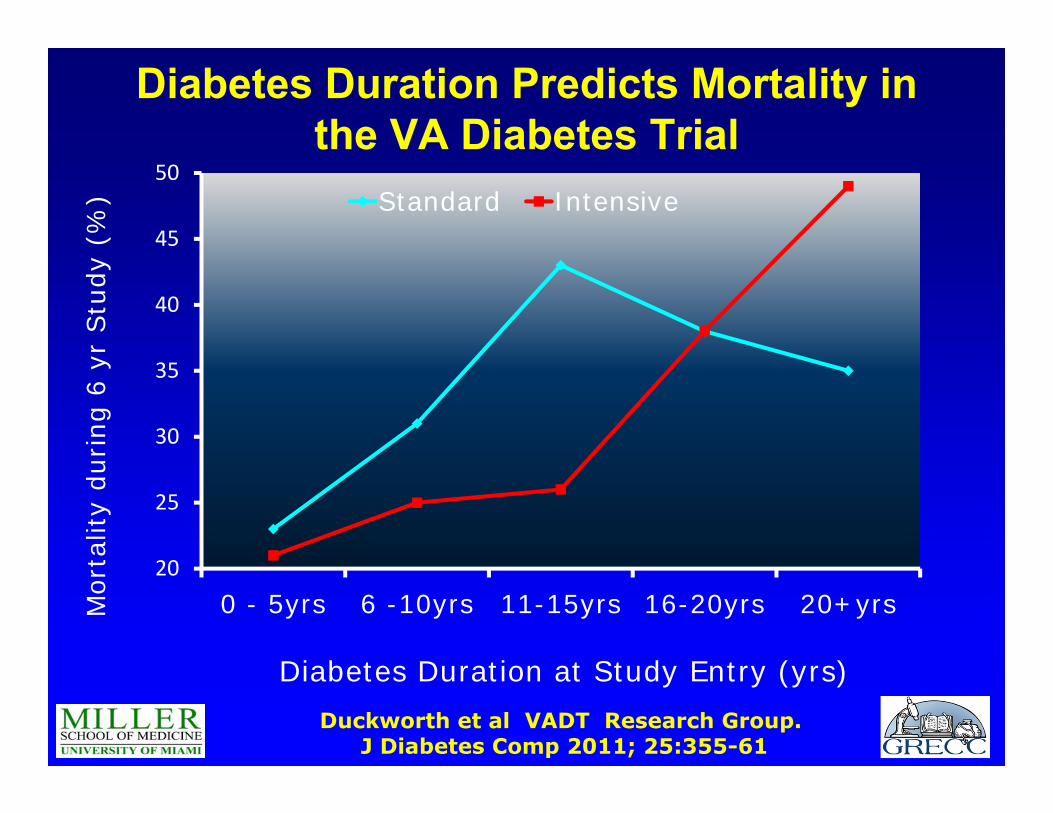
Diabetes Duration Predicts Mortality in the VA Diabetes Trial
20
25
30
35
40
45
50
0 - 5yrs 6 -10yrs 11-15yrs 16-20yrs 20+yrsMor
talit
y du
ring
6 y
r Stu
dy (
%)
Diabetes Duration at Study Entry (yrs)
Standard Intensive
Duckworth et al VADT Research Group. J Diabetes Comp 2011; 25:355-61
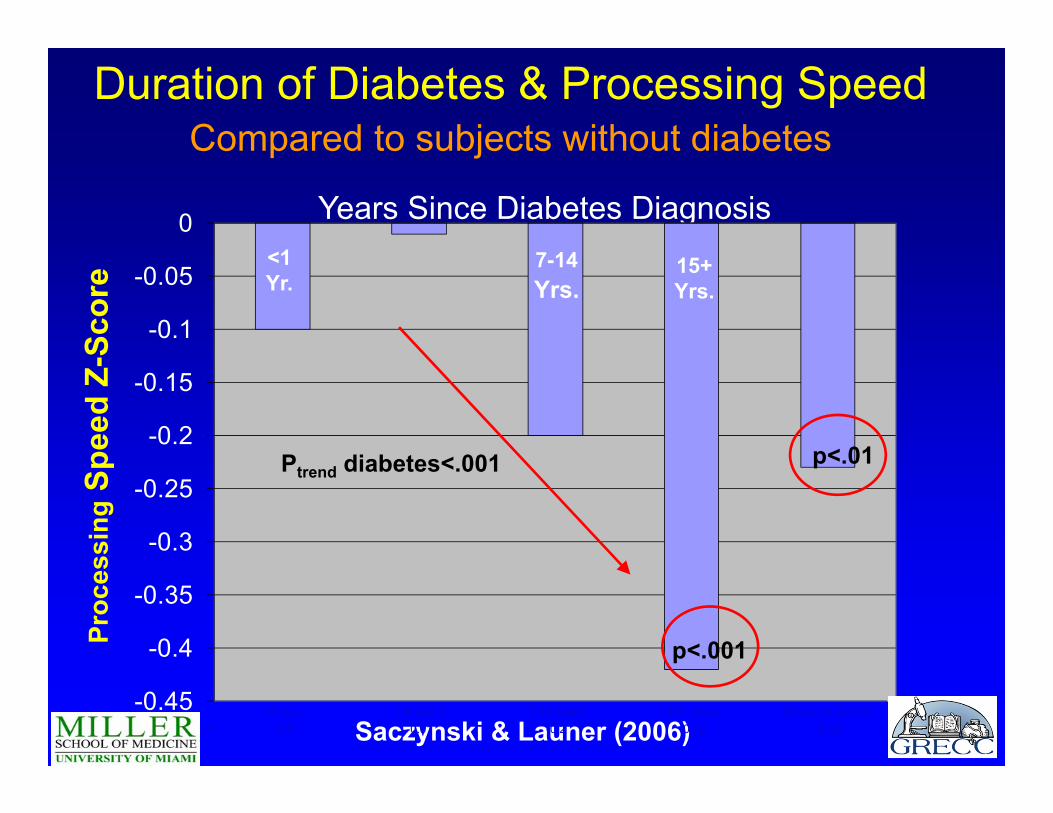
Duration of Diabetes & Processing SpeedCompared to subjects without diabetes
Proc
essi
ngSp
eed
Z-Sc
ore
P for trend = .002
Years Since Diabetes Diagnosis
Saczynski & Launer (2006)-0.45
-0.4
-0.35
-0.3
-0.25
-0.2
-0.15
-0.1
-0.05
0
<1 year 1-6 years 7-14 years 15+ years Unknown diabeticSeries1 -0.1 -0.01 -0.2 -0.42 -0.23
p<.001
Ptrend diabetes<.001 p<.01
<1 Yr.
7-14Yrs.
15+ Yrs.
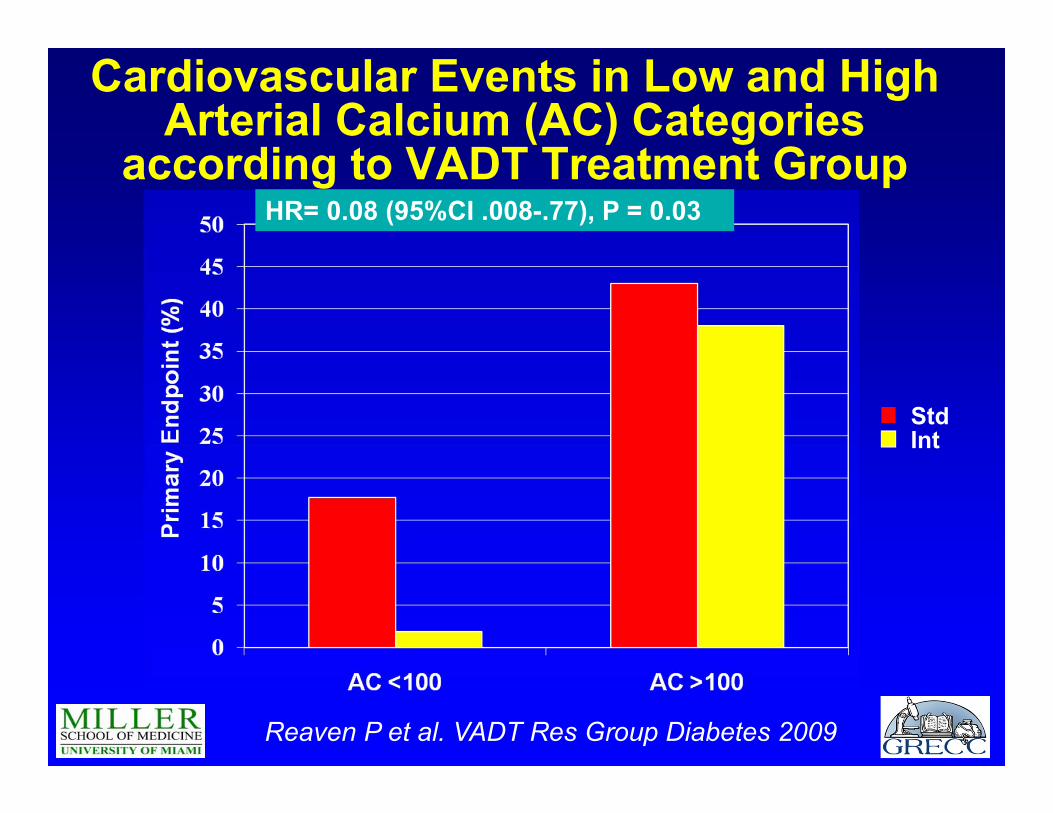
Cardiovascular Events in Low and High Arterial Calcium (AC) Categories
according to VADT Treatment Group
StdInt
Reaven P et al. VADT Res Group Diabetes 2009
HR= 0.08 (95%CI .008-.77), P = 0.03
HP 2020: Increase prevention behaviors in persons at high risk for diabetes
• Reduce the new cases of diabetes in the population • Increase the proportion of persons with prediabetes
who report: – increasing their levels of physical activity – trying to lose weight– reducing the amount of fat or calories in their diet
• Increase the proportion of physician office visits with counseling or education related to nutrition or weight.
• Improve the quality of life for all persons who have, or are at risk for diabetes.
healthypeople.gov/2020
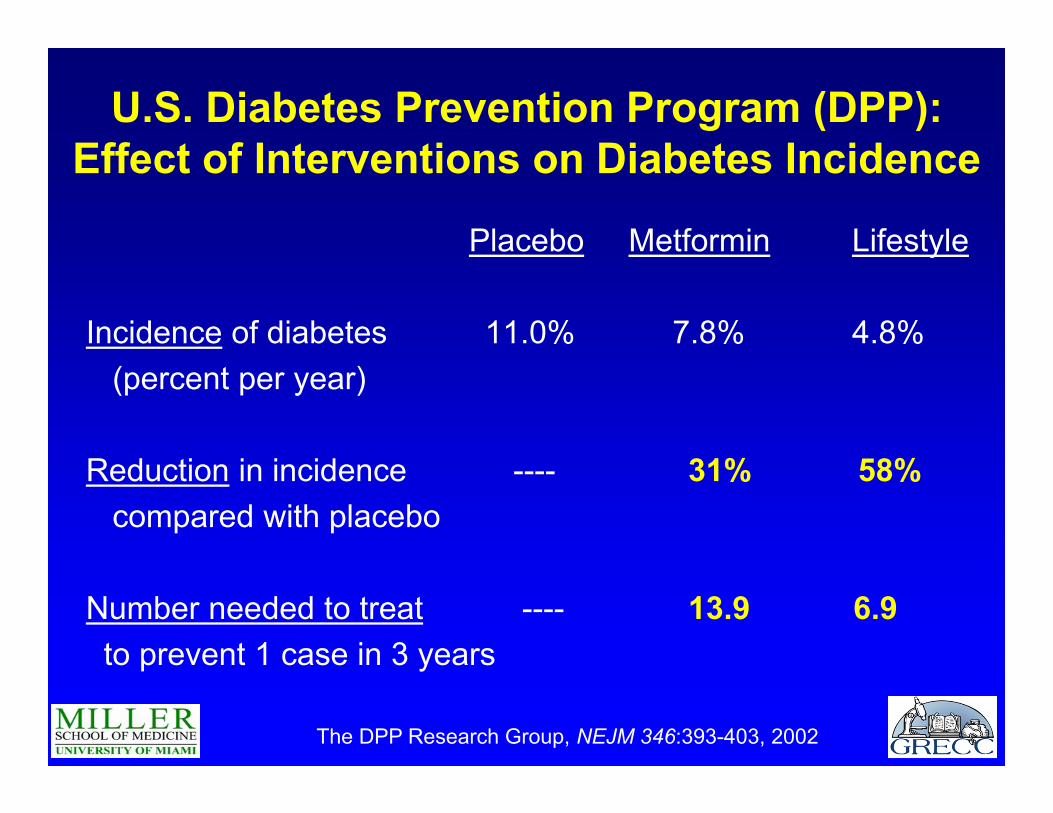
U.S. Diabetes Prevention Program (DPP):Effect of Interventions on Diabetes Incidence
Placebo Metformin Lifestyle
Incidence of diabetes 11.0% 7.8% 4.8%(percent per year)
Reduction in incidence ---- 31% 58% compared with placebo
Number needed to treat ---- 13.9 6.9to prevent 1 case in 3 years
The DPP Research Group, NEJM 346:393-403, 2002
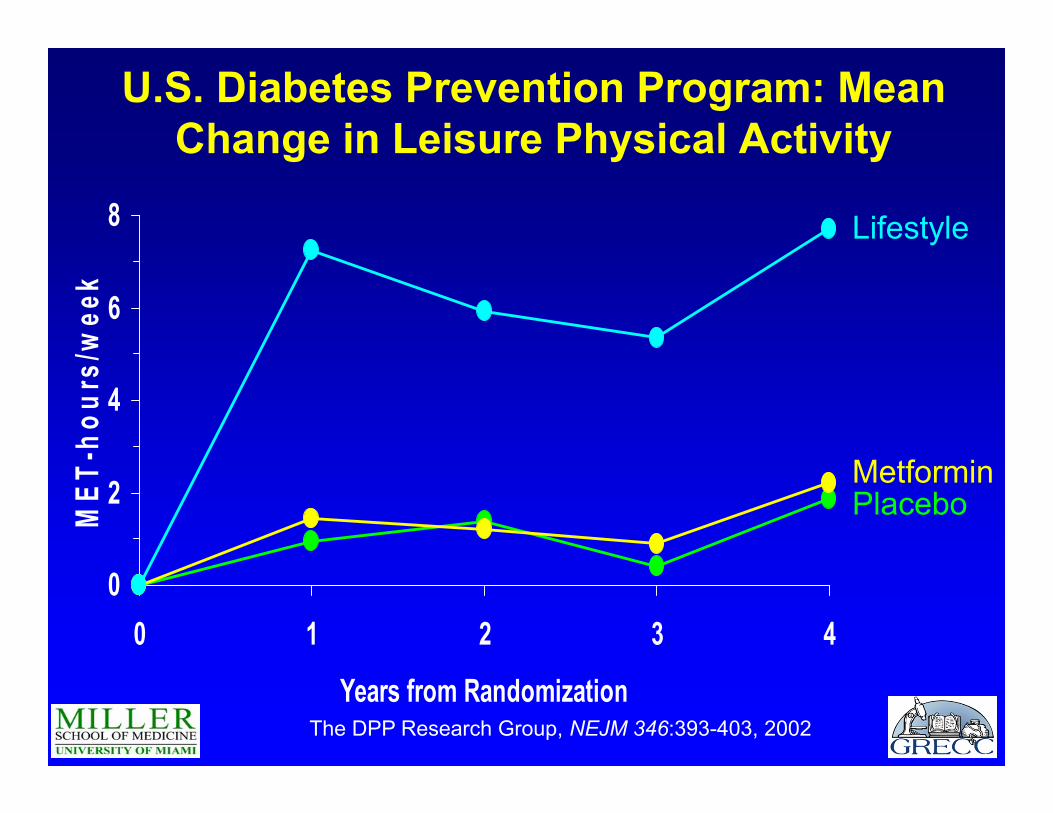
U.S. Diabetes Prevention Program: Mean Change in Leisure Physical Activity
0
2
4
6
8
0 1 2 3 4
Years from Randomization
MET
-hou
rs/w
eek
PlaceboMetformin
Lifestyle
The DPP Research Group, NEJM 346:393-403, 2002
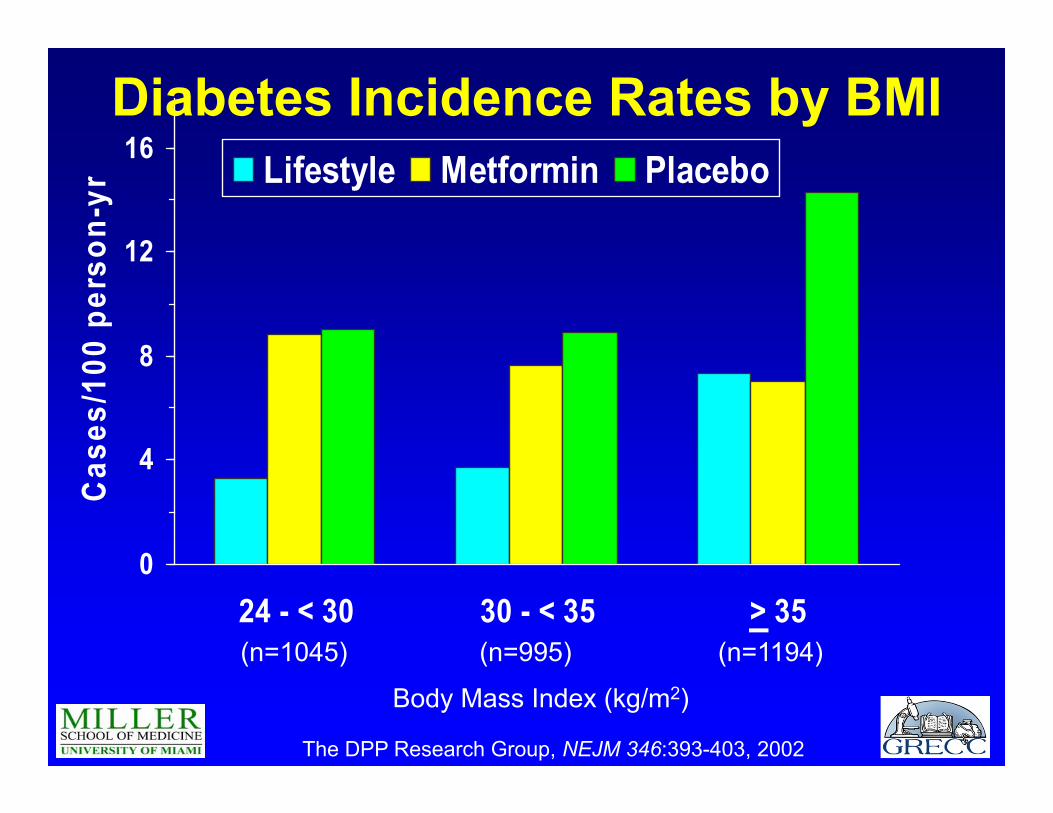
0
4
8
12
16
24 - < 30 30 - < 35 > 35
Cas
es/1
00 p
erso
n-yr
Lifestyle Metformin Placebo
(n=1045) (n=995) (n=1194)
Diabetes Incidence Rates by BMI
Body Mass Index (kg/m2)
The DPP Research Group, NEJM 346:393-403, 2002
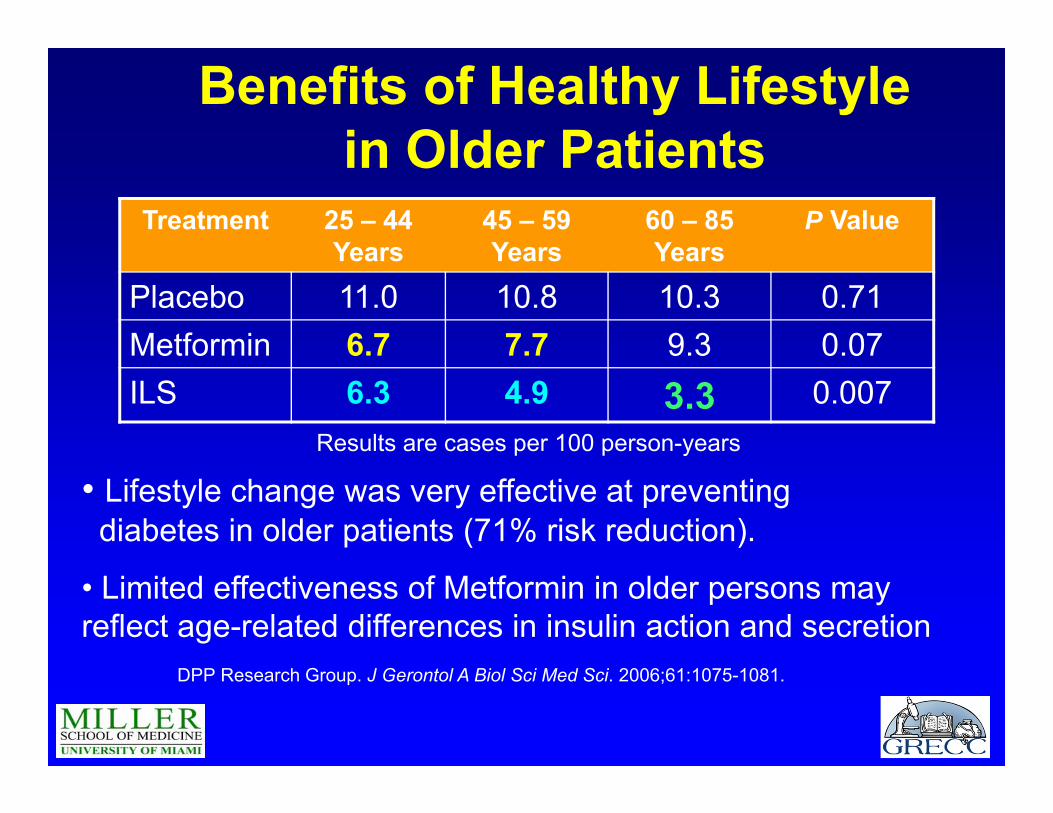
Benefits of Healthy Lifestyle in Older Patients
Treatment 25 – 44 Years
45 – 59 Years
60 – 85 Years
P Value
Placebo 11.0 10.8 10.3 0.71Metformin 6.7 7.7 9.3 0.07ILS 6.3 4.9 3.3 0.007
Results are cases per 100 person-years
• Lifestyle change was very effective at preventing diabetes in older patients (71% risk reduction).
• Limited effectiveness of Metformin in older persons may reflect age-related differences in insulin action and secretion
DPP Research Group. J Gerontol A Biol Sci Med Sci. 2006;61:1075-1081.
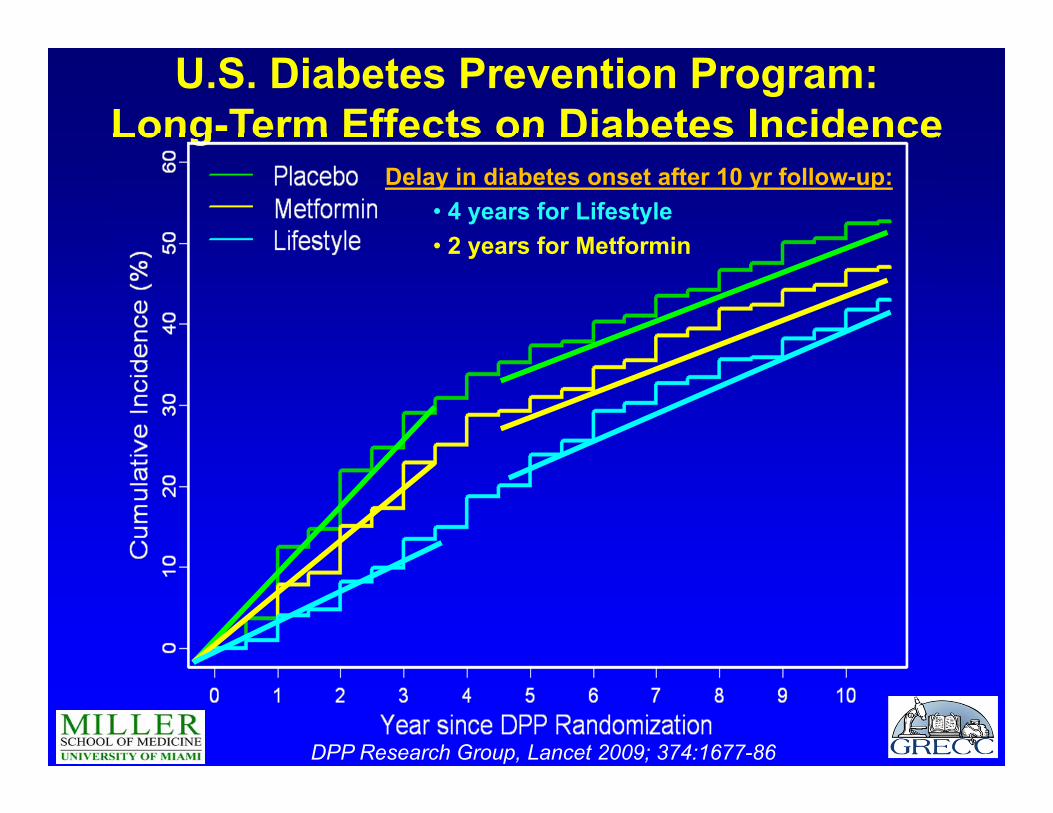
U.S. Diabetes Prevention Program: Long-Term Effects on Diabetes Incidence
Delay in diabetes onset after 10 yr follow-up:• 4 years for Lifestyle• 2 years for Metformin
DPP Research Group, Lancet 2009; 374:1677-86
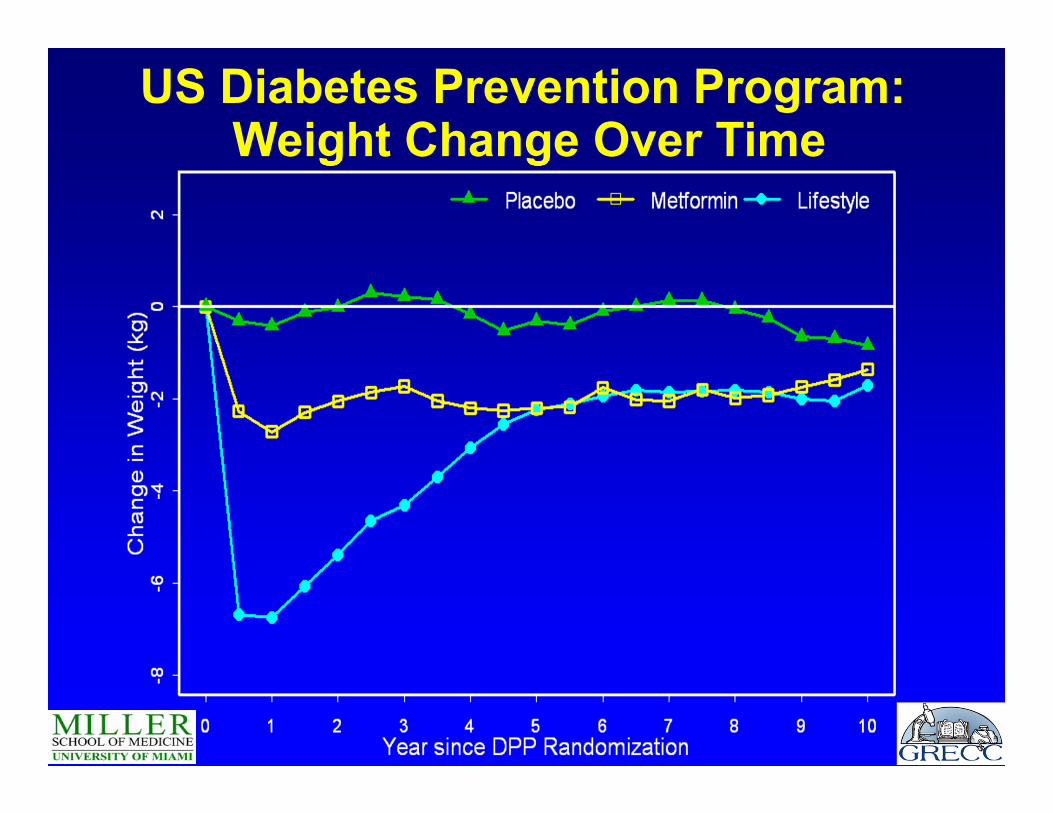
US Diabetes Prevention Program: Weight Change Over Time
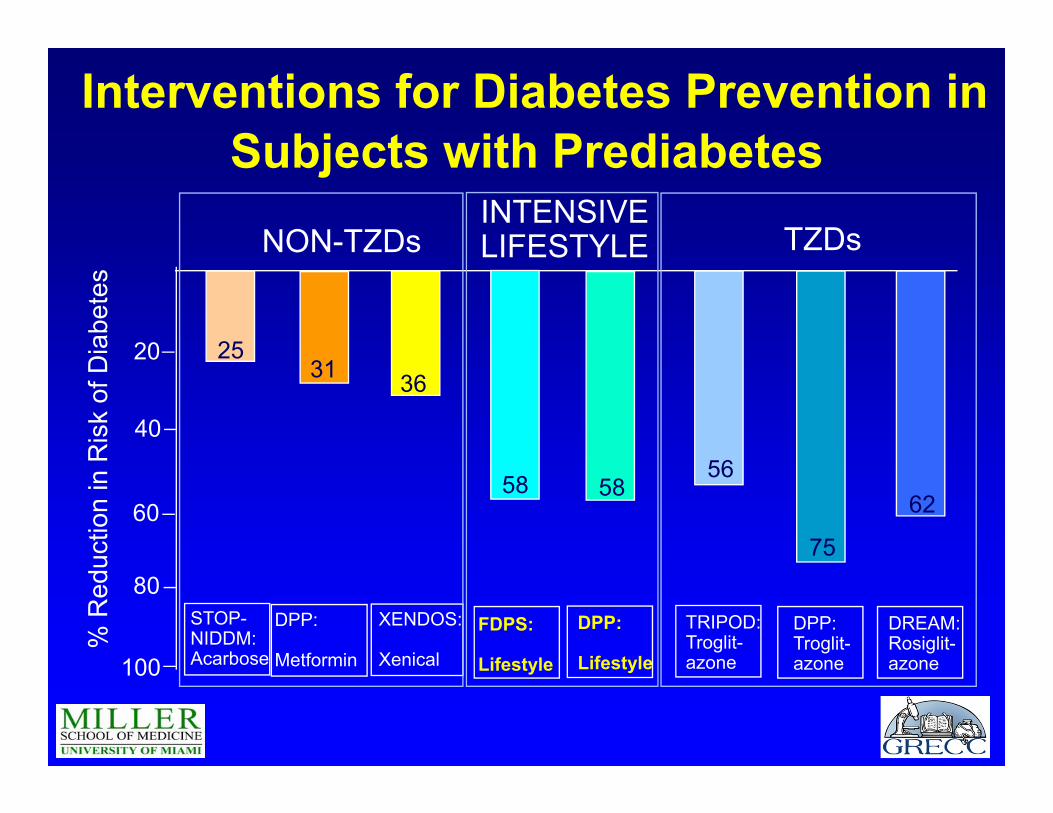
Interventions for Diabetes Prevention in Subjects with Prediabetes
100
20
40
60
80
% R
educ
tion
in R
isk
of D
iabe
tes
2531 36
58 58
STOP-NIDDM:Acarbose
DPP:
Metformin
XENDOS:
Xenical
FDPS:
Lifestyle
DPP:
Lifestyle
INTENSIVELIFESTYLENON-TZDs
56
TRIPOD:Troglit-azone
TZDs
75
DPP:Troglit-azone
62
DREAM:Rosiglit-azone
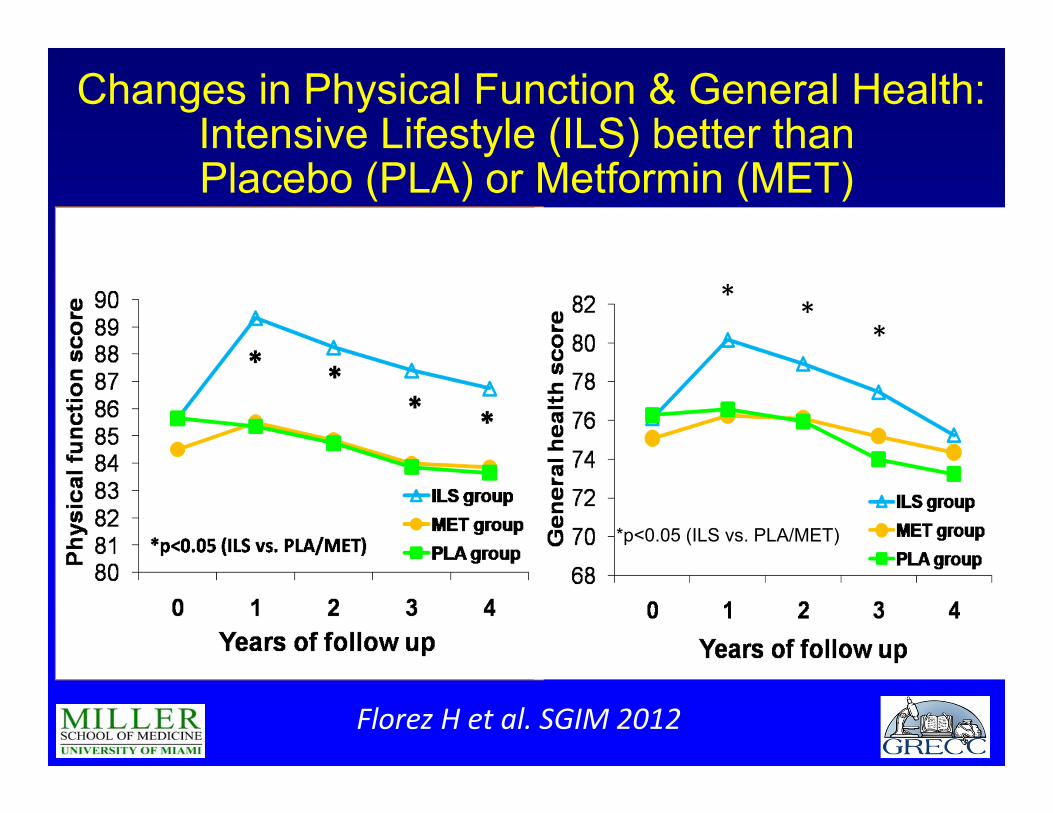
Changes in Physical Function & General Health: Intensive Lifestyle (ILS) better than Placebo (PLA) or Metformin (MET)
* **
*p<0.05 (ILS vs. PLA/MET)
Florez H et al. SGIM 2012
WHO/PAHO Strategy and Plan of Action: Prevention and Control of Chronic Diseases
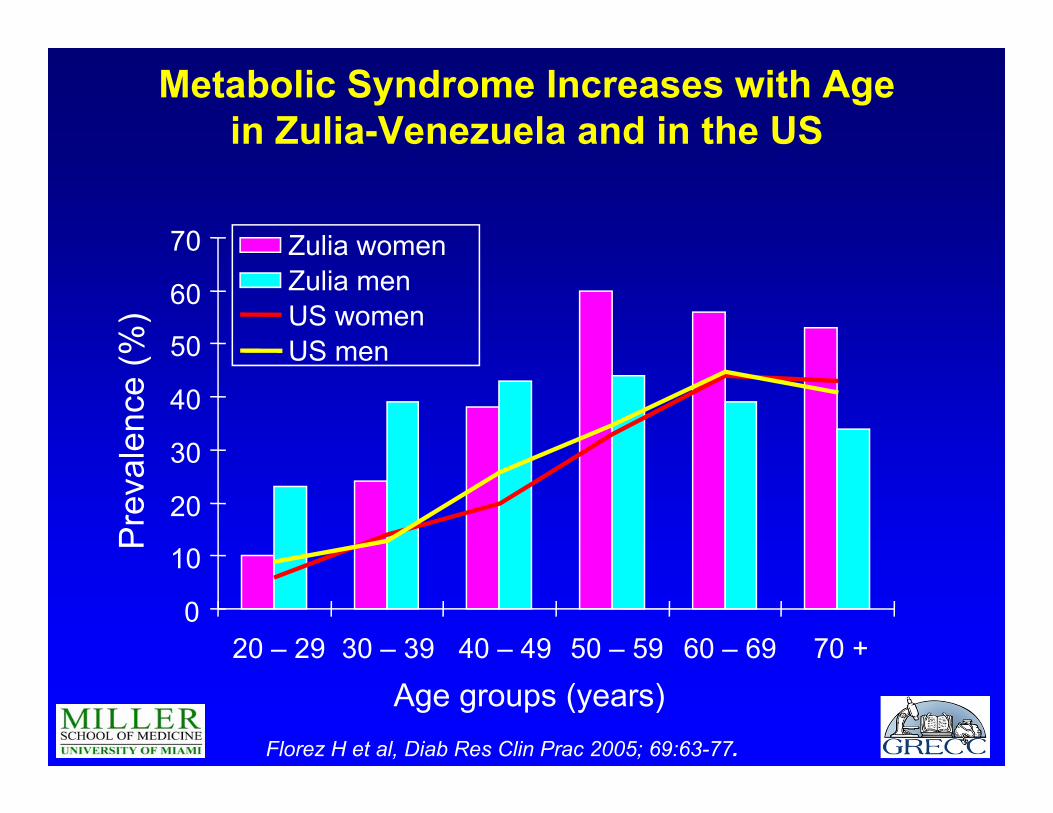
Metabolic Syndrome Increases with Age in Zulia-Venezuela and in the US
Florez H et al, Diab Res Clin Prac 2005; 69:63-77.
0
10
20
30
40
50
60
70
20 – 29 30 – 39 40 – 49 50 – 59 60 – 69 70 +
Age groups (years)
Pre
vale
nce
(%)
Zulia womenZulia menUS womenUS men
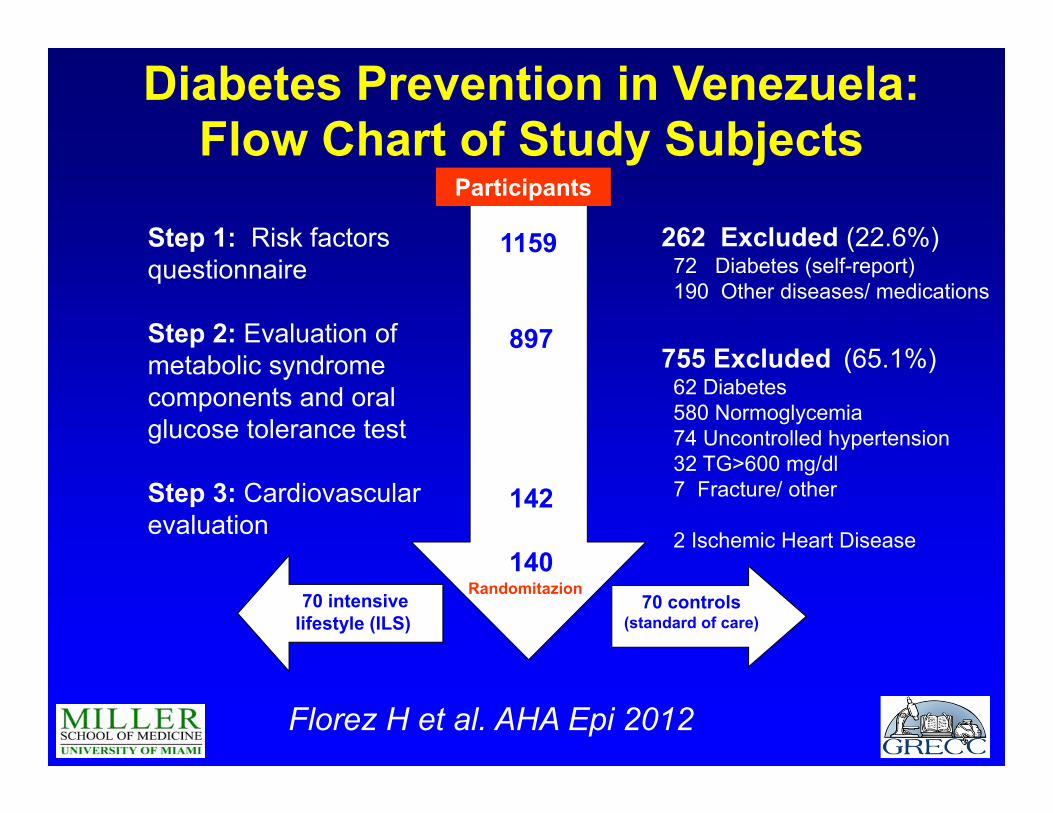
Diabetes Prevention in Venezuela:Flow Chart of Study Subjects
Step 1: Risk factors questionnaire
Step 2: Evaluation of metabolic syndrome components and oral glucose tolerance test
Step 3: Cardiovascular evaluation
262 Excluded (22.6%)72 Diabetes (self-report)190 Other diseases/ medications
755 Excluded (65.1%)62 Diabetes580 Normoglycemia74 Uncontrolled hypertension32 TG>600 mg/dl 7 Fracture/ other
2 Ischemic Heart Disease
70 intensive lifestyle (ILS)
70 controls (standard of care)
1159
897
142
140
Participants
Randomitazion
Florez H et al. AHA Epi 2012
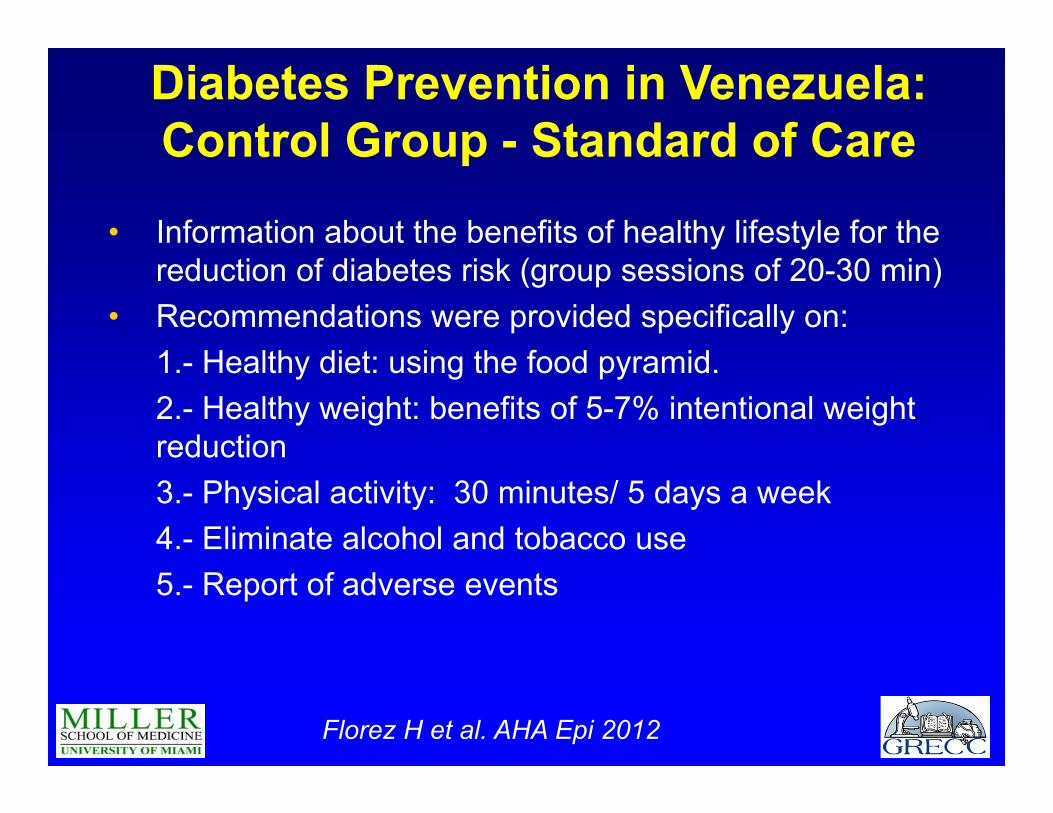
• Information about the benefits of healthy lifestyle for the reduction of diabetes risk (group sessions of 20-30 min)
• Recommendations were provided specifically on: 1.- Healthy diet: using the food pyramid.2.- Healthy weight: benefits of 5-7% intentional weight reduction3.- Physical activity: 30 minutes/ 5 days a week4.- Eliminate alcohol and tobacco use5.- Report of adverse events
Diabetes Prevention in Venezuela:Control Group - Standard of Care
Florez H et al. AHA Epi 2012
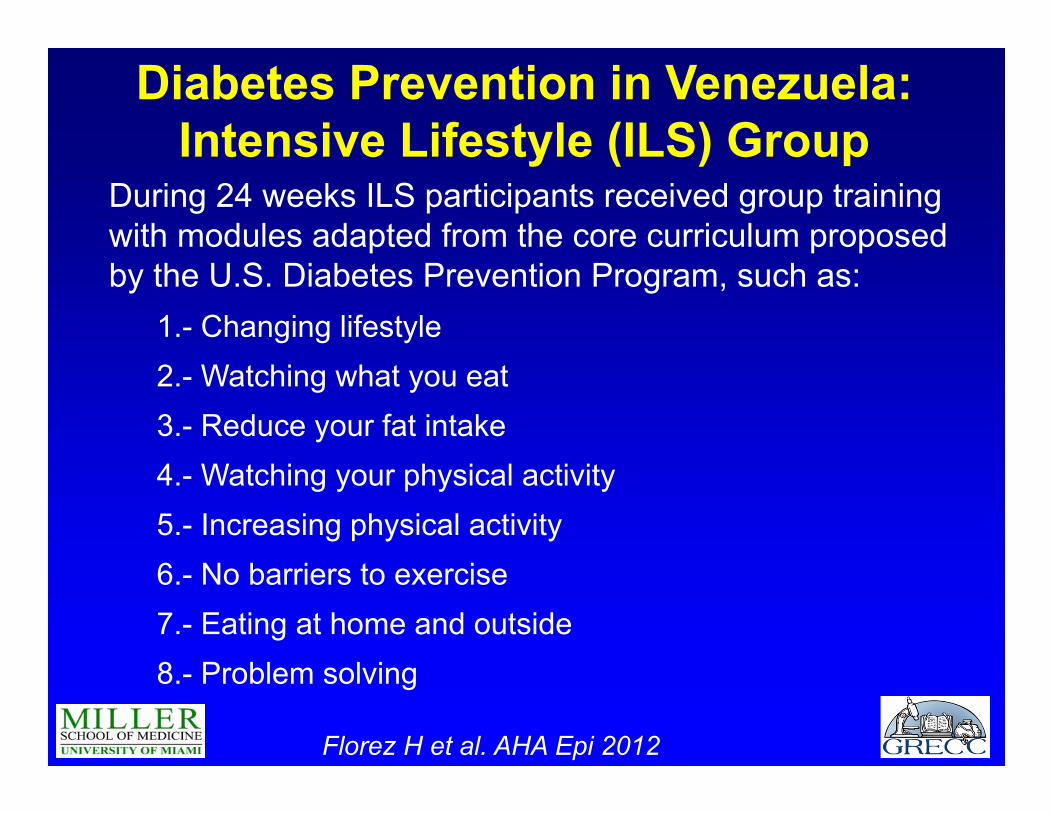
During 24 weeks ILS participants received group training with modules adapted from the core curriculum proposed by the U.S. Diabetes Prevention Program, such as:
1.- Changing lifestyle 2.- Watching what you eat 3.- Reduce your fat intake4.- Watching your physical activity5.- Increasing physical activity6.- No barriers to exercise7.- Eating at home and outside8.- Problem solving
Diabetes Prevention in Venezuela:Intensive Lifestyle (ILS) Group
Florez H et al. AHA Epi 2012
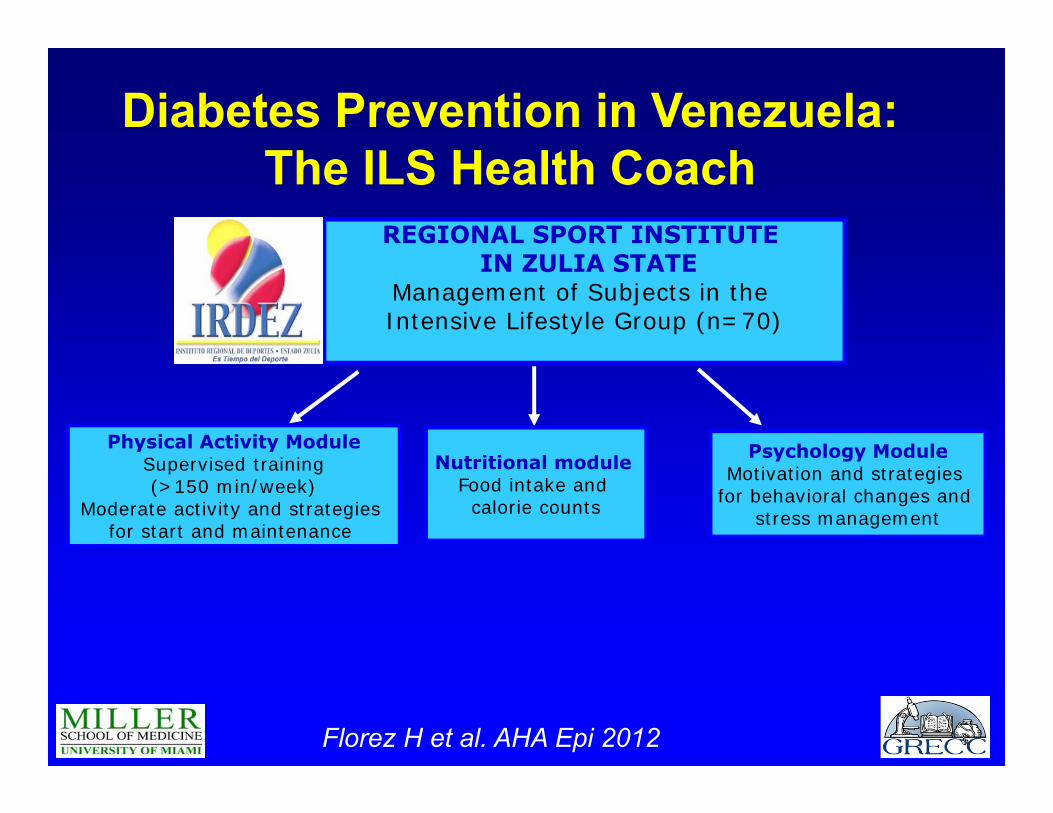
Physical Activity ModuleSupervised training(>150 min/week)
Moderate activity and strategies for start and maintenance
Psychology ModuleMotivation and strategies
for behavioral changes and stress management
Nutritional module Food intake and
calorie counts
REGIONAL SPORT INSTITUTE IN ZULIA STATE
Management of Subjects in the Intensive Lifestyle Group (n=70)
Diabetes Prevention in Venezuela: The ILS Health Coach
Florez H et al. AHA Epi 2012
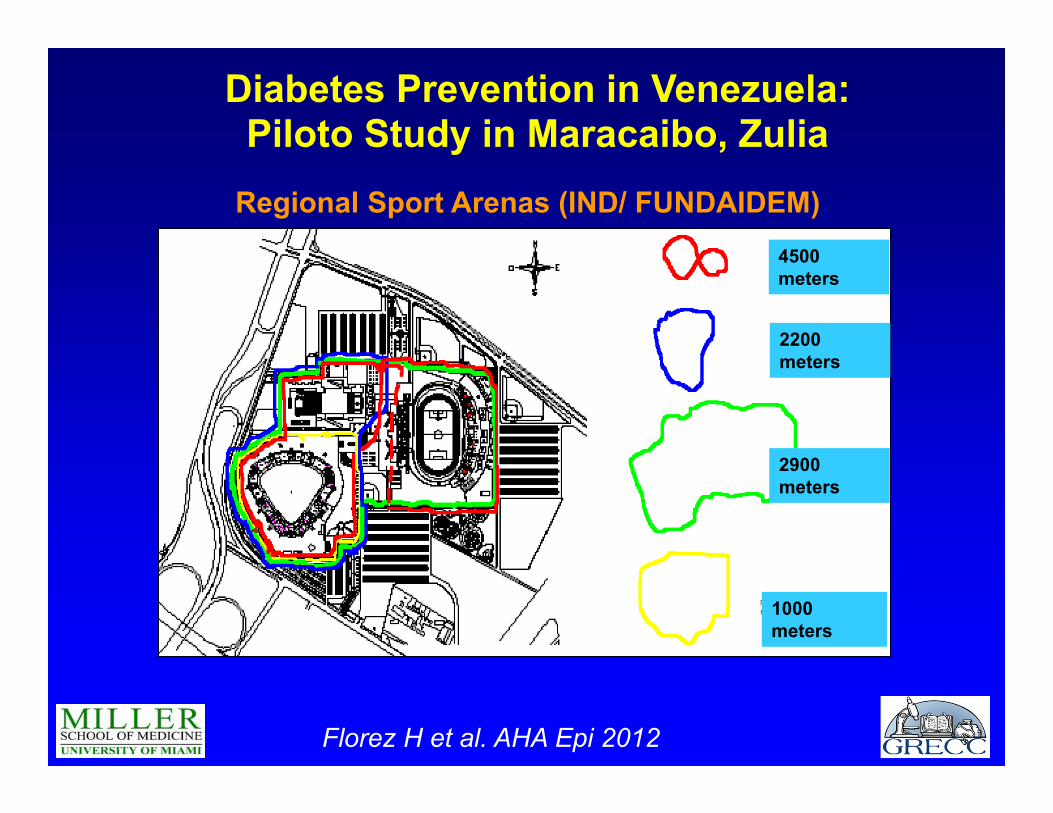
Diabetes Prevention in Venezuela:Piloto Study in Maracaibo, Zulia
Regional Sport Arenas (IND/ FUNDAIDEM)4500 meters
2200 meters
2900 meters
1000 meters
Florez H et al. AHA Epi 2012
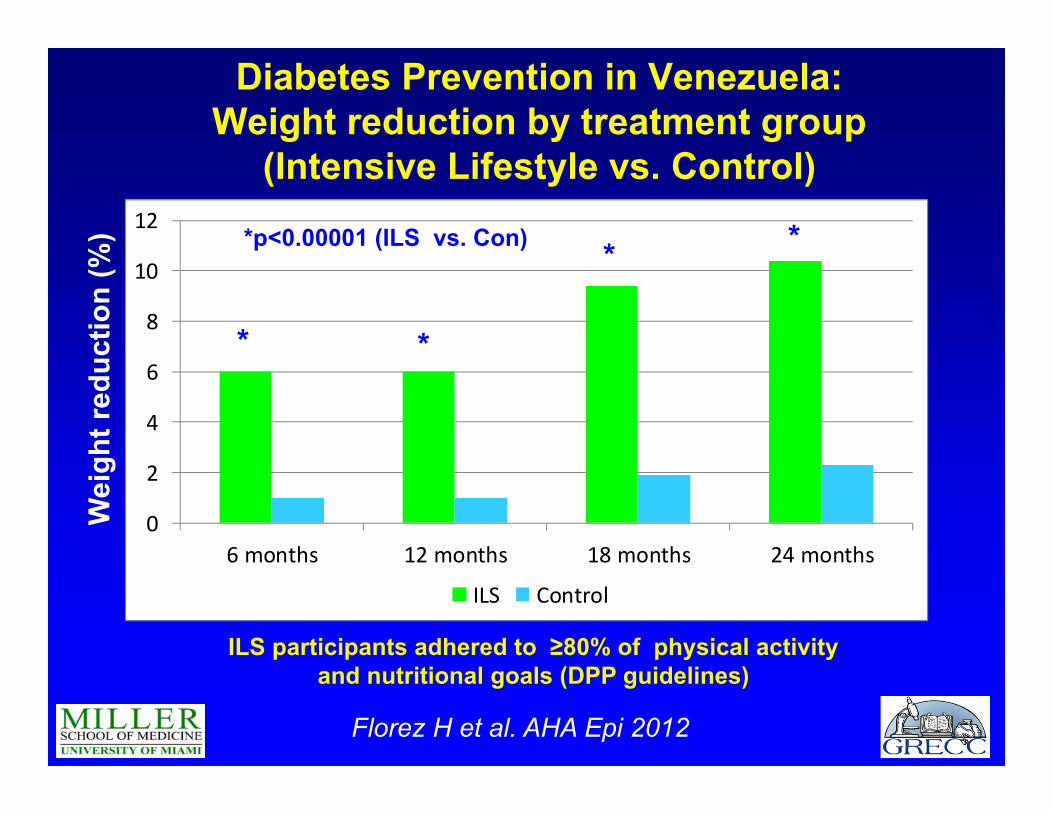
Diabetes Prevention in Venezuela:Weight reduction by treatment group
(Intensive Lifestyle vs. Control)
0
2
4
6
8
10
12
6 months 12 months 18 months 24 months
ILS Control
Wei
ght r
educ
tion
(%)
*
*p<0.00001 (ILS vs. Con)
*
**
ILS participants adhered to ≥80% of physical activity and nutritional goals (DPP guidelines)
Florez H et al. AHA Epi 2012
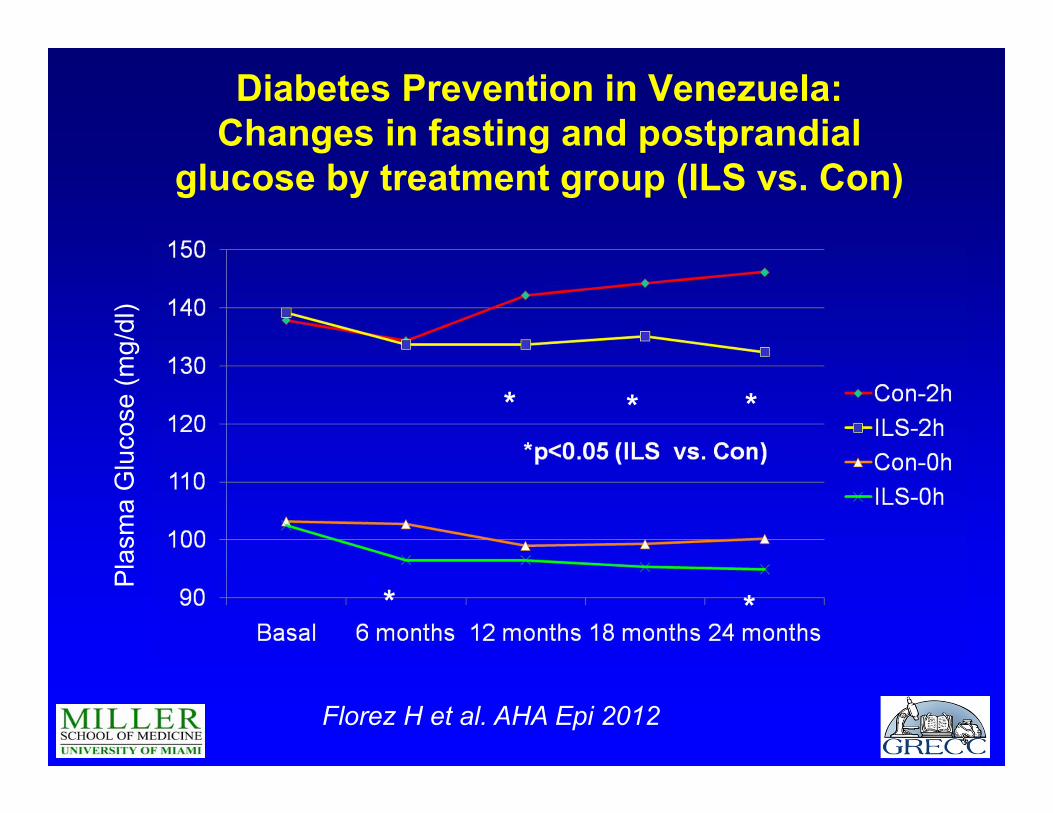
Diabetes Prevention in Venezuela:Changes in fasting and postprandial
glucose by treatment group (ILS vs. Con)
* *Pla
sma
Glu
cose
(mg/
dl)
* * *
* *
Florez H et al. AHA Epi 2012
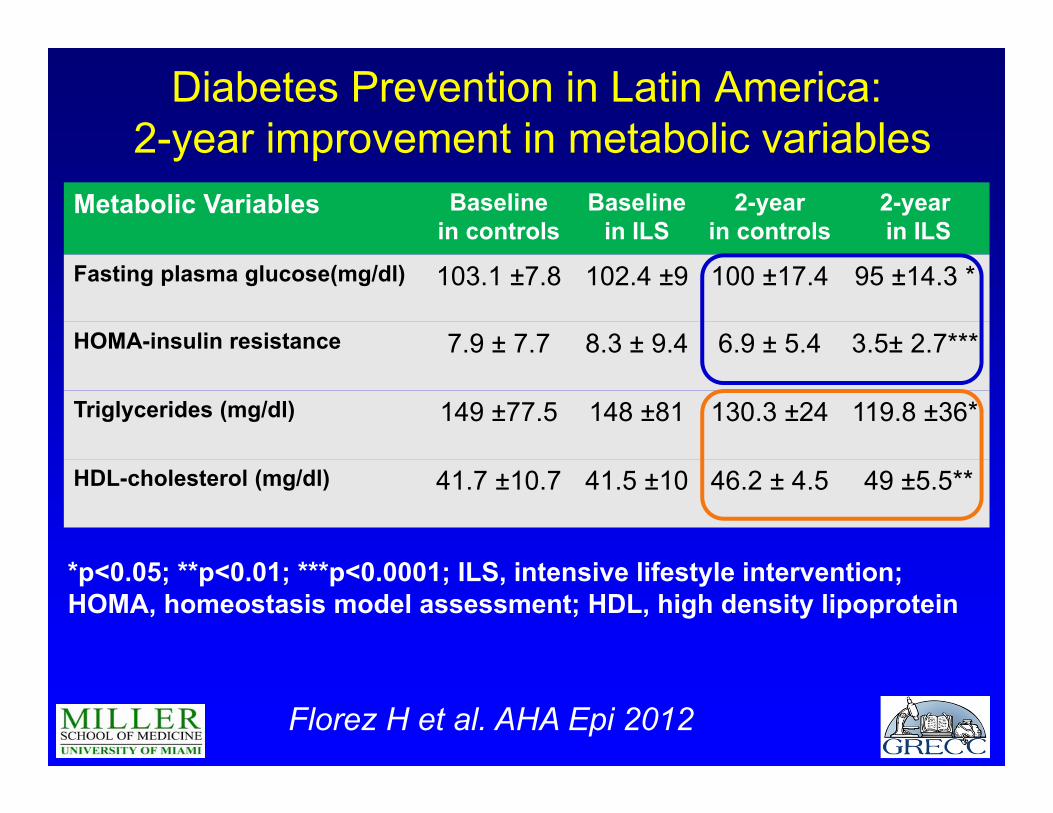
Diabetes Prevention in Latin America:2-year improvement in metabolic variables
Metabolic Variables Baselinein controls
Baseline in ILS
2-year in controls
2-yearin ILS
Fasting plasma glucose(mg/dl) 103.1 ±7.8 102.4 ±9 100 ±17.4 95 ±14.3 *
HOMA-insulin resistance 7.9 ± 7.7 8.3 ± 9.4 6.9 ± 5.4 3.5± 2.7***
Triglycerides (mg/dl) 149 ±77.5 148 ±81 130.3 ±24 119.8 ±36*
HDL-cholesterol (mg/dl) 41.7 ±10.7 41.5 ±10 46.2 ± 4.5 49 ±5.5**
*p<0.05; **p<0.01; ***p<0.0001; ILS, intensive lifestyle intervention; HOMA, homeostasis model assessment; HDL, high density lipoprotein
Florez H et al. AHA Epi 2012
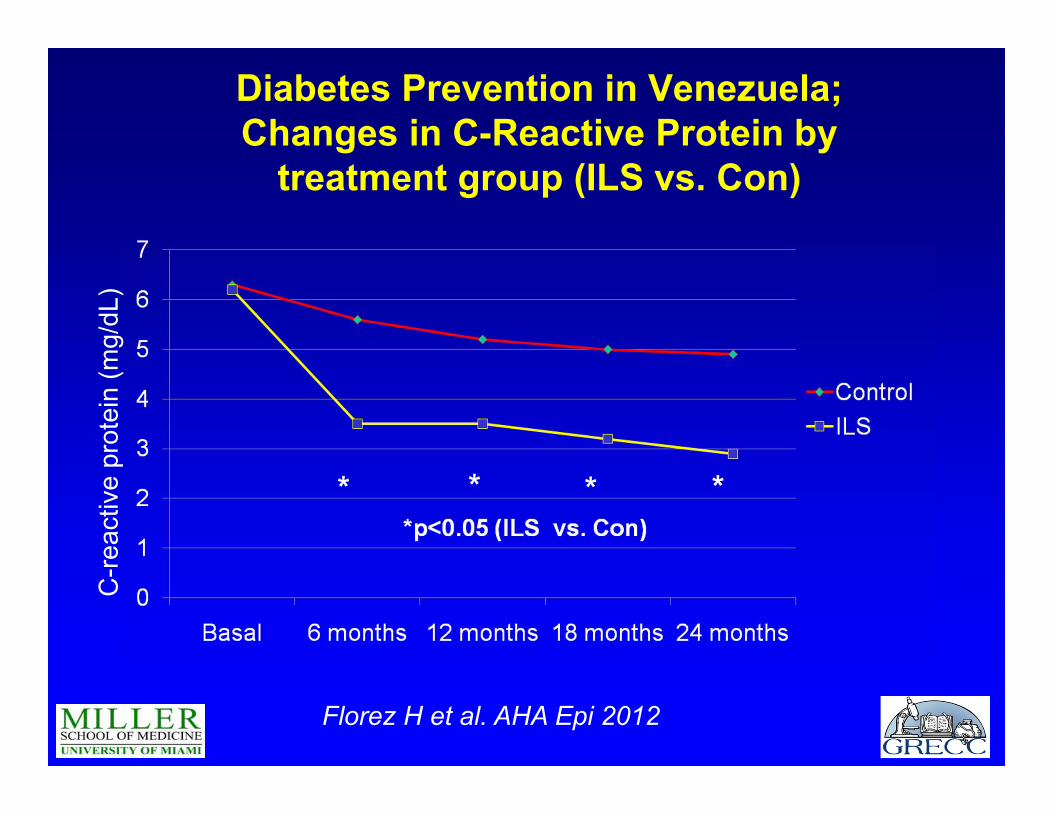
Diabetes Prevention in Venezuela;Changes in C-Reactive Protein by
treatment group (ILS vs. Con)
C-r
eact
ive
prot
ein
(mg/
dL)
* * **
Florez H et al. AHA Epi 2012
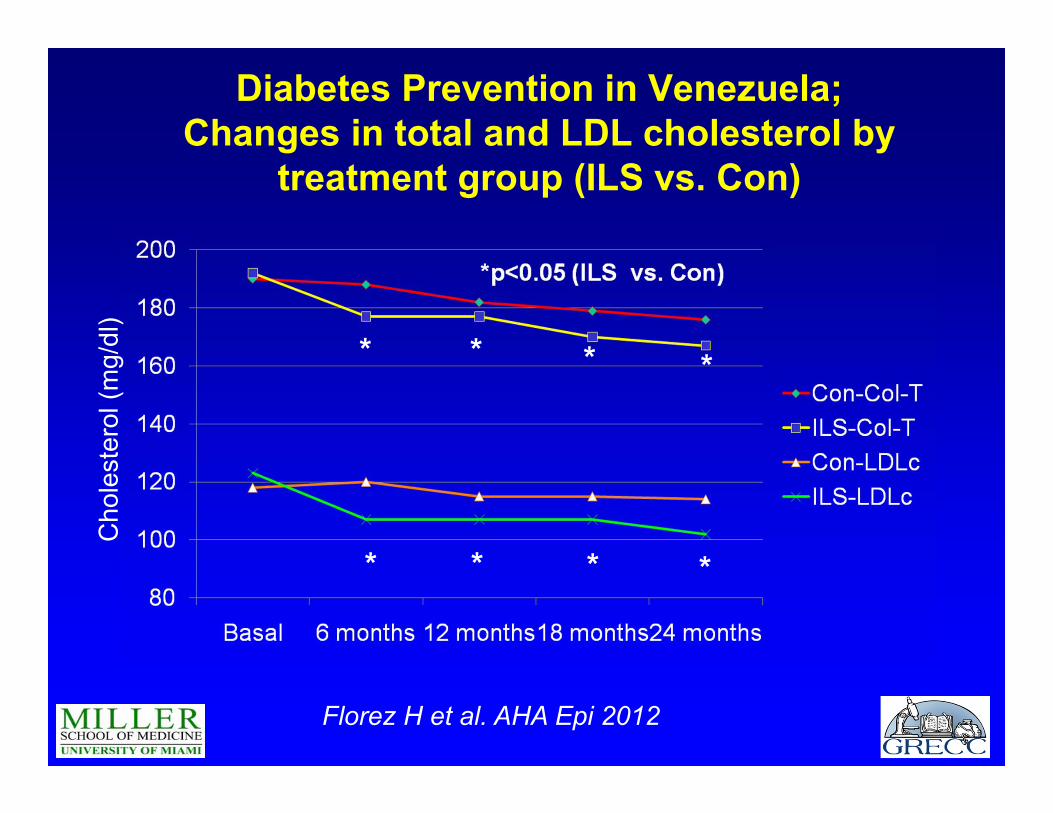
Diabetes Prevention in Venezuela;Changes in total and LDL cholesterol by
treatment group (ILS vs. Con)
Cho
lest
erol
(mg/
dl)
* * *
* *
*
* *
Florez H et al. AHA Epi 2012
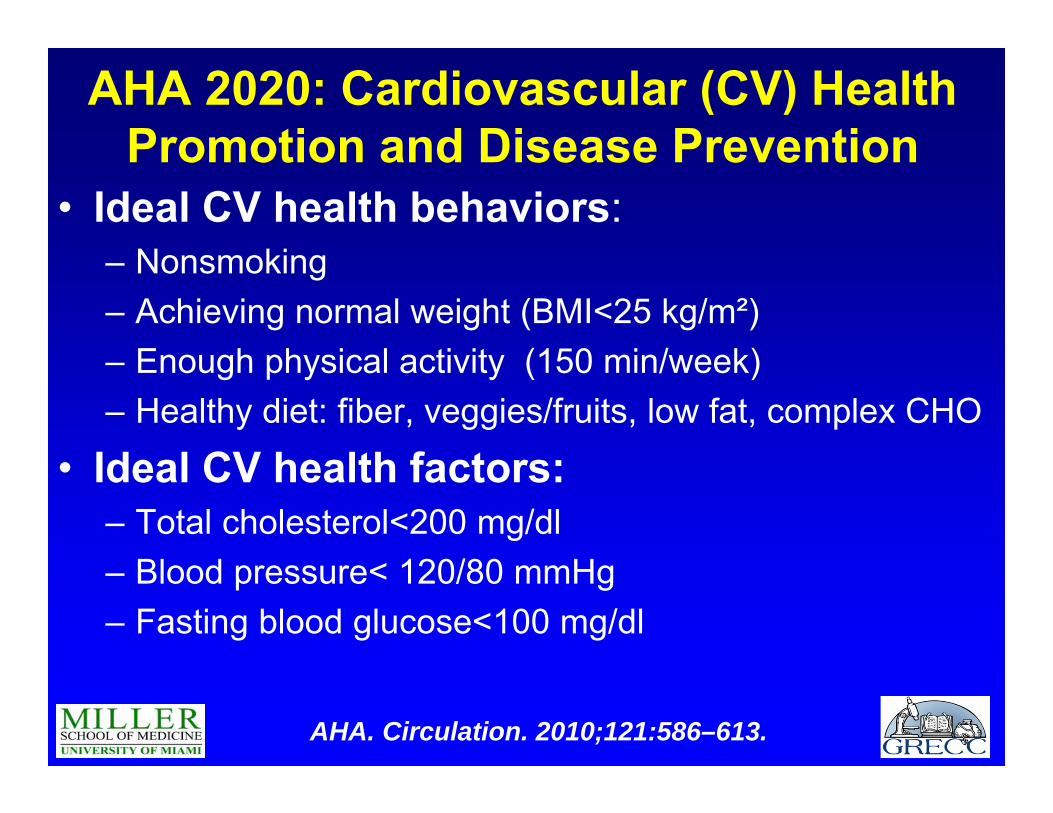
AHA 2020: Cardiovascular (CV) Health Promotion and Disease Prevention
• Ideal CV health behaviors: – Nonsmoking– Achieving normal weight (BMI<25 kg/m²)– Enough physical activity (150 min/week)– Healthy diet: fiber, veggies/fruits, low fat, complex CHO
• Ideal CV health factors: – Total cholesterol<200 mg/dl – Blood pressure< 120/80 mmHg – Fasting blood glucose<100 mg/dl
AHA. Circulation. 2010;121:586–613.
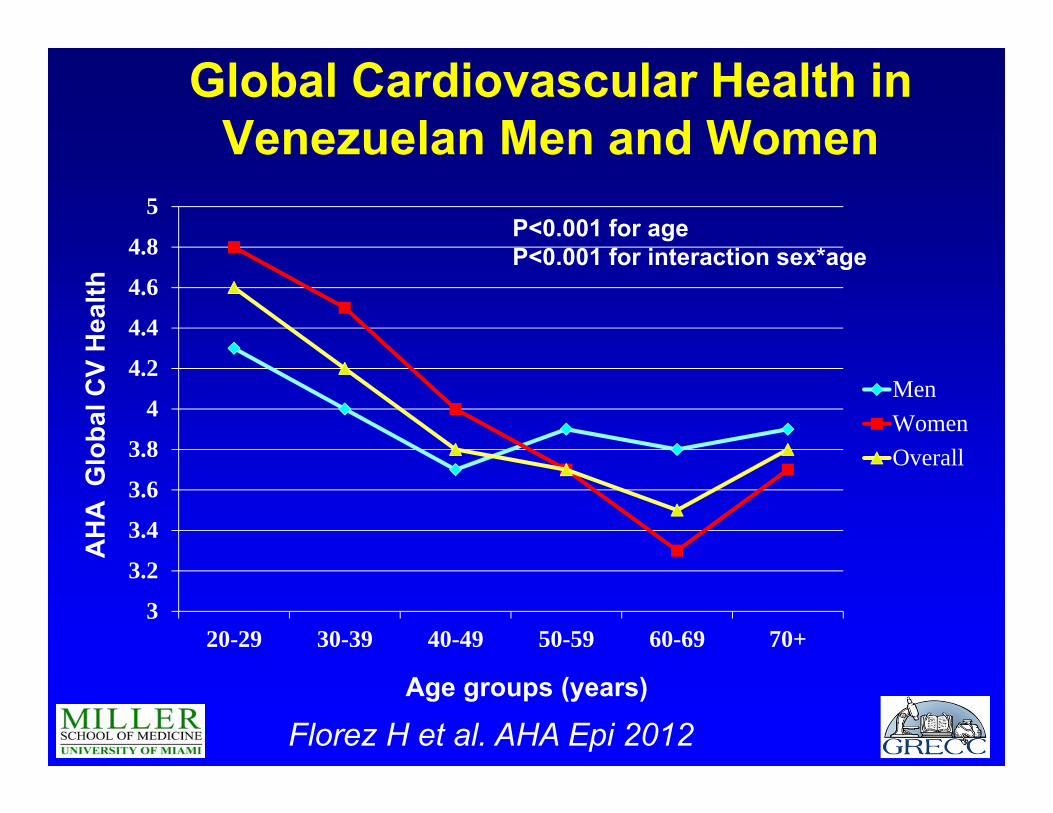
Global Cardiovascular Health in Venezuelan Men and Women
3
3.2
3.4
3.6
3.8
4
4.2
4.4
4.6
4.8
5
20-29 30-39 40-49 50-59 60-69 70+
MenWomenOverall
Age groups (years)
AH
A G
loba
l CV
Hea
lth
P<0.001 for ageP<0.001 for interaction sex*age
Florez H et al. AHA Epi 2012
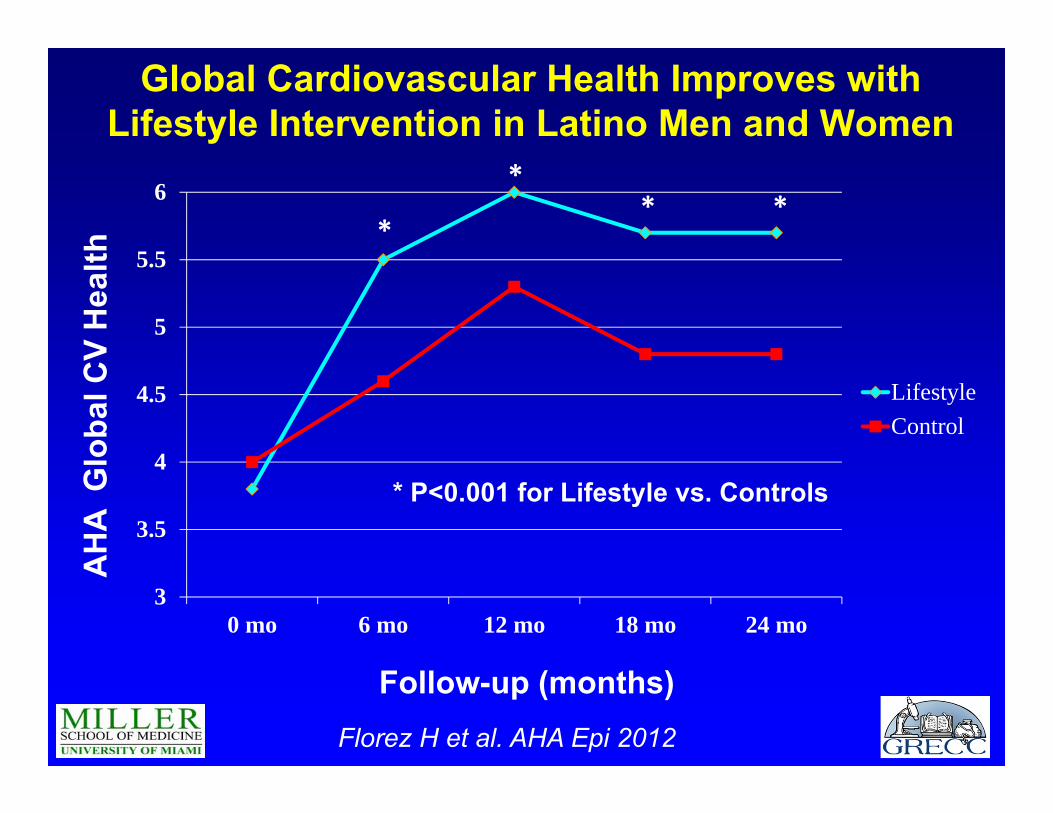
Global Cardiovascular Health Improves with Lifestyle Intervention in Latino Men and Women
3
3.5
4
4.5
5
5.5
6
0 mo 6 mo 12 mo 18 mo 24 mo
LifestyleControl
Follow-up (months)
AH
A G
loba
l CV
Hea
lth
* P<0.001 for Lifestyle vs. Controls
** *
*
Florez H et al. AHA Epi 2012
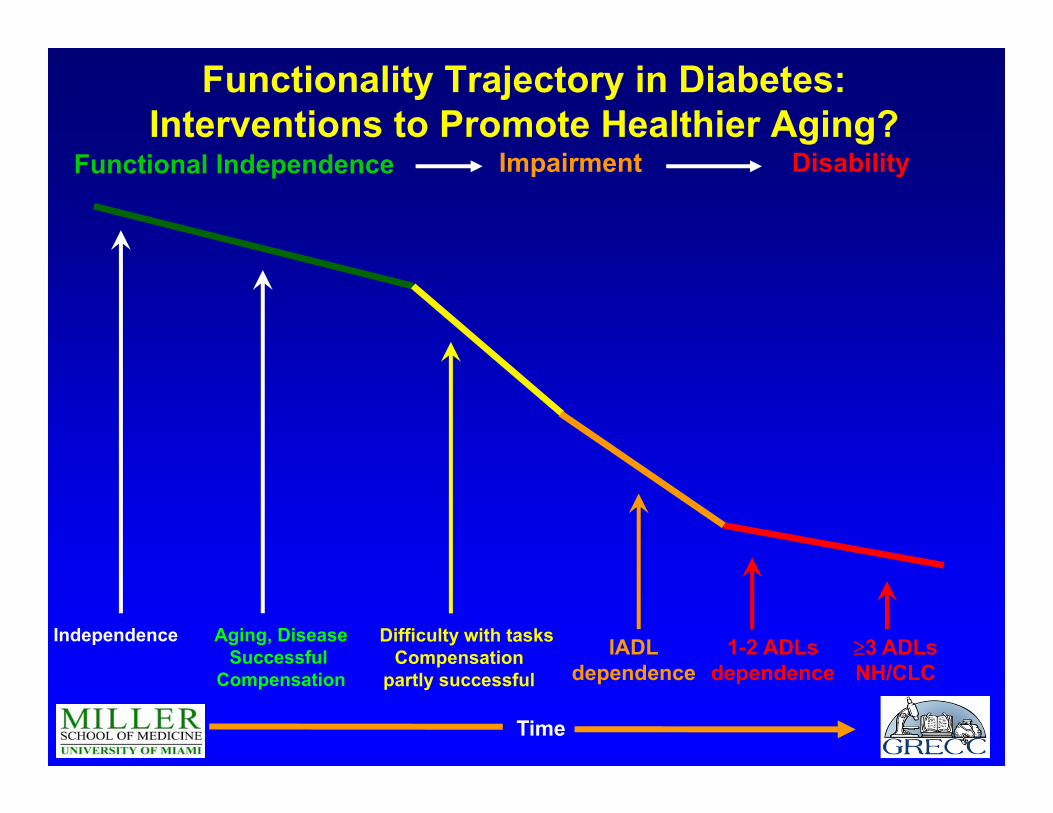
Functionality Trajectory in Diabetes: Interventions to Promote Healthier Aging?
Time
1-2 ADLsdependence
3 ADLsNH/CLC
Independence Aging, DiseaseSuccessful
Compensation
Difficulty with tasksCompensation
partly successfulIADL
dependence
Functional Independence Impairment Disability
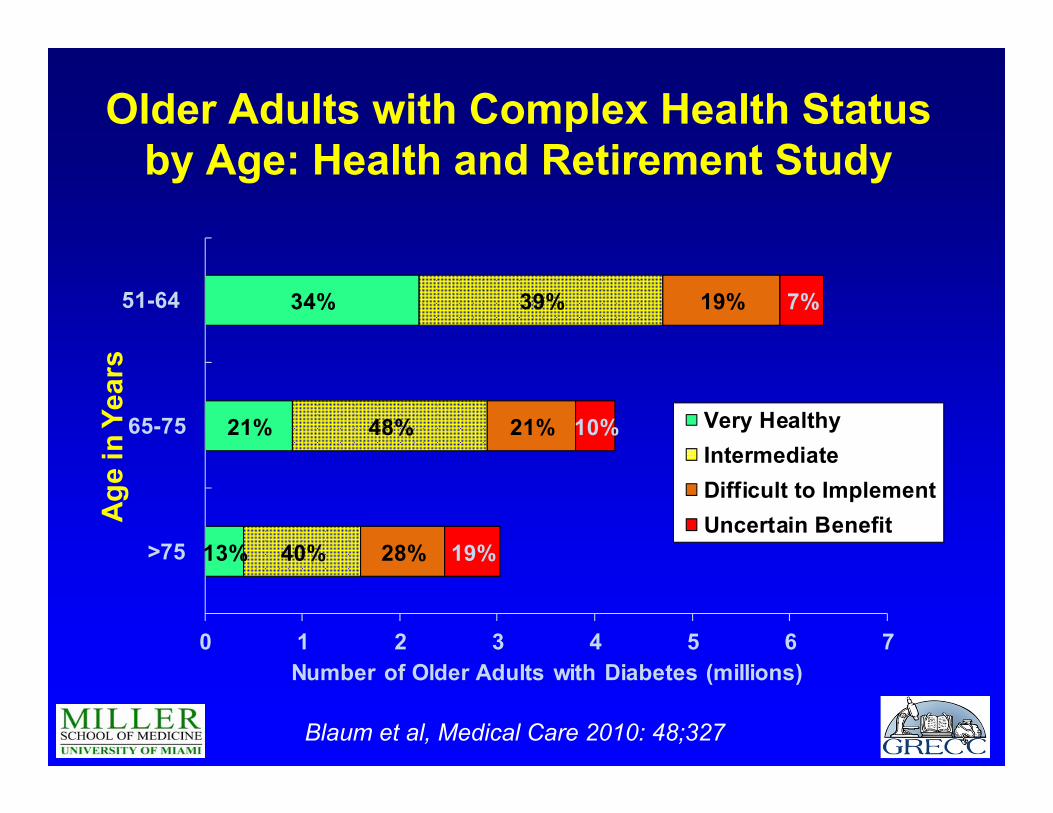
Older Adults with Complex Health Status by Age: Health and Retirement Study
13%
21%
34%
40%
48%
39%
28%
21%
19%
19%
10%
7%
0 1 2 3 4 5 6 7
>75
65-75
51-64
Number of Older Adults with Diabetes (millions)
Age
in Y
ears
Very HealthyIntermediateDifficult to ImplementUncertain Benefit
Blaum et al, Medical Care 2010: 48;327
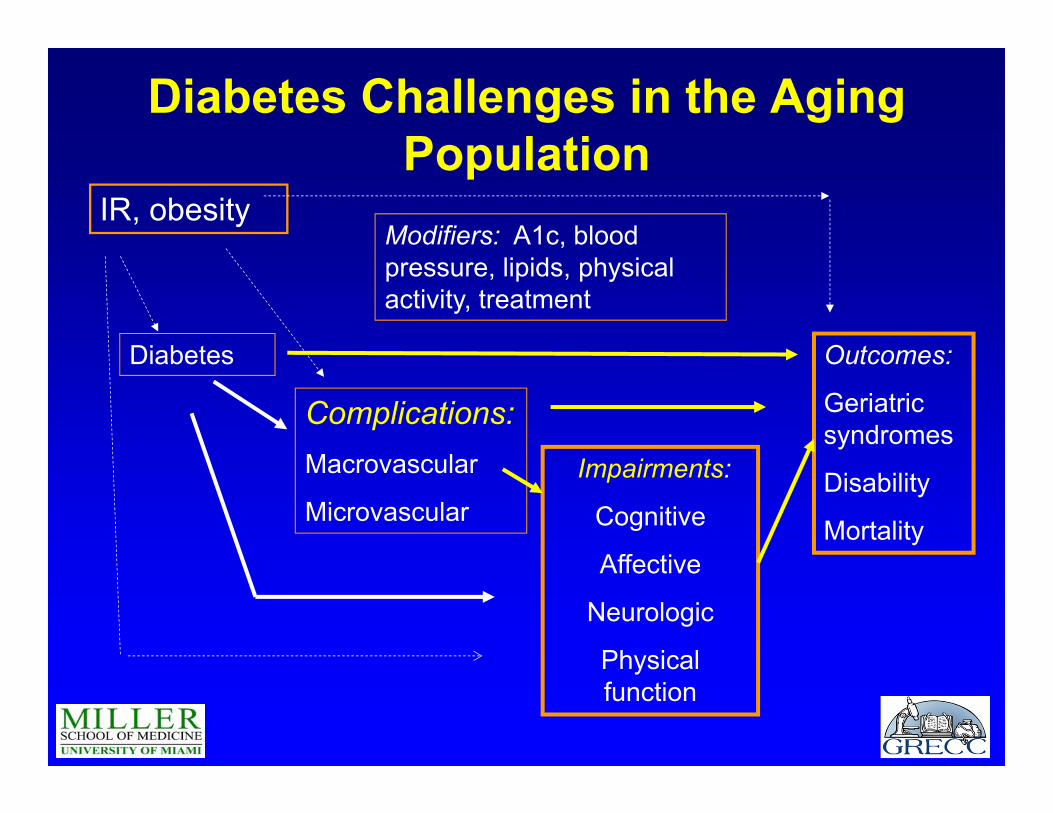
Diabetes Challenges in the Aging Population
Diabetes
Complications:Macrovascular
MicrovascularImpairments:
Cognitive
Affective
Neurologic
Physical function
Outcomes:
Geriatric syndromes
Disability
Mortality
Modifiers: A1c, blood pressure, lipids, physical activity, treatment
IR, obesity
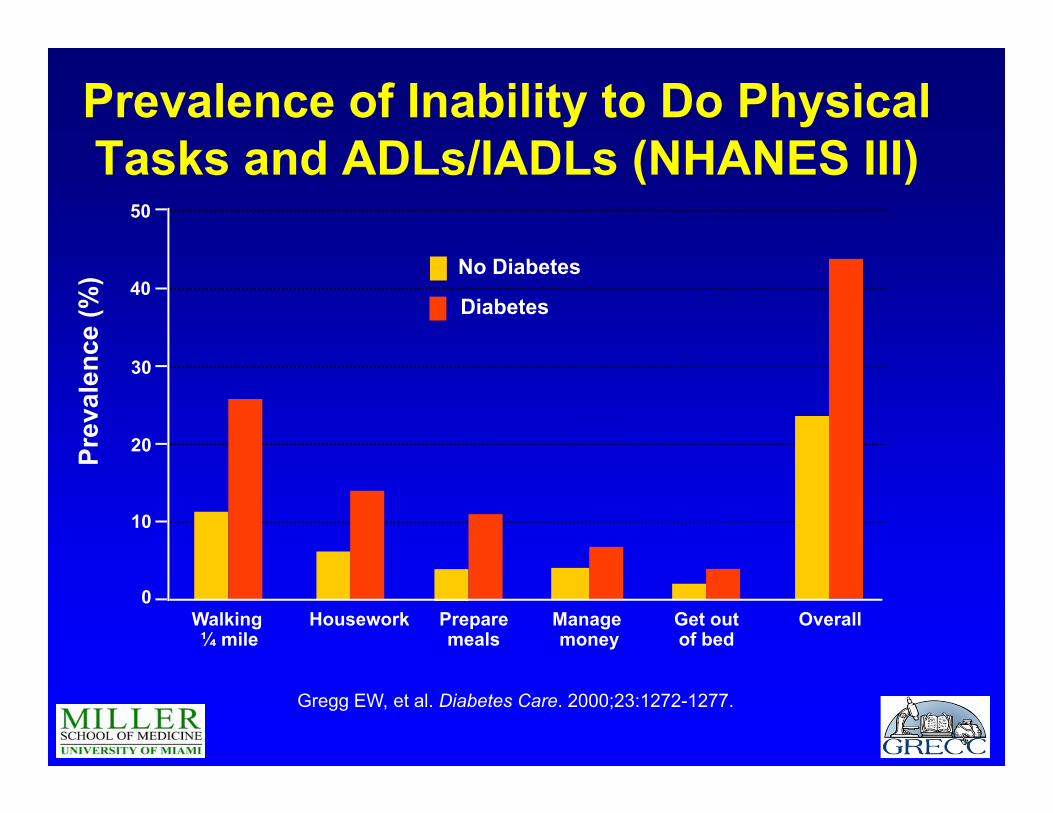
Prevalence of Inability to Do PhysicalTasks and ADLs/IADLs (NHANES III)
Walking ¼ mile
Housework Preparemeals
Manage money
Get outof bed
Overall
Gregg EW, et al. Diabetes Care. 2000;23:1272-1277.
Diabetes
No Diabetes
Prev
alen
ce (%
)
0
10
20
30
40
50
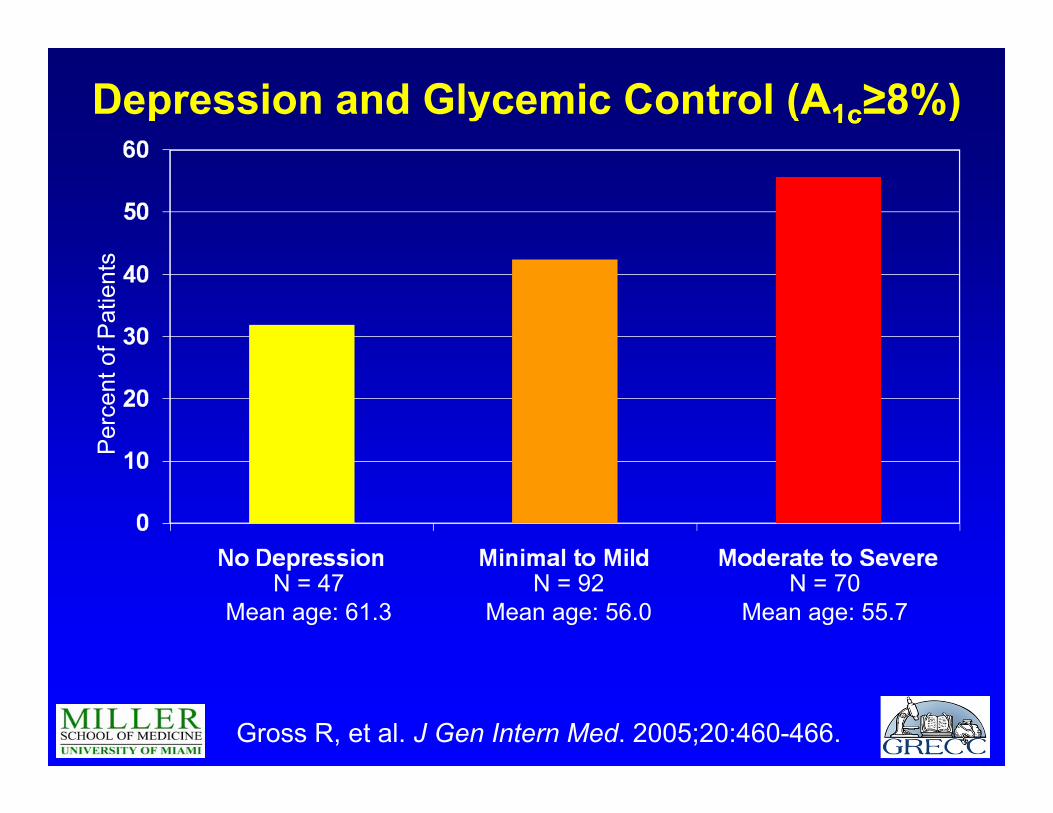
Depression and Glycemic Control (A1c≥8%)P
erce
nt o
f Pat
ient
s
N = 47Mean age: 61.3
N = 92Mean age: 56.0
N = 70Mean age: 55.7
Gross R, et al. J Gen Intern Med. 2005;20:460-466.
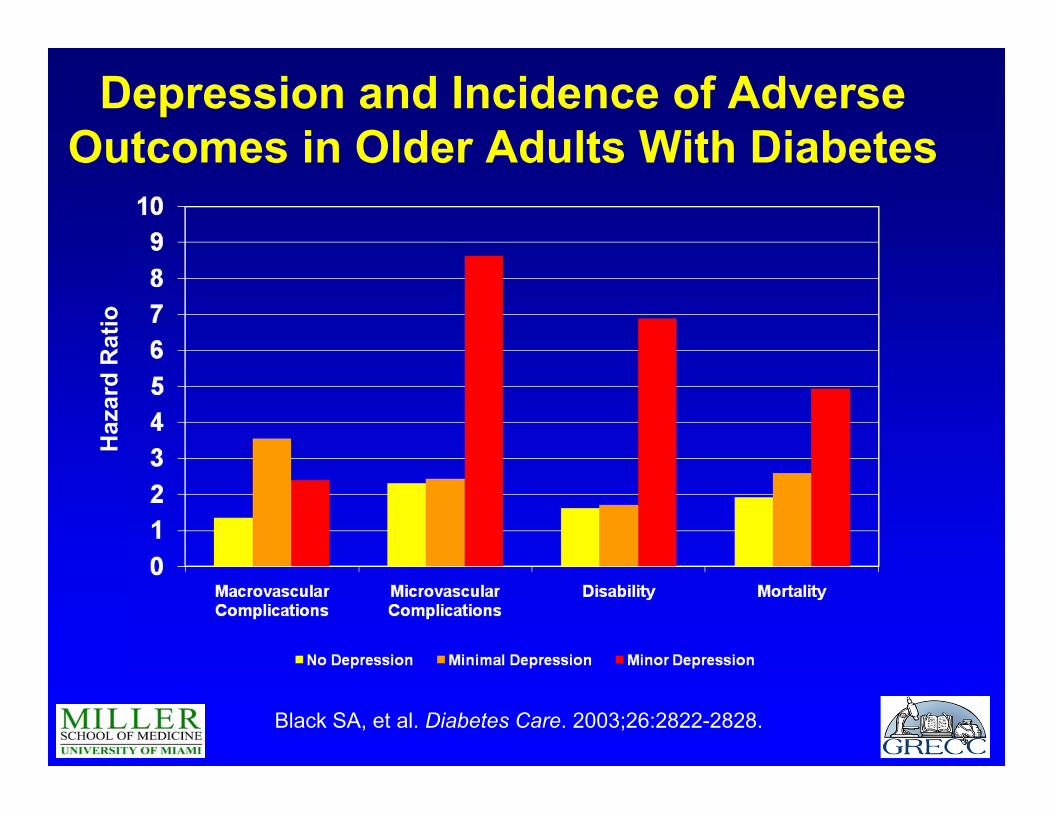
Depression and Incidence of Adverse Outcomes in Older Adults With Diabetes
Haz
ard
Rat
io
Black SA, et al. Diabetes Care. 2003;26:2822-2828.
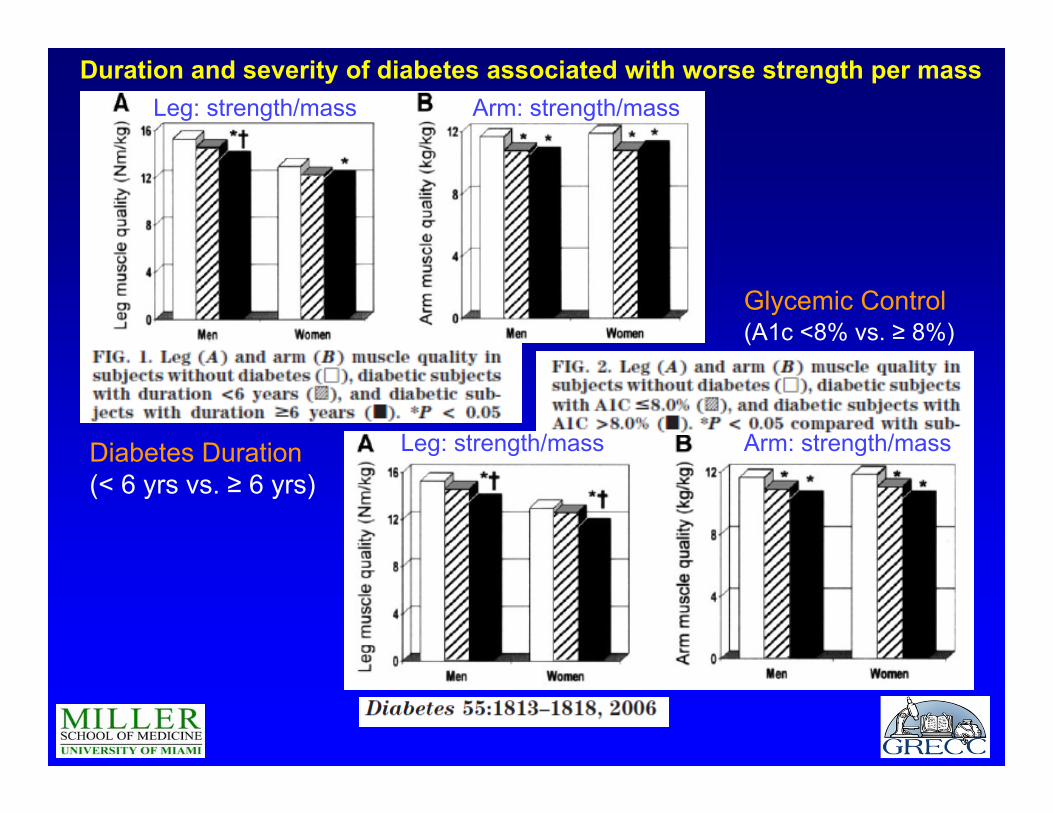
Duration and severity of diabetes associated with worse strength per massLeg: strength/mass Arm: strength/mass
Diabetes Duration (< 6 yrs vs. ≥ 6 yrs)
Leg: strength/mass Arm: strength/mass
Glycemic Control(A1c <8% vs. ≥ 8%)
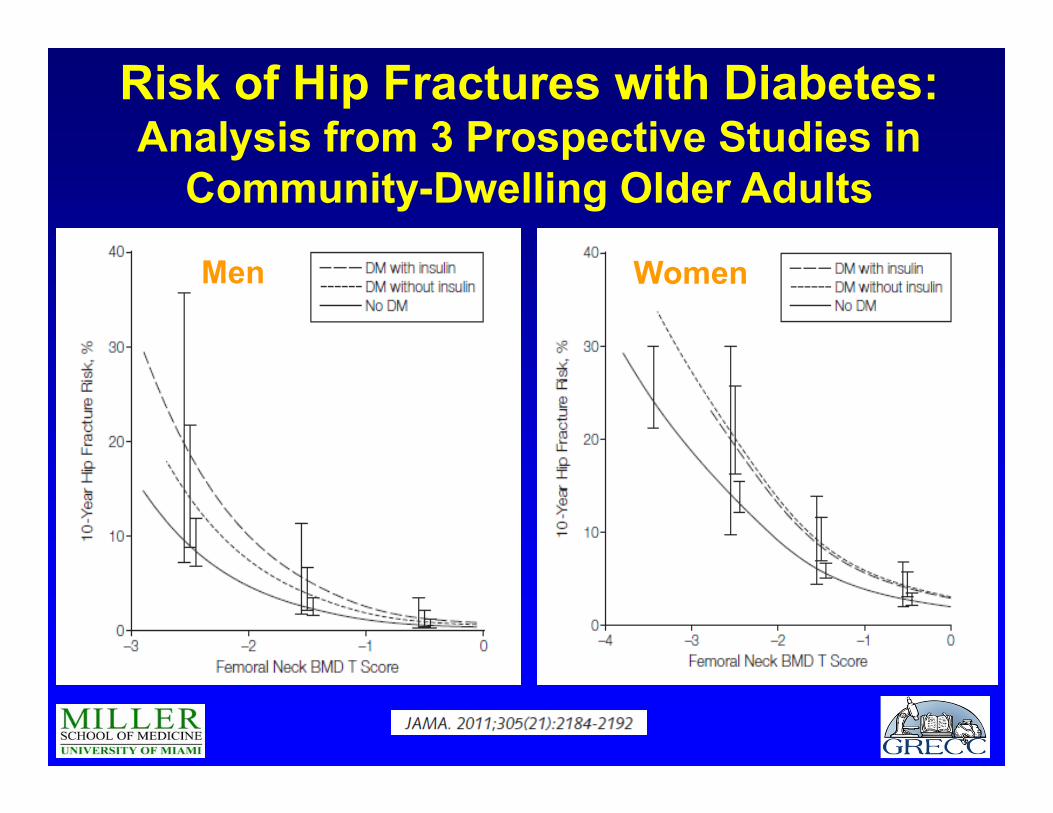
Risk of Hip Fractures with Diabetes: Analysis from 3 Prospective Studies in
Community-Dwelling Older Adults
Men Women
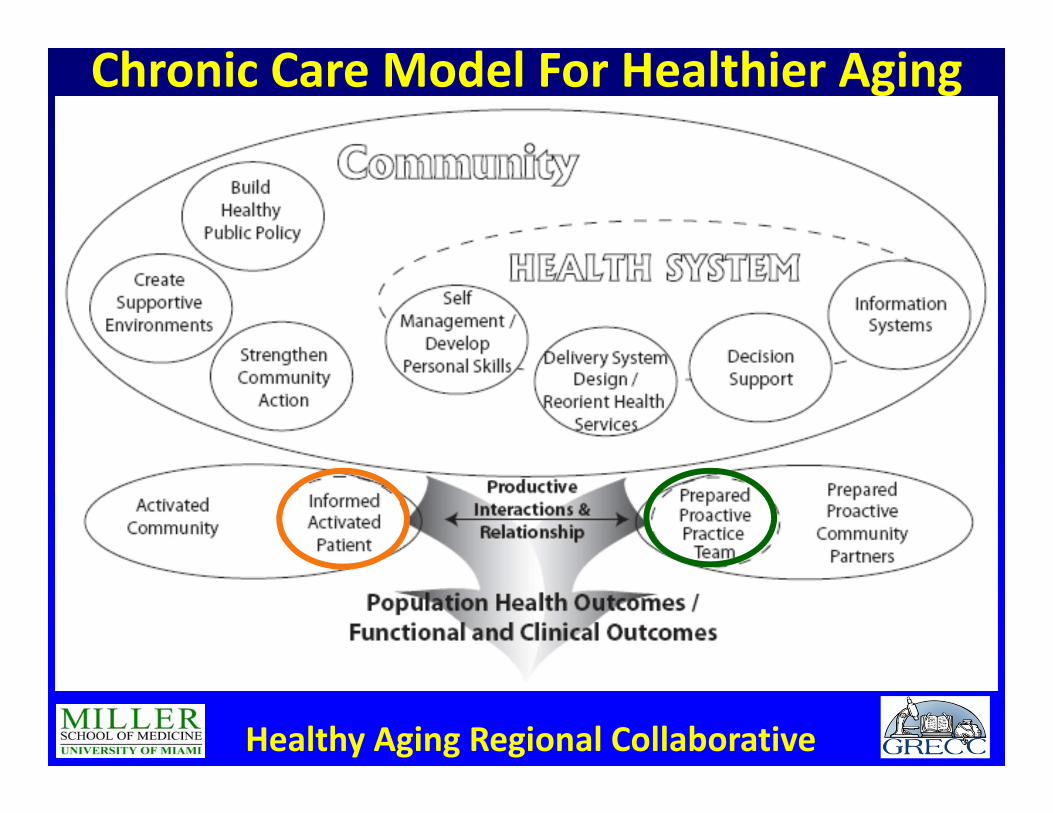
Chronic Care Model For Healthier Aging
Healthy Aging Regional Collaborative
Healthy Aging Regional Collaborative (HARC)It helps South Florida older adults to apply evidence-based prevention and management programs.Enhance Fitness (EF)An evidence-based exercise program that helps older adults to become more active, energized, and empowered to sustain independent lives.
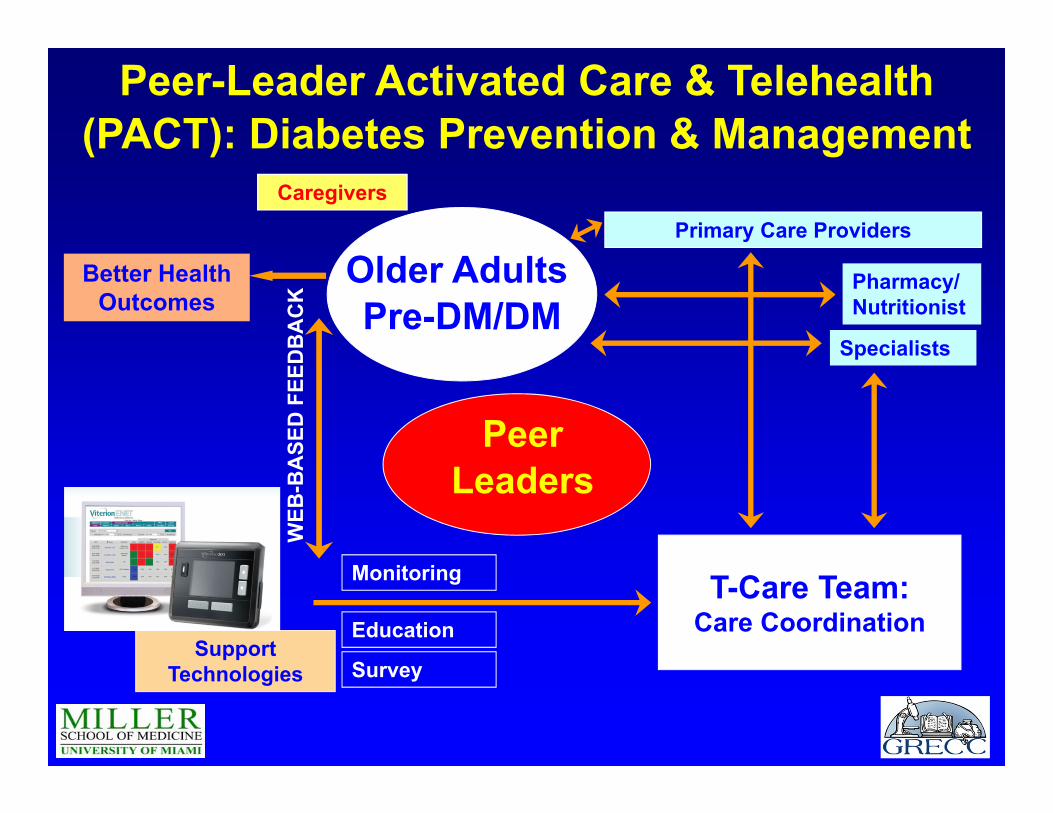
Peer-Leader Activated Care & Telehealth(PACT): Diabetes Prevention & Management
Older Adults Pre-DM/DM
Caregivers
WEB
-BA
SED
FEE
DB
AC
KBetter Health
Outcomes
T-Care Team:Care Coordination
Primary Care Providers
Pharmacy/Nutritionist
Specialists
Monitoring
Education
SurveySupport
Technologies
Peer Leaders
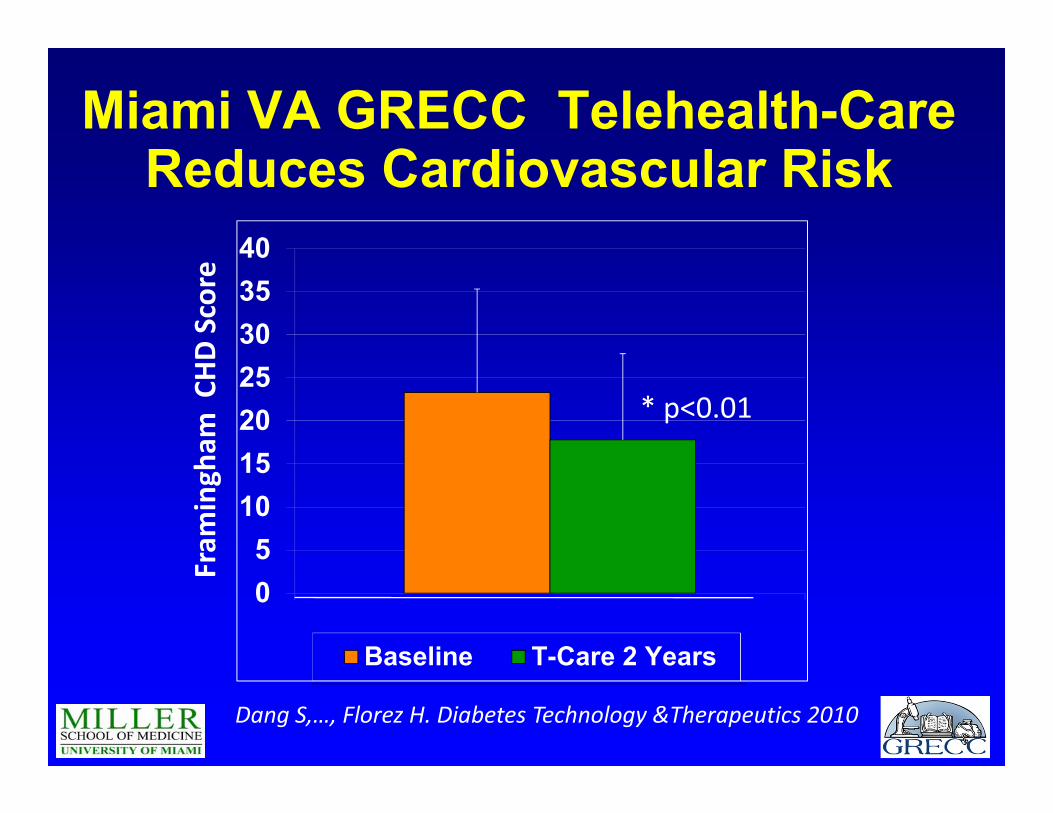
05
10152025303540
Baseline T-Care 2 Years
Miami VA GRECC Telehealth-Care Reduces Cardiovascular Risk
Fram
ingham
CHD Score
* p<0.01
Dang S,…, Florez H. Diabetes Technology &Therapeutics 2010
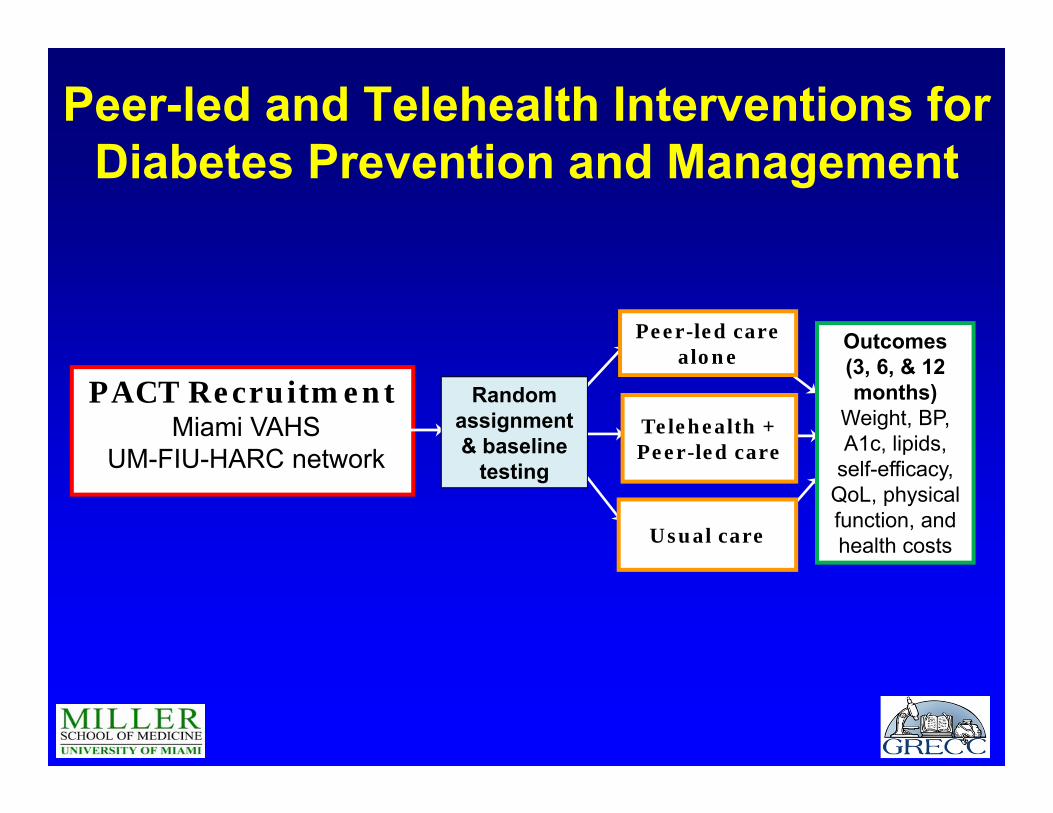
Peer-led care alone
Outcomes(3, 6, & 12 months)
Weight, BP, A1c, lipids,
self-efficacy, QoL, physical function, and health costsUsual care
Telehealth + Peer-led care
PACT RecruitmentMiami VAHS
UM-FIU-HARC network
Random assignment& baseline
testing
Peer-led and Telehealth Interventions for Diabetes Prevention and Management
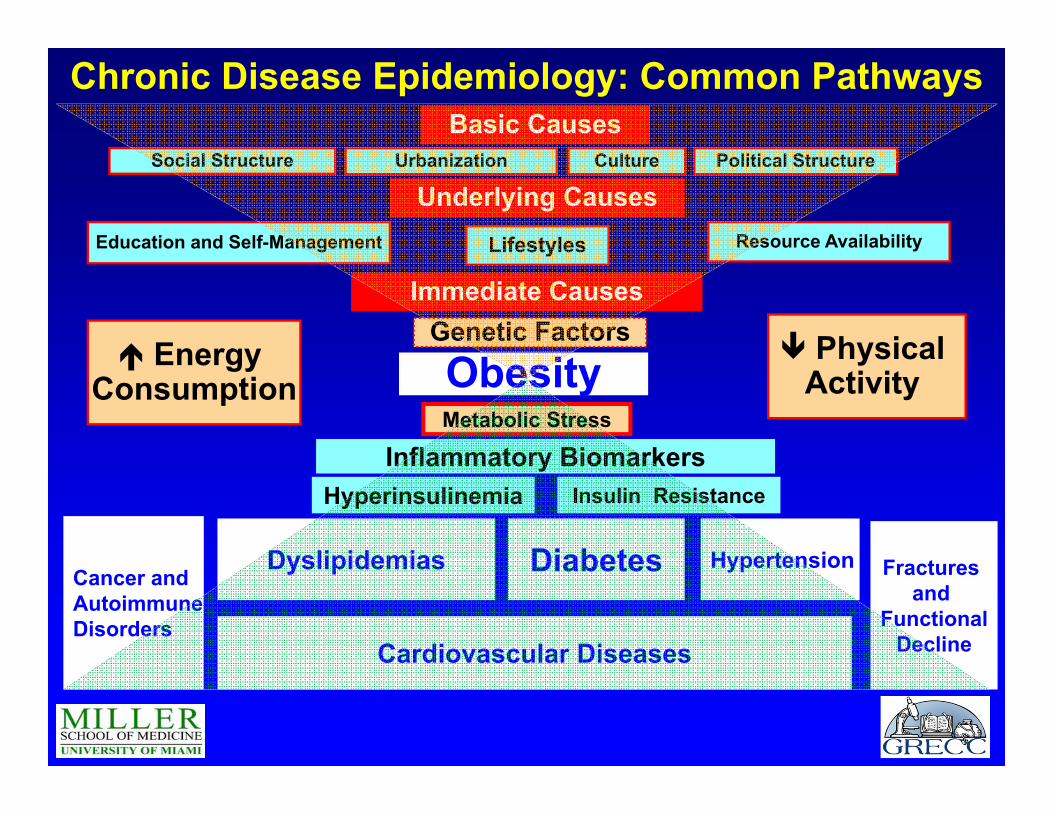
Immediate Causes
Underlying Causes
Basic Causes
Physical Activity
Energy Consumption
Education and Self-Management Lifestyles Resource Availability
ObesityGenetic Factors
Urbanization CultureSocial Structure Political Structure
Hyperinsulinemia Insulin ResistanceInflammatory Biomarkers
Metabolic Stress
Cardiovascular Diseases
Dyslipidemias Diabetes HypertensionCancer and AutoimmuneDisorders
Fractures and
FunctionalDecline
Chronic Disease Epidemiology: Common Pathways
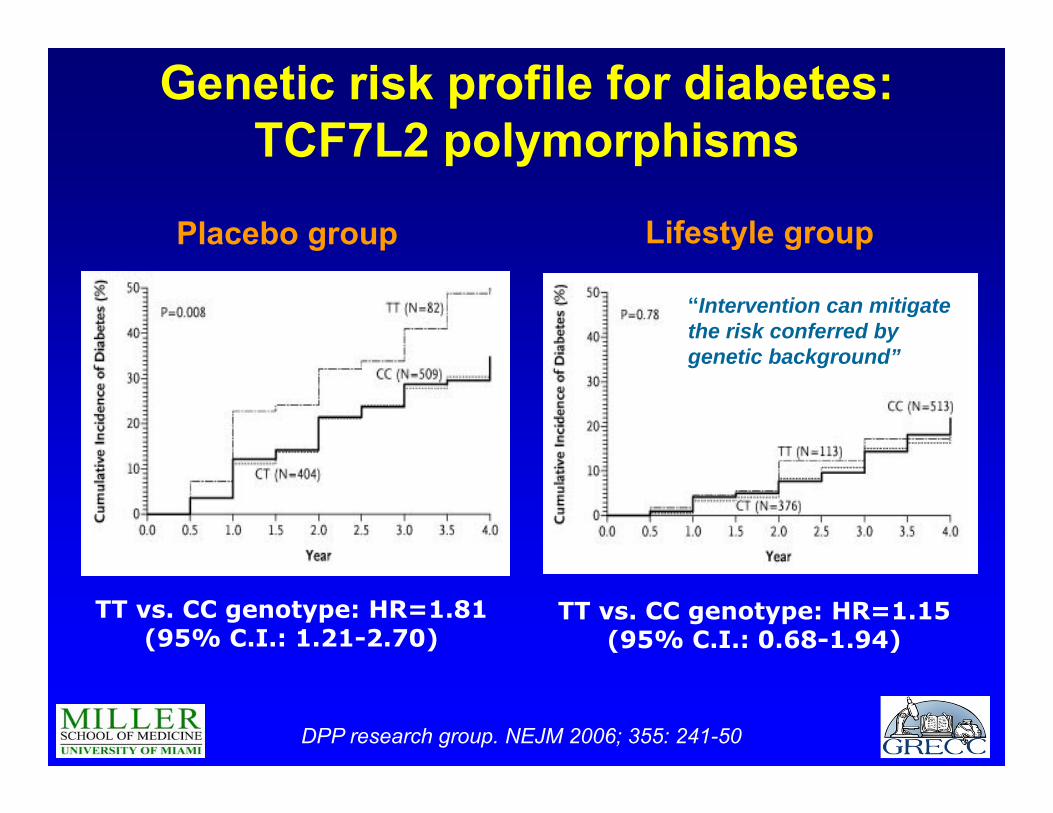
DPP research group. NEJM 2006; 355: 241-50
Genetic risk profile for diabetes: TCF7L2 polymorphisms
Placebo group Lifestyle group
TT vs. CC genotype: HR=1.81 (95% C.I.: 1.21-2.70)
TT vs. CC genotype: HR=1.15 (95% C.I.: 0.68-1.94)
“Intervention can mitigate the risk conferred by genetic background”
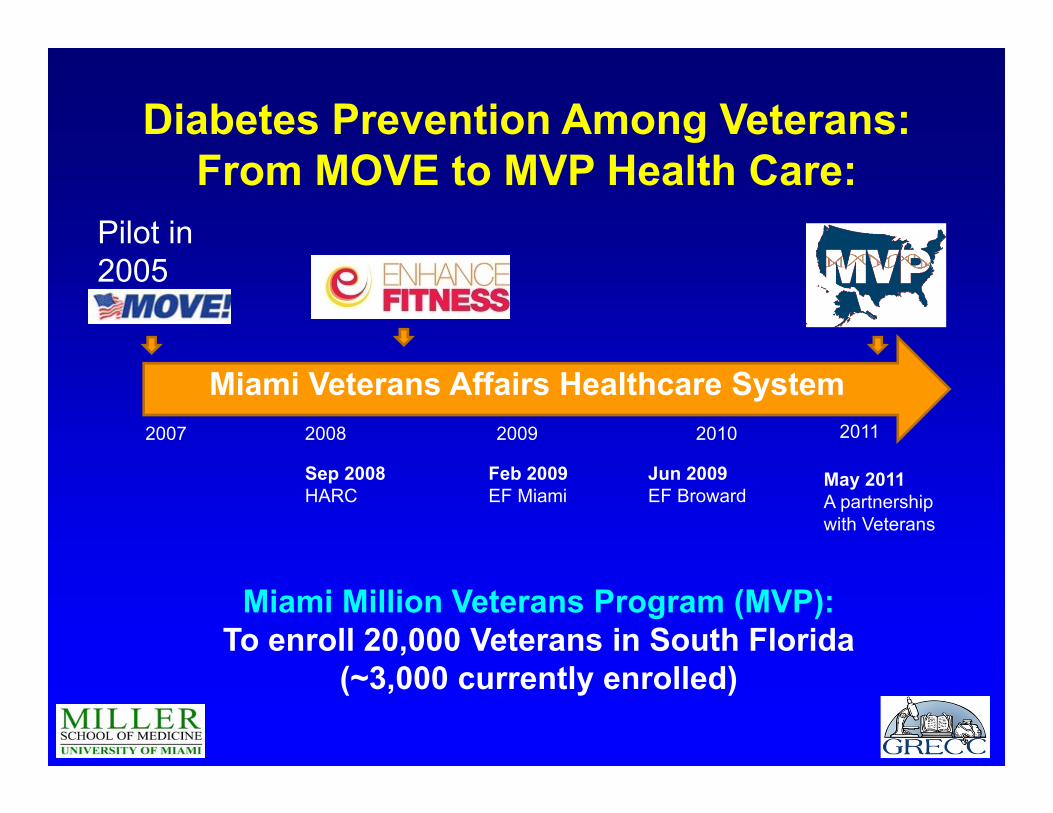
Miami Veterans Affairs Healthcare System
Sep 2008HARC
Feb 2009EF Miami
Jun 2009EF Broward
Miami Million Veterans Program (MVP): To enroll 20,000 Veterans in South Florida
(~3,000 currently enrolled)
2007 2008 2009 2010
Pilot in 2005
Diabetes Prevention Among Veterans:From MOVE to MVP Health Care:
2011
May 2011A partnership with Veterans
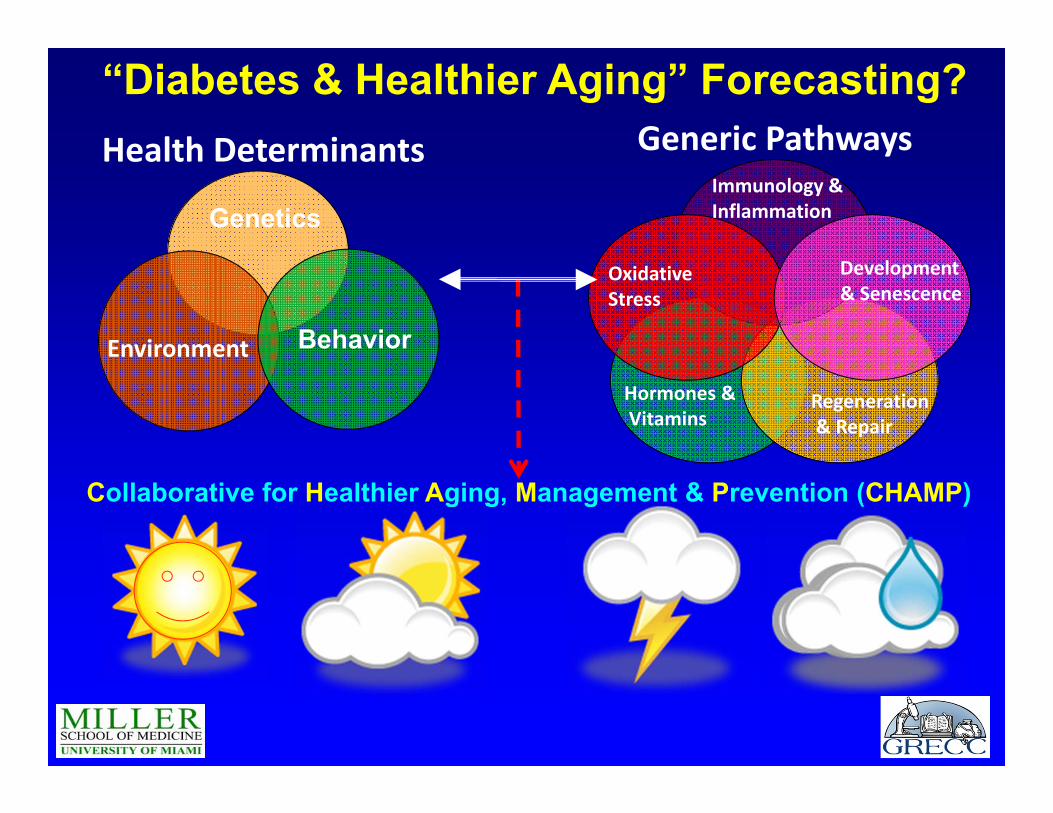
Generic PathwaysHealth Determinants
Environment
Genetics
Behavior
Oxidative Stress
Development & Senescence
Regeneration& Repair
Hormones &Vitamins
Immunology & Inflammation
Collaborative for Healthier Aging, Management & Prevention (CHAMP)
“Diabetes & Healthier Aging” Forecasting?
Conclusions and Perspectives• Diabetes mellitus (DM) has reached epidemic (pandemic)
proportions in both developed and developing countries.
• Cardiovascular and hypoglycemic-related ER visits/ hospital admissions are major burden in older adults with DM.
• Lifestyle intervention is the most effective strategy to reduce diabetes risk with feasible and innovative approaches underway in Latin America and the US healthcare system.
• Efforts to promote healthier aging in older adults with DM require better prevention and management strategies with collaborative participation of medical and public health teams.
Team Support
• University of Miami(DRI, EDM, Geriatrics, and DEPH)
• VA-GRECC, diabetes team, HPDP, HARC/FIU
• University of Zulia (Clinical Research Institute, INZU-DIABETES)
Project Support
• UM/CTSA
•NIH/NIDDK(DPP/DPPOS, GRADE)
•HHS/NIH (R18-PACT)
•VA-CSP (VADT, MVP)
•PAHO andFONACIT
•IDF-BRIDGES