Embed Size (px)
Citation preview
DHS WORKING PAPERS
2009 No. 66
Monica T. Kothari
Shea O. Rutstein
Jasbir K. Sangha
Where the Standard Makes the Difference in the Real World of Malnutrition: Analysis of
10 Countries with DHS Data
September 2009
This document was produced for review by the United States Agency for International Development.
DEMOGRAPHICAND
HEALTHRESEARCH
The DHS Working Papers series is an unreviewed and unedited prepublication series of papers reporting on research in progress based on Demographic and Health Surveys (DHS) data. This research was carried out with support provided by the United States Agency for International Development (USAID) through the MEASURE DHS project (#GPO-C-00-03-00002-00). The views expressed are those of the authors and do not necessarily reflect the views of USAID, the United States Government, or the organizations to which the authors belong.
MEASURE DHS assists countries worldwide in the collection and use of data to monitor and evaluate population, health, and nutrition programs. Additional information about the MEASURE DHS project can be obtained by contacting ICF Macro, Demographic and Health Research Division, 11785 Beltsville Drive, Suite 300, Calverton, MD 20705 (telephone: 301-572-0200; fax: 301-572-0999; e-mail: [email protected]; internet: www.measuredhs.com).
Where the Standard Makes the Difference in the Real World of Malnutrition:
Analysis of 10 Countries with DHS Data
Monica T. Kothari1
Shea O. Rutstein2
Jasbir K. Sangha2
September 2009
Corresponding authors: Monica T. Kothari, PATH/DHS and Shea O. Rutstein ICF Macro/DHS,Demographic and Health Research Division, ICF Macro, 11785 Beltsville Drive, Calverton, Maryland 20705, USA; Phone 301-572-0540; Fax 301-572-0999; Email: [email protected]; [email protected].
1 PATH/DHS 2 ICF Macro/DHS
ACKNOWLEDGEMENTS
The authors thank Fred Arnold and Avril Armstrong for reviewing the study and for their
valuable comments. Also, thanks to Yuan Gu for formatting and Bryant Robey for editing the
paper. Special thanks to Vinod Mishra for guidance at various stages during the course of the
study and also for facilitating the publication of the working paper.
Suggested citation:
Kothari, Monica T., Shea O. Rutstein, and Jasbir K. Sangha. 2009. Where the Standard Makes the Difference in the Real World of Malnutrition: Analysis of 10 Countries with DHS Data. DHS Working Papers No. 66. Calverton, Maryland, USA: ICF Macro.
ABSTRACT
The 1977 International Growth Reference, formulated by the National Center for Health
Statistics (NCHS) and endorsed by World Health Organization (WHO), has long been used to
assess the nutritional status of children. In 2006, however, WHO introduced new Child Growth
Standards to replace the 1977 NCHS Reference. The study reported here presents findings from
10 DHS surveys, representing countries in South Asia, Central Asia, sub-Saharan Africa, and
South America to compare the prevalence of stunting, wasting, underweight, and overweight in
children under age 5 years by these two international standards.
Using the 2006 WHO Standards increases the prevalence of stunting, wasting, and
overweight among children, while the prevalence of underweight children is lower compared
with using the 1977 NCHS Reference. After controlling for various background characteristics
of children, the study finds that place of residence (rural versus urban) and birth order are the
only two characteristics that seem not to be important predictors of differences in stunting and
wasting, respectively, between the 1977 NCHS Reference and the 2006 WHO Standards. Most
findings of our study agree with findings from other studies reported in the literature.
These findings have implications for evaluating children’s nutritional status and for
analyzing trends. Our major conclusion is that malnutrition tabulations should be made using
both the 1977 NCHS Reference and the 2006 WHO Standards during the transition between the
former reference and the new standards.

1
INTRODUCTION
Using data from 10 recent Demographic and Health Surveys (DHS), this study compares the
nutritional status of children according to two different international anthropometric
measurement standards—the 1977 International Growth Reference, developed by the National
Center for Health Statistics (NCHS) and endorsed by the World Health Organization (WHO)1,
and the more recent WHO Child Growth Standards, introduced in 20062.
Anthropometric measurements (height and weight) are the core DHS components to
assess the nutritional status of children under age 5. Anthropometric indices (height-for-age,
weight-for height, and weight-for-age also are used for nutrition surveillance, clinical studies,
program evaluation, and trend analysis. Anthropometric indices typically are compared against
local and/or international references or standards.
For many years, the 1977 NCHS Reference has been the most widely used standard and
has been used in DHS surveys to assess prevalence of childhood malnutrition. Recently,
however, the DHS program has started using the 2006 WHO Standards and has produced some
of the first nationally representative statistics on children’s nutritional status using this new
international standard. Unlike the 1977 NCHS Reference, the 2006 WHO Standards describe
how children “should grow” by using standards based on breastfeeding children who grow under
optimal conditions in their early years of life. Thus the introduction of the new standards
represents a shift from a “descriptive” approach to a “prescriptive” point of view in assessing
childhood nutritional status.
By the 2006 WHO Standards, a number of surveyed countries have been surprised to find
worse childhood malnutrition rates than previously believed, especially the prevalence of
1 Hereafter referred to in this paper as the “1977 NCHS Reference” 2 Hereafter referred to in this paper as the “2006 WHO Standards”
2
stunting. As yet, however, DHS data have not been analyzed to explore the differences in the
prevalence of malnutrition across countries when comparing the 1977 NCHS Reference with the
2006 WHO Standards. In addition, the role of background variables in the differences observed
in malnutrition when nutritional status is assessed by the 1977 NCHS Reference versus the 2006
WHO Standards has not yet been investigated.
The study reported here is the first to make these comparisons with regard to DHS survey
data and to explore how the two international standards differ in their impact on prevalence of
childhood malnutrition in the surveyed countries. In addition, the study tests a proposed
algorithm by Hong and de Onis (2008) to estimate equivalent values of malnutrition from the
1977 NCHS Reference for the 2006 WHO Standards for the purpose of assessing trends. Our
study joins other studies that have compared the effect of using these two standards on the
estimation of malnutrition in overall populations (see Review of Literature). Such studies by
level of malnutrition and by background characteristics are sparse, and thus our study makes an
important contribution to knowledge.
A chief criticism of the use of the 1977 NCHS Reference has been that, because the
reference is based on children from a developed country who were mostly bottle-fed, this single
standard should not be applied for all children around the world. An earlier DHS study has
disproved this hypothesis, however, by showing that “elite” children (that is, children of more
advantaged socioeconomic status and thus assumed to be well-fed) from a number of surveyed
countries have the same distribution of nutritional indicators as that of the 1977 NCHS
Reference. When the 2006 WHO Standards were developed, the study sample comprised
children from different parts of the globe, using criteria that would help children to achieve their
optimal growth and to attain their genetic potential. Hence, we expect that the nutritional status
3
of the elite children from our study sample of the DHS population would be similar to that of the
children on which the 2006 WHO Standards are based. To investigate this hypothesis, our paper
compares the nutritional status of the elite children according to the 1977 NCHS Reference with
their status according to the 2006 WHO Standards. Our assumption is that the distribution of
nutritional status of elite children should be normally distributed by either standard.
Background
In 1977 the NCHS released the first internationally recognized reference for assessing nutritional
status of children, derived from the Fels Research Institute Longitudinal Study (1929-1975) for
children age 0-23 months. For older children (age 2-18 years) the data came from three surveys
in the US carried out between 1960 and 1975. In 1978 the US Centers for Disease Control
(CDC) normalized the 1977 NCHS percentiles and adopted them to assess the health status of
children for their study purposes. Subsequently, WHO also adopted the NCHS Reference. For a
long time, these NCHS normalized curves were the only internationally recognized reference for
the assessment of nutritional status of children, which became known as NCHS/CDC/WHO
International Growth Reference (Ogden et al., 2002; WHO, 1995) (as mentioned, in this paper
termed the 1977 NCHS Reference).
As mentioned above, however, the 1977 NCHS Reference has received various
criticisms, chiefly that the original NCHS reference was based on formula-fed white middle-
class infants in southwestern Ohio, US, raising questions about its validity when used for
children that are mainly breastfed and genetically, geographically, and socioeconomically
different. Further, there were notable differences between the recumbent length in the Fels data
set and standing stature in the national data set used for the older child growth charts, leading to
4
a disjuncture between the infant and older child growth curves between 24 and 36 months.
Additionally, another major concern about this old reference was related to differences in the
percentile values of the original NCHS and the normalized CDC version of the growth curves.
This criticism along with others motivated the development of a new international reference or
set of standards for childhood nutritional status (de Onis et al., 1997).
In 2000, CDC Growth Charts were released to replace the 1977 NCHS Reference. In the
new charts the lengths of the babies at birth were taken from vital registrations of the states of
Wisconsin and Missouri. The weight-for-age curve data came from US vital statistics (birth
certificates). However, because these references are based on the US data, these charts were
recommended for the use in the US only and were not adopted for international use (de Onis,
2007).
Around the same time, WHO took the lead in developing new growth standards that
would be representative of the international population and that would take into account the
shortfalls of the 1977 NCHS Reference. The new standards were developed with the philosophy
that children around the world of various ethnicities, given an optimal environment, have the
same capacity to reach their genetic potential, especially during the early years of their
development. Prior to their release, field-testing was conducted at four sites (Argentina, Italy,
Pakistan, and Maldives) to ascertain the clinical validity of the new standards, which were
subsequently approved for use in clinical settings as well as in the field because of their
reliability. In 2006 WHO unveiled the new Child Growth Standards (as mentioned, referred to in
this paper as the 2006 WHO Standards) to replace the 1977 NCHS Reference (WHO, 2006).
The 2006 WHO Standards stem from a Multiple Growth Reference Study (MGRS) that is
based on a final sample of 7,551 children from the cities of Davis, California (USA); Muscat
5
(Oman); and Oslo (Norway); and selected neighborhoods of Pelotas (Brazil), Accra (Ghana), and
South Delhi (India). These locales were chosen from various world regions that were well-off
economically and where nearby institutions were interested in and capable of doing the
investigation. Beyond including children from various ethnic groups, the MGRS ensured
selection of children who lived in socioeconomic conditions favorable for childhood growth. At
least 20 percent of the mothers of the children included in the MGRS followed health-promoting
practices, such as adherence to WHO specific feeding recommendations on breastfeeding and
complementary feeding3, and the mothers did not smoke. Children included in the MGRS were
without apparent diseases or significant morbidity, were singleton full-term births, and had no
known health or environmental constraints to growth (de Onis et al., 2006a).
The MRGS included both a longitudinal component and a cross-sectional component. In
the longitudinal component 882 compliant children were followed from birth to 24 months with
21 home visits. The cross-sectional component studied 6,669 children age 18-71 months, who
were breastfed until at least age 3 months (de Onis et al., 2006; de Onis et al., 2007). The
hallmark of the study was to identify breastfeeding as the “biological norm” and to accept a
breastfed child is the “normative model for growth and development” (de Onis et al., 2006a).
Given the rigorous methods adopted to develop the 2006 WHO Standards, they are assumed to
be more robust in assessing the nutritional status of the children, especially infants, than was the
case for the 1977 NCHS Reference.
3 Exclusive or predominant breastfeeding for at least 4 months, introduction of complementary foods by the age of 6 months, and continued partial breastfeeding up to at least 12 months.

7
REVIEW OF LITERATURE
A number of studies based on various populations have assessed differences in nutritional status
based on the 2006 WHO Standards versus the 1977 NCHS Reference. In 2006 a study found
that the prevalence of stunting is higher throughout childhood using the 2006 WHO Standards
than the 1977 NCHS Reference. The prevalence of underweight among breastfed children is
higher during early infancy and lower afterward. For wasting, the main difference occurs during
infancy, when the prevalence of wasting is higher using the 2006 WHO Standards. The
prevalence of overweight is also higher when the 2006 WHO Standards are used (de Onis et al.,
2006a). Report published by de Onis and colleagues substantiate similar differences between
nutritional status based on the 2006 WHO Standards and the 1977 NCHS Reference (de Onis et
al., 2007).
A study in Sind Province, Pakistan, to compare estimates of under-nutrition among pre-
school children also reported higher prevalence of stunting and wasting by the 2006 WHO
Standards compared with the 1977 NCHS Reference. The differences between the two standards
were noticeable for severely wasted and stunted infants (Nuruddin et al., 2008). A study in rural
Malawi comparing the nutritional status of children using the 2006 WHO Standards and the 1977
NCHS Reference reported differences in the prevalence of stunting, wasting, and underweight
similar to those reported in other studies. This study also reported that underweight prevalence
during early infancy that was 3.5 times higher using the 2006 WHO Standards than the 1977
NCHS Reference (Prost et al., 2008).
A study by Schwarz et al. (2008) of nutritional status of children in Gabon showed
considerable differences in patterns of growth faltering depending on which standard was used to
assess the prevalence of stunting and underweight. The proportion stunted and underweight was
highest when children were assessed using the 2006 WHO Standards compared with either the
8
1977 NCHS Reference or the 2000 CDC Growth Charts.
A study by Fenn and Penny (2008) in Peru, Vietnam, and the Indian state of Andhra
Pradesh of children age 6 to 18 months found higher mean weight-for-length/height and weight-
for-age using the 1977 NCHS Reference than the 2006 WHO Standards. In each of the three
countries, however, the mean length/height for-age was similar between the two international
standards. Like other studies, Fenn and Penny also reported a higher prevalence of stunting and a
lower prevalence of underweight for the 2006 WHO Standards compared with the 1977 NCHS
Reference.
The literature highlights clear differences in tracking nutritional status of children
between the two standards. When children’s nutritional status is tracked on the 2006 WHO
Standards, the children do very well for weight-for-age; however when tracked on the 1977
NCHS Reference, they register growth faltering beginning at age 2 months (de Onis, 2007).
The literature cites various advantages of using the 2006 WHO Standards. One advantage
is the extension of the WHO weight-for-length/height curves to 110 cm, making it possible for a
tall 2-year-old to be measured lying down, if they cannot stand due to malnutrition or for other
reasons. This extension was not possible with either the 1977 NCHS Reference or the 2000 CDC
Growth Charts (de Onis et al., 2007).
In summary, based on the limited number of published studies, it appears that the 2006
WHO Standards reflect the rapid growth of early infancy better than the 1977 NCHS Reference
(de Onis, 2007). However, in emergency situations such as those in a refugee camp, the 2006
WHO Standards have been found to significantly increase the number of children who would be
admitted to the feeding programs, because acute malnutrition (weight-for-height) is higher when
compared with the 1977 NCHS Reference (Seal and Kerac, 2007, Prinja et al., 2009).
9
DATA AND METHODS
Data
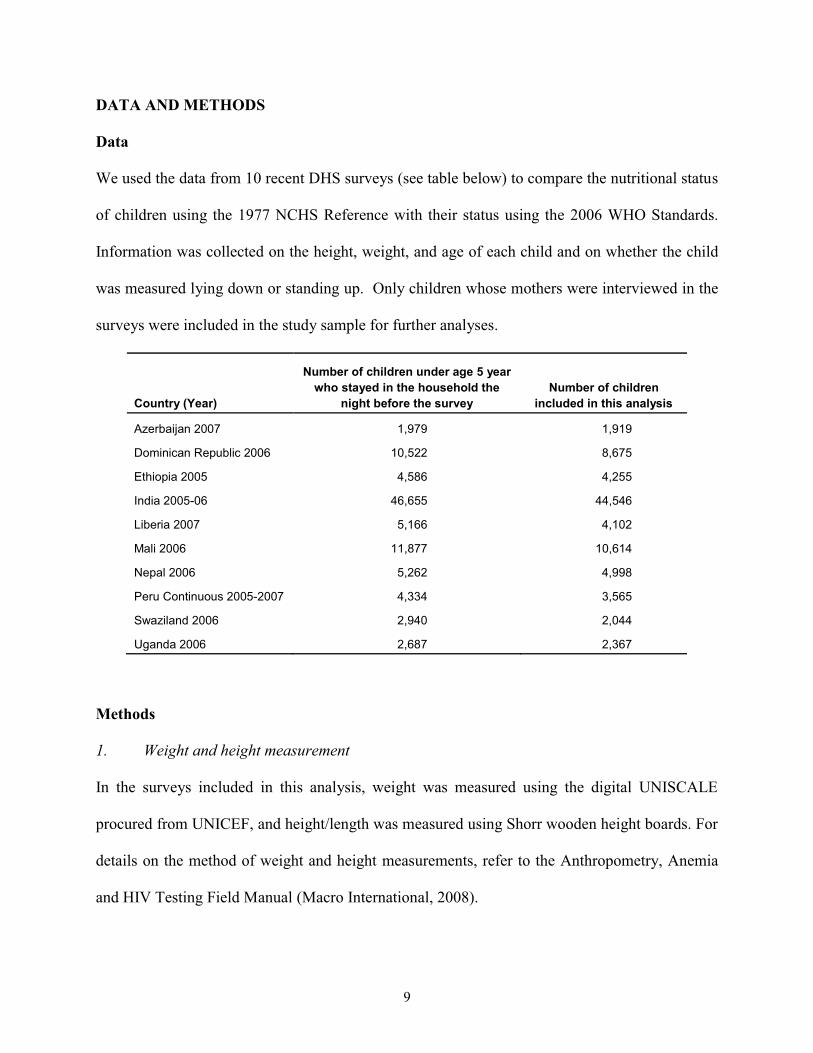
We used the data from 10 recent DHS surveys (see table below) to compare the nutritional status
of children using the 1977 NCHS Reference with their status using the 2006 WHO Standards.
Information was collected on the height, weight, and age of each child and on whether the child
was measured lying down or standing up. Only children whose mothers were interviewed in the
surveys were included in the study sample for further analyses.
Country (Year)
Number of children under age 5 year who stayed in the household the
night before the surveyNumber of children
included in this analysis
Azerbaijan 2007 1,979 1,919
Dominican Republic 2006 10,522 8,675
Ethiopia 2005 4,586 4,255
India 2005-06 46,655 44,546
Liberia 2007 5,166 4,102
Mali 2006 11,877 10,614
Nepal 2006 5,262 4,998
Peru Continuous 2005-2007 4,334 3,565
Swaziland 2006 2,940 2,044
Uganda 2006 2,687 2,367
Methods
1. Weight and height measurement
In the surveys included in this analysis, weight was measured using the digital UNISCALE
procured from UNICEF, and height/length was measured using Shorr wooden height boards. For
details on the method of weight and height measurements, refer to the Anthropometry, Anemia
and HIV Testing Field Manual (Macro International, 2008).
10
It is important to highlight that interviewers were instructed to measure infants and
young children less than age 2 years in lying down position and children age 2 years and older in
a standing position.
2. Anthropometric indices
To assess the nutritional status of children under age 5 years, the following standard indices were
derived using each of the two international standards—the 1977 NCHS Reference and the 2006
WHO Standards.
� Height-for-age: The height-for-age index is an indicator of linear growth retardation
among children. Children who are more than two standard deviations below the
median of the reference population in terms of their height-for-age z-score (for
discussion of z-score, see paragraph following the bullets) are considered short for
their age ("stunted") or chronically malnourished.
� Weight-for-height: The weight-for-height index looks at body mass in relation to
body length. Children who are more than two standard deviations below the median
of the reference population in terms of their weight-for-height z-score are considered
too thin ("wasted"), i.e., they are acutely malnourished. Children more than two
standard deviations above the median weight-for-height z-score are considered
overweight.
� Weight-for-age: Weight-for-age, also referred to as “underweight,” takes into account
both chronic and acute malnutrition and is often used to monitor nutritional status on
a longitudinal basis.
11
Z-score is an indicator used in data analysis which measures how far a given data point is
from the mean of the data. A z-score is derived by subtracting the population mean from an
individual raw score and then dividing the difference by the population standard deviation. This
conversion process is called standardizing or normalizing. We use z-scores because they allow us
to identify a fixed point in the distributions of different indices across different ages and sex for
conducting useful further analysis. The z-scores in this study are calculated as the difference
between the height (length)/weight value for an individual child and the mean/median height
(length)/weight value of the reference/standard population for the same age and sex, divided by
the standard deviation of the reference/standard population.
The nutritional status of children from 10 DHS surveys was compared using the using
both the 1977 NCHS Reference the 2006 WHO Standards. The algorithms suggested by Hong
and de Onis (2008) were applied to convert the 1977 NCHS Reference point estimates into their
equivalent 2006 WHO Standards values, to calculate the prevalence of malnutrition in children.
In order to see the differences in mean z-scores, values were derived by subtracting the
mean z-scores based on the 2006 WHO Standards from those of the 1977 NCHS Reference. The
differences in the mean z-scores were calculated for the total sample and for each of the selected
background characteristics that could influence the measurement and nutritional status of
children. The standard deviations of the mean z-scores based on each standard were also
computed.
3. Background characteristics included in the analysis
� Child’s age was determined by subtracting the date of the birth of the child from the
date of measurement of the child. Then age was categorized into eight subgroups for
12
analytical purposes. For the calculation of the z-scores, both the child’s full date of
birth (year, month, and day) and the full date of interview were used.
� Child’s sex.
� Child’s birth order (1, 2-4, 5+).
� Socioeconomic characteristics: Type of area of residence (urban, rural), household
wealth index quintile (poorest to richest), and mother’s education (none, primary,
secondary or higher).
� Age and method of measurement: Two of the anthropometric indices (height-for-age
and weight-for-age) are influenced by the accuracy of the reporting of the child’s age.
In the DHS, as recommended, the child’s height is measured either lying down
(length) and or standing (height), based on the child’s age. A variable was created to
indicate whether the child was appropriately measured for his or her age and was used
as a background variable for the bivariate and multivariate analyses.
� Exclusive breastfeeding: One of the criteria in the development of the 2006 WHO
Standards was that children of only those mothers who were willing to follow the
MGRS feeding recommendations (see footnote 3) were selected. Hence, exclusive
breastfeeding was included as a background variable in multivariate analysis to
explore whether this characteristic influences results by the 2006 WHO Standards.
4. Methods of analysis (univariate, bivariate and multivariate)
� Simple univariate tables were created to assess the nutrition status of the children
from the 10 DHS countries using the 1977 NCHS Reference and the 2006 WHO
Standards. The mean z-scores and differences between the mean z-scores were
13
calculated for each of the three anthropometric indices, height-for-age,
weight-for-height, and weight-for-age.
� Bivariate tables were constructed for each of the countries to show the difference by
background characteristics in the mean z-scores of each of the three indices.
� Multivariate models were run to explore the influence of the background
characteristics on the mean differences in height-for-age, weight-for-height, and
weight-for-age z-scores. The data file included all 10 countries pooled together to run
the analysis of variance (ANOVA) and multiple classification analysis (MCA)
regression models. The data file was also split into three categories by age—children
under age 24 months, age 24 months, and age 25 months and over—and analysis of
variance and multiple classification analysis were performed for each age split to see
if there are interactive effects.
Natural variations in height and weight of well-fed children follow a normal distribution.
Therefore we prepared curves of the distribution of the children’s z-scores from the two
standards and compared them with the cumulative normal distribution curve for the three
anthropometric indices for each country.
5. Elite children
To simulate the population selected for the creation of the 2006 WHO Standards, we also
selected elite children from our data sets. Elite children were defined as children whose mothers
had secondary or higher education; father or mother’s current partner had secondary or higher
education; the child’s household had electricity, a refrigerator, a TV, an automobile or truck; and
were children who neither suffered from diarrhea nor had a cough or fever in two weeks
14
preceding the survey. Children under age 5 months were also excluded from the elite group if
they were not exclusively breastfed, as well as children age 5 months or older if they did not
receive complementary foods with breastfeeding. Also excluded were children for whom the
type of measurement conducted was not as recommended. We then prepared curves of the
cumulative distributions of these elite children’s z-scores based on the two standards and
compared them with the cumulative normal distribution.
15
RESULTS
Prevalence of Stunting, Wasting, Overweight, and Underweight
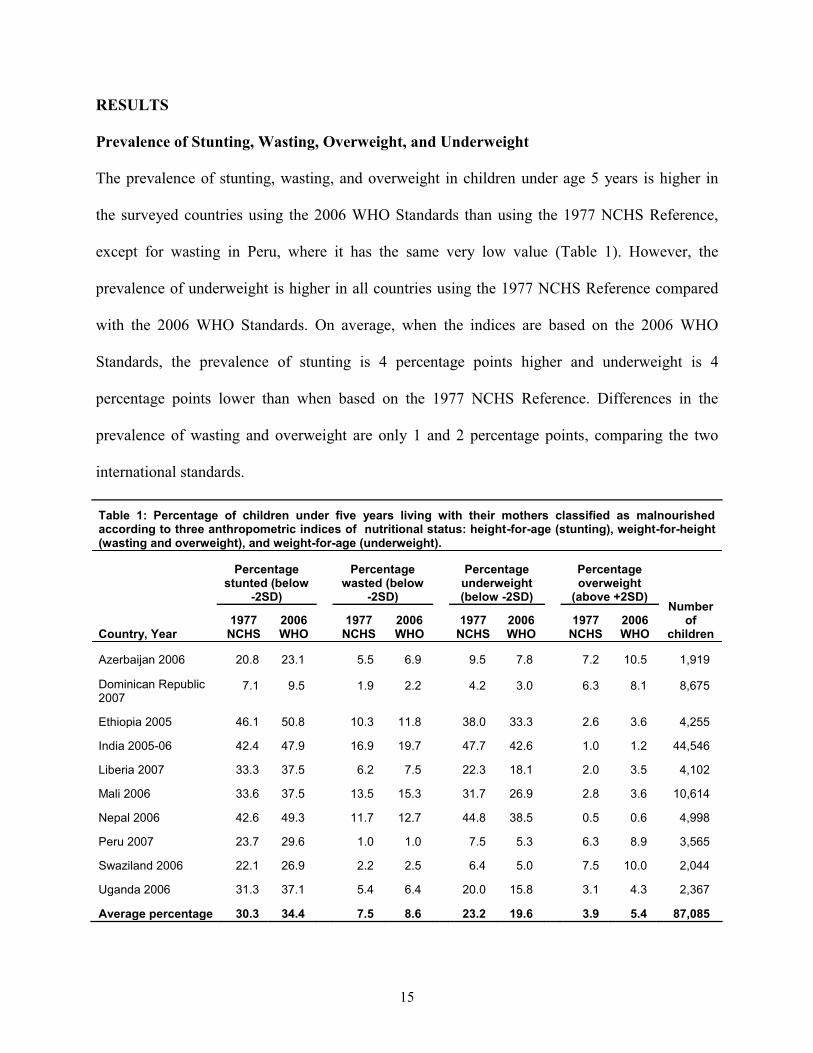
The prevalence of stunting, wasting, and overweight in children under age 5 years is higher in
the surveyed countries using the 2006 WHO Standards than using the 1977 NCHS Reference,
except for wasting in Peru, where it has the same very low value (Table 1). However, the
prevalence of underweight is higher in all countries using the 1977 NCHS Reference compared
with the 2006 WHO Standards. On average, when the indices are based on the 2006 WHO
Standards, the prevalence of stunting is 4 percentage points higher and underweight is 4
percentage points lower than when based on the 1977 NCHS Reference. Differences in the
prevalence of wasting and overweight are only 1 and 2 percentage points, comparing the two
international standards.
Table 1: Percentage of children under five years living with their mothers classified as malnourished according to three anthropometric indices of nutritional status: height-for-age (stunting), weight-for-height (wasting and overweight), and weight-for-age (underweight).
Country, Year
Percentagestunted (below
-2SD)
Percentagewasted (below
-2SD)
Percentageunderweight (below -2SD)
Percentageoverweight
(above +2SD)Number
ofchildren
1977NCHS
2006WHO
1977NCHS
2006WHO
1977NCHS
2006WHO
1977NCHS
2006WHO
Azerbaijan 2006 20.8 23.1 5.5 6.9 9.5 7.8 7.2 10.5 1,919
Dominican Republic 2007
7.1 9.5 1.9 2.2 4.2 3.0 6.3 8.1 8,675
Ethiopia 2005 46.1 50.8 10.3 11.8 38.0 33.3 2.6 3.6 4,255
India 2005-06 42.4 47.9 16.9 19.7 47.7 42.6 1.0 1.2 44,546
Liberia 2007 33.3 37.5 6.2 7.5 22.3 18.1 2.0 3.5 4,102
Mali 2006 33.6 37.5 13.5 15.3 31.7 26.9 2.8 3.6 10,614
Nepal 2006 42.6 49.3 11.7 12.7 44.8 38.5 0.5 0.6 4,998
Peru 2007 23.7 29.6 1.0 1.0 7.5 5.3 6.3 8.9 3,565
Swaziland 2006 22.1 26.9 2.2 2.5 6.4 5.0 7.5 10.0 2,044
Uganda 2006 31.3 37.1 5.4 6.4 20.0 15.8 3.1 4.3 2,367
Average percentage 30.3 34.4 7.5 8.6 23.2 19.6 3.9 5.4 87,085
16
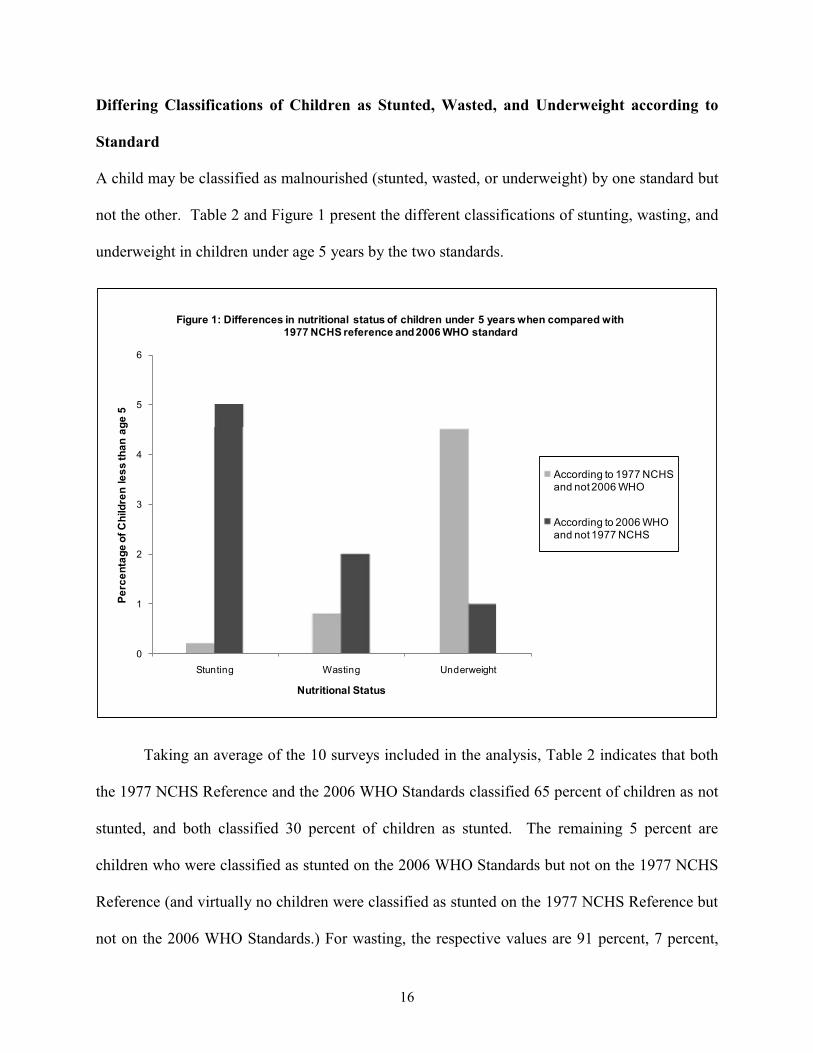
Differing Classifications of Children as Stunted, Wasted, and Underweight according to
Standard
A child may be classified as malnourished (stunted, wasted, or underweight) by one standard but
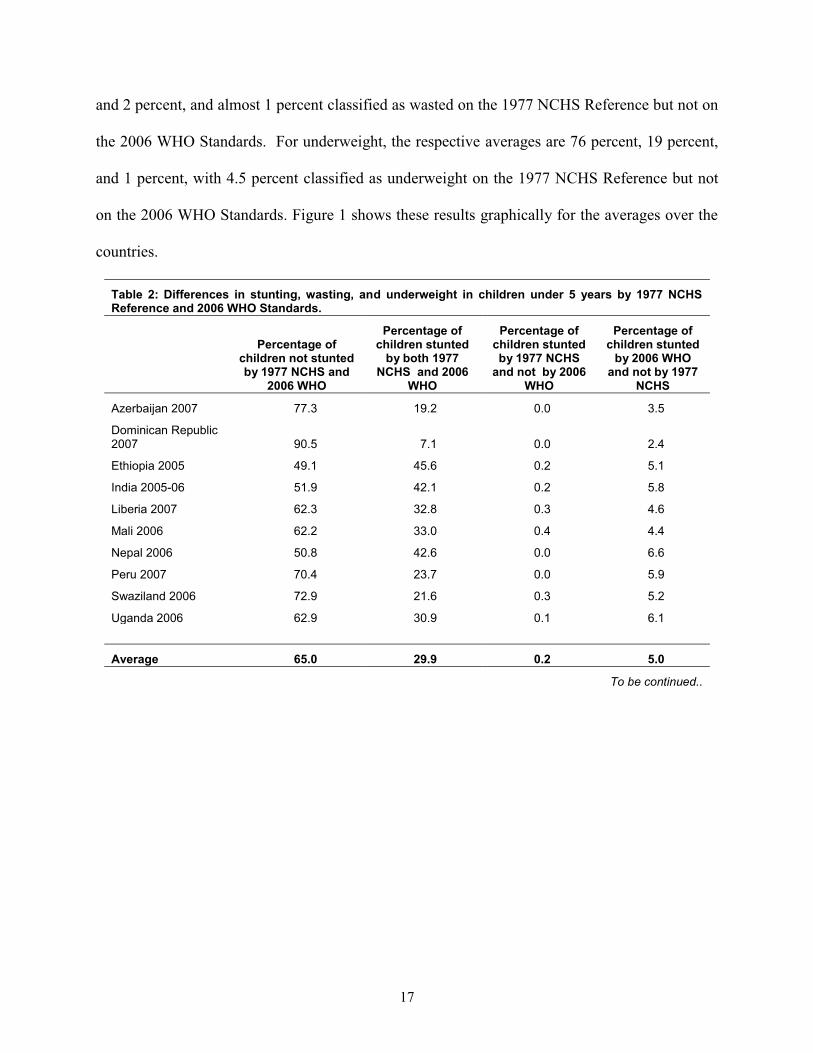
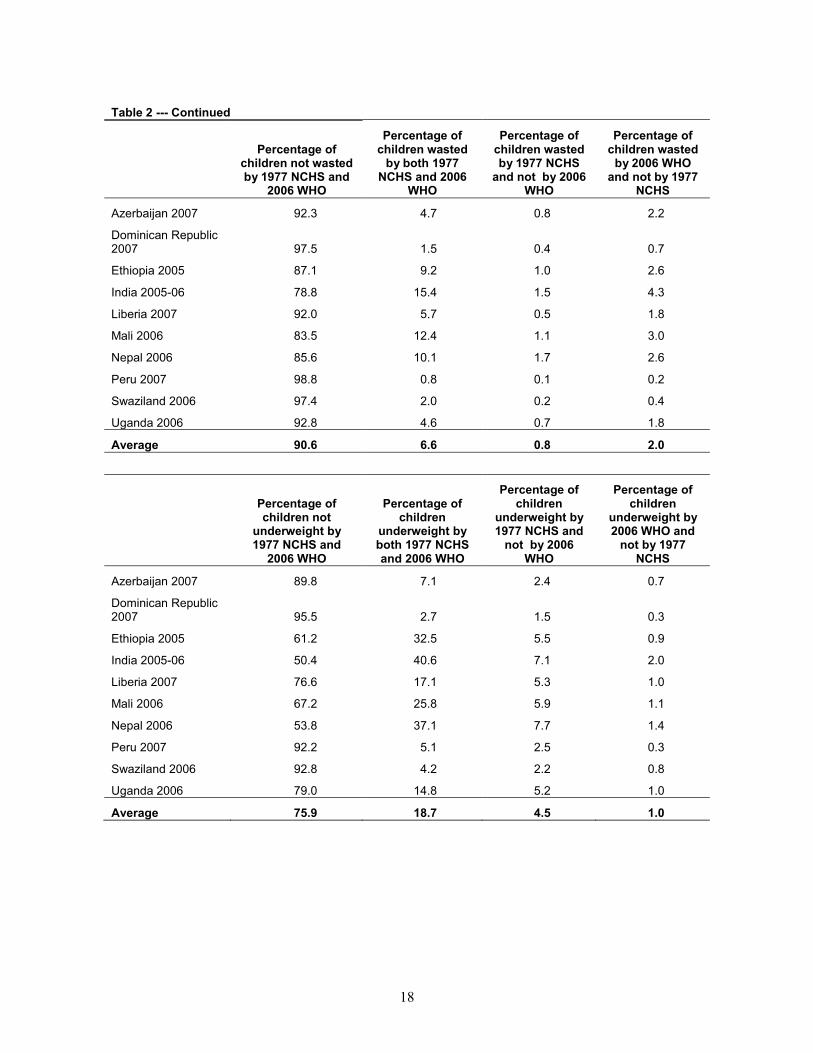
not the other. Table 2 and Figure 1 present the different classifications of stunting, wasting, and
underweight in children under age 5 years by the two standards.
0
1
2
3
4
5
6
Stunting Wasting Underweight
Perc
enta
ge o
f Chi
ldre
n le
ss th
an a
ge 5
Nutritional Status
Figure 1: Differences in nutritional status of children under 5 years when compared with 1977 NCHS reference and 2006 WHO standard
According to 1977 NCHS and not 2006 WHO
According to 2006 WHO and not 1977 NCHS
Taking an average of the 10 surveys included in the analysis, Table 2 indicates that both
the 1977 NCHS Reference and the 2006 WHO Standards classified 65 percent of children as not
stunted, and both classified 30 percent of children as stunted. The remaining 5 percent are
children who were classified as stunted on the 2006 WHO Standards but not on the 1977 NCHS
Reference (and virtually no children were classified as stunted on the 1977 NCHS Reference but
not on the 2006 WHO Standards.) For wasting, the respective values are 91 percent, 7 percent,
17
and 2 percent, and almost 1 percent classified as wasted on the 1977 NCHS Reference but not on
the 2006 WHO Standards. For underweight, the respective averages are 76 percent, 19 percent,
and 1 percent, with 4.5 percent classified as underweight on the 1977 NCHS Reference but not
on the 2006 WHO Standards. Figure 1 shows these results graphically for the averages over the
countries.
Table 2: Differences in stunting, wasting, and underweight in children under 5 years by 1977 NCHS Reference and 2006 WHO Standards.
Percentage of children not stunted by 1977 NCHS and
2006 WHO
Percentage of children stunted
by both 1977 NCHS and 2006
WHO
Percentage of children stunted by 1977 NCHS
and not by 2006 WHO
Percentage of children stunted
by 2006 WHO and not by 1977
NCHS
Azerbaijan 2007 77.3 19.2 0.0 3.5
Dominican Republic 2007 90.5 7.1 0.0 2.4
Ethiopia 2005 49.1 45.6 0.2 5.1
India 2005-06 51.9 42.1 0.2 5.8
Liberia 2007 62.3 32.8 0.3 4.6
Mali 2006 62.2 33.0 0.4 4.4
Nepal 2006 50.8 42.6 0.0 6.6
Peru 2007 70.4 23.7 0.0 5.9
Swaziland 2006 72.9 21.6 0.3 5.2
Uganda 2006 62.9 30.9 0.1 6.1
Average 65.0 29.9 0.2 5.0
To be continued..
18
Table 2 --- Continued
Percentage of children not wasted by 1977 NCHS and
2006 WHO
Percentage of children wasted
by both 1977 NCHS and 2006
WHO
Percentage of children wasted by 1977 NCHS
and not by 2006 WHO
Percentage of children wasted
by 2006 WHO and not by 1977
NCHS
Azerbaijan 2007 92.3 4.7 0.8 2.2
Dominican Republic 2007 97.5 1.5 0.4 0.7
Ethiopia 2005 87.1 9.2 1.0 2.6
India 2005-06 78.8 15.4 1.5 4.3
Liberia 2007 92.0 5.7 0.5 1.8
Mali 2006 83.5 12.4 1.1 3.0
Nepal 2006 85.6 10.1 1.7 2.6
Peru 2007 98.8 0.8 0.1 0.2
Swaziland 2006 97.4 2.0 0.2 0.4
Uganda 2006 92.8 4.6 0.7 1.8
Average 90.6 6.6 0.8 2.0
Percentage of children not
underweight by 1977 NCHS and
2006 WHO
Percentage of children
underweight by both 1977 NCHS and 2006 WHO
Percentage of children
underweight by 1977 NCHS and
not by 2006 WHO
Percentage of children
underweight by 2006 WHO and
not by 1977 NCHS
Azerbaijan 2007 89.8 7.1 2.4 0.7
Dominican Republic 2007 95.5 2.7 1.5 0.3
Ethiopia 2005 61.2 32.5 5.5 0.9
India 2005-06 50.4 40.6 7.1 2.0
Liberia 2007 76.6 17.1 5.3 1.0
Mali 2006 67.2 25.8 5.9 1.1
Nepal 2006 53.8 37.1 7.7 1.4
Peru 2007 92.2 5.1 2.5 0.3
Swaziland 2006 92.8 4.2 2.2 0.8
Uganda 2006 79.0 14.8 5.2 1.0
Average 75.9 18.7 4.5 1.0
19
Mean and Standard Deviations of the Z-Scores by Standard
Table 3 presents the average value of each country’s z-scores using the 1977 NCHS Reference,
the 2006 WHO Standards, and the differences between them. For height-for-age, the mean z-
scores are consistently lower across all the countries using the 2006 WHO Standards, with an
average difference of 0.16. The situation is reversed for weight-for-age, as mean weight-for-age
z-scores are consistently higher using the 2006 WHO Standards. The weight-for-height mean z-
scores are also consistently higher for the 2006 WHO Standards than for the 1977 NCHS
Reference.
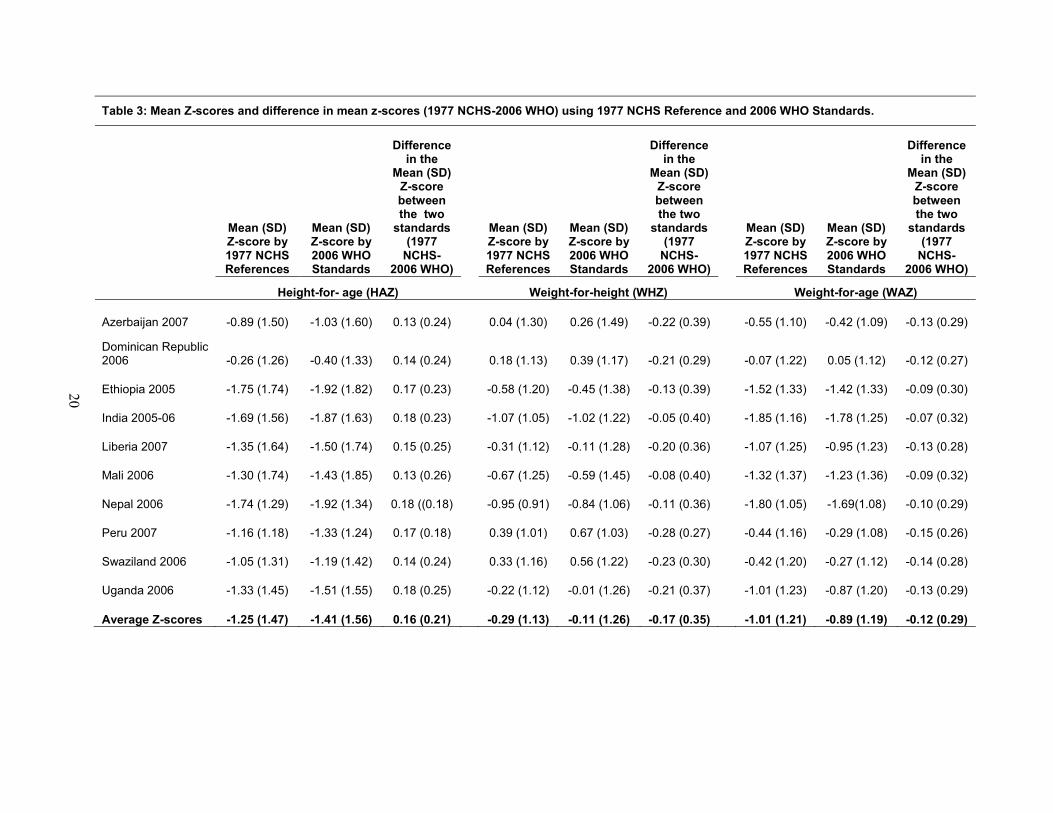
Table 3: Mean Z-scores and difference in mean z-scores (1977 NCHS-2006 WHO) using 1977 NCHS Reference and 2006 WHO Standards.
Mean (SD) Z-score by 1977 NCHS References
Mean (SD) Z-score by 2006 WHO Standards
Difference in the
Mean (SD) Z-score between the two
standards (1977
NCHS-2006 WHO)
Mean (SD) Z-score by 1977 NCHS References
Mean (SD) Z-score by 2006 WHO Standards
Difference in the
Mean (SD) Z-score between the two
standards (1977
NCHS-2006 WHO)
Mean (SD) Z-score by 1977 NCHS References
Mean (SD) Z-score by 2006 WHO Standards
Difference in the
Mean (SD) Z-score between the two
standards (1977
NCHS-2006 WHO)
Height-for- age (HAZ) Weight-for-height (WHZ) Weight-for-age (WAZ)
Azerbaijan 2007 -0.89 (1.50) -1.03 (1.60) 0.13 (0.24) 0.04 (1.30) 0.26 (1.49) -0.22 (0.39) -0.55 (1.10) -0.42 (1.09) -0.13 (0.29)
Dominican Republic 2006 -0.26 (1.26) -0.40 (1.33) 0.14 (0.24) 0.18 (1.13) 0.39 (1.17) -0.21 (0.29) -0.07 (1.22) 0.05 (1.12) -0.12 (0.27)
Ethiopia 2005 -1.75 (1.74) -1.92 (1.82) 0.17 (0.23) -0.58 (1.20) -0.45 (1.38) -0.13 (0.39) -1.52 (1.33) -1.42 (1.33) -0.09 (0.30)
India 2005-06 -1.69 (1.56) -1.87 (1.63) 0.18 (0.23) -1.07 (1.05) -1.02 (1.22) -0.05 (0.40) -1.85 (1.16) -1.78 (1.25) -0.07 (0.32)
Liberia 2007 -1.35 (1.64) -1.50 (1.74) 0.15 (0.25) -0.31 (1.12) -0.11 (1.28) -0.20 (0.36) -1.07 (1.25) -0.95 (1.23) -0.13 (0.28)
Mali 2006 -1.30 (1.74) -1.43 (1.85) 0.13 (0.26) -0.67 (1.25) -0.59 (1.45) -0.08 (0.40) -1.32 (1.37) -1.23 (1.36) -0.09 (0.32)
Nepal 2006 -1.74 (1.29) -1.92 (1.34) 0.18 ((0.18) -0.95 (0.91) -0.84 (1.06) -0.11 (0.36) -1.80 (1.05) -1.69(1.08) -0.10 (0.29)
Peru 2007 -1.16 (1.18) -1.33 (1.24) 0.17 (0.18) 0.39 (1.01) 0.67 (1.03) -0.28 (0.27) -0.44 (1.16) -0.29 (1.08) -0.15 (0.26)
Swaziland 2006 -1.05 (1.31) -1.19 (1.42) 0.14 (0.24) 0.33 (1.16) 0.56 (1.22) -0.23 (0.30) -0.42 (1.20) -0.27 (1.12) -0.14 (0.28)
Uganda 2006 -1.33 (1.45) -1.51 (1.55) 0.18 (0.25) -0.22 (1.12) -0.01 (1.26) -0.21 (0.37) -1.01 (1.23) -0.87 (1.20) -0.13 (0.29)
Average Z-scores -1.25 (1.47) -1.41 (1.56) 0.16 (0.21) -0.29 (1.13) -0.11 (1.26) -0.17 (0.35) -1.01 (1.21) -0.89 (1.19) -0.12 (0.29)
20
21
Application of the Algorithm for Translating 1977 NCHS Reference Values into 2006
WHO Estimates
In the absence of 2006 WHO Standards-based estimates of malnutrition, Hong and de Onis
(2008) recommend applying an algorithm to the 1977 NCHS Reference values in order to
estimate equivalent values of malnutrition for the 2006 WHO Standards for the purpose of
assessing trends. Applying this algorithm gives consistently higher prevalences for all the
indices than do direct calculations using the 2006 WHO Standards. The greatest difference
between the estimated and calculated prevalence values using the 2006 WHO Standards are for
stunting, with an average of 1.6 percentage points higher for the algorithm-estimated value
(Table 4a).
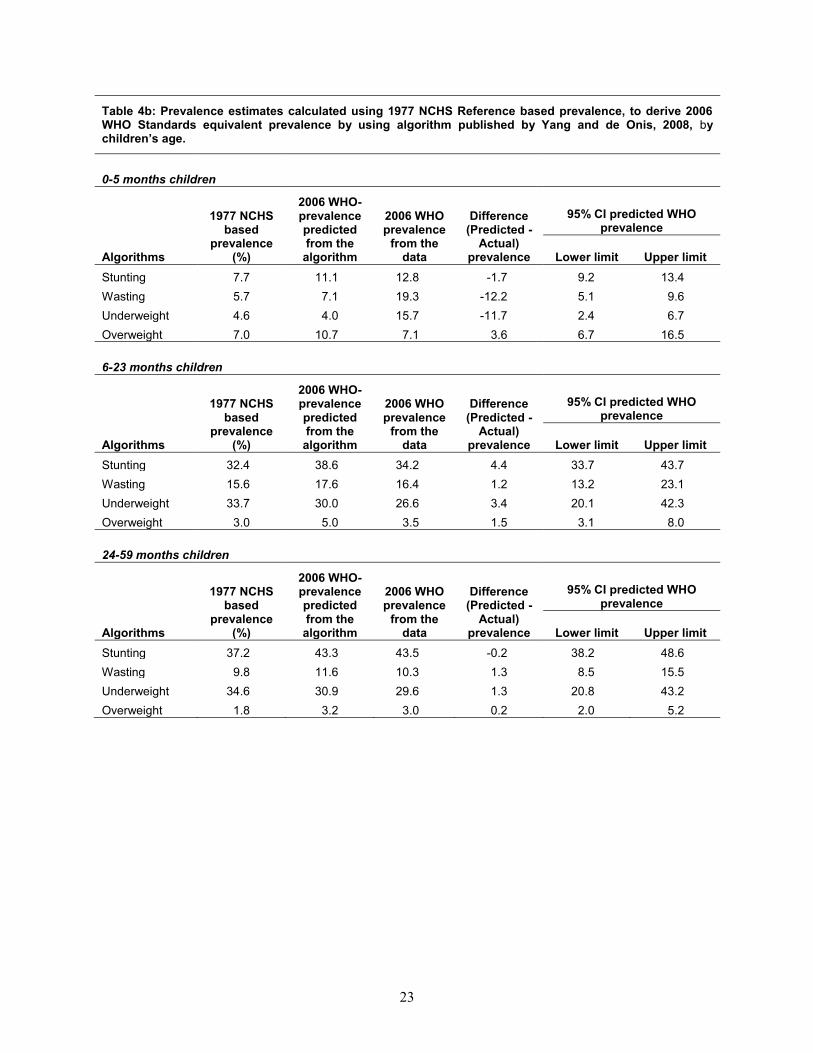
The Hong-de Onis algorithm was also applied separately for children in age groups 0-5
months, 6-23 months, and 24-59 months (Table 4b). For age 0-5 months, fewer children are
classified as undernourished using the algorithm than from directly applying the 2006 WHO
Standards. Wasting and underweight are about 12 percentage points less when estimated with the
algorithm compared with directly applying the 2006 WHO Standards. For children age 6-23
months, using the algorithm produces a prevalence of underweight that exceeds the actual 2006
WHO Standards by about 3 percentage points, and a prevalence of stunting about 4 percentage
points higher. The overestimate for wasting and overweight is less than 2 percentage points.
The closest results of the algorithm to the actual 2006 WHO Standards z-scores occur for
children age 24-59 months, indicating that using the algorithm probably works better than
directly applying the 2006 WHO standards for children age 2 years or older (Table 4b).
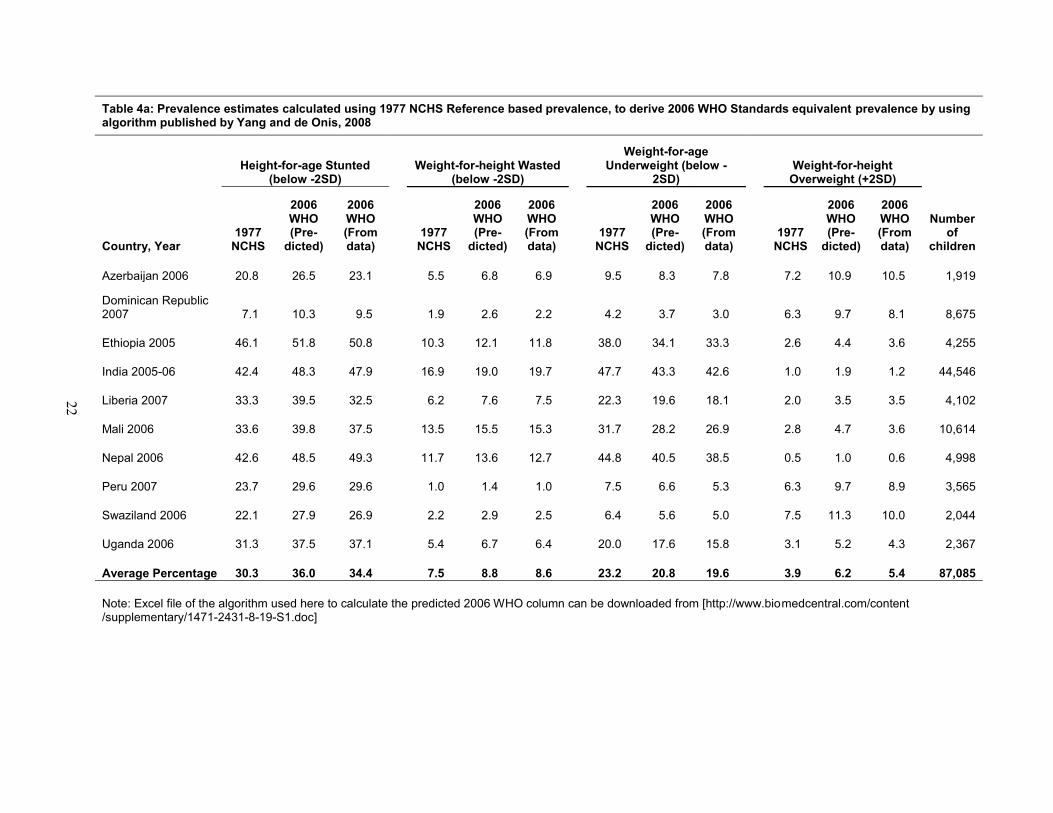
Table 4a: Prevalence estimates calculated using 1977 NCHS Reference based prevalence, to derive 2006 WHO Standards equivalent prevalence by using algorithm published by Yang and de Onis, 2008
Country, Year
Height-for-age Stunted (below -2SD)
Weight-for-height Wasted (below -2SD)
Weight-for-age Underweight (below -
2SD)Weight-for-height
Overweight (+2SD)
Number of
children1977
NCHS
2006WHO (Pre-
dicted)
2006WHO (From data)
1977NCHS
2006WHO (Pre-
dicted)
2006WHO (From data)
1977NCHS
2006WHO (Pre-
dicted)
2006WHO (From data)
1977NCHS
2006WHO (Pre-
dicted)
2006WHO (From data)
Azerbaijan 2006 20.8 26.5 23.1 5.5 6.8 6.9 9.5 8.3 7.8 7.2 10.9 10.5 1,919
Dominican Republic 2007 7.1 10.3 9.5 1.9 2.6 2.2 4.2 3.7 3.0 6.3 9.7 8.1 8,675
Ethiopia 2005 46.1 51.8 50.8 10.3 12.1 11.8 38.0 34.1 33.3 2.6 4.4 3.6 4,255
India 2005-06 42.4 48.3 47.9 16.9 19.0 19.7 47.7 43.3 42.6 1.0 1.9 1.2 44,546
Liberia 2007 33.3 39.5 32.5 6.2 7.6 7.5 22.3 19.6 18.1 2.0 3.5 3.5 4,102
Mali 2006 33.6 39.8 37.5 13.5 15.5 15.3 31.7 28.2 26.9 2.8 4.7 3.6 10,614
Nepal 2006 42.6 48.5 49.3 11.7 13.6 12.7 44.8 40.5 38.5 0.5 1.0 0.6 4,998
Peru 2007 23.7 29.6 29.6 1.0 1.4 1.0 7.5 6.6 5.3 6.3 9.7 8.9 3,565
Swaziland 2006 22.1 27.9 26.9 2.2 2.9 2.5 6.4 5.6 5.0 7.5 11.3 10.0 2,044
Uganda 2006 31.3 37.5 37.1 5.4 6.7 6.4 20.0 17.6 15.8 3.1 5.2 4.3 2,367
Average Percentage 30.3 36.0 34.4 7.5 8.8 8.6 23.2 20.8 19.6 3.9 6.2 5.4 87,085
Note: Excel file of the algorithm used here to calculate the predicted 2006 WHO column can be downloaded from [http://www.biomedcentral.com/content/supplementary/1471-2431-8-19-S1.doc]
22
23
Table 4b: Prevalence estimates calculated using 1977 NCHS Reference based prevalence, to derive 2006 WHO Standards equivalent prevalence by using algorithm published by Yang and de Onis, 2008, bychildren’s age.
0-5 months children
Algorithms
1977 NCHS based
prevalence (%)
2006 WHO-prevalence predicted from the
algorithm
2006 WHO prevalence
from the data
Difference (Predicted -
Actual) prevalence
95% CI predicted WHO prevalence
Lower limit Upper limitStunting 7.7 11.1 12.8 -1.7 9.2 13.4Wasting 5.7 7.1 19.3 -12.2 5.1 9.6Underweight 4.6 4.0 15.7 -11.7 2.4 6.7Overweight 7.0 10.7 7.1 3.6 6.7 16.5
6-23 months children
Algorithms
1977 NCHS based
prevalence (%)
2006 WHO-prevalence predicted from the
algorithm
2006 WHO prevalence
from the data
Difference (Predicted -
Actual) prevalence
95% CI predicted WHO prevalence
Lower limit Upper limitStunting 32.4 38.6 34.2 4.4 33.7 43.7Wasting 15.6 17.6 16.4 1.2 13.2 23.1Underweight 33.7 30.0 26.6 3.4 20.1 42.3Overweight 3.0 5.0 3.5 1.5 3.1 8.0
24-59 months children
Algorithms
1977 NCHS based
prevalence (%)
2006 WHO-prevalence predicted from the
algorithm
2006 WHO prevalence
from the data
Difference (Predicted -
Actual) prevalence
95% CI predicted WHOprevalence
Lower limit Upper limitStunting 37.2 43.3 43.5 -0.2 38.2 48.6Wasting 9.8 11.6 10.3 1.3 8.5 15.5Underweight 34.6 30.9 29.6 1.3 20.8 43.2Overweight 1.8 3.2 3.0 0.2 2.0 5.2
24
Bivariate Relationships with Mean Differences in Z-Scores between Standards, according
to Child Characteristics
Tables 5a, 5b, and 5c present the bivariate results for differences between the mean z-scores by
standard used for height-for-age (HAZ), weight-for-height (WHZ), and weight-for-age (WAZ),
according to various background characteristics. Since the 2006 WHO Standards value is
subtracted from the 1977 NCHS Reference value, a positive difference indicates a higher 1977
NCHS value4 (i.e. a positive value indicates that children are better nourished or less
malnourished using the 1977 NCHS Reference than using the 2006 WHO Standards).
1. Height-for-age
In children’s first 6 months of life, all of the 10 surveys show a somewhat lower mean HAZ
difference by the 2006 WHO Standards (Table 5a). However, for age 6-17 months the mean
HAZ is slightly higher with the 2006 WHO Standards. This difference is especially notable in
Azerbaijan 2007 and Dominican Republic 2006 for children age 6-11 months. The mean HAZ
difference takes its most positive values for children age 24-36 months.
4 NCHS (mean z-score) – WHO (mean z-score) = Mean z-score difference Example: (-0.89) – (-1.03) = 0.13
(-0.95) – (-0.84) = -0.11
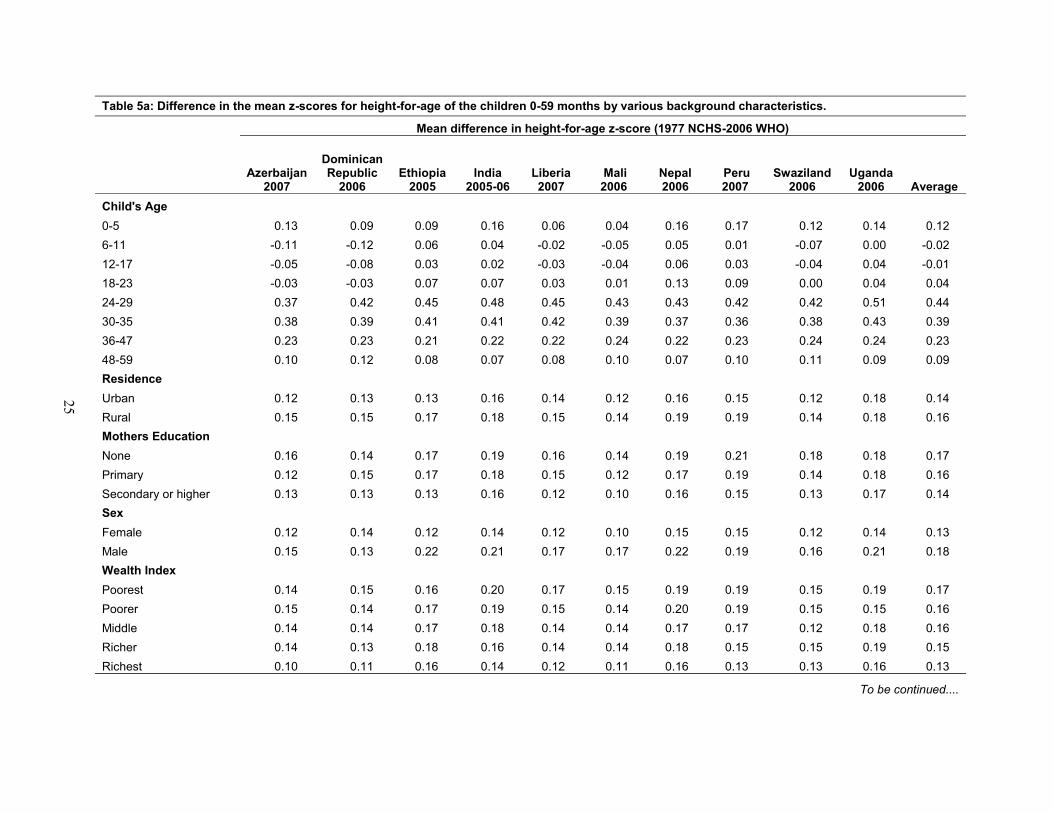
Table 5a: Difference in the mean z-scores for height-for-age of the children 0-59 months by various background characteristics.
Mean difference in height-for-age z-score (1977 NCHS-2006 WHO)
Azerbaijan 2007
Dominican Republic
2006Ethiopia
2005India
2005-06Liberia 2007
Mali 2006
Nepal 2006
Peru 2007
Swaziland 2006
Uganda 2006 Average
Child's Age0-5 0.13 0.09 0.09 0.16 0.06 0.04 0.16 0.17 0.12 0.14 0.126-11 -0.11 -0.12 0.06 0.04 -0.02 -0.05 0.05 0.01 -0.07 0.00 -0.0212-17 -0.05 -0.08 0.03 0.02 -0.03 -0.04 0.06 0.03 -0.04 0.04 -0.0118-23 -0.03 -0.03 0.07 0.07 0.03 0.01 0.13 0.09 0.00 0.04 0.0424-29 0.37 0.42 0.45 0.48 0.45 0.43 0.43 0.42 0.42 0.51 0.4430-35 0.38 0.39 0.41 0.41 0.42 0.39 0.37 0.36 0.38 0.43 0.3936-47 0.23 0.23 0.21 0.22 0.22 0.24 0.22 0.23 0.24 0.24 0.2348-59 0.10 0.12 0.08 0.07 0.08 0.10 0.07 0.10 0.11 0.09 0.09Residence Urban 0.12 0.13 0.13 0.16 0.14 0.12 0.16 0.15 0.12 0.18 0.14Rural 0.15 0.15 0.17 0.18 0.15 0.14 0.19 0.19 0.14 0.18 0.16Mothers EducationNone 0.16 0.14 0.17 0.19 0.16 0.14 0.19 0.21 0.18 0.18 0.17Primary 0.12 0.15 0.17 0.18 0.15 0.12 0.17 0.19 0.14 0.18 0.16Secondary or higher 0.13 0.13 0.13 0.16 0.12 0.10 0.16 0.15 0.13 0.17 0.14SexFemale 0.12 0.14 0.12 0.14 0.12 0.10 0.15 0.15 0.12 0.14 0.13Male 0.15 0.13 0.22 0.21 0.17 0.17 0.22 0.19 0.16 0.21 0.18Wealth IndexPoorest 0.14 0.15 0.16 0.20 0.17 0.15 0.19 0.19 0.15 0.19 0.17Poorer 0.15 0.14 0.17 0.19 0.15 0.14 0.20 0.19 0.15 0.15 0.16Middle 0.14 0.14 0.17 0.18 0.14 0.14 0.17 0.17 0.12 0.18 0.16Richer 0.14 0.13 0.18 0.16 0.14 0.14 0.18 0.15 0.15 0.19 0.15Richest 0.10 0.11 0.16 0.14 0.12 0.11 0.16 0.13 0.13 0.16 0.13
To be continued....
25
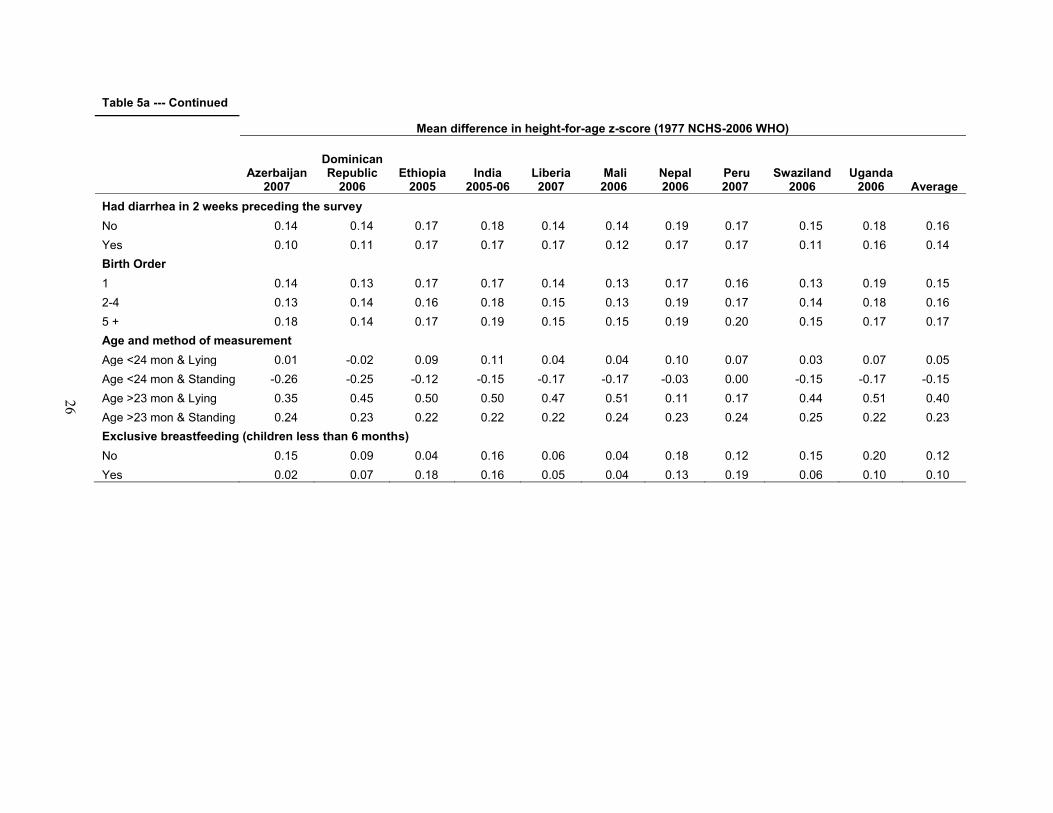
Table 5a --- Continued
Mean difference in height-for-age z-score (1977 NCHS-2006 WHO)
Azerbaijan 2007
Dominican Republic
2006Ethiopia
2005India
2005-06Liberia 2007
Mali 2006
Nepal 2006
Peru 2007
Swaziland 2006
Uganda 2006 Average
Had diarrhea in 2 weeks preceding the surveyNo 0.14 0.14 0.17 0.18 0.14 0.14 0.19 0.17 0.15 0.18 0.16Yes 0.10 0.11 0.17 0.17 0.17 0.12 0.17 0.17 0.11 0.16 0.14Birth Order1 0.14 0.13 0.17 0.17 0.14 0.13 0.17 0.16 0.13 0.19 0.152-4 0.13 0.14 0.16 0.18 0.15 0.13 0.19 0.17 0.14 0.18 0.165 + 0.18 0.14 0.17 0.19 0.15 0.15 0.19 0.20 0.15 0.17 0.17Age and method of measurementAge <24 mon & Lying 0.01 -0.02 0.09 0.11 0.04 0.04 0.10 0.07 0.03 0.07 0.05Age <24 mon & Standing -0.26 -0.25 -0.12 -0.15 -0.17 -0.17 -0.03 0.00 -0.15 -0.17 -0.15Age >23 mon & Lying 0.35 0.45 0.50 0.50 0.47 0.51 0.11 0.17 0.44 0.51 0.40Age >23 mon & Standing 0.24 0.23 0.22 0.22 0.22 0.24 0.23 0.24 0.25 0.22 0.23Exclusive breastfeeding (children less than 6 months)No 0.15 0.09 0.04 0.16 0.06 0.04 0.18 0.12 0.15 0.20 0.12Yes 0.02 0.07 0.18 0.16 0.05 0.04 0.13 0.19 0.06 0.10 0.10
26
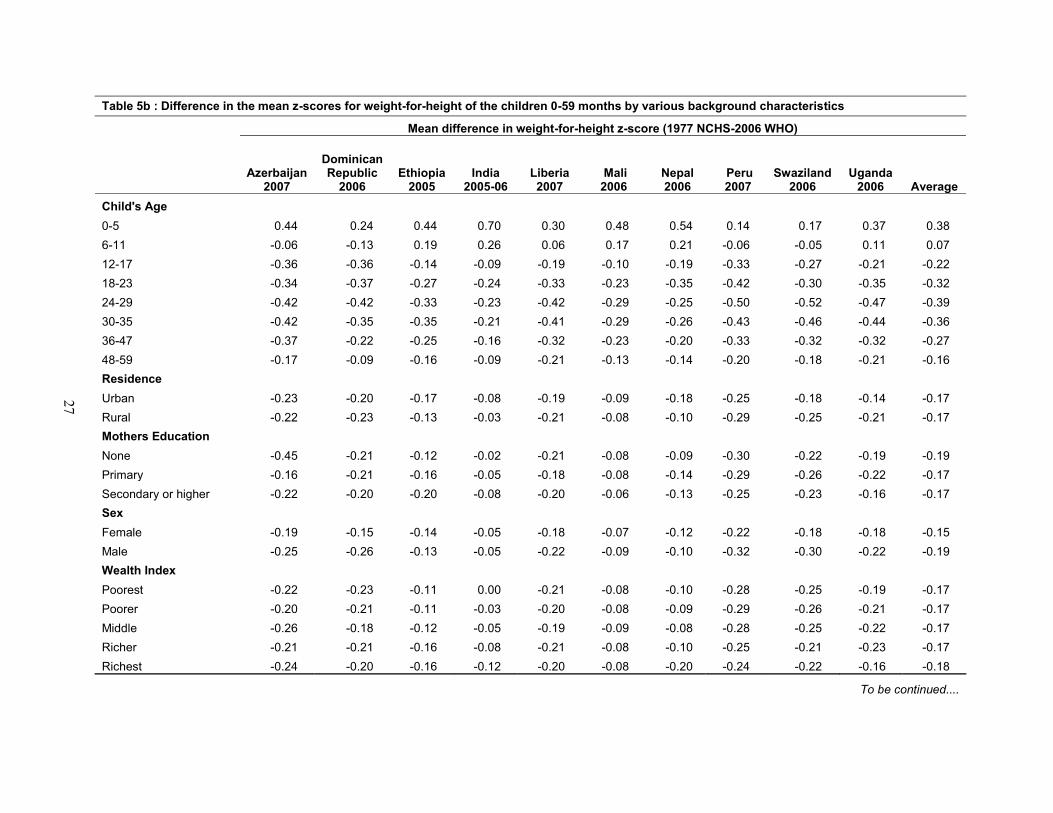
Table 5b : Difference in the mean z-scores for weight-for-height of the children 0-59 months by various background characteristics
Mean difference in weight-for-height z-score (1977 NCHS-2006 WHO)
Azerbaijan 2007
Dominican Republic
2006Ethiopia
2005India
2005-06Liberia 2007
Mali 2006
Nepal 2006
Peru 2007
Swaziland 2006
Uganda 2006 Average
Child's Age0-5 0.44 0.24 0.44 0.70 0.30 0.48 0.54 0.14 0.17 0.37 0.386-11 -0.06 -0.13 0.19 0.26 0.06 0.17 0.21 -0.06 -0.05 0.11 0.0712-17 -0.36 -0.36 -0.14 -0.09 -0.19 -0.10 -0.19 -0.33 -0.27 -0.21 -0.2218-23 -0.34 -0.37 -0.27 -0.24 -0.33 -0.23 -0.35 -0.42 -0.30 -0.35 -0.3224-29 -0.42 -0.42 -0.33 -0.23 -0.42 -0.29 -0.25 -0.50 -0.52 -0.47 -0.3930-35 -0.42 -0.35 -0.35 -0.21 -0.41 -0.29 -0.26 -0.43 -0.46 -0.44 -0.3636-47 -0.37 -0.22 -0.25 -0.16 -0.32 -0.23 -0.20 -0.33 -0.32 -0.32 -0.2748-59 -0.17 -0.09 -0.16 -0.09 -0.21 -0.13 -0.14 -0.20 -0.18 -0.21 -0.16Residence Urban -0.23 -0.20 -0.17 -0.08 -0.19 -0.09 -0.18 -0.25 -0.18 -0.14 -0.17Rural -0.22 -0.23 -0.13 -0.03 -0.21 -0.08 -0.10 -0.29 -0.25 -0.21 -0.17Mothers EducationNone -0.45 -0.21 -0.12 -0.02 -0.21 -0.08 -0.09 -0.30 -0.22 -0.19 -0.19Primary -0.16 -0.21 -0.16 -0.05 -0.18 -0.08 -0.14 -0.29 -0.26 -0.22 -0.17Secondary or higher -0.22 -0.20 -0.20 -0.08 -0.20 -0.06 -0.13 -0.25 -0.23 -0.16 -0.17SexFemale -0.19 -0.15 -0.14 -0.05 -0.18 -0.07 -0.12 -0.22 -0.18 -0.18 -0.15Male -0.25 -0.26 -0.13 -0.05 -0.22 -0.09 -0.10 -0.32 -0.30 -0.22 -0.19Wealth IndexPoorest -0.22 -0.23 -0.11 0.00 -0.21 -0.08 -0.10 -0.28 -0.25 -0.19 -0.17Poorer -0.20 -0.21 -0.11 -0.03 -0.20 -0.08 -0.09 -0.29 -0.26 -0.21 -0.17Middle -0.26 -0.18 -0.12 -0.05 -0.19 -0.09 -0.08 -0.28 -0.25 -0.22 -0.17Richer -0.21 -0.21 -0.16 -0.08 -0.21 -0.08 -0.10 -0.25 -0.21 -0.23 -0.17Richest -0.24 -0.20 -0.16 -0.12 -0.20 -0.08 -0.20 -0.24 -0.22 -0.16 -0.18
To be continued....
27

Table 5b --- Continued
Mean difference in weight-for-height z-score (1977 NCHS-2006 WHO)
Azerbaijan 2007
Dominican Republic
2006Ethiopia
2005India
2005-06Liberia 2007
Mali 2006
Nepal 2006
Peru 2007
Swaziland 2006
Uganda 2006 Average
Had diarrhea in 2 weeks preceding the surveyNo -0.23 -0.20 -0.14 -0.06 -0.19 -0.08 -0.11 -0.27 -0.24 -0.22 -0.18Yes -0.19 -0.23 -0.09 0.04 -0.23 -0.07 -0.06 -0.29 -0.24 -0.14 -0.15Birth Order1 -0.24 -0.20 -0.13 -0.06 -0.19 -0.05 -0.13 -0.26 -0.22 -0.19 -0.172-4 -0.22 -0.20 -0.13 -0.05 -0.20 -0.09 -0.11 -0.27 -0.24 -0.20 -0.175 + -0.10 -0.23 -0.13 0.00 -0.21 -0.09 -0.07 -0.29 -0.25 -0.21 -0.16Age and method of measurementAge <24 mon & Lying -0.07 -0.17 0.08 0.17 -0.02 0.15 0.04 -0.18 -0.10 -0.02 -0.01Age <24 mon & Standing -0.19 -0.14 -0.09 -0.10 -0.14 -0.09 -0.33 0.00 -0.20 -0.14 -0.14Age >23 mon & Lying -0.49 -0.45 -0.40 -0.27 -0.47 -0.29 -0.45 -0.39 -0.46 -0.51 -0.42Age >23 mon & Standing -0.32 -0.21 -0.24 -0.14 -0.30 -0.22 -0.20 -0.33 -0.33 -0.29 -0.26Exclusive breastfeeding (children less than 6 months)No 0.45 0.25 0.47 0.70 0.32 0.51 0.58 0.18 0.13 0.36 0.39Yes 0.42 0.17 0.41 0.70 0.27 0.42 0.51 0.11 0.26 0.38 0.36
28
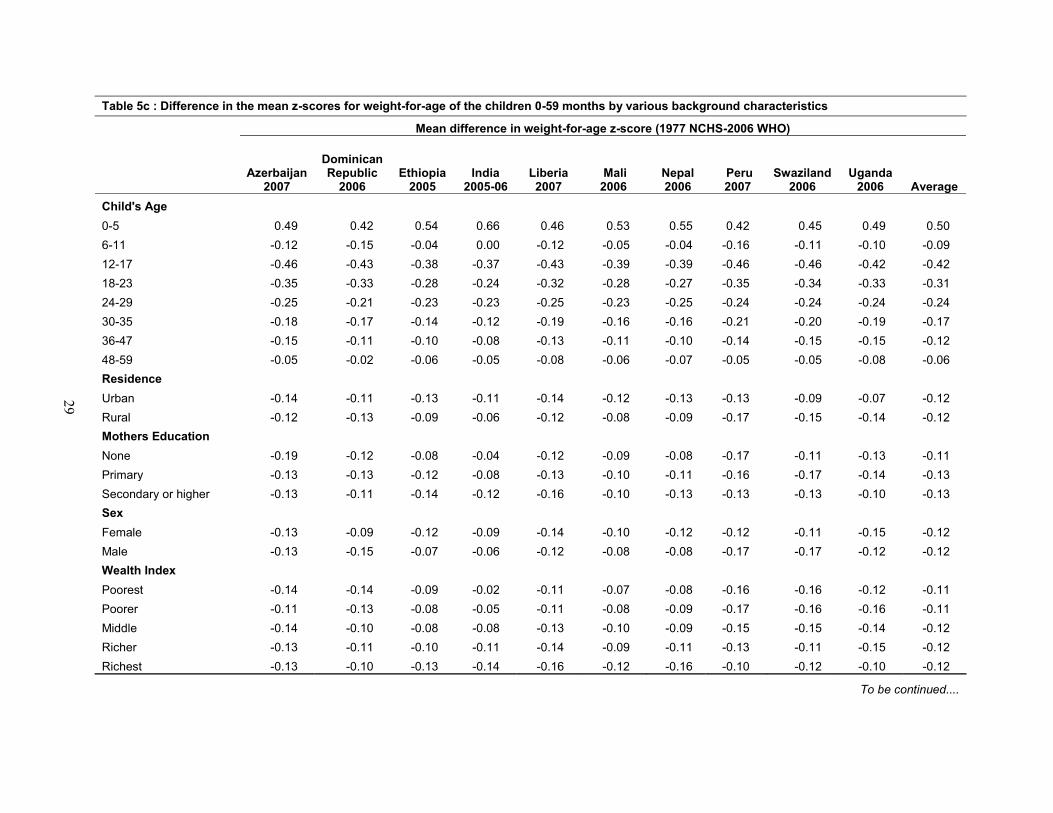
Table 5c : Difference in the mean z-scores for weight-for-age of the children 0-59 months by various background characteristics
Mean difference in weight-for-age z-score (1977 NCHS-2006 WHO)
Azerbaijan 2007
Dominican Republic
2006Ethiopia
2005India
2005-06Liberia 2007
Mali 2006
Nepal 2006
Peru 2007
Swaziland 2006
Uganda 2006 Average
Child's Age0-5 0.49 0.42 0.54 0.66 0.46 0.53 0.55 0.42 0.45 0.49 0.506-11 -0.12 -0.15 -0.04 0.00 -0.12 -0.05 -0.04 -0.16 -0.11 -0.10 -0.0912-17 -0.46 -0.43 -0.38 -0.37 -0.43 -0.39 -0.39 -0.46 -0.46 -0.42 -0.4218-23 -0.35 -0.33 -0.28 -0.24 -0.32 -0.28 -0.27 -0.35 -0.34 -0.33 -0.3124-29 -0.25 -0.21 -0.23 -0.23 -0.25 -0.23 -0.25 -0.24 -0.24 -0.24 -0.2430-35 -0.18 -0.17 -0.14 -0.12 -0.19 -0.16 -0.16 -0.21 -0.20 -0.19 -0.1736-47 -0.15 -0.11 -0.10 -0.08 -0.13 -0.11 -0.10 -0.14 -0.15 -0.15 -0.1248-59 -0.05 -0.02 -0.06 -0.05 -0.08 -0.06 -0.07 -0.05 -0.05 -0.08 -0.06Residence Urban -0.14 -0.11 -0.13 -0.11 -0.14 -0.12 -0.13 -0.13 -0.09 -0.07 -0.12Rural -0.12 -0.13 -0.09 -0.06 -0.12 -0.08 -0.09 -0.17 -0.15 -0.14 -0.12Mothers EducationNone -0.19 -0.12 -0.08 -0.04 -0.12 -0.09 -0.08 -0.17 -0.11 -0.13 -0.11Primary -0.13 -0.13 -0.12 -0.08 -0.13 -0.10 -0.11 -0.16 -0.17 -0.14 -0.13Secondary or higher -0.13 -0.11 -0.14 -0.12 -0.16 -0.10 -0.13 -0.13 -0.13 -0.10 -0.13SexFemale -0.13 -0.09 -0.12 -0.09 -0.14 -0.10 -0.12 -0.12 -0.11 -0.15 -0.12Male -0.13 -0.15 -0.07 -0.06 -0.12 -0.08 -0.08 -0.17 -0.17 -0.12 -0.12Wealth IndexPoorest -0.14 -0.14 -0.09 -0.02 -0.11 -0.07 -0.08 -0.16 -0.16 -0.12 -0.11Poorer -0.11 -0.13 -0.08 -0.05 -0.11 -0.08 -0.09 -0.17 -0.16 -0.16 -0.11Middle -0.14 -0.10 -0.08 -0.08 -0.13 -0.10 -0.09 -0.15 -0.15 -0.14 -0.12Richer -0.13 -0.11 -0.10 -0.11 -0.14 -0.09 -0.11 -0.13 -0.11 -0.15 -0.12Richest -0.13 -0.10 -0.13 -0.14 -0.16 -0.12 -0.16 -0.10 -0.12 -0.10 -0.12
To be continued....
29
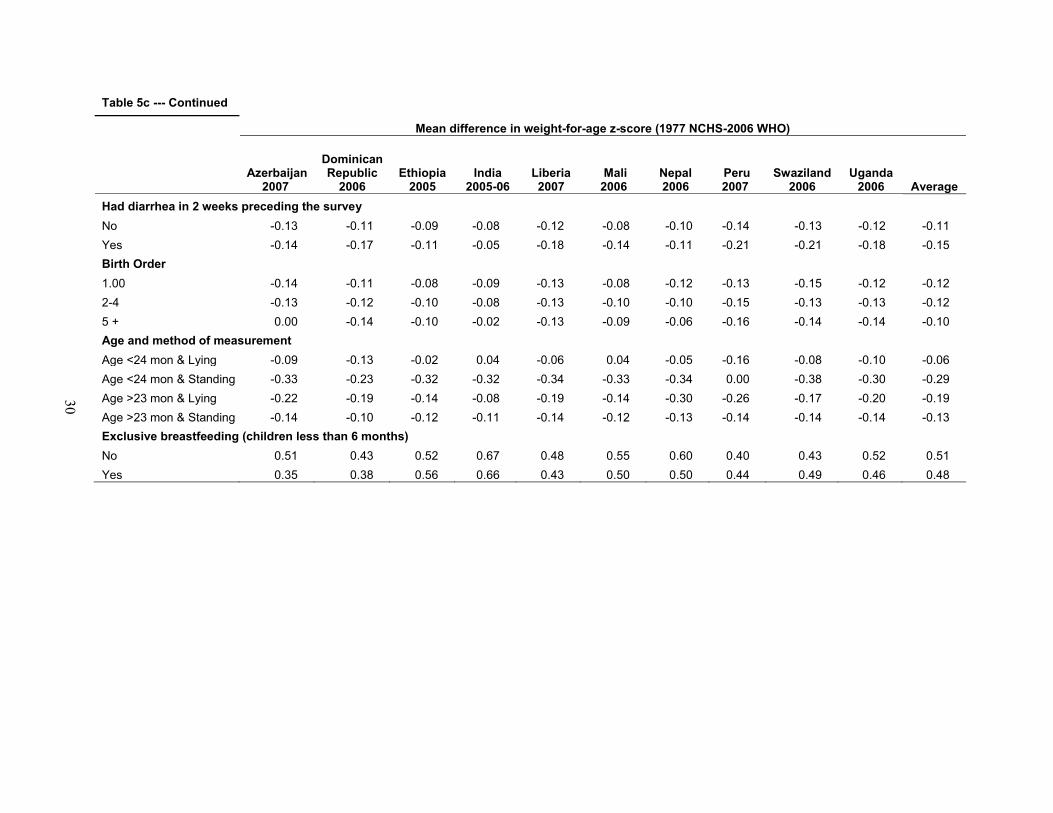
Table 5c --- Continued
Mean difference in weight-for-age z-score (1977 NCHS-2006 WHO)
Azerbaijan 2007
Dominican Republic
2006Ethiopia
2005India
2005-06Liberia 2007
Mali 2006
Nepal 2006
Peru 2007
Swaziland 2006
Uganda 2006 Average
Had diarrhea in 2 weeks preceding the surveyNo -0.13 -0.11 -0.09 -0.08 -0.12 -0.08 -0.10 -0.14 -0.13 -0.12 -0.11Yes -0.14 -0.17 -0.11 -0.05 -0.18 -0.14 -0.11 -0.21 -0.21 -0.18 -0.15Birth Order1.00 -0.14 -0.11 -0.08 -0.09 -0.13 -0.08 -0.12 -0.13 -0.15 -0.12 -0.122-4 -0.13 -0.12 -0.10 -0.08 -0.13 -0.10 -0.10 -0.15 -0.13 -0.13 -0.125 + 0.00 -0.14 -0.10 -0.02 -0.13 -0.09 -0.06 -0.16 -0.14 -0.14 -0.10Age and method of measurementAge <24 mon & Lying -0.09 -0.13 -0.02 0.04 -0.06 0.04 -0.05 -0.16 -0.08 -0.10 -0.06Age <24 mon & Standing -0.33 -0.23 -0.32 -0.32 -0.34 -0.33 -0.34 0.00 -0.38 -0.30 -0.29Age >23 mon & Lying -0.22 -0.19 -0.14 -0.08 -0.19 -0.14 -0.30 -0.26 -0.17 -0.20 -0.19Age >23 mon & Standing -0.14 -0.10 -0.12 -0.11 -0.14 -0.12 -0.13 -0.14 -0.14 -0.14 -0.13Exclusive breastfeeding (children less than 6 months)No 0.51 0.43 0.52 0.67 0.48 0.55 0.60 0.40 0.43 0.52 0.51Yes 0.35 0.38 0.56 0.66 0.43 0.50 0.50 0.44 0.49 0.46 0.48
30
31
Mean HAZ differences between the 1977 NCHS Reference and the 2006 WHO
Standards are slightly greater for children in the poorest households compared with the
wealthiest households. The differences in the HAZ using the two standards are also greater for
children whose mothers had no education compared with those whose mothers who had
secondary or higher education. The differences are also larger for rural children than children
living in urban areas.
As mentioned, according to the 1977 NCHS Reference and the UNICEF guidelines for
taking anthropometric measurements (UNICEF, 2006), children under age 24 months should be
measured lying down, while older children should be measured standing up. Incompatibility
between the child’s age and how the child was measured leads to large differences in the mean z-
scores, especially for children who were under age 24 months and were measured standing up,
and for children over age 24 months who were measured lying down.
2. Weight-for-height
Table 5b presents differences in mean z-scores for weight-for-height (WHZ) between the 1977
NCHS Reference and the 2006 WHO Standards. By age, the greatest difference between the two
standards occurs in ages 0-5 months, 18-23 months, 24-29 months, and 30-35 months. However,
the differences are lower and are similar across all background variables, except for the form of
measurement. Children age 24 months or older who were measured lying down differ by the
greatest amount. The mean z-score by the 2000 WHO standard is higher by a value of 0.42 than
the z-score by the 1977 NCHS reference, as shown by the negative difference. The large but
similar differences between standards for both exclusively and non-exclusively breastfed
children (0.39 for non-breastfed and 0.36 for breastfed) are because this variable was limited to
children under age 6 months.
32
3. Weight-for-age
Similar to the findings for weight-for-height, the mean difference in the z-scores for weight-for-
age (WAZ) comparing the two standards is greatest for infants under age 6 months, with the z-
scores being higher for the 1977 NCHS Reference than the 2006 WHO Standards. For children
age 12-23 months there are large differences in the opposite direction. By method of
measurement, there is little difference between the two standards for children under age 2 years
whose height was measured lying down but a relatively large difference for children under age 2
years who were measured standing up. This result is surprising because height does not enter
into this index of nutritional status assessment. The other background variables do not show
variations by category, but in general the 1977 NCHS Reference z-score for weight-for-age is
lower than the 2006 WHO Standards z-score (Table 5c).
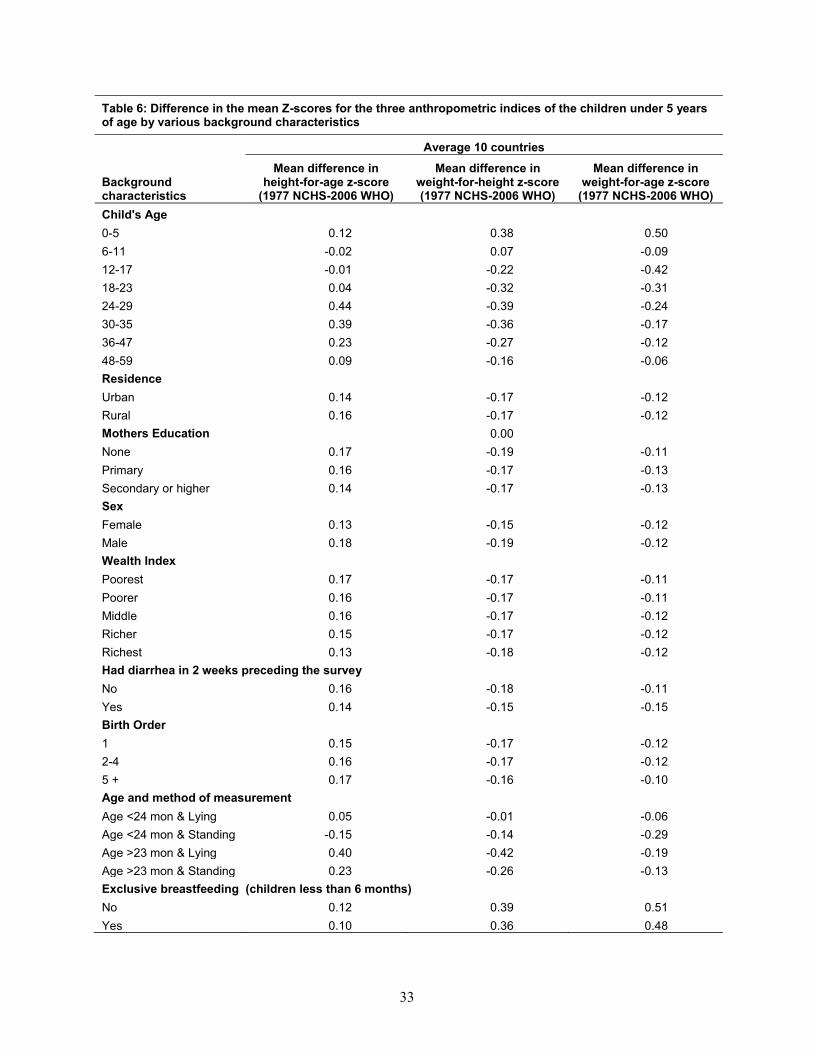
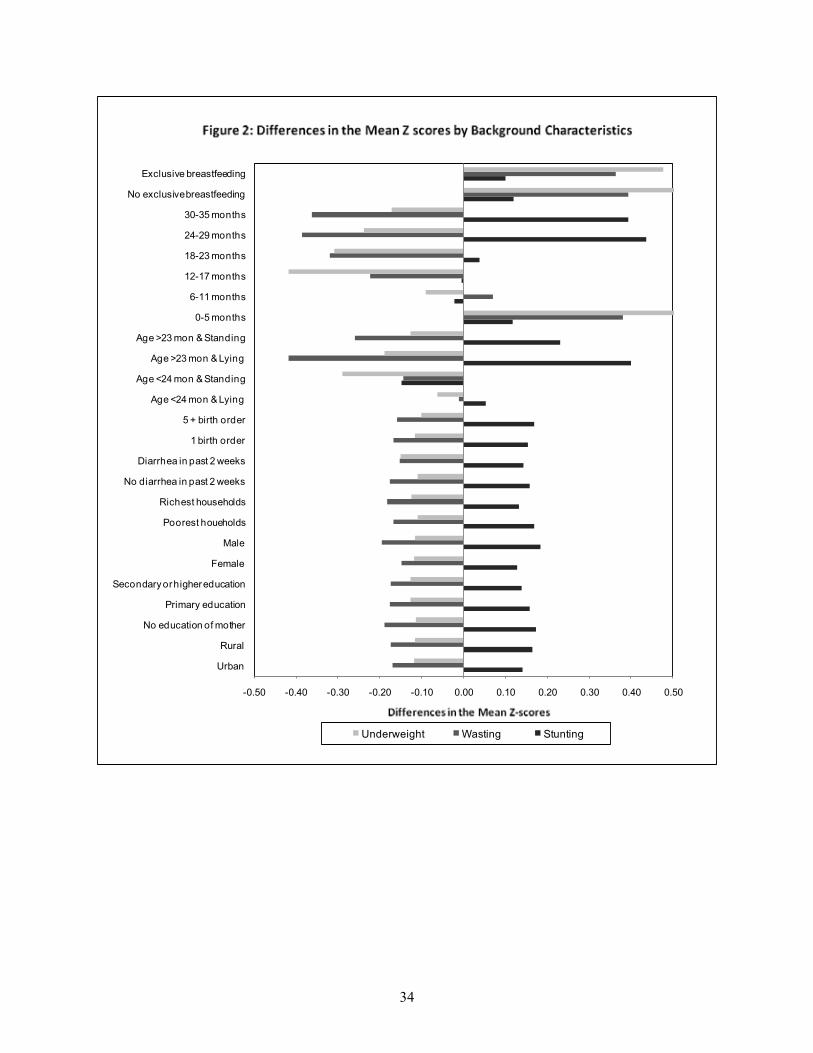
Table 6 and Figure 2 present the mean difference in the z-scores for HAZ, WHZ, and
WAZ by the background characteristics for the 10 countries pooled together.
33
Table 6: Difference in the mean Z-scores for the three anthropometric indices of the children under 5 years of age by various background characteristics
Average 10 countries
Background characteristics
Mean difference in height-for-age z-score
(1977 NCHS-2006 WHO)
Mean difference in weight-for-height z-score (1977 NCHS-2006 WHO)
Mean difference in weight-for-age z-score
(1977 NCHS-2006 WHO)Child's Age0-5 0.12 0.38 0.506-11 -0.02 0.07 -0.0912-17 -0.01 -0.22 -0.4218-23 0.04 -0.32 -0.3124-29 0.44 -0.39 -0.2430-35 0.39 -0.36 -0.1736-47 0.23 -0.27 -0.1248-59 0.09 -0.16 -0.06Residence Urban 0.14 -0.17 -0.12Rural 0.16 -0.17 -0.12Mothers Education 0.00None 0.17 -0.19 -0.11Primary 0.16 -0.17 -0.13Secondary or higher 0.14 -0.17 -0.13SexFemale 0.13 -0.15 -0.12Male 0.18 -0.19 -0.12Wealth IndexPoorest 0.17 -0.17 -0.11Poorer 0.16 -0.17 -0.11Middle 0.16 -0.17 -0.12Richer 0.15 -0.17 -0.12Richest 0.13 -0.18 -0.12Had diarrhea in 2 weeks preceding the surveyNo 0.16 -0.18 -0.11Yes 0.14 -0.15 -0.15Birth Order1 0.15 -0.17 -0.122-4 0.16 -0.17 -0.125 + 0.17 -0.16 -0.10Age and method of measurementAge <24 mon & Lying 0.05 -0.01 -0.06Age <24 mon & Standing -0.15 -0.14 -0.29Age >23 mon & Lying 0.40 -0.42 -0.19Age >23 mon & Standing 0.23 -0.26 -0.13Exclusive breastfeeding (children less than 6 months)No 0.12 0.39 0.51Yes 0.10 0.36 0.48
34
-0.50 -0.40 -0.30 -0.20 -0.10 0.00 0.10 0.20 0.30 0.40 0.50
Urban
Rural
No education of mother
Primary education
Secondary or higher education
Female
Male
Poorest houeholds
Richest households
No diarrhea in past 2 weeks
Diarrhea in past 2 weeks
1 birth order
5 + birth order
Age <24 mon & Lying
Age <24 mon & Standing
Age >23 mon & Lying
Age >23 mon & Standing
0-5 months
6-11 months
12-17 months
18-23 months
24-29 months
30-35 months
No exclusive breastfeeding
Exclusive breastfeeding
Underweight Wasting Stunting
35
The maximum mean difference in the z-scores is observed for the WAZ index for
children age 0-5 months, with a positive difference of 0.50. This finding indicates that there may
be a higher prevalence of underweight by the 2006 WHO Standards in this age group. The other
pronounced difference is in stunting for children age 24-35 months, where z-score is higher,
perhaps an indication that using the 2006 WHO Standards produces a lower prevalence of
stunting than using the 1977 NCHS Reference. Method of measurement shows large differences
for the z-scores for height-for-age and weight-for-height for children age 24 months or older who
were measured lying down, and for weight-for-height for children under age 24 months who
were measured standing up. The other background characteristics do not show much variation
between the two standards.
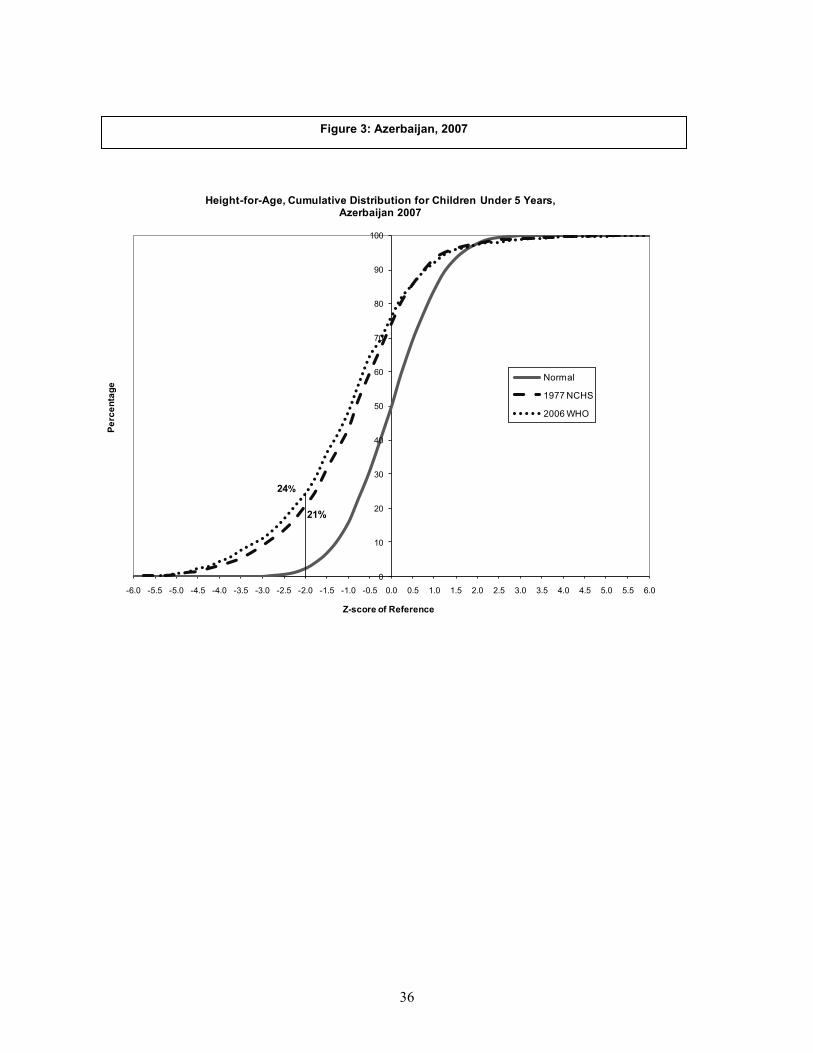
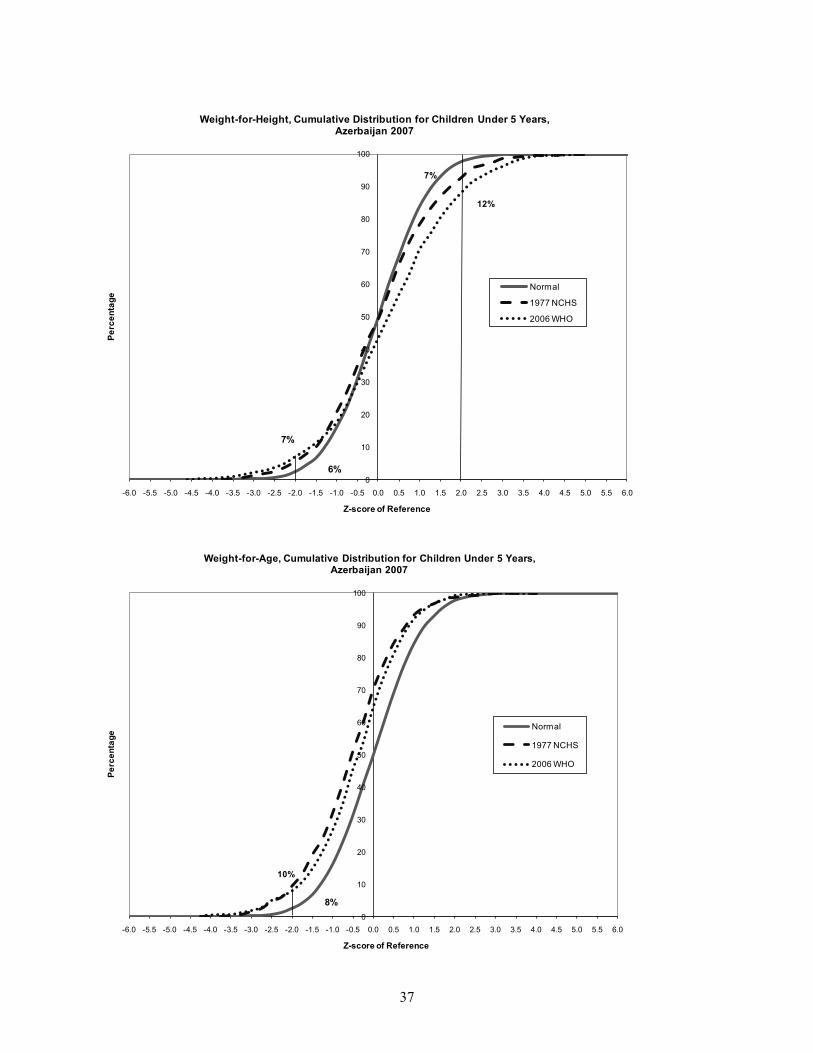
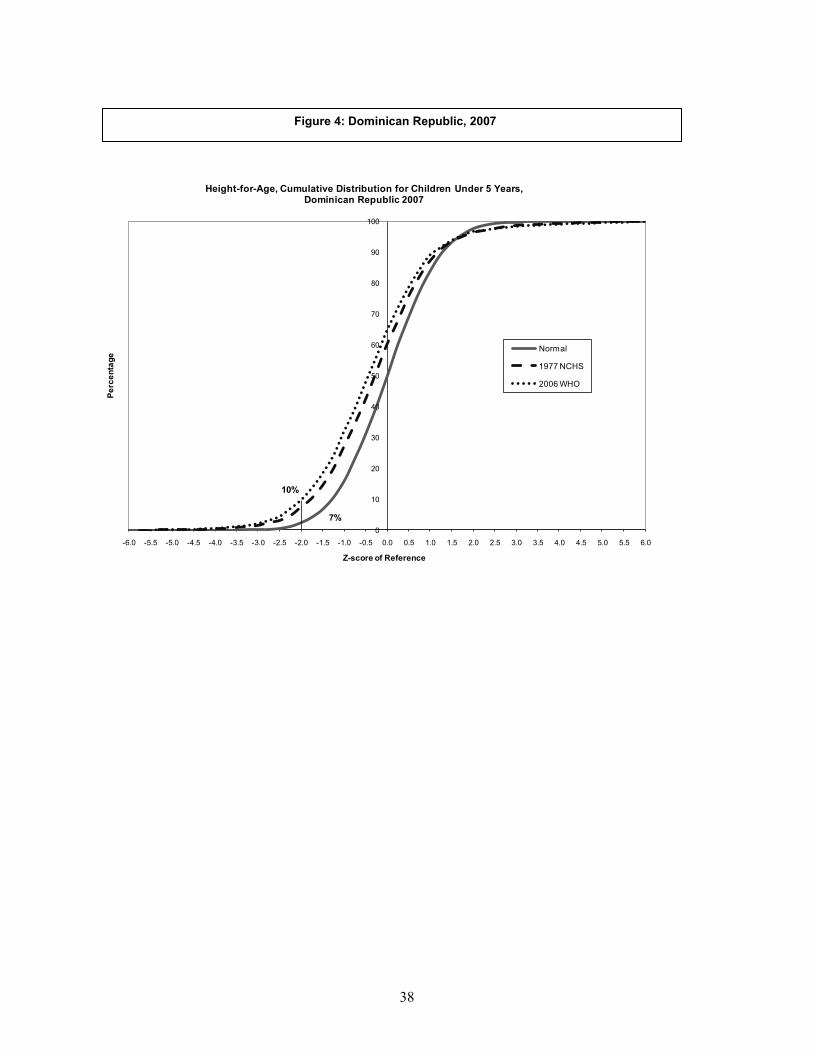
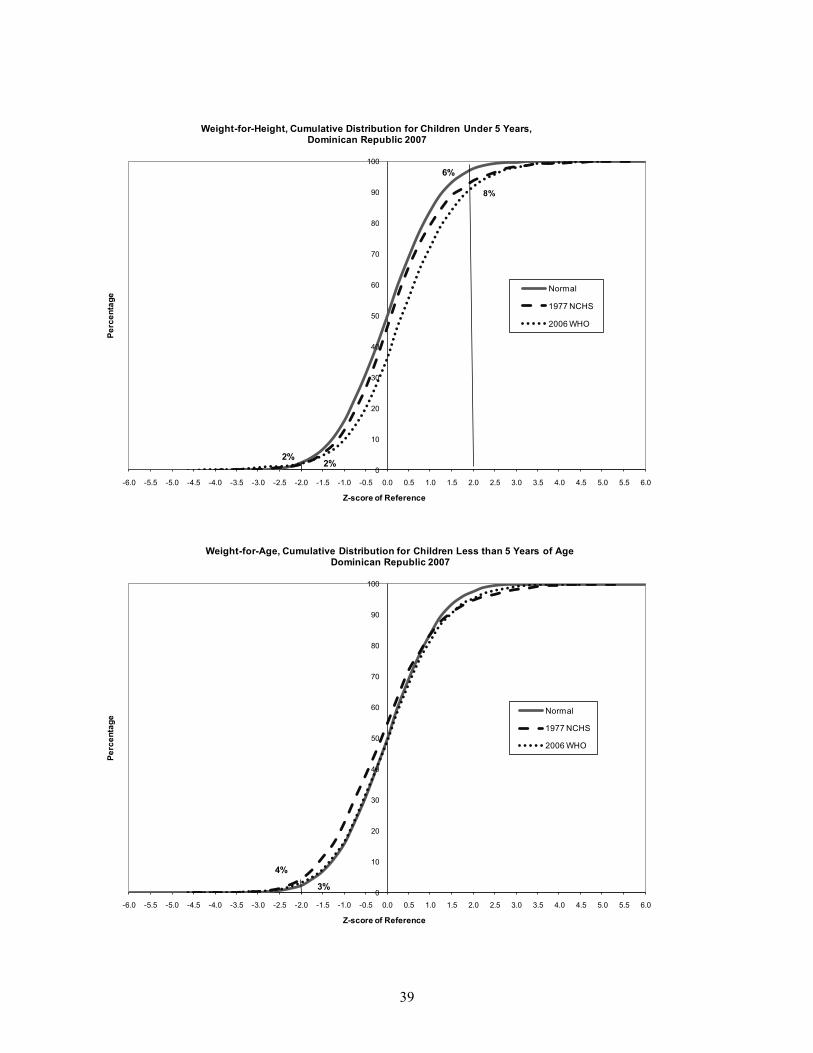
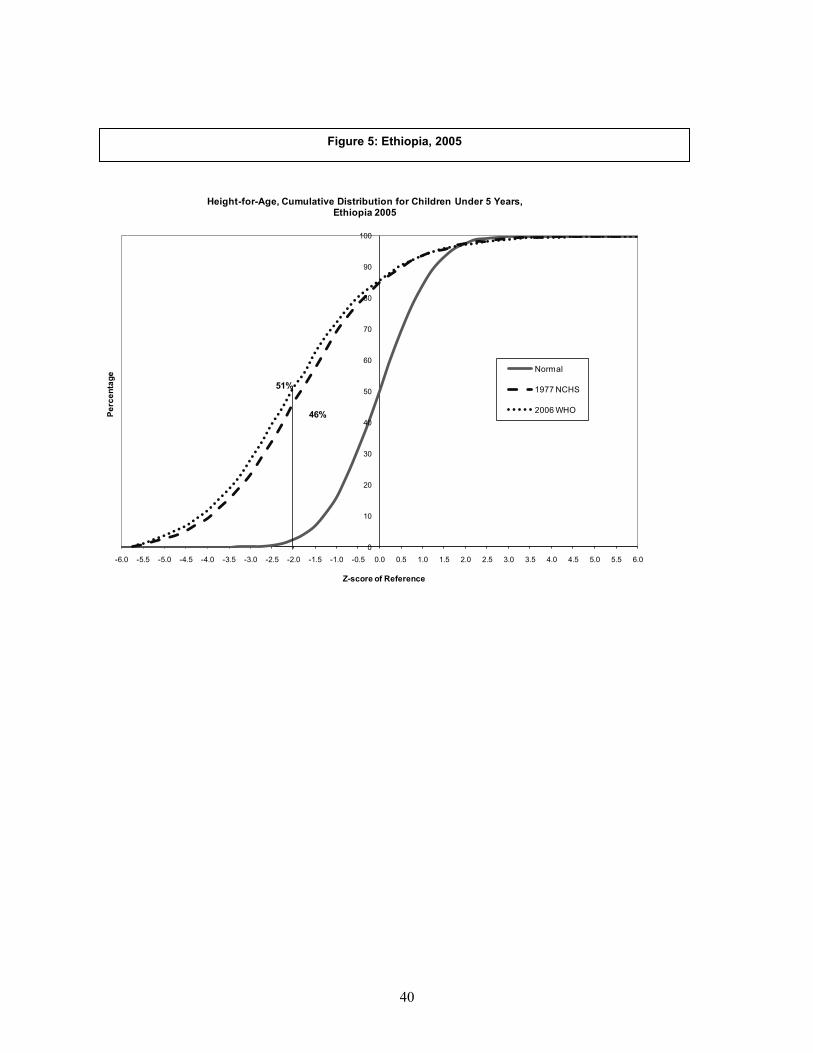
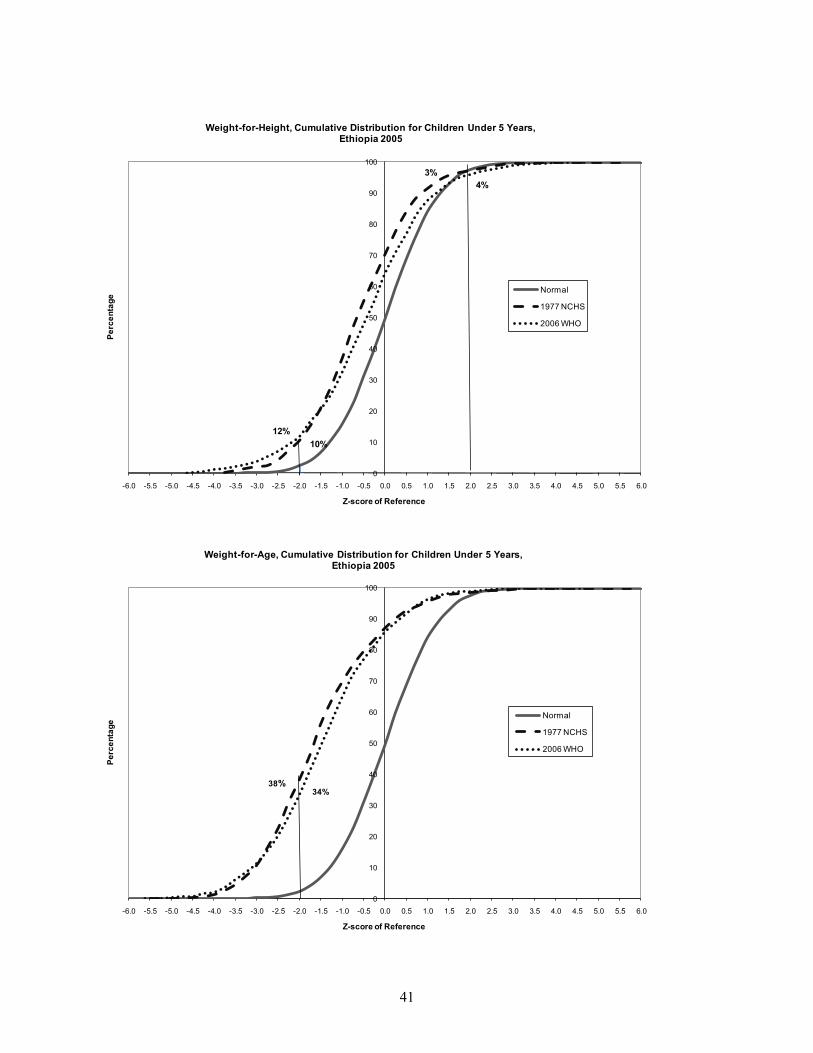
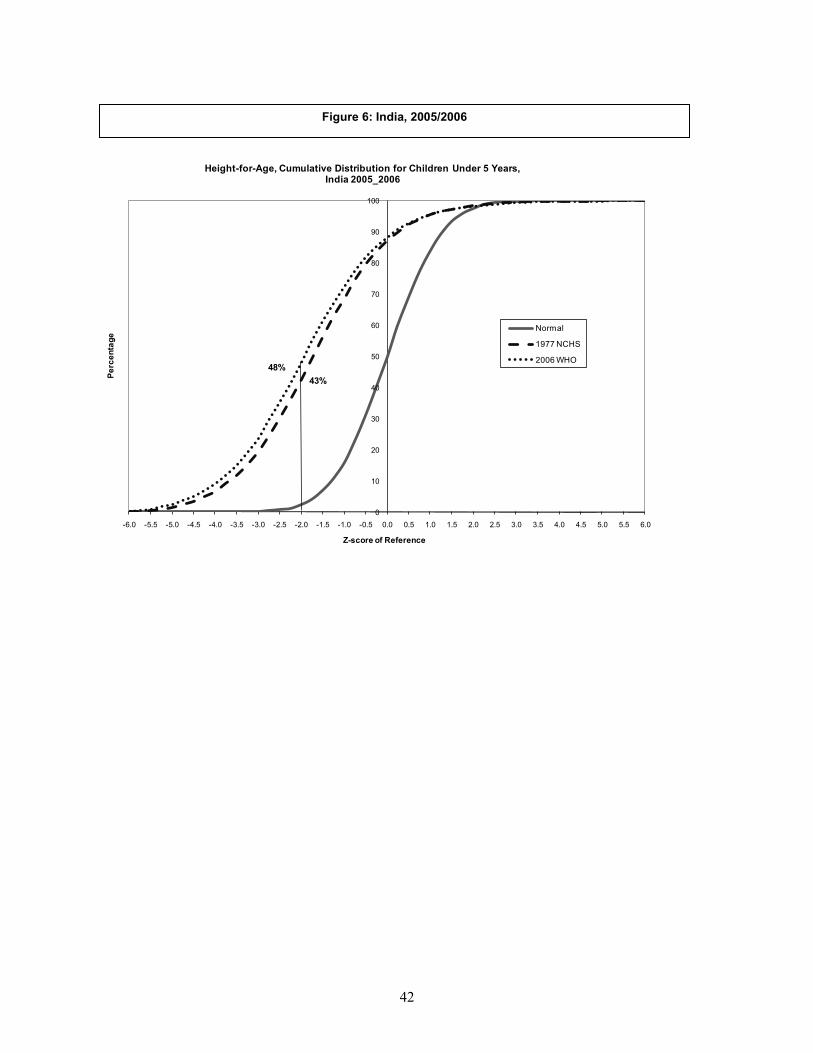
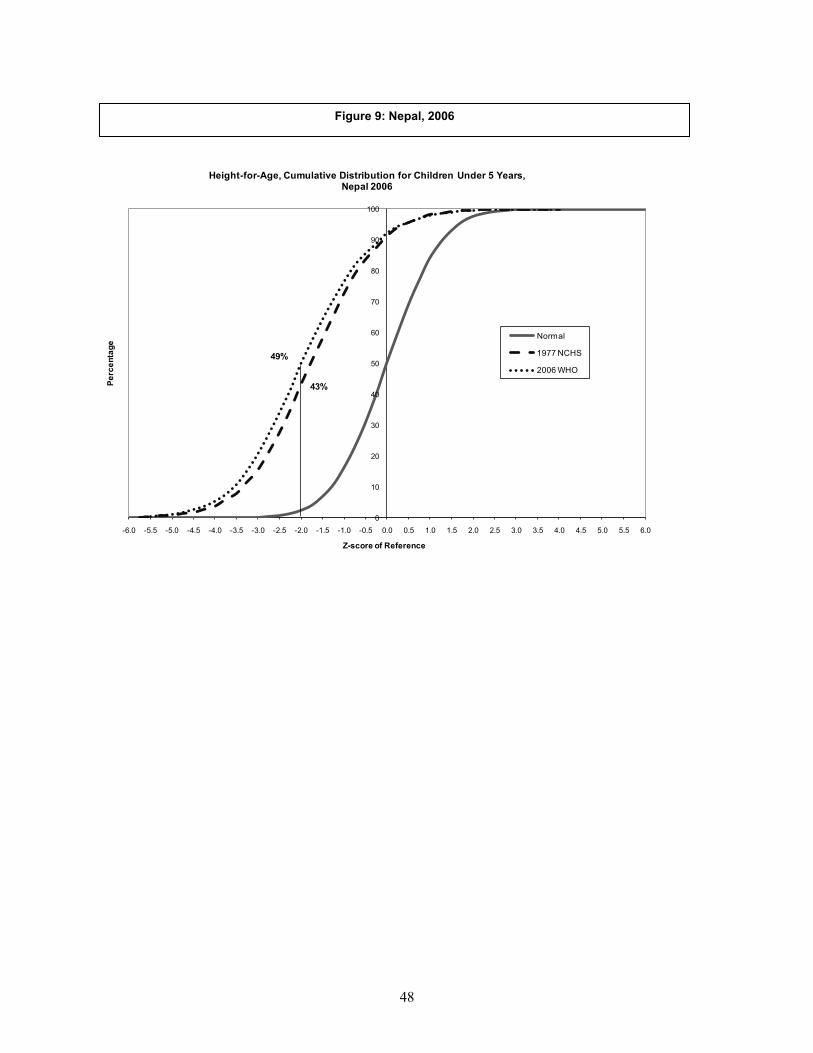
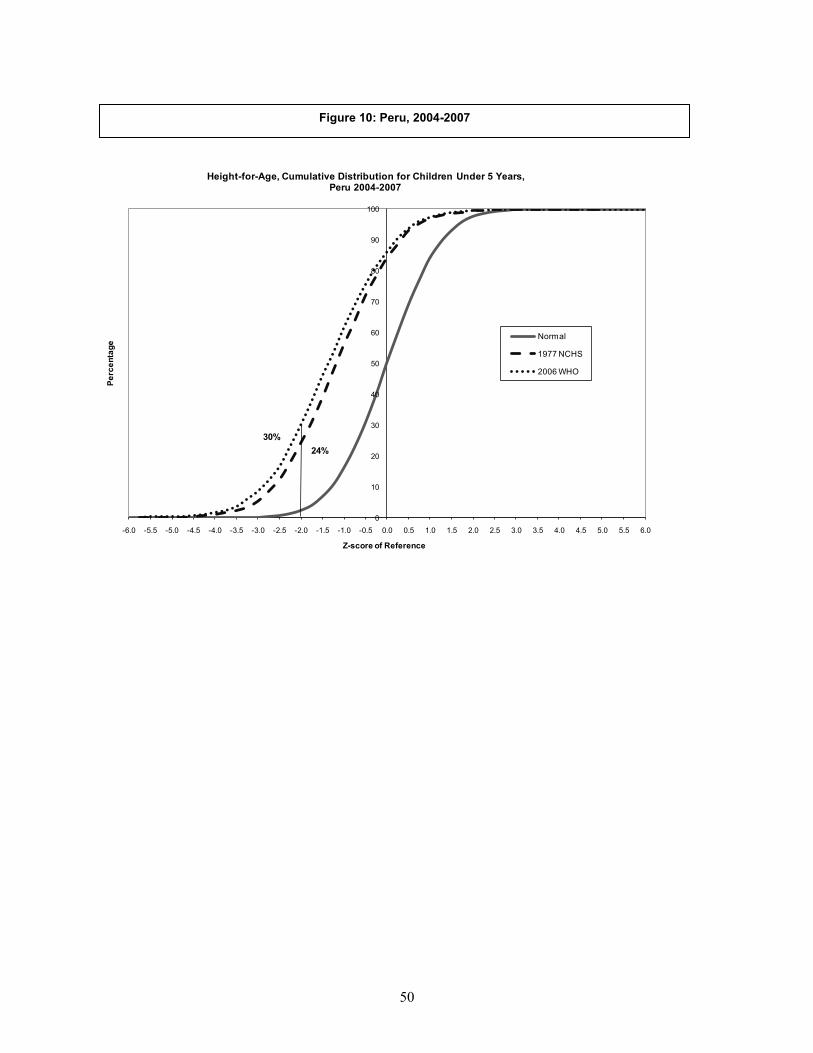
Graphical Comparison of the Standards by Country
Figures 3 through 12 compare the cumulative distributions of the z-scores of the three
anthropometric indices by the two standards with the cumulative normal distribution curve for
each of the 10 countries. If the children of a country are well nourished by one or the other
standard, then the curve for the z-scores of that standard should follow the curve for the normal
distribution.
36
0
10
20
30
40
50
60
70
80
90
100
-6.0 -5.5 -5.0 -4.5 -4.0 -3.5 -3.0 -2.5 -2.0 -1.5 -1.0 -0.5 0.0 0.5 1.0 1.5 2.0 2.5 3.0 3.5 4.0 4.5 5.0 5.5 6.0
Perc
enta
ge
Z-score of Reference
Height-for-Age, Cumulative Distribution for Children Under 5 Years,Azerbaijan 2007
Normal
1977 NCHS
2006 WHO
21%
24%
Figure 3: Azerbaijan, 2007
37
0
10
20
30
40
50
60
70
80
90
100
-6.0 -5.5 -5.0 -4.5 -4.0 -3.5 -3.0 -2.5 -2.0 -1.5 -1.0 -0.5 0.0 0.5 1.0 1.5 2.0 2.5 3.0 3.5 4.0 4.5 5.0 5.5 6.0
Perc
enta
ge
Z-score of Reference
Weight-for-Height, Cumulative Distribution for Children Under 5 Years,Azerbaijan 2007
Normal
1977 NCHS
2006 WHO
6%
7%
7%
12%
0
10
20
30
40
50
60
70
80
90
100
-6.0 -5.5 -5.0 -4.5 -4.0 -3.5 -3.0 -2.5 -2.0 -1.5 -1.0 -0.5 0.0 0.5 1.0 1.5 2.0 2.5 3.0 3.5 4.0 4.5 5.0 5.5 6.0
Perc
enta
ge
Z-score of Reference
Weight-for-Age, Cumulative Distribution for Children Under 5 Years,Azerbaijan 2007
Normal
1977 NCHS
2006 WHO
10%
8%
38
0
10
20
30
40
50
60
70
80
90
100
-6.0 -5.5 -5.0 -4.5 -4.0 -3.5 -3.0 -2.5 -2.0 -1.5 -1.0 -0.5 0.0 0.5 1.0 1.5 2.0 2.5 3.0 3.5 4.0 4.5 5.0 5.5 6.0
Perc
enta
ge
Z-score of Reference
Height-for-Age, Cumulative Distribution for Children Under 5 Years,Dominican Republic 2007
Normal
1977 NCHS
2006 WHO
7%
10%
Figure 4: Dominican Republic, 2007
39
0
10
20
30
40
50
60
70
80
90
100
-6.0 -5.5 -5.0 -4.5 -4.0 -3.5 -3.0 -2.5 -2.0 -1.5 -1.0 -0.5 0.0 0.5 1.0 1.5 2.0 2.5 3.0 3.5 4.0 4.5 5.0 5.5 6.0
Perc
enta
ge
Z-score of Reference
Weight-for-Height, Cumulative Distribution for Children Under 5 Years,Dominican Republic 2007
Normal
1977 NCHS
2006 WHO
2%2%
6%
8%
0
10
20
30
40
50
60
70
80
90
100
-6.0 -5.5 -5.0 -4.5 -4.0 -3.5 -3.0 -2.5 -2.0 -1.5 -1.0 -0.5 0.0 0.5 1.0 1.5 2.0 2.5 3.0 3.5 4.0 4.5 5.0 5.5 6.0
Perc
enta
ge
Z-score of Reference
Weight-for-Age, Cumulative Distribution for Children Less than 5 Years of AgeDominican Republic 2007
Normal
1977 NCHS
2006 WHO
4%
3%
40
0
10
20
30
40
50
60
70
80
90
100
-6.0 -5.5 -5.0 -4.5 -4.0 -3.5 -3.0 -2.5 -2.0 -1.5 -1.0 -0.5 0.0 0.5 1.0 1.5 2.0 2.5 3.0 3.5 4.0 4.5 5.0 5.5 6.0
Perc
enta
ge
Z-score of Reference
Height-for-Age, Cumulative Distribution for Children Under 5 Years,Ethiopia 2005
Normal
1977 NCHS
2006 WHO46%
51%
Figure 5: Ethiopia, 2005
41
0
10
20
30
40
50
60
70
80
90
100
-6.0 -5.5 -5.0 -4.5 -4.0 -3.5 -3.0 -2.5 -2.0 -1.5 -1.0 -0.5 0.0 0.5 1.0 1.5 2.0 2.5 3.0 3.5 4.0 4.5 5.0 5.5 6.0
Perc
enta
ge
Z-score of Reference
Weight-for-Height, Cumulative Distribution for Children Under 5 Years,Ethiopia 2005
Normal
1977 NCHS
2006 WHO
12%10%
3%4%
0
10
20
30
40
50
60
70
80
90
100
-6.0 -5.5 -5.0 -4.5 -4.0 -3.5 -3.0 -2.5 -2.0 -1.5 -1.0 -0.5 0.0 0.5 1.0 1.5 2.0 2.5 3.0 3.5 4.0 4.5 5.0 5.5 6.0
Perc
enta
ge
Z-score of Reference
Weight-for-Age, Cumulative Distribution for Children Under 5 Years,Ethiopia 2005
Normal
1977 NCHS
2006 WHO
38%34%
42
0
10
20
30
40
50
60
70
80
90
100
-6.0 -5.5 -5.0 -4.5 -4.0 -3.5 -3.0 -2.5 -2.0 -1.5 -1.0 -0.5 0.0 0.5 1.0 1.5 2.0 2.5 3.0 3.5 4.0 4.5 5.0 5.5 6.0
Perc
enta
ge
Z-score of Reference
Height-for-Age, Cumulative Distribution for Children Under 5 Years,India 2005_2006
Normal
1977 NCHS
2006 WHO
43%48%
Figure 6: India, 2005/2006

43
0
10
20
30
40
50
60
70
80
90
100
-6.0 -5.5 -5.0 -4.5 -4.0 -3.5 -3.0 -2.5 -2.0 -1.5 -1.0 -0.5 0.0 0.5 1.0 1.5 2.0 2.5 3.0 3.5 4.0 4.5 5.0 5.5 6.0
Perc
enta
ge
Z-score of Reference
Weight-for-Height, Cumulative Distribution for Children Under 5 Years,India 2005_2006
Normal
1977 NCHS
2006 WHO
20%
17%
1%
1%
0
10
20
30
40
50
60
70
80
90
100
-6.0 -5.5 -5.0 -4.5 -4.0 -3.5 -3.0 -2.5 -2.0 -1.5 -1.0 -0.5 0.0 0.5 1.0 1.5 2.0 2.5 3.0 3.5 4.0 4.5 5.0 5.5 6.0
Perc
enta
ge
Z-score of Reference
Weight-for-Age, Cumulative Distribution for Children Under 5 Years,India 2005_2006
Normal
1977 NCHS
2006 WHO
48%
43%
44
0
10
20
30
40
50
60
70
80
90
100
-6.0 -5.5 -5.0 -4.5 -4.0 -3.5 -3.0 -2.5 -2.0 -1.5 -1.0 -0.5 0.0 0.5 1.0 1.5 2.0 2.5 3.0 3.5 4.0 4.5 5.0 5.5 6.0
Perc
enta
ge
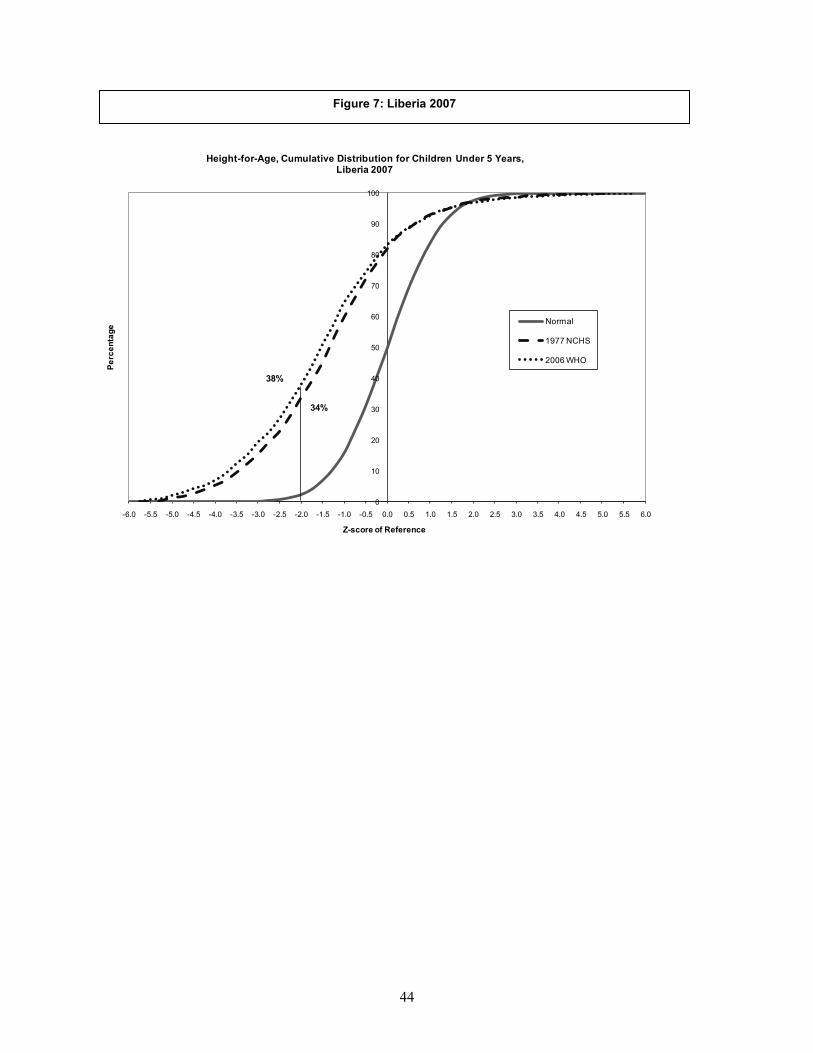
Z-score of Reference
Height-for-Age, Cumulative Distribution for Children Under 5 Years,Liberia 2007
Normal
1977 NCHS
2006 WHO
34%
38%
Figure 7: Liberia 2007
45
0
10
20
30
40
50
60
70
80
90
100
-6.0 -5.5 -5.0 -4.5 -4.0 -3.5 -3.0 -2.5 -2.0 -1.5 -1.0 -0.5 0.0 0.5 1.0 1.5 2.0 2.5 3.0 3.5 4.0 4.5 5.0 5.5 6.0
Perc
enta
ge
Z-score of Reference
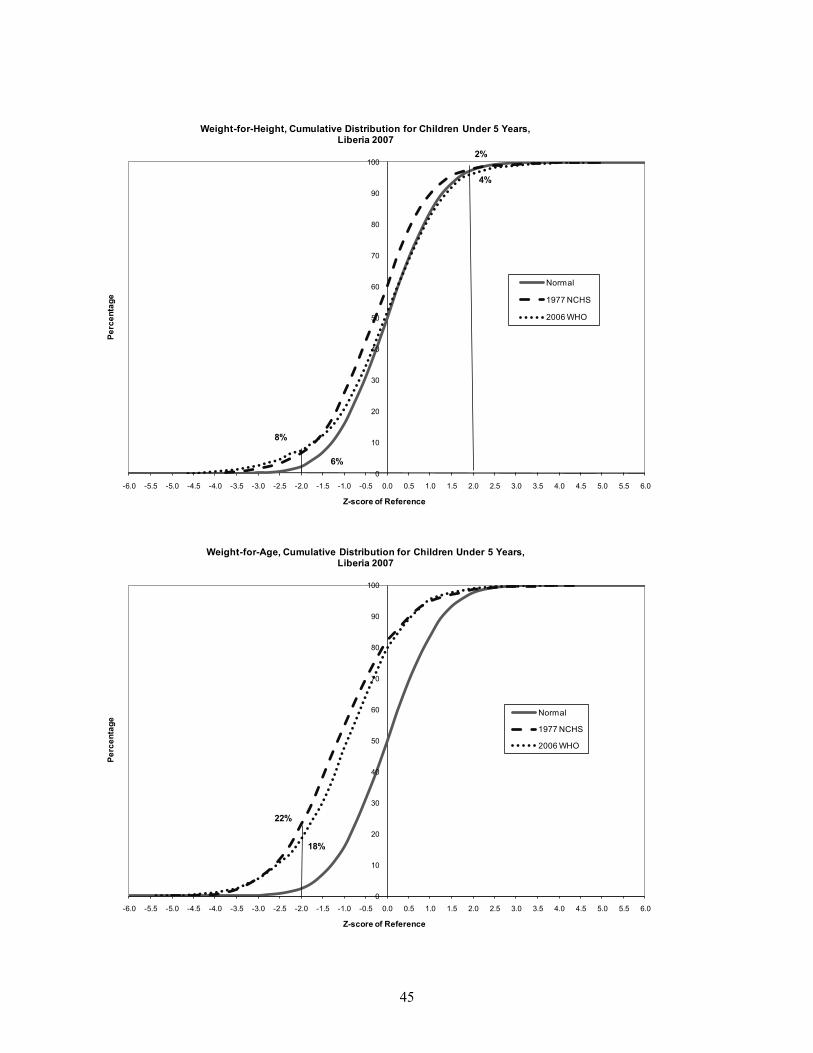
Weight-for-Height, Cumulative Distribution for Children Under 5 Years,Liberia 2007
Normal
1977 NCHS
2006 WHO
8%
6%
2%
4%
0
10
20
30
40
50
60
70
80
90
100
-6.0 -5.5 -5.0 -4.5 -4.0 -3.5 -3.0 -2.5 -2.0 -1.5 -1.0 -0.5 0.0 0.5 1.0 1.5 2.0 2.5 3.0 3.5 4.0 4.5 5.0 5.5 6.0
Perc
enta
ge
Z-score of Reference
Weight-for-Age, Cumulative Distribution for Children Under 5 Years,Liberia 2007
Normal
1977 NCHS
2006 WHO
22%
18%

46
0
10
20
30
40
50
60
70
80
90
100
-6.0 -5.5 -5.0 -4.5 -4.0 -3.5 -3.0 -2.5 -2.0 -1.5 -1.0 -0.5 0.0 0.5 1.0 1.5 2.0 2.5 3.0 3.5 4.0 4.5 5.0 5.5 6.0
Perc
enta
ge
Z-score of Reference
Height-for-Age, Cumulative Distribution for Children Under 5 Years,Mali 2006
Normal
1977 NCHS
2006 WHO
34%
38%
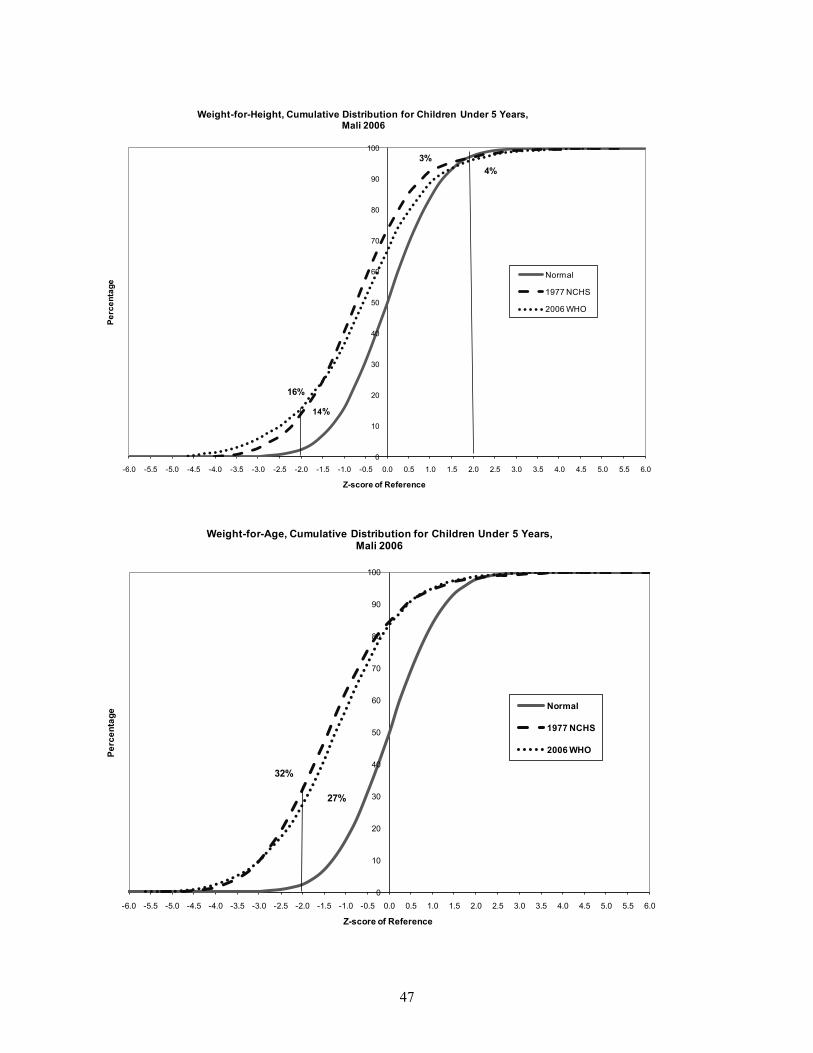
Figure 8: Mali, 2006
47
0
10
20
30
40
50
60
70
80
90
100
-6.0 -5.5 -5.0 -4.5 -4.0 -3.5 -3.0 -2.5 -2.0 -1.5 -1.0 -0.5 0.0 0.5 1.0 1.5 2.0 2.5 3.0 3.5 4.0 4.5 5.0 5.5 6.0
Perc
enta
ge
Z-score of Reference
Weight-for-Height, Cumulative Distribution for Children Under 5 Years,Mali 2006
Normal
1977 NCHS
2006 WHO
16%
14%
3%4%
0
10
20
30
40
50
60
70
80
90
100
-6.0 -5.5 -5.0 -4.5 -4.0 -3.5 -3.0 -2.5 -2.0 -1.5 -1.0 -0.5 0.0 0.5 1.0 1.5 2.0 2.5 3.0 3.5 4.0 4.5 5.0 5.5 6.0
Perc
enta
ge
Z-score of Reference
Weight-for-Age, Cumulative Distribution for Children Under 5 Years,Mali 2006
Normal
1977 NCHS
2006 WHO
32%
27%
48
0
10
20
30
40
50
60
70
80
90
100
-6.0 -5.5 -5.0 -4.5 -4.0 -3.5 -3.0 -2.5 -2.0 -1.5 -1.0 -0.5 0.0 0.5 1.0 1.5 2.0 2.5 3.0 3.5 4.0 4.5 5.0 5.5 6.0
Perc
enta
ge
Z-score of Reference
Height-for-Age, Cumulative Distribution for Children Under 5 Years,Nepal 2006
Normal
1977 NCHS
2006 WHO
43%
49%
Figure 9: Nepal, 2006
49
0
10
20
30
40
50
60
70
80
90
100
-6.0 -5.5 -5.0 -4.5 -4.0 -3.5 -3.0 -2.5 -2.0 -1.5 -1.0 -0.5 0.0 0.5 1.0 1.5 2.0 2.5 3.0 3.5 4.0 4.5 5.0 5.5 6.0
Perc
enta
ge
Z-score of Reference
Weight-for-Height, Cumulative Distribution for Children Under 5 Years,Nepal 2006
Normal
1977 NCHS
2006 WHO
13% 12%
1%
1%
0
10
20
30
40
50
60
70
80
90
100
-6.0 -5.5 -5.0 -4.5 -4.0 -3.5 -3.0 -2.5 -2.0 -1.5 -1.0 -0.5 0.0 0.5 1.0 1.5 2.0 2.5 3.0 3.5 4.0 4.5 5.0 5.5 6.0
Perc
enta
ge
Z-score of Reference
Weight-for-Age, Cumulative Distribution for Children Under 5 Years,Nepal 2006
Normal
1977 NCHS
2006 WHO45%
39%
50
0
10
20
30
40
50
60
70
80
90
100
-6.0 -5.5 -5.0 -4.5 -4.0 -3.5 -3.0 -2.5 -2.0 -1.5 -1.0 -0.5 0.0 0.5 1.0 1.5 2.0 2.5 3.0 3.5 4.0 4.5 5.0 5.5 6.0
Perc
enta
ge
Z-score of Reference
Height-for-Age, Cumulative Distribution for Children Under 5 Years,Peru 2004-2007
Normal
1977 NCHS
2006 WHO
24%30%
Figure 10: Peru, 2004-2007
51
0
10
20
30
40
50
60
70
80
90
100
-6.0 -5.5 -5.0 -4.5 -4.0 -3.5 -3.0 -2.5 -2.0 -1.5 -1.0 -0.5 0.0 0.5 1.0 1.5 2.0 2.5 3.0 3.5 4.0 4.5 5.0 5.5 6.0
Perc
enta
ge
Z-score of Reference
Weight-for-Height, Cumulative Distribution for Children Under 5 Years,Peru 2004-2007
Normal
1977 NCHS
2006 WHO
1%1%
6%
9%
0
10
20
30
40
50
60
70
80
90
100
-6.0 -5.5 -5.0 -4.5 -4.0 -3.5 -3.0 -2.5 -2.0 -1.5 -1.0 -0.5 0.0 0.5 1.0 1.5 2.0 2.5 3.0 3.5 4.0 4.5 5.0 5.5 6.0
Perc
enta
ge
Z-score of Reference
Weight-for-Age, Cumulative Distribution for Children Under 5 Years,Peru 2004-2007
Normal
1977 NCHS
2006 WHO
8%5%
52
0
10
20
30
40
50
60
70
80
90
100
-6.0 -5.5 -5.0 -4.5 -4.0 -3.5 -3.0 -2.5 -2.0 -1.5 -1.0 -0.5 0.0 0.5 1.0 1.5 2.0 2.5 3.0 3.5 4.0 4.5 5.0 5.5 6.0
Perc
enta
ge
Z-score of Reference
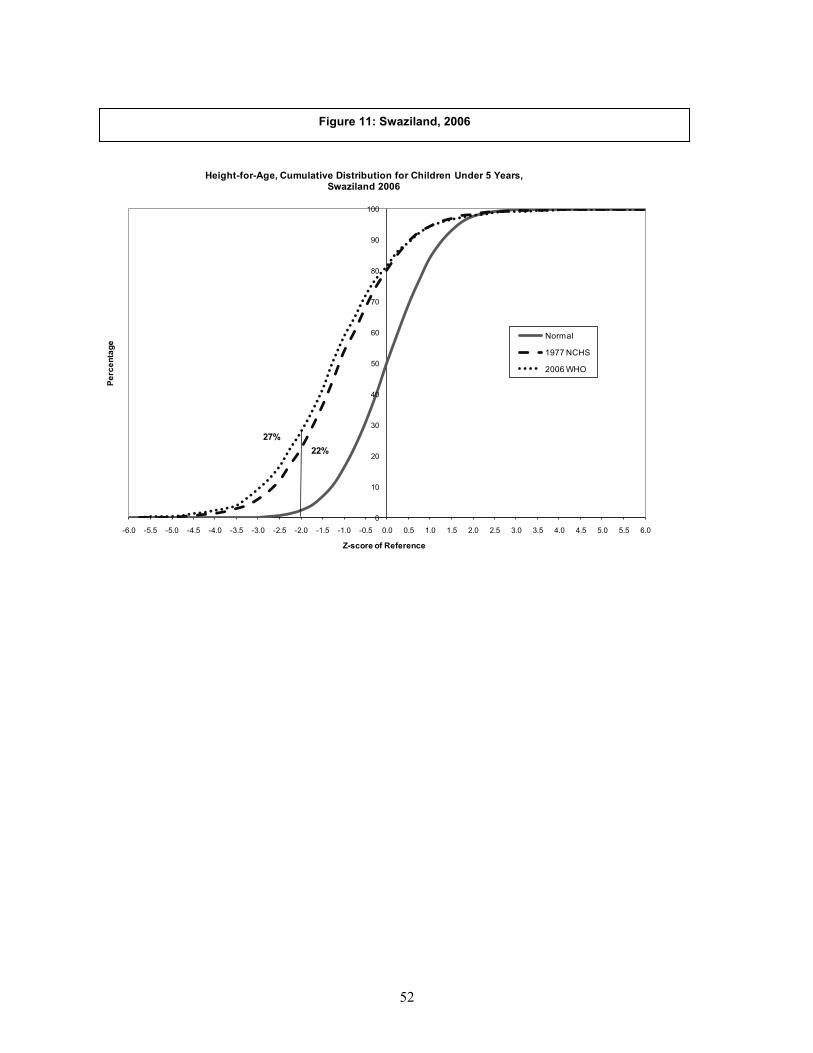
Height-for-Age, Cumulative Distribution for Children Under 5 Years,Swaziland 2006
Normal
1977 NCHS
2006 WHO
22%27%
Figure 11: Swaziland, 2006

53
0
10
20
30
40
50
60
70
80
90
100
-6.0 -5.5 -5.0 -4.5 -4.0 -3.5 -3.0 -2.5 -2.0 -1.5 -1.0 -0.5 0.0 0.5 1.0 1.5 2.0 2.5 3.0 3.5 4.0 4.5 5.0 5.5 6.0
Perc
enta
ge
Z-score of Reference
Weight-for-Height, Cumulative Distribution for Children Under 5 Years,Swaziland 2006
Normal
1977 NCHS
2006 WHO
3%2%
8%
10%
0
10
20
30
40
50
60
70
80
90
100
-6.0 -5.5 -5.0 -4.5 -4.0 -3.5 -3.0 -2.5 -2.0 -1.5 -1.0 -0.5 0.0 0.5 1.0 1.5 2.0 2.5 3.0 3.5 4.0 4.5 5.0 5.5 6.0
Perc
enta
ge
Z-score of Reference
Weight-for-Age, Cumulative Distribution for Children Under 5 Years,Swaziland 2006
Normal
1977 NCHS
2006 WHO
7%5%

54
0
10
20
30
40
50
60
70
80
90
100
-6.0 -5.5 -5.0 -4.5 -4.0 -3.5 -3.0 -2.5 -2.0 -1.5 -1.0 -0.5 0.0 0.5 1.0 1.5 2.0 2.5 3.0 3.5 4.0 4.5 5.0 5.5 6.0
Perc
enta
ge
Z-score of Reference
Height-for-Age, Cumulative Distribution for Children Under 5 Years,Uganda 2006
Normal
1977 NCHS
2006 WHO
32%
37%
Figure 12: Uganda, 2006
55
0
10
20
30
40
50
60
70
80
90
100
-6.0 -5.5 -5.0 -4.5 -4.0 -3.5 -3.0 -2.5 -2.0 -1.5 -1.0 -0.5 0.0 0.5 1.0 1.5 2.0 2.5 3.0 3.5 4.0 4.5 5.0 5.5 6.0
Perc
enta
ge
Z-score of Reference
Weight-for-Height, Cumulative Distribution for Children Under 5 Years,Uganda 2006
Normal
1977 NCHS
2006 WHO
7%6%
3%4%
0
10
20
30
40
50
60
70
80
90
100
-6.0 -5.5 -5.0 -4.5 -4.0 -3.5 -3.0 -2.5 -2.0 -1.5 -1.0 -0.5 0.0 0.5 1.0 1.5 2.0 2.5 3.0 3.5 4.0 4.5 5.0 5.5 6.0
Perc
enta
ge
Z-score of Reference
Weight-for-Age, Cumulative Distribution for Children Under 5 Years,Uganda 2006
Normal
1977 NCHS
2006 WHO
20%
16%
56
The curves for height-for-age z-scores using the 1977 NCHS Reference and the 2006
WHO Standards appear very close to each other, failing to depict a clear difference in the
stunting by two standards. However, they relatively clearly depict the problem of stunting in
Ethiopia, India, Liberia, Mali, Nepal, Peru, Swaziland and Uganda, where the curves of both the
1977 NCHS Reference and the 2006 WHO Standards are far to the left of the cumulative normal
distribution curves.
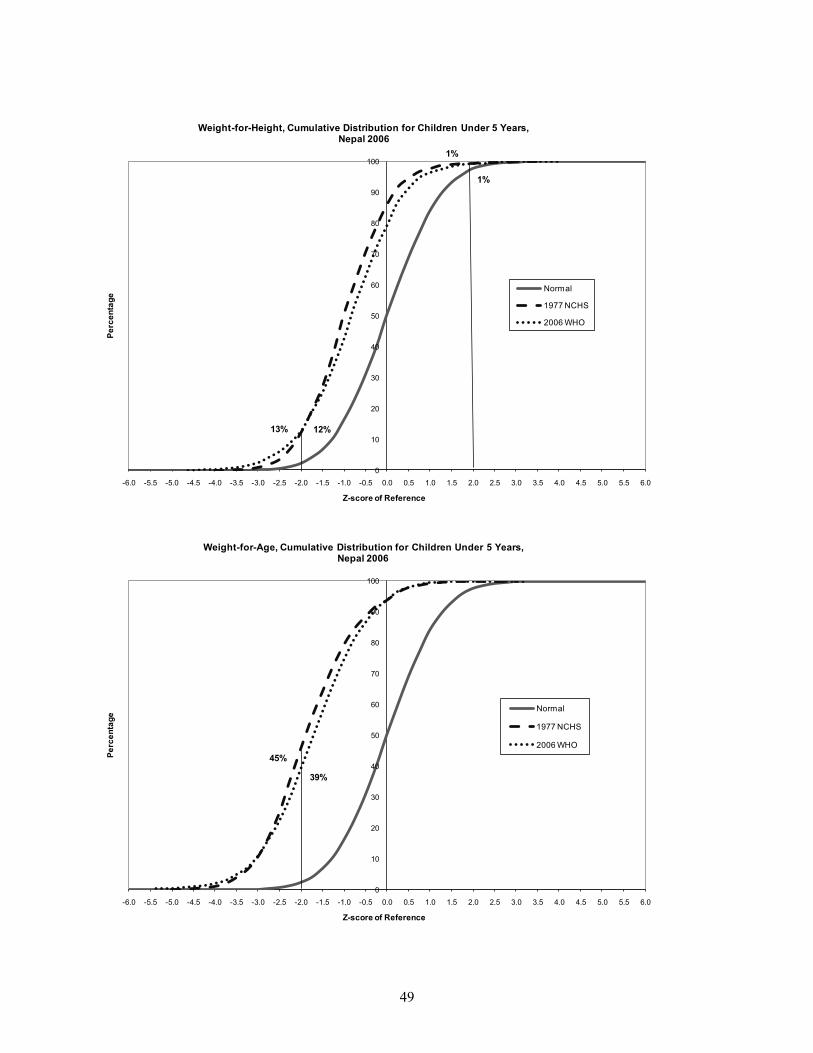
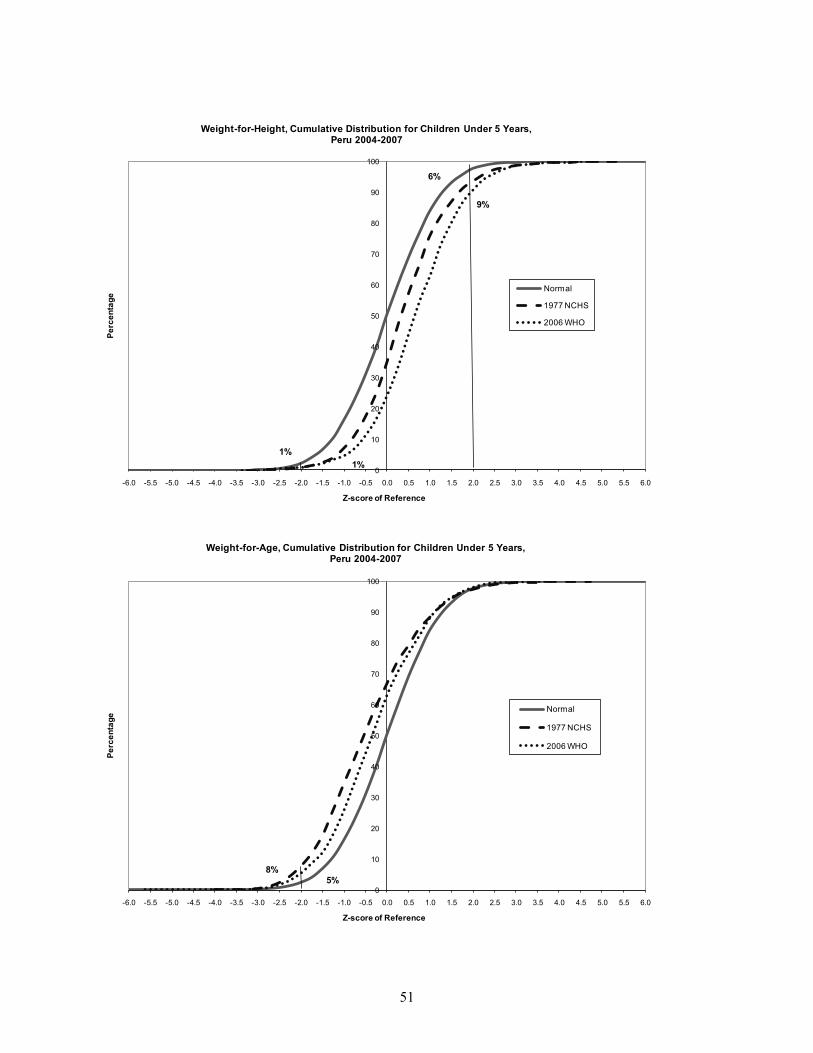
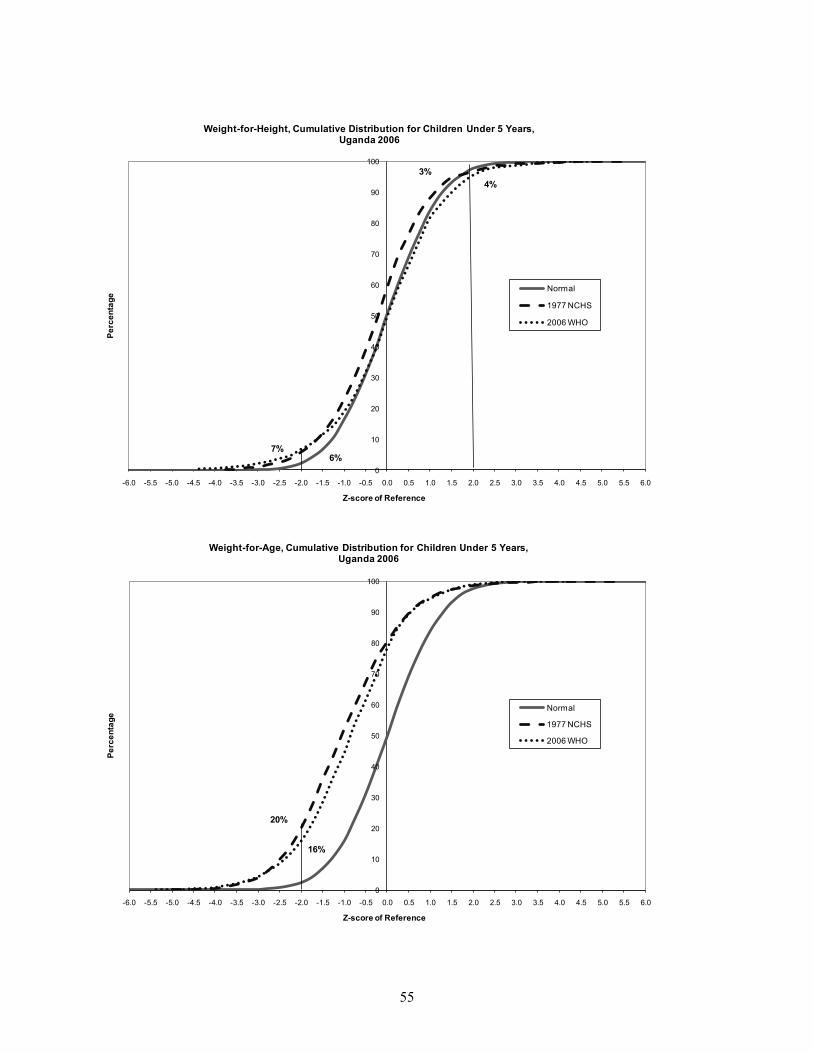
The shifting of the WHZ curves to the right of the normal distribution curve in the
Dominican Republic, Peru, and Swaziland clearly show populations with overweight children by
both of the two standards. Furthermore, using the 2006 WHO Standards, more children in these
countries are categorized as overweight compared with the 1977 NCHS Reference (Figures 4b,
10b and 11b). In Liberia, although the weight-for-height curve of the 2006 WHO Standards is
closer to the normal distribution (Figure 7b), slightly more children are wasted based on this
standard than on the 1977 NCHS Reference (Table 1).
The difference between the two standards in the distribution of children for wasting is
highest in Uganda (Figure 11b). The curve for the 1977 NCHS Reference is to the left of the
normal curve by a large amount, indicating substantial wasting. The curve for the 2006 WHO
Standards, however, is much less to the left of the normal curve, indicating much less wasting.
Similar differences are observed for underweight status.
In most of the countries studied, the curves for underweight based on the 2006 WHO
Standards fall closer to that of a normally distributed population, suggesting either that using the
1977 NCHS Reference overestimates the prevalence of underweight or that using the 2006 WHO
Standards underestimate it.
57
Multivariate Analysis of Differences between the Standards
To ascertain which background characteristics are most associated with differences in nutritional
status by type of standard used, we conducted a multivariate analysis of variance (ANOVA) with
multiple classification analysis (MCA5 analysis). Multiple classification analysis is
mathematically equivalent to dummy variable multiple regression analysis except that MCA uses
deviations from the overall mean instead of deviations from a reference category. This analysis
explores the relationship between the mean difference in the z-scores as the dependent variable
and each background characteristic (predictor variable), while controlling for the effects of the
other background characteristics.
The background characteristics included in this analysis are child’s age, place of
residence (rural or urban), mother’s education, child’s sex, birth order, whether the child had had
diarrhea in the two weeks preceding the survey, household wealth quintile, and method of
measuring height/length. The analysis was done on the pooled data set from the 10 DHS
surveys. Since our interest is in ascertaining the relationships between the dependent and the
predictor variables, the analysis is performed without using sample weights. Country-specific
effects are taken into account by including a dummy variable for each country in the set of
predictor variables.
5 The advantage of Multiple Classification Analysis (MCA) over linear regression is that it accepts predictor variables measured on nominal, ordinal, and interval scales, and it does not assume linearity as linear regression does. Like linear regression, multiple classification analysis assumes that the effects of the predictors are additive i.e. that there are no interactions between predictors, unless especially included as interaction variables. It is designed for use with predictor variables.
58
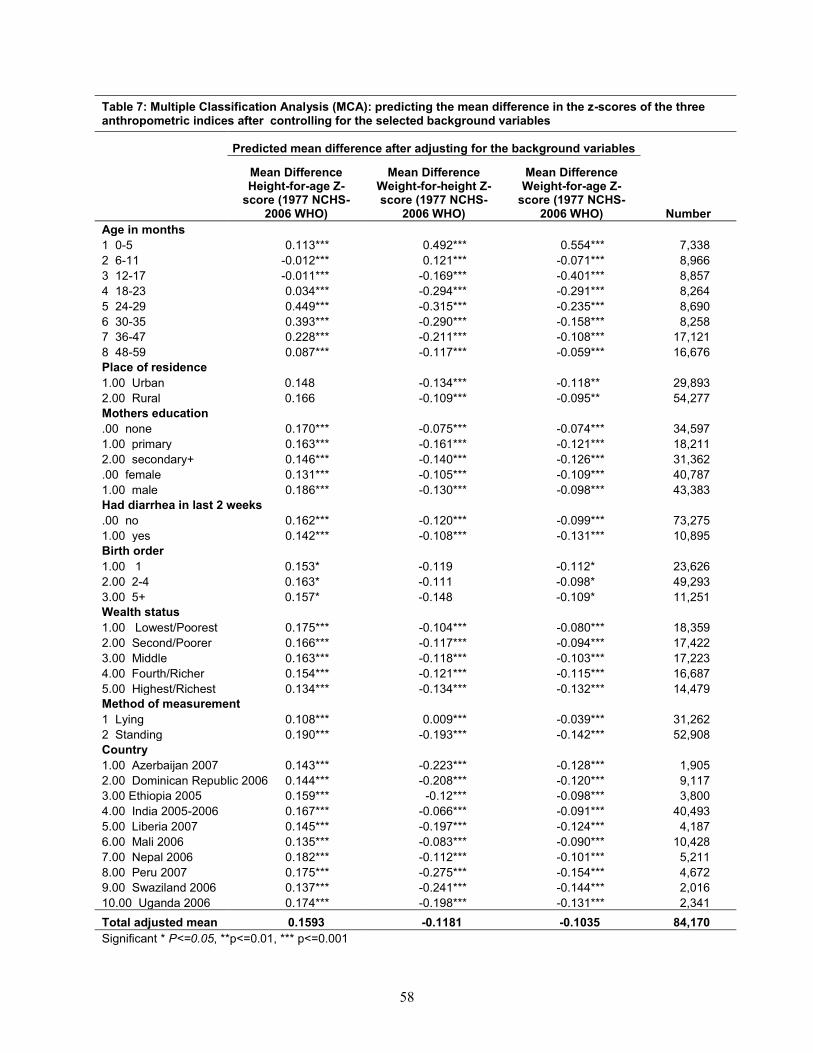
Table 7: Multiple Classification Analysis (MCA): predicting the mean difference in the z-scores of the three anthropometric indices after controlling for the selected background variables
Predicted mean difference after adjusting for the background variables
Mean DifferenceHeight-for-age Z-
score (1977 NCHS-2006 WHO)
Mean Difference Weight-for-height Z-score (1977 NCHS-
2006 WHO)
Mean Difference Weight-for-age Z-
score (1977 NCHS-2006 WHO) Number
Age in months1 0-5 0.113*** 0.492*** 0.554*** 7,3382 6-11 -0.012*** 0.121*** -0.071*** 8,9663 12-17 -0.011*** -0.169*** -0.401*** 8,8574 18-23 0.034*** -0.294*** -0.291*** 8,2645 24-29 0.449*** -0.315*** -0.235*** 8,6906 30-35 0.393*** -0.290*** -0.158*** 8,2587 36-47 0.228*** -0.211*** -0.108*** 17,1218 48-59 0.087*** -0.117*** -0.059*** 16,676Place of residence1.00 Urban 0.148 -0.134*** -0.118** 29,8932.00 Rural 0.166 -0.109*** -0.095** 54,277Mothers education.00 none 0.170*** -0.075*** -0.074*** 34,5971.00 primary 0.163*** -0.161*** -0.121*** 18,2112.00 secondary+ 0.146*** -0.140*** -0.126*** 31,362.00 female 0.131*** -0.105*** -0.109*** 40,7871.00 male 0.186*** -0.130*** -0.098*** 43,383Had diarrhea in last 2 weeks.00 no 0.162*** -0.120*** -0.099*** 73,2751.00 yes 0.142*** -0.108*** -0.131*** 10,895Birth order1.00 1 0.153* -0.119 -0.112* 23,6262.00 2-4 0.163* -0.111 -0.098* 49,2933.00 5+ 0.157* -0.148 -0.109* 11,251Wealth status1.00 Lowest/Poorest 0.175*** -0.104*** -0.080*** 18,3592.00 Second/Poorer 0.166*** -0.117*** -0.094*** 17,4223.00 Middle 0.163*** -0.118*** -0.103*** 17,2234.00 Fourth/Richer 0.154*** -0.121*** -0.115*** 16,6875.00 Highest/Richest 0.134*** -0.134*** -0.132*** 14,479Method of measurement1 Lying 0.108*** 0.009*** -0.039*** 31,2622 Standing 0.190*** -0.193*** -0.142*** 52,908Country1.00 Azerbaijan 2007 0.143*** -0.223*** -0.128*** 1,9052.00 Dominican Republic 2006 0.144*** -0.208*** -0.120*** 9,1173.00 Ethiopia 2005 0.159*** -0.12*** -0.098*** 3,8004.00 India 2005-2006 0.167*** -0.066*** -0.091*** 40,4935.00 Liberia 2007 0.145*** -0.197*** -0.124*** 4,1876.00 Mali 2006 0.135*** -0.083*** -0.090*** 10,4287.00 Nepal 2006 0.182*** -0.112*** -0.101*** 5,2118.00 Peru 2007 0.175*** -0.275*** -0.154*** 4,6729.00 Swaziland 2006 0.137*** -0.241*** -0.144*** 2,01610.00 Uganda 2006 0.174*** -0.198*** -0.131*** 2,341Total adjusted mean 0.1593 -0.1181 -0.1035 84,170Significant * P<=0.05, **p<=0.01, *** p<=0.001
59
Table 7 shows the results of the multiple classification analysis (MCA) as the predicted
mean difference in z-score by standard for each category of the background variables. The
predicted means are obtained by adding the adjusted deviations from the grand mean to the value
of the grand mean. The pattern of predicted mean difference in z-score by age group is shown
graphically in Figure 13.
There are strikingly different patterns between height-for-age on the one hand and
weight-for-age and weight-for-height on the other. For children under age 6 months, there is a
small positive difference for the height-for-age z-score, indicating that the 1977 NCHS
Reference has a higher value than the 2006 WHO Standards. The difference just about
disappears for age 6-23 months but becomes a very large positive value for age 24-47 months.
Further, the patterns for weight-for-age and weight-for-height are similar. There are very large
positive differences for children under age 6 months, small differences for children age 6-11
months, and large and negative differences for children age 12-29 months for weight-for-age and
age 12-47 months for weight-for-height.
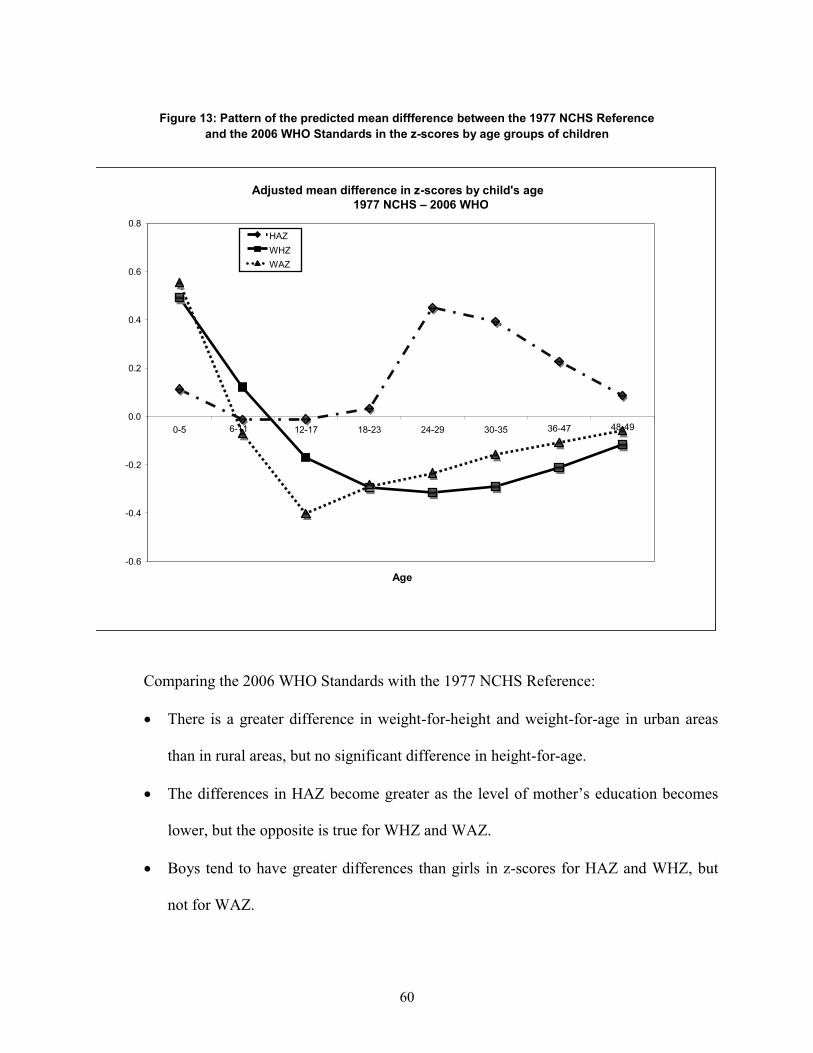
60
Figure 13: Pattern of the predicted mean diffference between the 1977 NCHS Reference and the 2006 WHO Standards in the z-scores by age groups of children
Adjusted mean difference in z-scores by child's age
-0.6
-0.4
-0.2
0.0
0.2
0.4
0.6
0.8
0-5 6-11 12-17 18-23 24-29 30-35 36-47 48-49
Age
HAZ WHZ WAZ
1977 NCHS – 2006 WHO
Comparing the 2006 WHO Standards with the 1977 NCHS Reference:
� There is a greater difference in weight-for-height and weight-for-age in urban areas
than in rural areas, but no significant difference in height-for-age.
� The differences in HAZ become greater as the level of mother’s education becomes
lower, but the opposite is true for WHZ and WAZ.
� Boys tend to have greater differences than girls in z-scores for HAZ and WHZ, but
not for WAZ.
61
� Having a recent bout of diarrhea is likely to lower a child’s weight and should not
impact HAZ or WAZ much. However, a large negative difference appears for
children who had diarrhea in the two weeks prior to the survey compared with
children who did not, indicating that the 1977 NCHS Reference z-scores may be more
affected by recent diarrhea than the 2006 WHO Standards.
� Even though statistically significant, the differences by birth order are small for HAZ
and WHZ.
� The difference in z-scores decreases monotonically with increasing household wealth
for height-for-age, but they increase monotonically with increasing wealth for weight-
for-age and weight-for-height.
� The difference is large if the child was measured standing up rather than lying down,
even after controlling for age.
As for the other background variables, the results for height-for-age are in the opposite
direction of those for weight-for-age and weight-for-height. After adjusting for all the
background characteristics, the three countries with the greatest differences between the HAZ for
each standard are Nepal, Peru, and Uganda. For WHZ, the three countries with the greatest
differences are Peru, Swaziland, and Azerbaijan, and for WAZ, the top three differences are
found in Peru, Swaziland, and Uganda.
The analysis of variance portion of the multivariate analysis indicates that all of the
background characteristics have significant effects on the difference in z-score between the two
standards, except for urban/rural residence for height-for-age and birth order for weight-for-
height.
62
Analysis of the Elite Children
To simulate the population selected in the Multiple Growth Reference Study used in the
development of the 2006 WHO Standards, we selected elite children (for definition see “Elite
Children” in the Methods section of this paper) from the 10 DHS countries in our pool of data
and prepared cumulative distribution curves using the 2006 WHO Standards and the 1977 NCHS
Reference. We expect that the z-score values for the children selected would lie on the
cumulative normal curve, indicating that they are well nourished and presumably are similar to
the children on which the standards are based. Figure 14 and Table 8 depict our results.
The overall pattern remains the same as that observed for all children, i.e., stunting is
higher with the 2006 WHO Standards than the 1977 NCHS Reference. Also, prevalence of
wasting and underweight are higher with the 1977 NCHS Reference than the 2006 WHO
Standards. However, all three curves do not overlap as expected. The elite children from the
DHS population are slightly more stunted compared with the normal distribution curve. As for
wasting, both standards indicate that the elite children do not track exactly along the normal
distribution curve. Instead, some children lie on either side of the normal curve, representing
more wasting in elite children than expected and also the emerging problem of overweight. The
comparison of the cumulative weight-for-age curves with the cumulative normal curve shows
similar results as for weight–for-height.
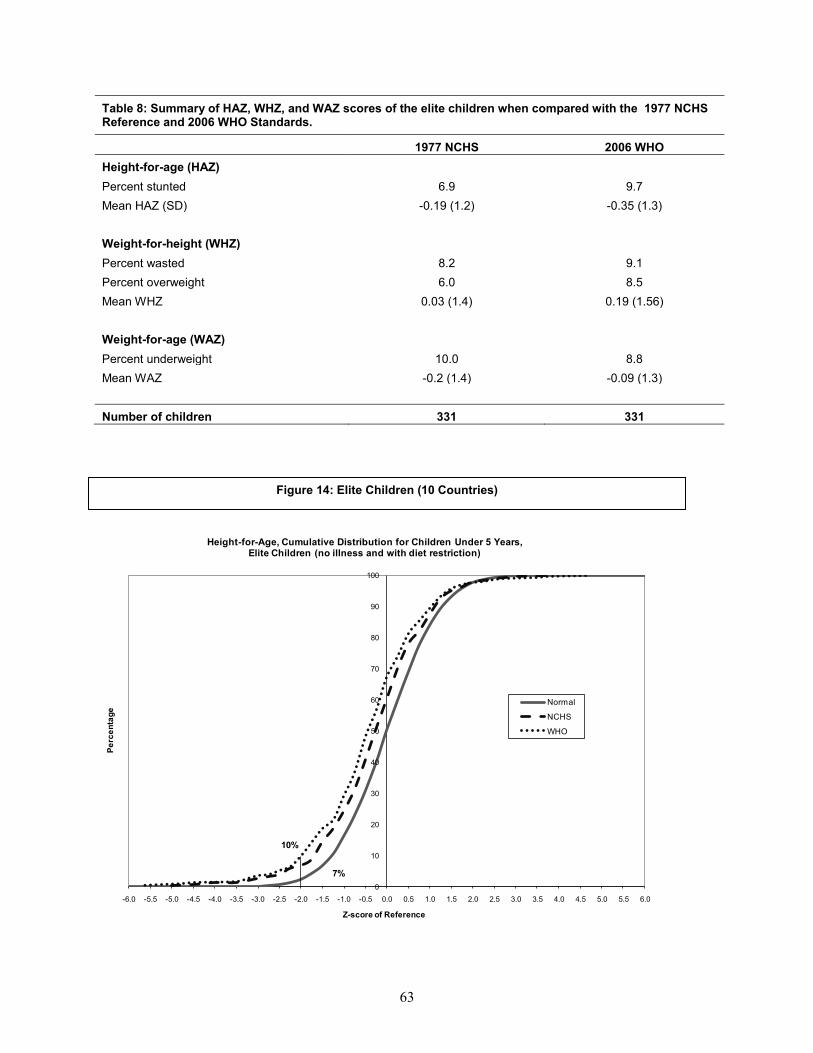
63
Table 8: Summary of HAZ, WHZ, and WAZ scores of the elite children when compared with the 1977 NCHS Reference and 2006 WHO Standards.
1977 NCHS 2006 WHOHeight-for-age (HAZ)Percent stunted 6.9 9.7Mean HAZ (SD) -0.19 (1.2) -0.35 (1.3)
Weight-for-height (WHZ)Percent wasted 8.2 9.1Percent overweight 6.0 8.5Mean WHZ 0.03 (1.4) 0.19 (1.56)
Weight-for-age (WAZ)Percent underweight 10.0 8.8Mean WAZ -0.2 (1.4) -0.09 (1.3)
Number of children 331 331
0
10
20
30
40
50
60
70
80
90
100
-6.0 -5.5 -5.0 -4.5 -4.0 -3.5 -3.0 -2.5 -2.0 -1.5 -1.0 -0.5 0.0 0.5 1.0 1.5 2.0 2.5 3.0 3.5 4.0 4.5 5.0 5.5 6.0
Perc
enta
ge
Z-score of Reference
Height-for-Age, Cumulative Distribution for Children Under 5 Years,Elite Children (no illness and with diet restriction)
Normal
NCHS
WHO
7%
10%
Figure 14: Elite Children (10 Countries)

64
0
10
20
30
40
50
60
70
80
90
100
-6.0 -5.5 -5.0 -4.5 -4.0 -3.5 -3.0 -2.5 -2.0 -1.5 -1.0 -0.5 0.0 0.5 1.0 1.5 2.0 2.5 3.0 3.5 4.0 4.5 5.0 5.5 6.0
Perc
enta
ge
Z-score of Reference
Weight-for-Height, Cumulative Distribution for Children Under 5 Years,Elite Children (no illness and with diet restriction)
Normal
1977 NCHS
2006 WHO
9%8%
6%
8%
0
10
20
30
40
50
60
70
80
90
100
-6.0 -5.5 -5.0 -4.5 -4.0 -3.5 -3.0 -2.5 -2.0 -1.5 -1.0 -0.5 0.0 0.5 1.0 1.5 2.0 2.5 3.0 3.5 4.0 4.5 5.0 5.5 6.0
Perc
enta
ge
Z-score of Reference
Weight-for-Age, Cumulative Distribution for Children Under 5 Years, Elite Children (no illness and with diet restriction)
Normal
1977 NCHS
2006 WHO
10%
9%
65
DISCUSSION
Our results using DHS data support the findings from other studies (de Onis et al., 2006;
Schwarz et al., 2008) that the prevalence of stunting in children under age 5 years is higher using
the 2006 WHO Standards (Table 1). Our results also indicate that higher prevalence of
underweight exists with the 1977 NCHS Reference except during the first 6 months of life, a
finding similar to the one observed by Prost et al. (2008) in Malawi. Our study also finds that use
of the 2006 WHO Standards results in classifying higher proportion of overweight and obese
children, as was reported by de Onis, (2007).
We find that the use of the Hong and de Onis, (2008) algorithm suggested to convert a
prevalence statistic based on the 1977 NCHS Reference into an estimate based on the 2006
WHO Standards yields higher levels of malnutrition than direct application of the 2006 WHO
Standards. Moreover, the overestimation of malnutrition depends on the age of the child.
Bloem (2007) reports that the prevalence of wasting using either the 2006 WHO
Standards or the 1977 NCHS Reference varies by setting. Hence, interpretation of these results
is complex and reliance on a single algorithm is not justified. The use and interpretation of the
prevalence using the 2006 WHO Standards derived from the suggested algorithm values should
be done with caution, especially when determining trends.
We find that the mean z-scores for height-for-age are higher with the 2006 WHO
Standards and that the mean z-scores for weight-for-age are higher with the 1977 NCHS
Reference. However, the mean z-scores for weight-for-height are greater than zero using the
2006 WHO Standards in four of the countries in our study, and lower in the remaining six
countries. The variation in weight-for-height by country could be because it is a sensitive
indicator influenced by short-term events, and wasting can develop rapidly from fluctuations in
food supply and prevalence of infectious diseases (Gibson, 1990).
66
The differences in the mean z-score between the 1977 NCHS Reference and the 2006
WHO Standards in height-for-age, weight-for-height, and weight-for-age are considerably higher
during the first 6 months of life than later in childhood. These findings substantiate results
reported by de Onis et al. (2006). For children age 24 months or older who were measured lying
down, the differences in the mean z-scores are higher than for other age groups and for the other
forms of measurement for all countries in our study except Nepal and Peru (Table 5a). Thus the
method of data collection may influence the observed estimates of stunting, wasting, and
underweight. However, it is likely that there is also a selection process involved, since tall
children were measured standing up, even if they were younger than age 2 years.
Using the 2006 WHO Standards, mean differences according to form of measurement in
the height-for-age z-scores are significantly greater for children age 24-36 months than when
using the 1977 NCHS Reference. In the 1977 NCHS Reference there is a big difference in the
height status of children right before and after age 24 months, at approximately half a standard
deviation (WHO, 1995). This difference in height status does not exist for the 2006 WHO
Standards, due to the design of the MGRS (de Onis, 2006).
However, the comparisons according to form of measurement by indicator, age, and
growth standard show clearly that children measured standing up are different than those
measured lying down. The children measured while standing are taller and weigh more. The
effect of form of measurement is less for the 1977 NCHS Reference than for the 2006 WHO
Standards in HAZ (and therefore less for stunting) but the effect is more for the 1977 NCHS
Reference in weight for height (and wasting).
By background characteristics, we find greater differences in mean height-for-age z-
scores for children age 24-35 months, children in rural areas, and children whose mothers have
67
less education, as well as for male children, children of higher birth order, children whose form
of measurement was inappropriate, and children who were not exclusively breastfed. However,
we do not find noticeable variations in the differences of mean z-scores for weight-for-height and
weight-for-age by background characteristics, with the exceptions of the age of the child and
whether or not the child was exclusively breastfed. Although it is possible to interpret the above
result as due to the inadequacy of 1977 NCHS Reference to assess the growth of breastfed
infants (de Onis and Habicht, 1996), children under age 6 months and who are exclusively
breastfed have a lower height-for-age z-score with both standards. This is an expected finding
since the 2006 WHO Standards are based on breastfed infants.
Our multivariate analyses of all children under age 5 years indicate that child’s age and
sex, mother’s level of education, and incidence of recent diarrhea, as well as household wealth
status, form of measurement, and country of residence are good predictors for mean differences
between the 1977 NCHS Reference and the 2006 WHO Standards for height-for-age, weight-for-
height, and weight-for-age. Place of residence (rural versus urban) and birth order are not
significant in predicting mean differences between the two standards.
A second set of multivariate analyses (not presented in the paper) was performed for
children under age 6 months, given that this age group shows the largest differences in results
between the standards. The results for these young children are different than those of all
children under age 5 years. Among children under age 6 months, mother’s education, child’s
sex, birth order, residence (urban versus rural), and country are good predictors for mean
differences in stunting between the 2006 WHO Standards and the 1977 NCHS Reference. Type
of feeding (exclusively breastfed or not), whether or not had recent diarrhea, and form of
measurement are not significantly related to the differences in the height-for-age z-scores for
68
these children.
Another way of comparing results between the two standards is via their application to
an elite group of children, as discussed earlier—who are presumed to be well fed and who are
expected to track along the standard curve for the well-nourished children. As mentioned, a
similar study using the DHS data showed that these children did indeed track the 1977 NCHS
Reference well (Rutstein et al., 1990). While in all countries included in our study both
standards indicate some malnutrition even among this elite group, the elite children evaluated
using the 1977 NCHS Reference are closer to the normal curve than when evaluated using the
2006 WHO Standards.
The United Nations Standing Committee on Nutrition and the International Pediatric
Association recommend that the 2006 WHO Standards should now be used universally to assess
nutritional status of children due to its robust methodology of development and its prescriptive
approach. WHO endorses using the new standards wherever raw data on height, weight, and age
are available and suggests using the algorithm when 1977 NCHS Reference data need to be
converted to estimates based on the 2006 WHO Standards (Scientific Committee on Nutrition,
2008 and International Pediatrics Association, 2008). Our findings and the literature review
indicate, however, that the effect of using one or the other standard for prevalence of wasting
varies according to the setting. The effect also varies by the age of the child. Therefore, as
suggested by Bloem (2007), the conversion of the 1977 NCHS data to 2006 WHO Standards
estimates should not be based simply on the suggested algorithm.
69
CONCLUSIONS
Recent DHS reports use the new WHO Child Growth Standards (the 2006 WHO Standards) to
evaluate nutritional status in place of the older International Growth Reference (the 1977 NCHS
Reference). We therefore undertook this study to assess what effects this change makes on the
DHS-based estimates of stunting, wasting, and underweight. Since previous DHS surveys have
used the 1977 NCHS Reference, the analysis of trends has also been done using it. A lingering
question is whether investigators should continue to use the 1977 NCHS Reference to examine
trends or whether all survey data should be reanalyzed using the new 2006 WHO Standards.
Bloem (2007) recommends that both the 2006 WHO Standards and the 1977 NCHS
Reference should be used until the implications of changing standards are completely
understood. In light of our findings, we also recommend that DHS reports and further analysis
studies include results based on both of the standards, so that trends in nutritional status can be
assessed.
There is no doubt that using the 2006 WHO Standards will increase the estimated
prevalence of stunting, wasting, and overweight in children. However, estimates of the
proportion of children who are underweight will be lower, except for children under age 6
months.
Even though one of the major reasons for developing the new standards was that the 1977
NCHS Reference was not based on breastfed children, our analysis concludes that there is no
noticeable difference in children’s nutritional status by their breastfeeding status comparing the
1977 NCHS Reference with the 2006 WHO Standards.
We conclude from our analysis that the assessment of malnutrition using 2006 WHO
Standards is closer to that of a healthy population than the 1977 NCHS Reference for weight-for-
70
age and weight-for-height. However, the assessment of height-for-age using the 1977 NCHS
Reference more closely follows that of a healthy population than the 2006 WHO Standards. The
2006 WHO Standards may also serve as a better tool to assess the emerging problem of
overweight early in life.
These findings have implications for evaluating children’s nutritional status and for trend
analysis. We recommend that malnutrition tabulations should be made using both the 1977
NCHS Reference and the 2006 WHO Standards during the transition from use of the older
“descriptive” reference to the new “prescriptive” standard. We also recommend not using the
suggested algorithm for converting the 1977 NCHS point estimates into 2006 WHO Standards
point estimates for assessing trends in malnutrition of young children.
71
REFERENCES
Bloem M. The 2006 WHO child growth standards. Have implications for nutrition programmes
in emergencies. BMJ. 2007; 334:705-6.
de Onis M and Habicht JP. Anthropometric reference data for international use:
Recommendations from a World Health Organization Expert Committee. Am J Clin
Nutr. 1996; 64:650-8.
de Onis M, Garza C, and Habicht JP. Time for a new growth reference. Pediatrics 1997; 100:e8.
de Onis M, Garza C, Onyango AW, and Borghi E. Comparison of the WHO child growth
standards and the CDC 2000 growth charts. J Nutr. 2007; 137(1):144-8.
de Onis M, Onyango AW, Borghi E, Garza C, and Hong Y. Comparison of the World Health
Organization (WHO) child growth standards and the National Center for Health
Statistics/WHO international growth reference: Implications for child health
programmes. Public Health Nutr. 2006; 9(7):942-7.
de Onis M, Onyango AW, Borghi E, Siyam A, and Pinol A. World Health Organization. WHO
child growth standards: length/height-for-age, weight-for-age, weight-for-length, weight-
for-height and body mass index-for-age: methods and development. WHO, 2006a.
Fenn B and Penny ME. Using the new World Health Organization growth standards: Differences
from 3 countries. J Pediatr Gastroenterol Nutr. 2008; 46(3):316-21.
Gibson RS. Principles of Nutritional Assessment. Oxford University Press. 1990.
Hong Y and de Onis M. Algorithms for converting estimates of child malnutrition based on the
NCHS reference into estimates based on the WHO child growth standards. BMC
Pediatrics. 2008; 8:19.
72
International Pediatric Association. Endorsement of the New WHO Growth Standards for Infants
and Young Children. http://www.who.int/childgrowth/Endorsement_IPA.pdf. Accessed
on October 21, 2008.
Macro International Inc. Anthropometry, Anemia and HIV Testing Field Manual. Calverton,
Maryland: Macro International Inc. 2008.
Nuruddin R, Lim MK, Hadden WC, and Azam I. Comparison of estimates of under-nutrition for
pre-school rural Pakistani children based on the WHO standards and the National Center
for Health Statistics (NCHS) reference. Public Health Nutr. 2008; 27:1-7.
Ogden CL, Robert JK, Katherine MF, Zuguo M, Shumei G, et al. Centers for Disease Control
and Prevention 2000 growth charts for the United States: Improvements to the 1977
National Center for Health Statistics version. Pediatrics. 2002; 109; 45-60
Prost MA, Jahn A, Flyod S, Mvula H, Mwaiyeghele E, Venance M, Mhango T, Crampin C,
McGrath, Fine PEM, and Glynn JR. Implications of new WHO growth standards in
identification of risk factors and estimated prevalence of malnutrition in rural Malawian
infants. PLoS One. 2008; 3(7).
Prinja S, Jarnail ST, and Satpal SB. Pilot testing of WHO child growth standards in Chandigarh:
implications for India’s child health programmes. Bull World Health Organ.
2009;87:116-122.
Rutstein SO, Sommerfelt AE, and Boerma JT. The anthropometric status of elite children.
Presented by S.O Rutstein at the meeting of the American Public Health Association in
New York City, October 1990.
Schwarz NG, Grobusch MP, Decker ML, Goesch J, Postschke M, Oyakhirome S, Kombila D,
Fortin J, Lell B, Issifou S, Kremsner PG, and Klipstein-Grobusch K. WHO 2006 child
73
growth standards: Implications for the prevalence of stunting and underweight-for-age in
a birth cohort of Gabonese children in comparison to the Centers for Disease Control and
Prevention 2000 growth charts and the National Center for Health Statistics 1978 growth
references. Public Health Nutr. 2008; 11(7):714-9.
Seal A and Kerac M. Operational implications of using 2006 World Health Organization growth
standards in nutrition programs: secondary data analysis. BMJ. 2007; 334:733.
Standing Committee on Nutrition. SCN endorses the new WHO growth standards for infants and
young children. Available at http://www.who.int/childgrowth/endorsement_scn.pdf.
UNICEF 2006. Multiple Indicator Cluster Survey Manual 2005- Monitoring the Situation of
Children and Women (Division of Policy and Planning). Available at:
http://www.childinfo.org/files/Multiple_Indicator_Cluster_Survey_Manual_2005.pdf.
WHO Expert Committee on Physical Status: The Use and Interpretation of Anthropometry.
WHO Technical Report Series: 854. World Health Organization, Geneva, 1995.
WHO 2006. World Health Organization releases new child growth standards - Standards confirm
that all children worldwide have the potential to grow the same. Available at:
http://www.who.int/mediacentre/news/releases/2006/pr21/en/index.html.


![The Peru Continuous DHS Experience [OP8] · The Peru Continuous DHS Experience. DHS Occasional Papers No. 8 The Peru Continuous DHS Experience Shea O. Rutstein Ann Way ICF International](https://img.pdfslide.us/doc/110x75/5ee12fe2ad6a402d666c27fb/the-peru-continuous-dhs-experience-op8-the-peru-continuous-dhs-experience-dhs.jpg)