Embed Size (px)
Citation preview
DHS ANALYTICAL STUDIES 70
Quality of Diagnostic services for non-severe suspecteD Malaria cases: an analysis of national HealtH facility surveys froM Malawi anD tanzania
august 2019
This publication was produced for review by the United States Agency for International Development. It was prepared by Cameron Taylor, Jehan Ahmed, and Wenjuan Wang.

DHS Analytical Studies No. 70
Quality of Diagnostic Services for Non-Severe Suspected Malaria Cases:
An Analysis of National Health Facility Surveys from Malawi and Tanzania
Cameron Taylor Jehan Ahmed
Wenjuan Wang
ICF Rockville, Maryland, USA
August 2019
Corresponding author: Cameron Taylor, The Demographic and Health Surveys (DHS) Program, ICF, 530 Gaither Road, Suite 500, Rockville, MD 20850, USA; phone: +1 301-572-0277; email: [email protected]
Acknowledgments: The authors would like to thank Dr. Julie Thwing (CDC) for her careful review as well as Annē Linn (USAID) for her advice during the inception of the report.
Editor: Bryant Robey Document Production: Joan Wardell
This study was conducted with support provided by the United States Agency for International Development (USAID) through The DHS Program (#720-OAA-18C-00083). The views expressed are those of the authors and do not necessarily reflect the views of USAID or the United States Government.
The DHS Program assists countries worldwide in the collection and use of data to monitor and evaluate population, health, and nutrition programs. Additional information about The DHS Program can be obtained from ICF, 530 Gaither Road, Suite 500, Rockville, MD 20850 USA; telephone: +1 301-407-6500; fax: +1 301-407-6501; email: [email protected]; internet: www.DHSprogram.com.
Recommended citation:
Taylor, Cameron, Jehan Ahmed, and Wenjuan Wang. 2019. Quality of Diagnostic Services for Non-Severe Suspected Malaria Cases: An Analysis of National Health Facility Surveys from Malawi and Tanzania. DHS Analytical Studies No. 70. Rockville, Maryland, USA: ICF.
iii
CONTENTS
TABLES AND FIGURES ........................................................................................................................ v ABSTRACT........................................................................................................................................... vii
1 INTRODUCTION ........................................................................................................................ 1
2 METHODS ................................................................................................................................. 3 2.1 Study Settings ............................................................................................................... 3
2.1.1 Malawi .............................................................................................................. 3 2.1.2 Tanzania .......................................................................................................... 3
2.2 Overview of Service Provision Assessment Surveys ................................................... 4 2.3 Data ............................................................................................................................... 5
2.3.1 SPA data .......................................................................................................... 5 2.3.2 Malaria endemicity ........................................................................................... 5
2.4 Study Population: Non-Severe Suspected Malaria Cases ........................................... 6 2.5 Study Variables ............................................................................................................. 6
2.5.1 Outcome variable: clinical quality for non-severe suspected malaria case ..... 6 2.5.2 Covariates ........................................................................................................ 7
2.6 Analysis ......................................................................................................................... 9
3 RESULTS ................................................................................................................................ 11 3.1 Malawi ......................................................................................................................... 11
3.1.1 Descriptive analysis ....................................................................................... 11 3.1.2 Multivariable analysis ..................................................................................... 15
3.2 Tanzania ..................................................................................................................... 17 3.2.1 Descriptive analysis ....................................................................................... 17 3.2.2 Multivariable analysis ..................................................................................... 21
4 DISCUSSION AND CONCLUSIONS ...................................................................................... 23 4.1 Discussion of Factors Associated with Quality of Diagnostic Services ...................... 23 4.2 Study Limitations ......................................................................................................... 24 4.3 Conclusions ................................................................................................................. 25
REFERENCES ...................................................................................................................................... 27
APPENDICES ....................................................................................................................................... 33

v
TABLES AND FIGURES
Table 1 Non-severe suspected malaria case criteria ........................................................ 6
Table 2 Elements of clinical quality for non-severe suspected malaria cases ................. 7
Table 3 Summary of covariates ........................................................................................ 8
Table 4 Percent distribution of non-severe suspected malaria cases by client/visit, provider, and facility background characteristics, Malawi .................................. 14
Table 5 Results of multilevel logistic regression of non-severe suspected malaria cases who received all three clinical care elements, Malawi ............................. 16
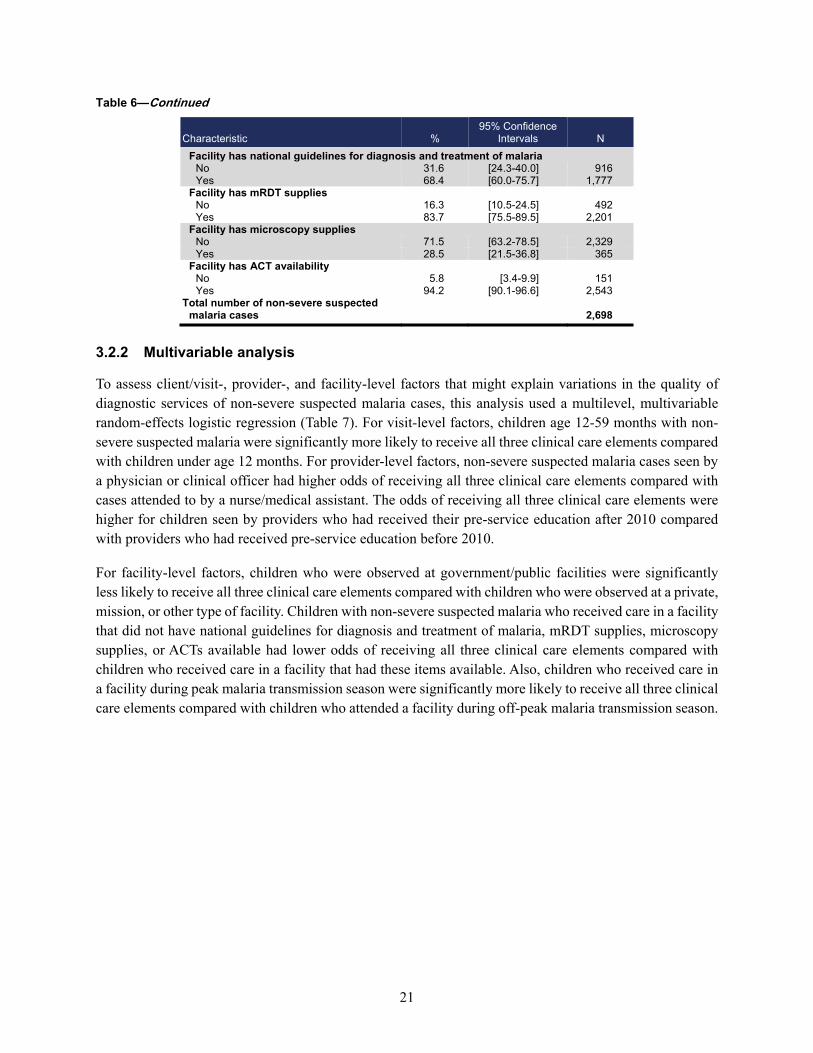
Table 6 Percent distribution of non-severe suspected malaria cases by client/visit, provider, and facility background characteristics, Tanzania .............................. 20
Table 7 Results of multilevel logistic regression of non-severe suspected malaria cases who received all three clinical care elements, Tanzania ......................... 22
Figure 1 Sample selection for analysis of children classified as a non-severe suspected malaria case, Malawi ........................................................................ 11
Figure 2 Percentage of non-severe suspected malaria cases who received each clinical care element during their health facility visit, Malawi ............................. 12
Figure 3 Distribution of clinical care elements performed among non-severe suspected malaria cases, Malawi ...................................................................... 12
Figure 4 The specific clinical care elements received among non-severe suspected malaria cases who had one or two clinical care elements performed, Malawi ................................................................................................................ 13
Figure 5 Sample selection for analysis of children classified as a non-severe suspected malaria case, Tanzania .................................................................... 17
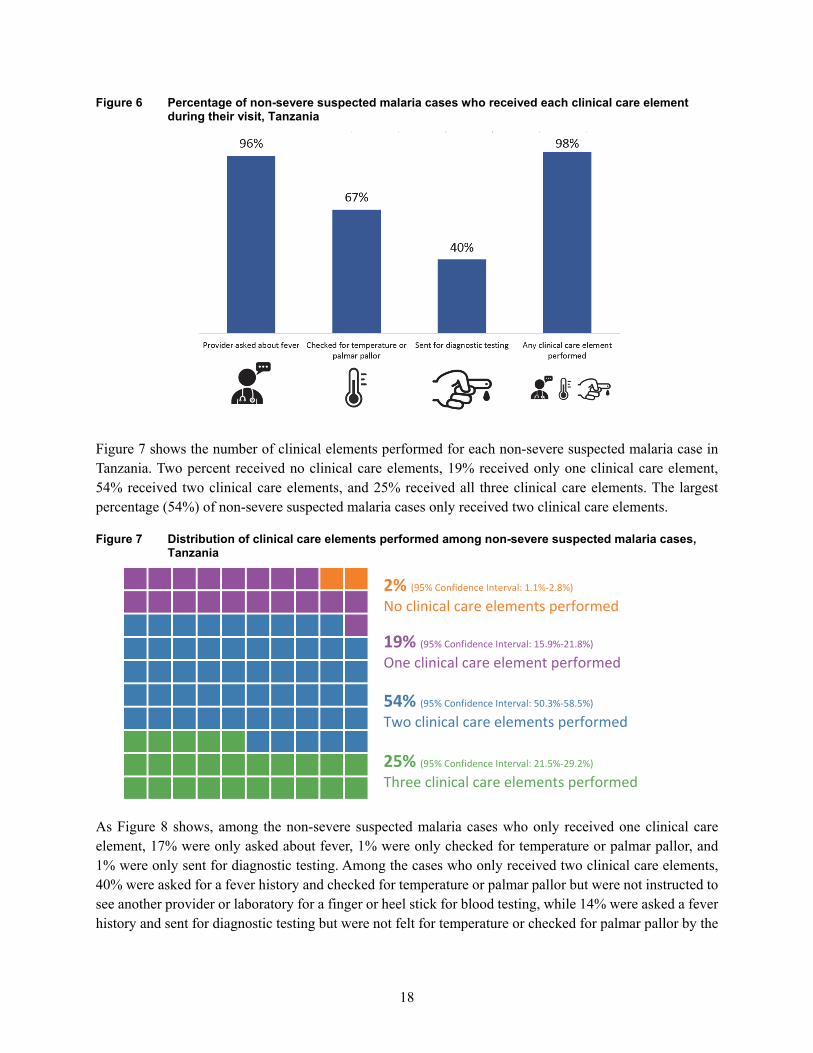
Figure 6 Percentage of non-severe suspected malaria cases who received each clinical care element during their visit, Tanzania ............................................... 18
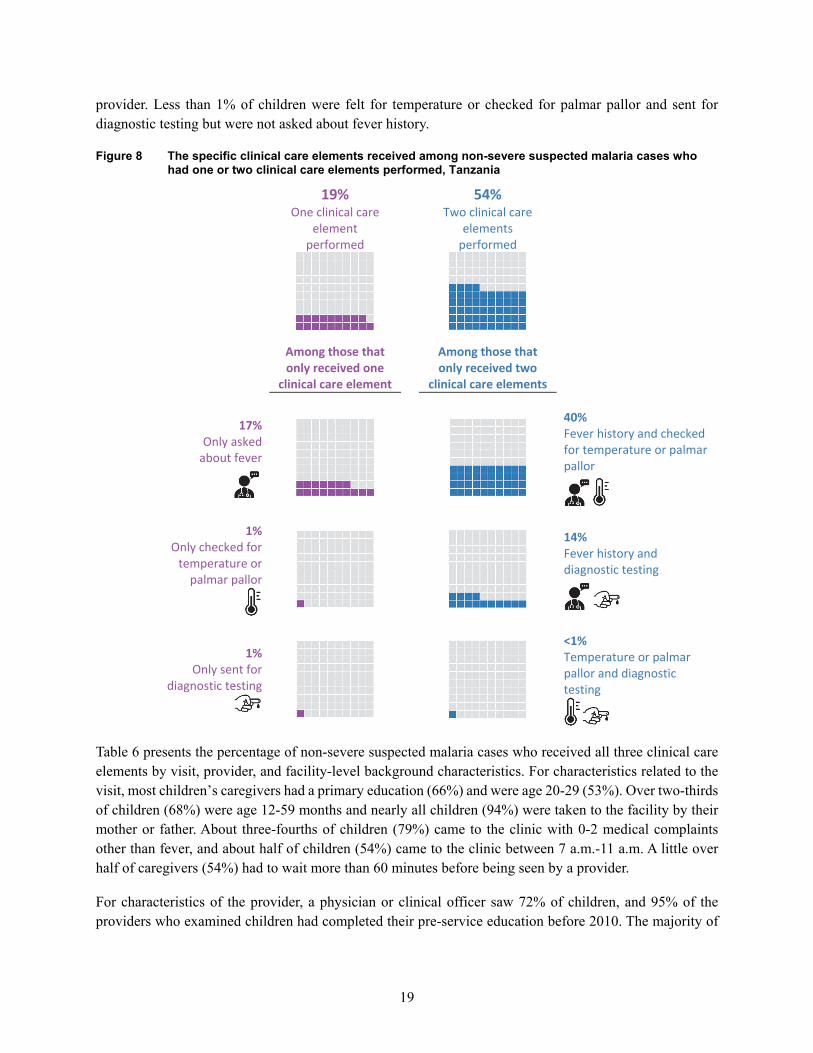
Figure 7 Distribution of clinical care elements performed among non-severe suspected malaria cases, Tanzania .................................................................. 18
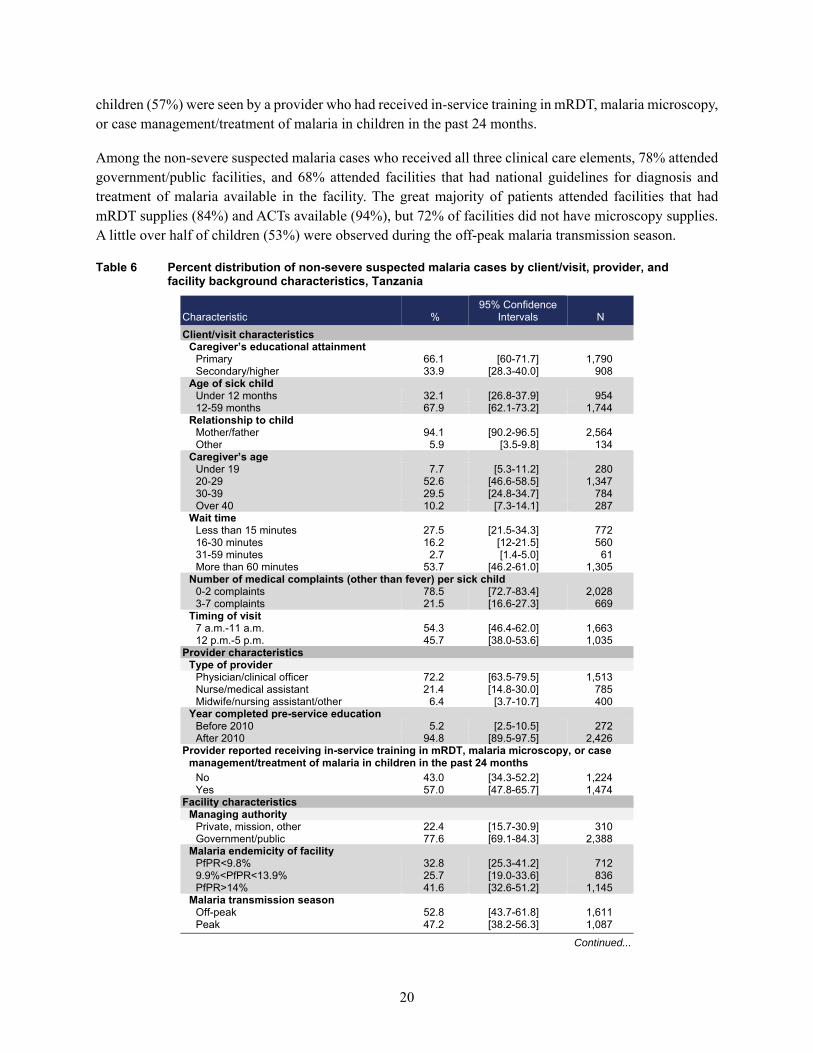
Figure 8 The specific clinical care elements received among non-severe suspected malaria cases who had one or two clinical care elements performed, Tanzania ............................................................................................................ 19
Appendix A WHO algorithm for malaria diagnosis and treatment: first visit ......................... 33
Appendix B IMCI fever chart ................................................................................................ 34

vii
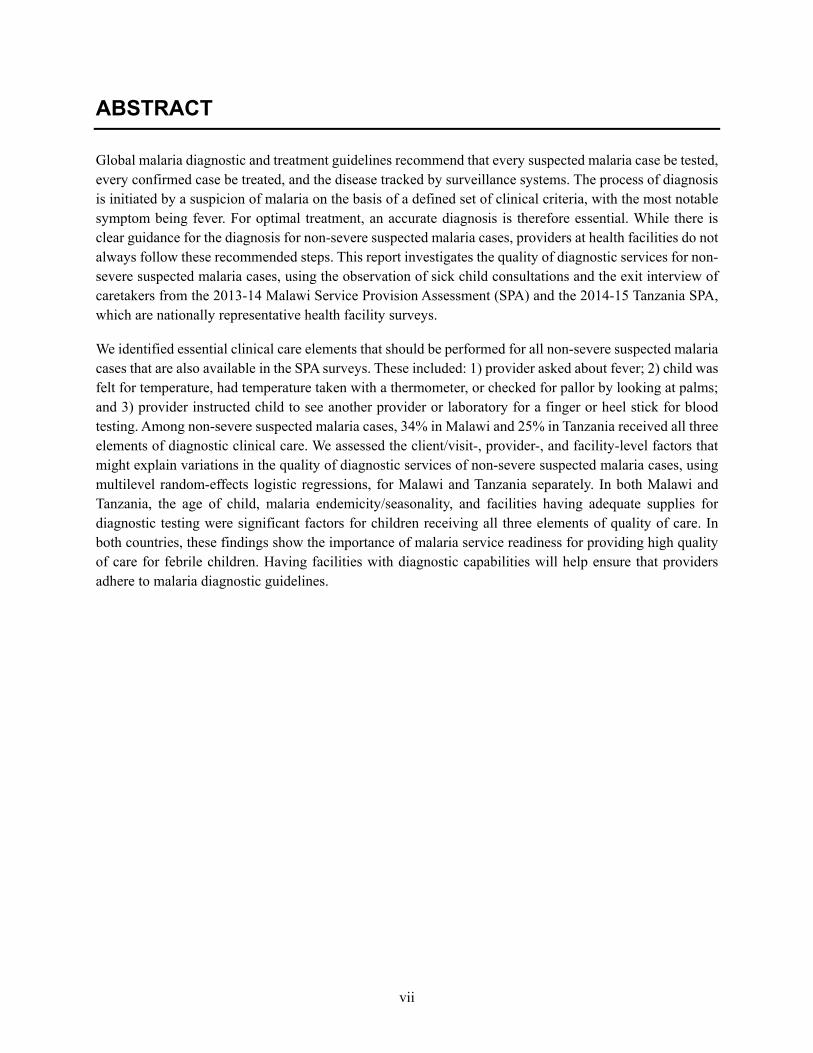
ABSTRACT
Global malaria diagnostic and treatment guidelines recommend that every suspected malaria case be tested, every confirmed case be treated, and the disease tracked by surveillance systems. The process of diagnosis is initiated by a suspicion of malaria on the basis of a defined set of clinical criteria, with the most notable symptom being fever. For optimal treatment, an accurate diagnosis is therefore essential. While there is clear guidance for the diagnosis for non-severe suspected malaria cases, providers at health facilities do not always follow these recommended steps. This report investigates the quality of diagnostic services for non-severe suspected malaria cases, using the observation of sick child consultations and the exit interview of caretakers from the 2013-14 Malawi Service Provision Assessment (SPA) and the 2014-15 Tanzania SPA, which are nationally representative health facility surveys.
We identified essential clinical care elements that should be performed for all non-severe suspected malaria cases that are also available in the SPA surveys. These included: 1) provider asked about fever; 2) child was felt for temperature, had temperature taken with a thermometer, or checked for pallor by looking at palms; and 3) provider instructed child to see another provider or laboratory for a finger or heel stick for blood testing. Among non-severe suspected malaria cases, 34% in Malawi and 25% in Tanzania received all three elements of diagnostic clinical care. We assessed the client/visit-, provider-, and facility-level factors that might explain variations in the quality of diagnostic services of non-severe suspected malaria cases, using multilevel random-effects logistic regressions, for Malawi and Tanzania separately. In both Malawi and Tanzania, the age of child, malaria endemicity/seasonality, and facilities having adequate supplies for diagnostic testing were significant factors for children receiving all three elements of quality of care. In both countries, these findings show the importance of malaria service readiness for providing high quality of care for febrile children. Having facilities with diagnostic capabilities will help ensure that providers adhere to malaria diagnostic guidelines.

1
1 INTRODUCTION
Malaria is an acute febrile illness. Symptoms usually appear 10-15 days after an infective mosquito bite with first symptoms including fever, headache, and chills [1]. If not treated within 24 hours, P. falciparum malaria can progress to severe illness. In children, severe malaria can cause severe anemia, respiratory distress, or cerebral malaria [1]. Early diagnosis and treatment of malaria are essential in preventing deaths and reducing malaria transmission.
While fever is a common symptom of many childhood illnesses in sub-Saharan Africa, children presenting at health facilities seldom present with a single ailment. The presence of multiple and overlying illnesses makes it difficult for health care providers to diagnose and treat. In the mid-1990s, in response to the challenges that health care providers faced, the World Health Organization (WHO) together with the United Nations Children’s Emergency Fund (UNICEF) and other agencies developed a strategy known as integrated management of childhood illness (IMCI) [2]. IMCI aims to integrate management of the common conditions that children present with at health facilities to improve the quality of care for children and reduce severe morbidity and mortality. The IMCI clinical guidelines were created from an evidence-based syndrome approach to case management that targets the following common childhood conditions: malaria, pneumonia, diarrhea, dehydration, measles, malnutrition, anemia, and ear problems, among others [3, 4]. The intended audience for these guidelines is lower-level health facilities that have limited diagnostic capacity. The guidelines outline danger signs of severe disease that require immediate referral to a higher-level health facility [3, 4]. Current IMCI guidelines recommend that a malaria test be done for all children in a high-malaria-risk area presenting with fever or a history of fever (but without general signs of danger or a stiff neck) [3].
In 2012 the WHO Global Malaria Programme launched its T3: Test. Treat. Track initiative to support malaria-endemic countries in their efforts to achieve universal coverage of diagnostic testing, treatment, and surveillance for malaria [5]. The T3 initiative recommends that every suspected malaria case—regardless of the patient’s age—is confirmed by microscopy or rapid diagnostic test (RDT) before being treated, that every confirmed case is treated with antimalarial medicine, and that the disease is tracked by strong surveillance systems [5]. The T3 initiative is integrated into the WHO document, Universal access to malaria diagnostic testing – An operational manual, as well as Guidelines for the treatment of malaria [6, 7].
While IMCI guidelines in conjunction with the T3 initiative provide clear guidance for the diagnosis, testing, and treatment for non-severe suspected malaria cases, providers at health facilities do not always follow these recommended steps [8]. Before 2012, many of the guidance documents for the treatment of malaria acknowledged that parasitological diagnosis was not always possible or necessary, particularly in high-transmission areas [9]. Consequently, the presumption that all fevers are malaria is a mindset of health care providers and patients that has been difficult to change, with providers giving presumptive treatment with antimalarial drugs for suspected malaria cases without testing or in spite of test results, or not probing for other conditions [9, 10].
An essential step toward improving health care provider performance for performing diagnostic services is to understand the factors that influence it. However, health care provider practices are complex, with
2
multiple influences, including factors related to the client, visit, provider, and facility. Client-level factors that influence health care provider performance include characteristics of the caregiver bringing the child to the facility. Before coming to the facility, a caregiver’s ability to recognize and seek appropriate care for symptoms of illness is key to preventing child deaths. Studies have shown that malaria treatment-seeking behavior has been associated with a range of individual and contextual factors such as cultural beliefs and illness perceptions, severity of illness, gender, wealth, and other sociodemographic characteristics [11-16]. These factors can influence a patient’s demand for appropriate care from a health provider [17].
Other factors influencing health provider performance to provide diagnostic services include the provider’s knowledge and training. Studies have shown that the type of provider (physician, nurse, or nursing assistant/other) as well as the number of years of experience can influence the quality of care provided to a patient [18-22]. Additionally, the provider’s perceptions/assumptions of malaria risk and the accuracy of malaria diagnostics can influence care [17, 23]. The health facility environment can also affect provider performance. Factors such as available equipment and supplies, general work environment, clear and available clinical guidelines, health facility type (private versus public), supervision, and training have been shown to influence health provider behavior [24-26].
This report investigates the quality of diagnostic services for non-severe suspected malaria cases, using the observation of sick child consultations and the exit interview of caretakers from the 2013-14 Malawi Service Provision Assessment (SPA) and the 2014-15 Tanzania SPA, which are nationally representative health facility surveys. While past studies have used nationally representative health facility data to examine the quality of care for pneumonia [27], antenatal, or sick-child care in primary-care facilities [28], this study offers insight into the quality of diagnostic services provided to non-severe suspected malaria cases. The study results will help inform health providers and policymakers about factors related to the client/visit, provider, and facility that might influence whether a child receives proper care when presenting to a health facility with non-severe suspected malaria.
3
2 METHODS
2.1 Study Settings
2.1.1 Malawi
Malaria is endemic in 95% of Malawi. In most of the country, transmission occurs year-round, with peaks after the beginning of the annual rains in November. Transmission is highest in lowland areas that are hotter, wetter, and more humid, particularly around the lakeshore. In the 2017 Malawi Malaria Indicator Survey (MIS), 24% of children under age 5 tested positive for malaria by microscopy [29]. The P. falciparum parasite accounts for 98% of malaria infections and all severe cases and malaria deaths [30].
Malawi’s national malaria case management policy states that malaria should be suspected in any under-5 children or pregnant women who present with fever or history of fever [31]. For children over age 5, a suspected malaria case includes fever or history of fever plus one other symptom or sign suggestive of malaria. Malawi’s national malaria policy states that malaria RDTs (mRDTs) should be performed on all patients suspected of having uncomplicated malaria in order to obtain parasitological confirmation before beginning treatment [31]. Since the policy was adopted in 2010, mRDTs have been distributed to all health facilities. The Malawi Ministry of Health (MoH) currently recommends two brands of the histidine-rich protein-2 (HRP 2) mRDTs for use in Malawi. These are SD BIOLINE malaria Ag Pf (Standard Diagnostics, Inc.) or the Paracheck® malaria Ag Pf. (Orchid Biomedical Systems, Goa, India) [31].The goal of the National Malaria Control Program (NMCP) is broadening access to testing and treatment services by increasing the number of village clinics at the community level.
2.1.2 Tanzania
In Mainland Tanzania, 95% of the population lives in areas at high malaria risk. The Tanzanian population is the third largest population at risk of stable malaria in Africa, with 59% of the population living in hypo-endemic areas (where parasitemia is <10%), and 41% living in meso-, holo-, or hyperendemic areas (where parasitemia is >10%) [32]. Transmission peaks seasonally at the end of the rainy season, which is in March and April in the central and southern areas of the country with a single rainy season, and in November and again in april in the eastern, northern, and western areas that have bimodal rainfall spread over a long period [32]. The 2017 Tanzania Malaria Indicator Survey (TMIS) performed mRDT testing and found that malaria prevalence among children age 6-59 months was 7%. The percentage of children under age 5 who tested positive for malaria according to RDT results decreased from 18% in the 2007-08 Tanzania HIV/AIDS and Malaria Indicator Survey (THMIS) to 7% in the 2017 TMIS.
The Zanzibar Malaria Elimination Program (ZAMEP) began focusing on malaria elimination after a 2009 assessment found that local transmission could be reduced to zero through universal coverage of vector control and the establishment of a case surveillance system [33]. The prevalence of malaria from the 2017 TMIS in both Unguja and Pemba islands of Zanzibar is <1%. In both Mainland Tanzania and Zanzibar, more than 95% of malaria cases are caused by P. falciparum, for which artemisinin-based combination therapies (ACTs) are recommended for treatment. In Zanzibar, the policies of diagnostic confirmation and treatment with ACT concur with those of the Mainland.
4
Tanzania’s national malaria case management policy states that for all patients, fever or history of fever is classified as a suspected malaria case [34]. As malaria prevalence decreases, the malaria strategic plan for Mainland Tanzania aims to “ensure that symptoms and signs of malaria in the general population are recognized early and that appropriate management is provided promptly at the individual, family, community, and facility levels.” All individuals with signs and symptoms of malaria should have access to appropriate, timely malaria diagnosis and treatment, with special emphasis on biologically and socioeconomically vulnerable populations. To ensure universal access, government policy requires that all suspected cases in both the public and private sectors are confirmed by a diagnostic test. The government seeks to provide “high-standard, accessible, affordable, equitable, and quality-assured testing” through the public sector, ensuring that diagnostics are affordable to public sector patients through a global partnership mechanism. At the same time, the government aims to facilitate this kind of testing through the establishment of alternative malaria testing points outside of facilities, which include accredited dispensing drug outlets (ADDOs) and community-based services like integrated community case management (iCCM), which provide subsidized malaria diagnostics that are regulated by the government [34].
2.2 Overview of Service Provision Assessment Surveys
SPA surveys are conducted among the formal-sector health facilities in a country. Pharmacies and individual doctors’ offices are usually not included in SPA surveys. Typically, the SPA surveys collect data from 500-1,000 facilities, which have been selected from a comprehensive list of health facilities in the country (sampling frame), categorized by facility type, managing authority (public and nonpublic), and region. The sample provides indicators at the national level for the different facility types and managing authority, as well as aggregate indicators at the regional level. The SPA surveys can also be conducted in a census of facilities, depending on the total number of health facilities in the country. The SPA surveys utilize four main questionnaires: 1) inventory questionnaires; 2) health worker or provider questionnaires; 3) observation protocols; and 4) exit interview questionnaires.
The SPA surveys are typically administered by 10 to 15 teams, with each team including three to four interviewers who are usually health workers. The interviewers collect data with the inventory questionnaire from the most knowledgeable person(s) available for each service. Specific sections of the inventory questionnaire assess the laboratories and pharmacies in these health facilities. A key feature of the inventory questionnaire is that interviewers verify the existence and expiration dates of specific items such as medicines and commodities.
Within a facility, the team interviews health providers using the health worker or provider interview questionnaire. The sample of health providers is taken from the providers who are present in the facility on the day of the survey. In each facility, the aim is to interview seven to eight providers about the range of services they offer, in-service training or training updates, and working conditions at the facility.
Using observation protocols, the interviewers observe client-provider consultations for three priority services: antenatal care (ANC); family planning; and the curative care of sick children. On the day of the visit, clients are identified and systematically selected for observation. The number of consultations observed depends on the number of providers and clients in the facility that day. Although many clients are present and eligible for observation, the rule is to observe a maximum of five clients for each provider of the service, with a maximum of 15 observations for each service in any given facility. For child health
5
consultations, only children younger than age 5 who presented with an illness (rather than an injury or a skin or eye infection exclusively) are selected for observation.
Exit interview questionnaires are administered to clients after the observed consultations and before they leave the facility, to assess the client’s understanding and recall of provider instructions and other information, and to record the client’s perception of the service delivery environment. Only clients of observed consultations are eligible for the exit interview questionnaire.
2.3 Data
2.3.1 SPA data
This analysis examined data primarily from the observation of sick child consultations and the exit interview of caretakers from the 2013-14 Malawi SPA and the 2014-15 Tanzania SPA. Data from the facility inventory and provider interviews were also used to measure factors at the provider and facility levels.
Malawi
The 2013-14 Malawi SPA was a census of all formal sector health facilities in Malawi. The Central Monitoring and Evaluation Division (CMED) of the Malawi MoH provided a master list of 1,060 such facilities. Data were collected from just 977 facilities, due to the nonresponse of some health facilities on the master list. The results are representative at the national level by facility type and managing authority, and for three regions. The fieldwork occurred in two phases, from June 11 to August 20, 2013 and November 13, 2013 to February 7, 2014.
Tanzania
The 2014-15 Tanzania SPA was a sample of all formal sector health facilities in Tanzania. The Ministry of Health and Social Welfare (MoHSW) in Tanzania Mainland and the MOH in Zanzibar obtained a master list of 7,102 verified (active) health facilities in the country. A sample of 1,200 facilities was randomly selected from this master list for the survey, to provide nationally representative results by facility type and managing authority, and regionally representative results for the 25 Tanzania Mainland regions and the 5 Zanzibar regions, for a total of 30 survey regions. Fieldwork occurred from October 20, 2014 to February 21, 2015. Some facilities in Dar es Salaam were revisited from March 2 to 13, 2015.
2.3.2 Malaria endemicity
To explore whether quality of diagnostic services for suspected malaria cases varies by level of malaria transmission in each country, geographic coordinate data collected during fieldwork were used to stratify SPA facilities by malaria prevalence. Facilities in each country were stratified into three equal frequency groups based on P. falciparum parasite prevalence among children age 2-10 (PfPR2-10) from the Malaria Atlas Project (MAP). The MAP provides a spatial data layer that describes the estimated proportion of children age 2-10 in the general population infected with P. falciparum at any given time, averaged over the 12 months of 2015. The SPA data include geospatial locations for the actual location of the health care facility, which permits linkage of MAP data with SPA data.
In Malawi, the malaria prevalence (PfPR2-10 rate) for the geographic locations of SPA facilities ranged from less than 1% to 37%. This resulted in 422 children attending facilities classified as PfPR less than 9.8%,
6
459 children attending facilities classified as PfPR between 9.9% and 13.9%, and 488 children attending facilities classified as PfPR greater than 14.0%.
The malaria prevalence (PfPR2-10 rate) for the geographic locations of SPA facilities in Tanzania ranged from less than 1% to 23%. This resulted in 631 children attending facilities classified as PfPR less than 3.9%, 676 children attending facilities classified as PfPR between 4.0% and 6.6%, and 660 children attending facilities classified as PfPR greater than 6.7%.
2.4 Study Population: Non-Severe Suspected Malaria Cases
According to the WHO algorithm for malaria diagnosis and treatment for the first visit in highly endemic areas, all patients presenting with a history of fever or elevated temperature should be tested for malaria [6]. In addition, patients under age 5 with palmar pallor or anyone with a hemoglobin level <8 g/dl should also be tested for malaria. However, children who exhibit danger signs (unable to drink or breastfeed, vomit everything, have convulsions, are lethargic or unconscious, or present with neck stiffness, chest in-drawing or stridor) should be referred to an inpatient facility.
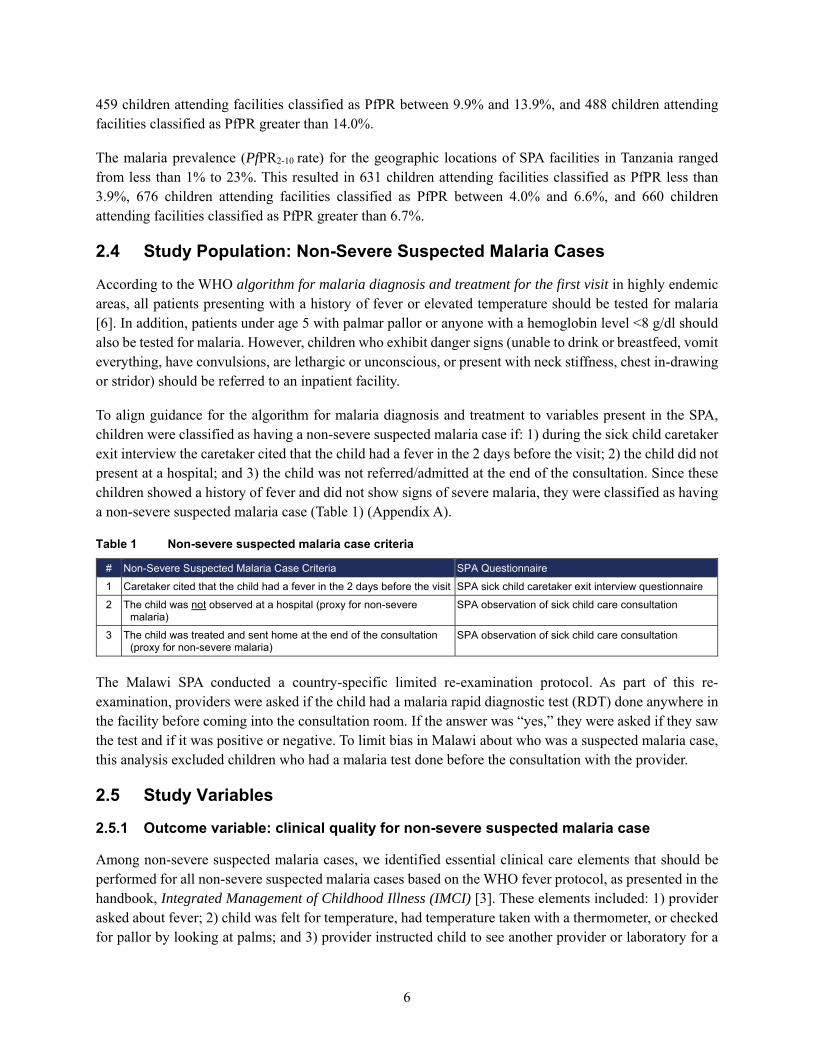
To align guidance for the algorithm for malaria diagnosis and treatment to variables present in the SPA, children were classified as having a non-severe suspected malaria case if: 1) during the sick child caretaker exit interview the caretaker cited that the child had a fever in the 2 days before the visit; 2) the child did not present at a hospital; and 3) the child was not referred/admitted at the end of the consultation. Since these children showed a history of fever and did not show signs of severe malaria, they were classified as having a non-severe suspected malaria case (Table 1) (Appendix A).
Table 1 Non-severe suspected malaria case criteria
# Non-Severe Suspected Malaria Case Criteria SPA Questionnaire
1 Caretaker cited that the child had a fever in the 2 days before the visit SPA sick child caretaker exit interview questionnaire
2 The child was not observed at a hospital (proxy for non-severe malaria)
SPA observation of sick child care consultation
3 The child was treated and sent home at the end of the consultation (proxy for non-severe malaria)
SPA observation of sick child care consultation
The Malawi SPA conducted a country-specific limited re-examination protocol. As part of this re-examination, providers were asked if the child had a malaria rapid diagnostic test (RDT) done anywhere in the facility before coming into the consultation room. If the answer was “yes,” they were asked if they saw the test and if it was positive or negative. To limit bias in Malawi about who was a suspected malaria case, this analysis excluded children who had a malaria test done before the consultation with the provider.
2.5 Study Variables
2.5.1 Outcome variable: clinical quality for non-severe suspected malaria case
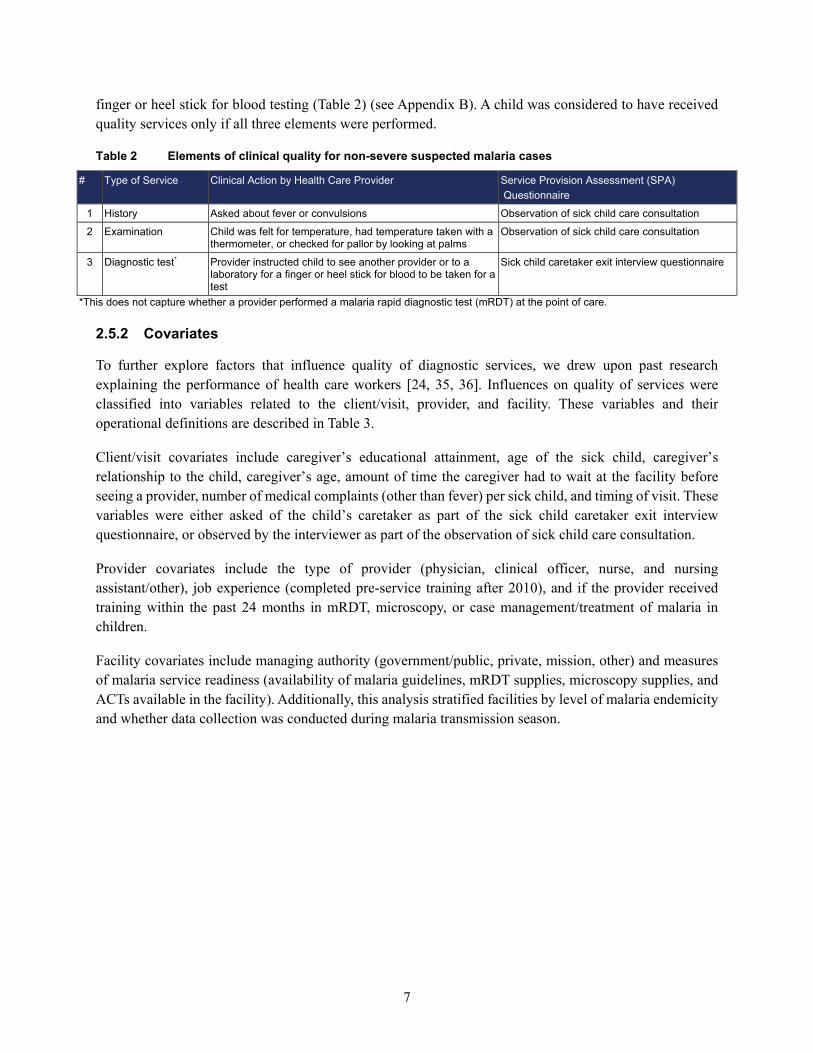
Among non-severe suspected malaria cases, we identified essential clinical care elements that should be performed for all non-severe suspected malaria cases based on the WHO fever protocol, as presented in the handbook, Integrated Management of Childhood Illness (IMCI) [3]. These elements included: 1) provider asked about fever; 2) child was felt for temperature, had temperature taken with a thermometer, or checked for pallor by looking at palms; and 3) provider instructed child to see another provider or laboratory for a
7
finger or heel stick for blood testing (Table 2) (see Appendix B). A child was considered to have received quality services only if all three elements were performed.
Table 2 Elements of clinical quality for non-severe suspected malaria cases
# Type of Service Clinical Action by Health Care Provider Service Provision Assessment (SPA) Questionnaire
1 History Asked about fever or convulsions Observation of sick child care consultation
2 Examination Child was felt for temperature, had temperature taken with a thermometer, or checked for pallor by looking at palms
Observation of sick child care consultation
3 Diagnostic test* Provider instructed child to see another provider or to a laboratory for a finger or heel stick for blood to be taken for a test
Sick child caretaker exit interview questionnaire
*This does not capture whether a provider performed a malaria rapid diagnostic test (mRDT) at the point of care. 2.5.2 Covariates
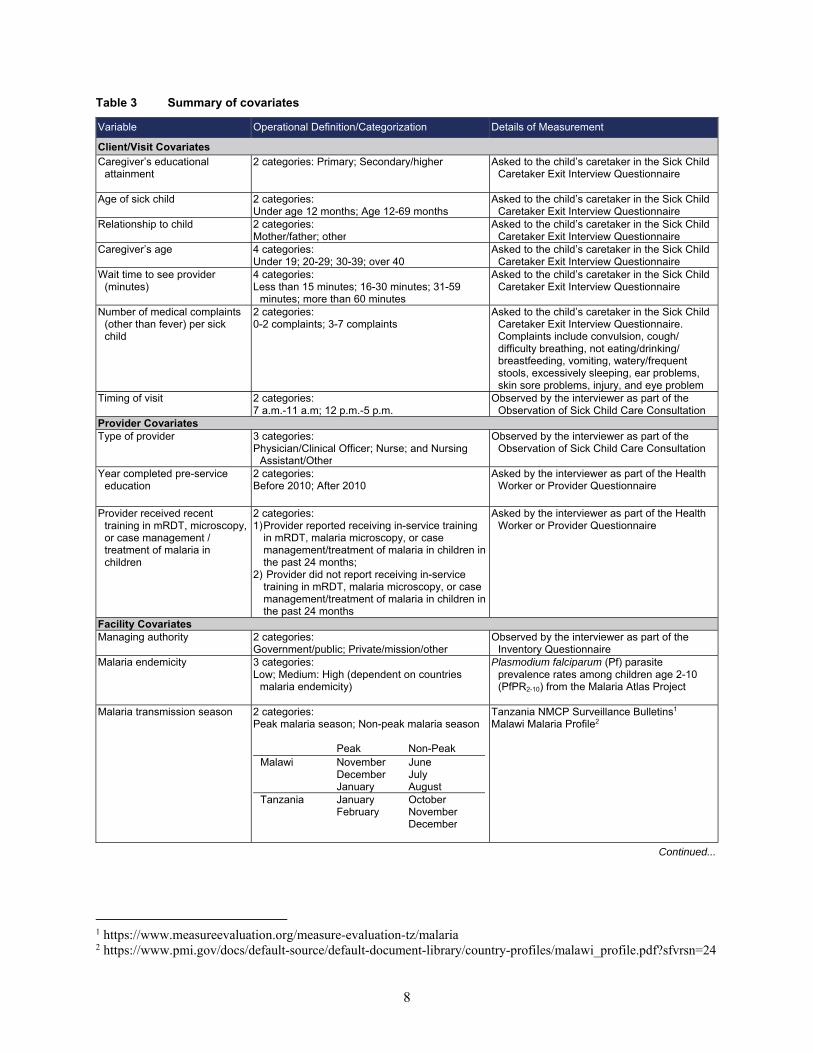
To further explore factors that influence quality of diagnostic services, we drew upon past research explaining the performance of health care workers [24, 35, 36]. Influences on quality of services were classified into variables related to the client/visit, provider, and facility. These variables and their operational definitions are described in Table 3.
Client/visit covariates include caregiver’s educational attainment, age of the sick child, caregiver’s relationship to the child, caregiver’s age, amount of time the caregiver had to wait at the facility before seeing a provider, number of medical complaints (other than fever) per sick child, and timing of visit. These variables were either asked of the child’s caretaker as part of the sick child caretaker exit interview questionnaire, or observed by the interviewer as part of the observation of sick child care consultation.
Provider covariates include the type of provider (physician, clinical officer, nurse, and nursing assistant/other), job experience (completed pre-service training after 2010), and if the provider received training within the past 24 months in mRDT, microscopy, or case management/treatment of malaria in children.
Facility covariates include managing authority (government/public, private, mission, other) and measures of malaria service readiness (availability of malaria guidelines, mRDT supplies, microscopy supplies, and ACTs available in the facility). Additionally, this analysis stratified facilities by level of malaria endemicity and whether data collection was conducted during malaria transmission season.
8
Table 3 Summary of covariates
Variable Operational Definition/Categorization Details of Measurement
Client/Visit Covariates Caregiver’s educational
attainment
2 categories: Primary; Secondary/higher Asked to the child’s caretaker in the Sick Child Caretaker Exit Interview Questionnaire
Age of sick child 2 categories: Under age 12 months; Age 12-69 months
Asked to the child’s caretaker in the Sick Child Caretaker Exit Interview Questionnaire
Relationship to child 2 categories: Mother/father; other
Asked to the child’s caretaker in the Sick Child Caretaker Exit Interview Questionnaire
Caregiver’s age 4 categories: Under 19; 20-29; 30-39; over 40
Asked to the child’s caretaker in the Sick Child Caretaker Exit Interview Questionnaire
Wait time to see provider (minutes)
4 categories: Less than 15 minutes; 16-30 minutes; 31-59
minutes; more than 60 minutes
Asked to the child’s caretaker in the Sick Child Caretaker Exit Interview Questionnaire
Number of medical complaints (other than fever) per sick child
2 categories: 0-2 complaints; 3-7 complaints
Asked to the child’s caretaker in the Sick Child Caretaker Exit Interview Questionnaire. Complaints include convulsion, cough/difficulty breathing, not eating/drinking/breastfeeding, vomiting, watery/frequent stools, excessively sleeping, ear problems, skin sore problems, injury, and eye problem
Timing of visit 2 categories: 7 a.m.-11 a.m; 12 p.m.-5 p.m.
Observed by the interviewer as part of the Observation of Sick Child Care Consultation
Provider Covariates Type of provider 3 categories:
Physician/Clinical Officer; Nurse; and Nursing Assistant/Other
Observed by the interviewer as part of the Observation of Sick Child Care Consultation
Year completed pre-service education
2 categories: Before 2010; After 2010
Asked by the interviewer as part of the Health Worker or Provider Questionnaire
Provider received recent training in mRDT, microscopy, or case management / treatment of malaria in children
2 categories: 1) Provider reported receiving in-service training
in mRDT, malaria microscopy, or case management/treatment of malaria in children in the past 24 months;
2) Provider did not report receiving in-service training in mRDT, malaria microscopy, or case management/treatment of malaria in children in the past 24 months
Asked by the interviewer as part of the Health Worker or Provider Questionnaire
Facility Covariates Managing authority 2 categories:
Government/public; Private/mission/other Observed by the interviewer as part of the
Inventory Questionnaire Malaria endemicity
3 categories: Low; Medium: High (dependent on countries
malaria endemicity)
Plasmodium falciparum (Pf) parasite prevalence rates among children age 2-10 (PfPR2-10) from the Malaria Atlas Project
Malaria transmission season 2 categories:
Peak malaria season; Non-peak malaria season
Peak Non-Peak Malawi November
December January
June July August
Tanzania January February
October November December
Tanzania NMCP Surveillance Bulletins1 Malawi Malaria Profile2
Continued...
1 https://www.measureevaluation.org/measure-evaluation-tz/malaria 2 https://www.pmi.gov/docs/default-source/default-document-library/country-profiles/malawi_profile.pdf?sfvrsn=24
9
Table 3—Continued
Variable Operational Definition/Categorization Details of Measurement
Availability of national guidelines for diagnosis and treatment of malaria
2 categories: 1. Facilities with guidelines for
diagnosis/treatment of malaria; 2. Facilities without guidelines for
diagnosis/treatment of malaria
Observed by the interviewer as part of the Inventory Questionnaire
mRDT supplies* 2 categories: 1. Facilities with malaria RDT supplies; 2. Facilities without malaria RDT supplies
Observed by the interviewer as part of the Inventory Questionnaire
Microscopy supplies** Categorical with 2 categories: 1. Facilities with malaria microscopy supplies; 2. Facilities without malaria microscopy supplies
Observed by the interviewer as part of the Inventory Questionnaire
ACT availability 2 categories: 1. Facilities with ACTs available: 2. Facilities without ACTs available
Observed by the interviewer as part of the Inventory Questionnaire
*A facility considered to have adequate mRDT supplies must have unexpired malaria mRDT kits available in the facility. **A facility that is defined as having adequate microscopy supplies must have a functioning microscope with glass slides and the relevant stains for malaria microscopy available somewhere in the facility on the day of the survey. Appropriate stains for malaria microscopy include Giemsa, field, or acridine orange stain. 2.6 Analysis
All analyses were conducted using Stata15 (StataCorp. LP, College Station, United States of America). The study included a country-level descriptive analysis of patient, provider, and facility characteristics. We assessed the client/visit-, provider-, and facility-level factors that might explain variations in the quality of diagnostic services of non-severe suspected malaria cases, using multilevel random-effects logistic regressions, for Malawi and Tanzania separately.
For each country, we ran a three-level random intercept regression model. SPA data follow a hierarchical structure, that is, patients are nested within providers, and providers are nested within facilities. Patients who visited the same facility or were seen by the same provider may not be independent of one another. Compared with regular individual-level regression analyses that assume that all individuals are independent, the multilevel modeling approach accounts for the fact that individuals may share some characteristics.
While the outcome variable of this study—clinical quality for non-severe suspected malaria case—is measured at the individual level, many predictors of interest are measured at the provider and facility levels. Patient-level analysis ignores the nesting of individuals within providers and providers within facilities, which may result in underestimating the standard errors and increasing the chance of incorrectly rejecting null hypotheses. This problem can be addressed with multilevel modeling that allows for simultaneous examination of the effects at multiple levels on patient-level outcomes. The random-effects model also provides information on the extent to which the total variation is explained by the provider-level and facility-level predictors.
The descriptive analysis was adjusted for complex survey design and relevant sample weights. Regression analyses are unweighted due to lack of proper weight variables.

11
3 RESULTS
3.1 Malawi
3.1.1 Descriptive Analysis
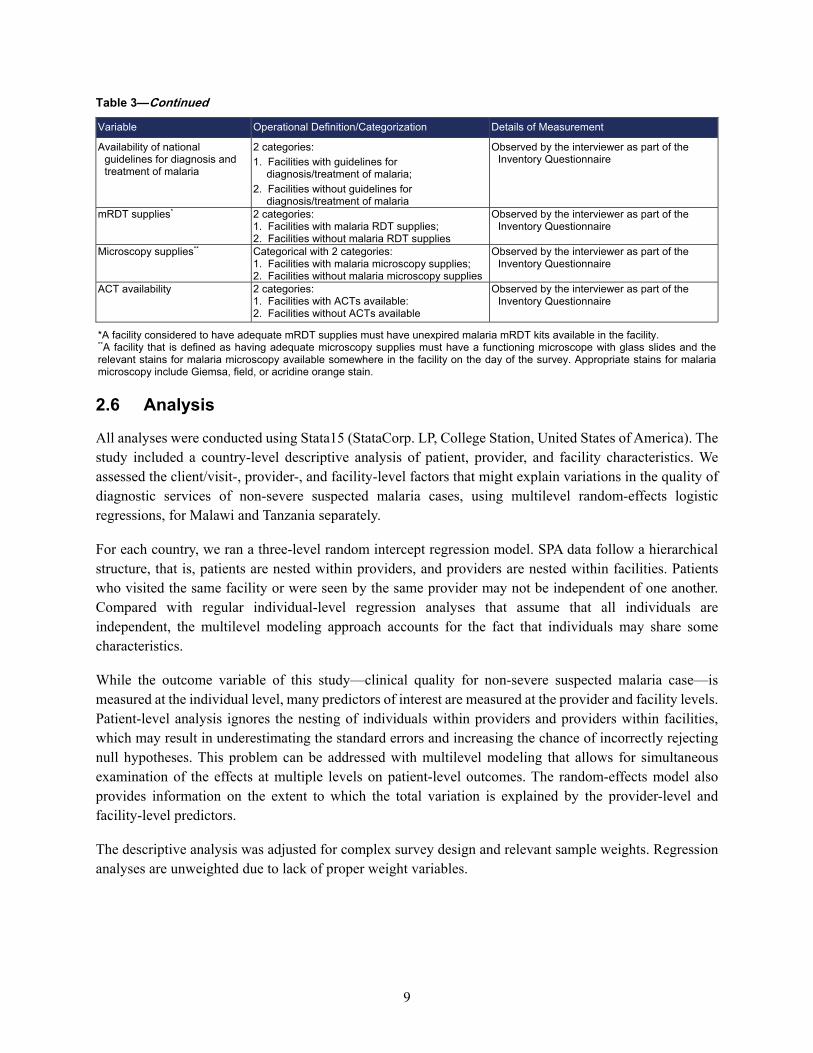
Observations of 3,293 children occurred as part of sick child care consultations in Malawi. Of these, 826 children were classified as cases of non-severe suspected malaria according to the sample selection criteria, as outlined in Figure 1.
Figure 1 Sample selection for analysis of children classified as a non-severe suspected malaria case, Malawi
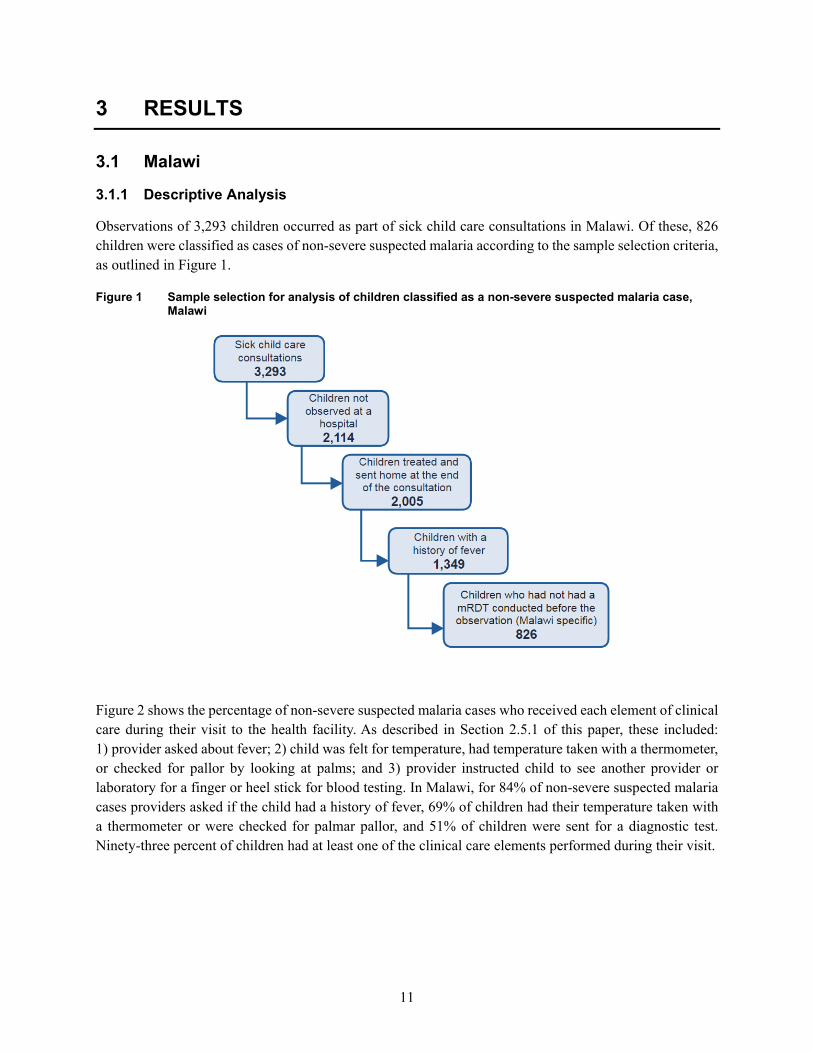
Figure 2 shows the percentage of non-severe suspected malaria cases who received each element of clinical care during their visit to the health facility. As described in Section 2.5.1 of this paper, these included: 1) provider asked about fever; 2) child was felt for temperature, had temperature taken with a thermometer, or checked for pallor by looking at palms; and 3) provider instructed child to see another provider or laboratory for a finger or heel stick for blood testing. In Malawi, for 84% of non-severe suspected malaria cases providers asked if the child had a history of fever, 69% of children had their temperature taken with a thermometer or were checked for palmar pallor, and 51% of children were sent for a diagnostic test. Ninety-three percent of children had at least one of the clinical care elements performed during their visit.
12
Figure 2 Percentage of non-severe suspected malaria cases who received each clinical care element during their health facility visit, Malawi
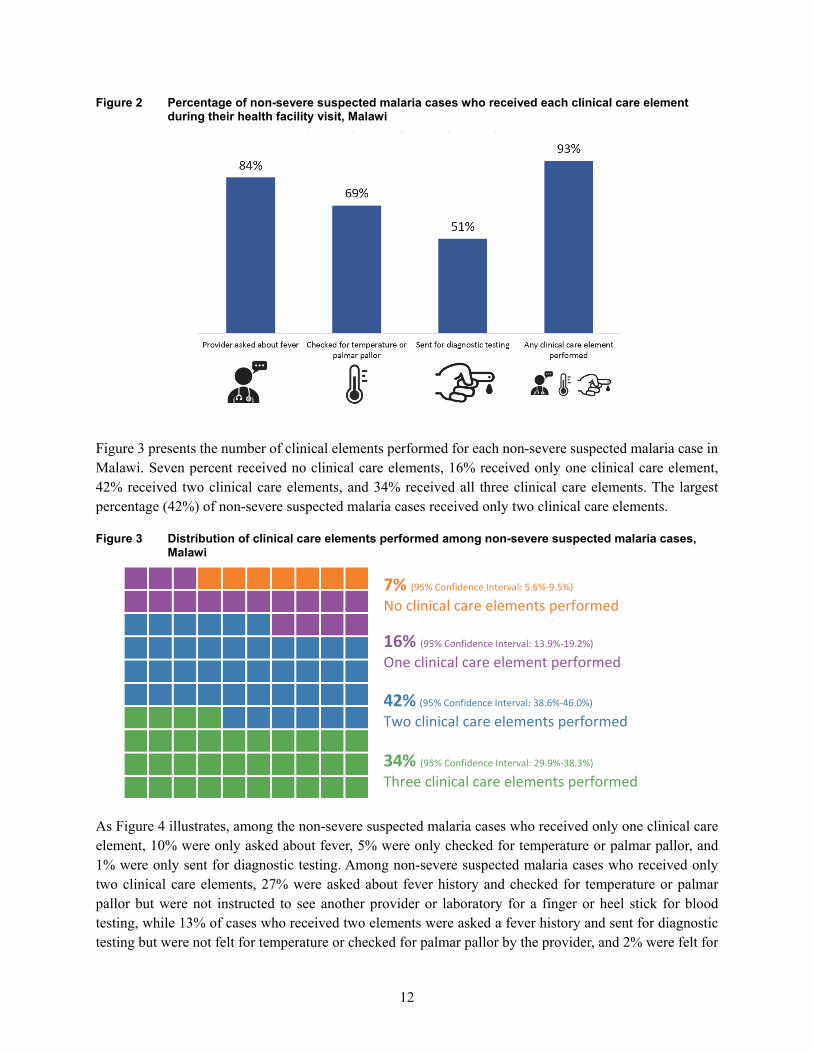
Figure 3 presents the number of clinical elements performed for each non-severe suspected malaria case in Malawi. Seven percent received no clinical care elements, 16% received only one clinical care element, 42% received two clinical care elements, and 34% received all three clinical care elements. The largest percentage (42%) of non-severe suspected malaria cases received only two clinical care elements.
Figure 3 Distribution of clinical care elements performed among non-severe suspected malaria cases, Malawi
7% (95% Confidence Interval: 5.6%-9.5%) No clinical care elements performed
16% (95% Confidence Interval: 13.9%-19.2%) One clinical care element performed
42% (95% Confidence Interval: 38.6%-46.0%) Two clinical care elements performed
34% (95% Confidence Interval: 29.9%-38.3%) Three clinical care elements performed
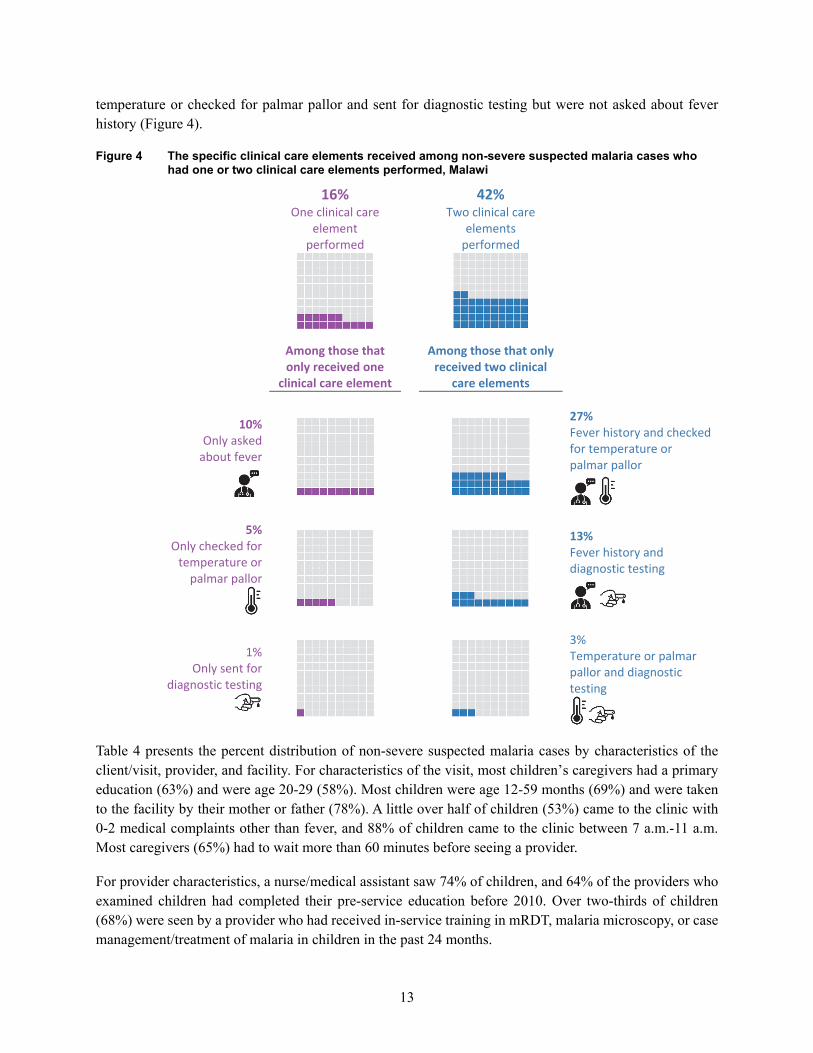
As Figure 4 illustrates, among the non-severe suspected malaria cases who received only one clinical care element, 10% were only asked about fever, 5% were only checked for temperature or palmar pallor, and 1% were only sent for diagnostic testing. Among non-severe suspected malaria cases who received only two clinical care elements, 27% were asked about fever history and checked for temperature or palmar pallor but were not instructed to see another provider or laboratory for a finger or heel stick for blood testing, while 13% of cases who received two elements were asked a fever history and sent for diagnostic testing but were not felt for temperature or checked for palmar pallor by the provider, and 2% were felt for
13
temperature or checked for palmar pallor and sent for diagnostic testing but were not asked about fever history (Figure 4).
Figure 4 The specific clinical care elements received among non-severe suspected malaria cases who had one or two clinical care elements performed, Malawi
16% One clinical care
element performed
42% Two clinical care
elements performed
Among those that only received one
clinical care element
Among those that only received two clinical
care elements
10% Only asked
about fever
27% Fever history and checked for temperature or palmar pallor
5% Only checked for
temperature or palmar pallor
13% Fever history and diagnostic testing
1% Only sent for
diagnostic testing
3% Temperature or palmar pallor and diagnostic testing
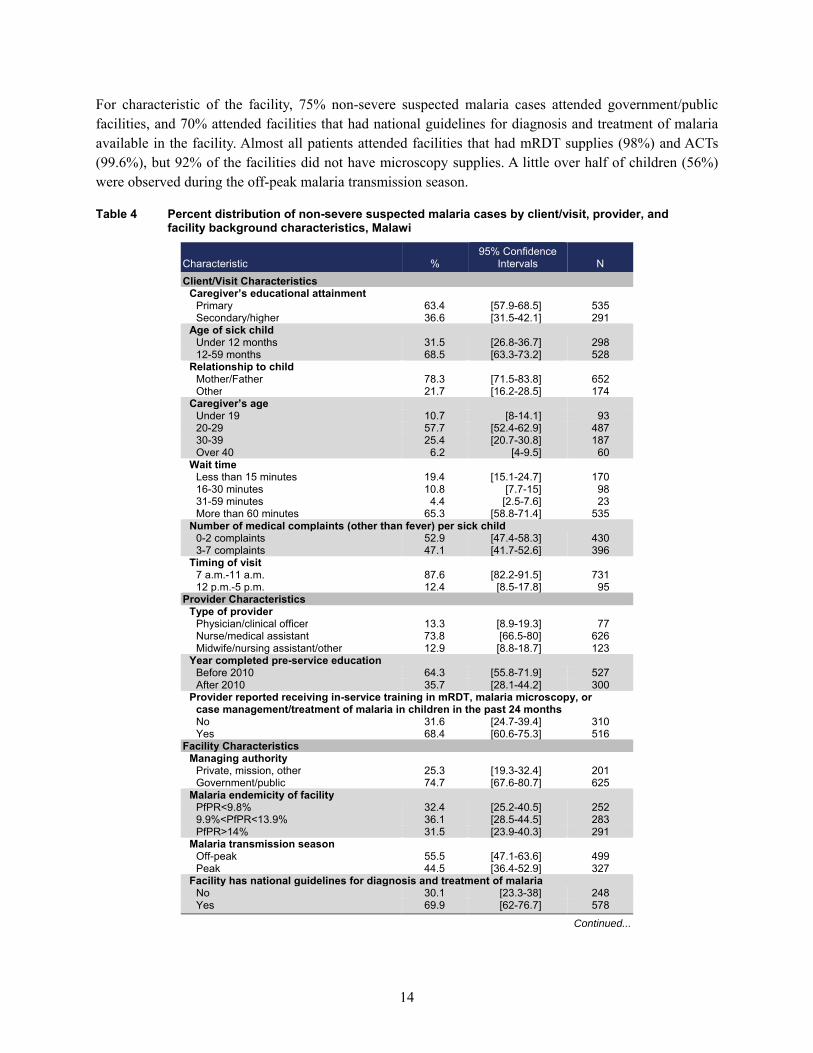
Table 4 presents the percent distribution of non-severe suspected malaria cases by characteristics of the client/visit, provider, and facility. For characteristics of the visit, most children’s caregivers had a primary education (63%) and were age 20-29 (58%). Most children were age 12-59 months (69%) and were taken to the facility by their mother or father (78%). A little over half of children (53%) came to the clinic with 0-2 medical complaints other than fever, and 88% of children came to the clinic between 7 a.m.-11 a.m. Most caregivers (65%) had to wait more than 60 minutes before seeing a provider.
For provider characteristics, a nurse/medical assistant saw 74% of children, and 64% of the providers who examined children had completed their pre-service education before 2010. Over two-thirds of children (68%) were seen by a provider who had received in-service training in mRDT, malaria microscopy, or case management/treatment of malaria in children in the past 24 months.
14
For characteristic of the facility, 75% non-severe suspected malaria cases attended government/public facilities, and 70% attended facilities that had national guidelines for diagnosis and treatment of malaria available in the facility. Almost all patients attended facilities that had mRDT supplies (98%) and ACTs (99.6%), but 92% of the facilities did not have microscopy supplies. A little over half of children (56%) were observed during the off-peak malaria transmission season.
Table 4 Percent distribution of non-severe suspected malaria cases by client/visit, provider, and facility background characteristics, Malawi
Characteristic % 95% Confidence
Intervals N Client/Visit Characteristics
Caregiver’s educational attainment Primary 63.4 [57.9-68.5] 535 Secondary/higher 36.6 [31.5-42.1] 291
Age of sick child Under 12 months 31.5 [26.8-36.7] 298 12-59 months 68.5 [63.3-73.2] 528
Relationship to child Mother/Father 78.3 [71.5-83.8] 652 Other 21.7 [16.2-28.5] 174
Caregiver’s age Under 19 10.7 [8-14.1] 93 20-29 57.7 [52.4-62.9] 487 30-39 25.4 [20.7-30.8] 187 Over 40 6.2 [4-9.5] 60
Wait time Less than 15 minutes 19.4 [15.1-24.7] 170 16-30 minutes 10.8 [7.7-15] 98 31-59 minutes 4.4 [2.5-7.6] 23 More than 60 minutes 65.3 [58.8-71.4] 535
Number of medical complaints (other than fever) per sick child 0-2 complaints 52.9 [47.4-58.3] 430 3-7 complaints 47.1 [41.7-52.6] 396
Timing of visit 7 a.m.-11 a.m. 87.6 [82.2-91.5] 731 12 p.m.-5 p.m. 12.4 [8.5-17.8] 95
Provider Characteristics Type of provider
Physician/clinical officer 13.3 [8.9-19.3] 77 Nurse/medical assistant 73.8 [66.5-80] 626 Midwife/nursing assistant/other 12.9 [8.8-18.7] 123
Year completed pre-service education Before 2010 64.3 [55.8-71.9] 527 After 2010 35.7 [28.1-44.2] 300
Provider reported receiving in-service training in mRDT, malaria microscopy, or case management/treatment of malaria in children in the past 24 months No 31.6 [24.7-39.4] 310 Yes 68.4 [60.6-75.3] 516
Facility Characteristics Managing authority
Private, mission, other 25.3 [19.3-32.4] 201 Government/public 74.7 [67.6-80.7] 625
Malaria endemicity of facility PfPR<9.8% 32.4 [25.2-40.5] 252 9.9%<PfPR<13.9% 36.1 [28.5-44.5] 283 PfPR>14% 31.5 [23.9-40.3] 291
Malaria transmission season Off-peak 55.5 [47.1-63.6] 499 Peak 44.5 [36.4-52.9] 327
Facility has national guidelines for diagnosis and treatment of malaria No 30.1 [23.3-38] 248 Yes 69.9 [62-76.7] 578
Continued...
15
Table 4—Continued
Characteristic % 95% Confidence
Intervals N Facility has mRDT supplies
No 1.8 [0.8-4] 61 Yes 98.2 [96-99.2] 765
Facility has microscopy supplies No 91.7 [85.7-95.3] 781 Yes 8.3 [4.7-14.3] 45
Facility has ACT availability No 0.4 [0.1-1.8] 11 Yes 99.6 [98.2-99.9] 815
Total number of non-severe suspected malaria cases 826
3.1.2 Multivariable analysis
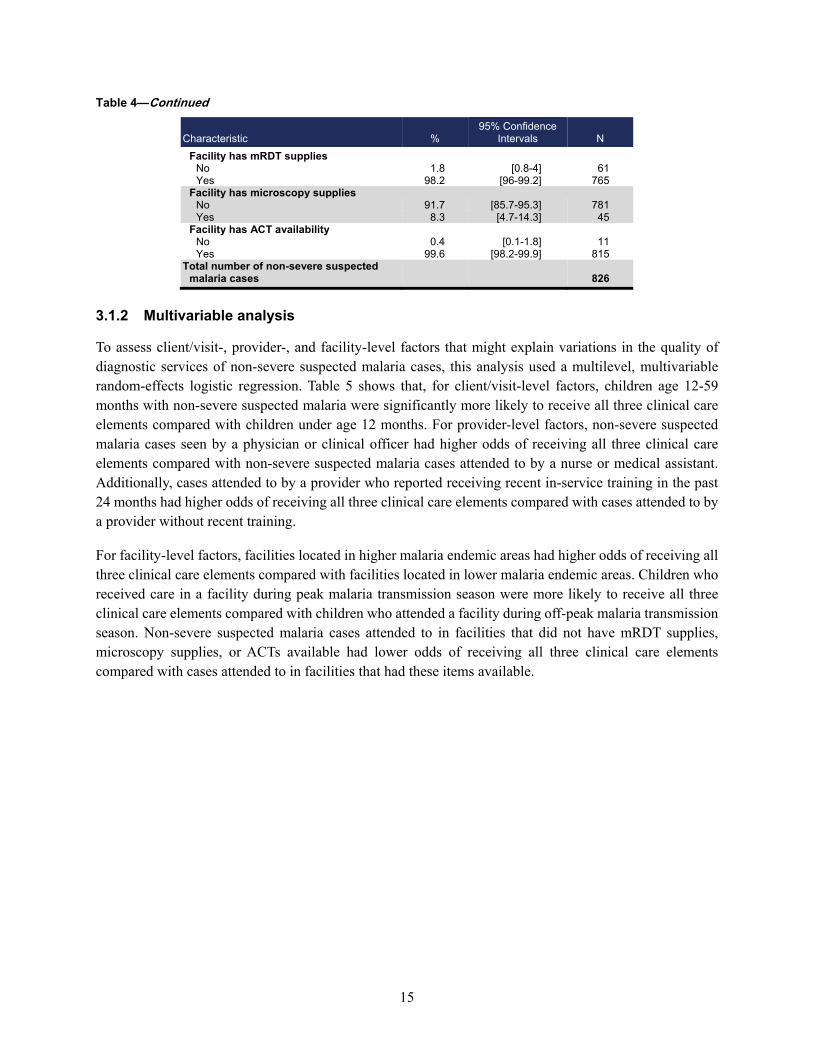
To assess client/visit-, provider-, and facility-level factors that might explain variations in the quality of diagnostic services of non-severe suspected malaria cases, this analysis used a multilevel, multivariable random-effects logistic regression. Table 5 shows that, for client/visit-level factors, children age 12-59 months with non-severe suspected malaria were significantly more likely to receive all three clinical care elements compared with children under age 12 months. For provider-level factors, non-severe suspected malaria cases seen by a physician or clinical officer had higher odds of receiving all three clinical care elements compared with non-severe suspected malaria cases attended to by a nurse or medical assistant. Additionally, cases attended to by a provider who reported receiving recent in-service training in the past 24 months had higher odds of receiving all three clinical care elements compared with cases attended to by a provider without recent training.
For facility-level factors, facilities located in higher malaria endemic areas had higher odds of receiving all three clinical care elements compared with facilities located in lower malaria endemic areas. Children who received care in a facility during peak malaria transmission season were more likely to receive all three clinical care elements compared with children who attended a facility during off-peak malaria transmission season. Non-severe suspected malaria cases attended to in facilities that did not have mRDT supplies, microscopy supplies, or ACTs available had lower odds of receiving all three clinical care elements compared with cases attended to in facilities that had these items available.
16
Table 5 Results of multilevel logistic regression of non-severe suspected malaria cases who received all three clinical care elements, Malawi
Adjusted
Odds Ratio 95% Confidence
Intervals Client/visit characteristics
Caregiver’s educational attainment Primary ref Secondary/higher 0.89 0.59 - 1.36
Age of sick child Under 12 months ref 12-59 months 1.85** 1.19 - 2.88
Relationship to child Other ref Mother/father 0.86 0.49 - 1.49
Caregiver’s age Under 19 ref 20-29 1.22 0.64 - 2.32 30-39 1.59 0.77 - 3.29 Over 40 1.43 0.55 - 3.68
Wait time Less than 15 minutes ref 16-30 minutes 0.75 0.35 - 1.58 31-59 minutes 2.57 0.72 - 9.21 More than 60 minutes 1.09 0.62 - 1.92
Number of medical complaints (other than fever) per sick child 0-2 complaints ref 3-7 complaints 1.10 0.73 - 1.64
Timing of visit 7 a.m.-11 a.m. ref 12 p.m.-5 p.m. 1.36 0.68 - 2.69
Provider Characteristics Type of provider
Physician/clinical officer 2.07 0.83 - 5.18 Nurse/medical assistant ref Midwife/nursing assistant/other 0.95 0.43 - 2.10
Year completed pre-service education Before 2010 ref After 2010 1.10 0.60 - 2.03
Provider reported receiving in-service training in mRDT, malaria microscopy, or case management/treatment of malaria in children in the past 24 months No ref Yes 1.38 0.76 - 2.53
Facility Characteristics Managing authority
Private, mission, other ref Government/public 0.73 0.34 - 1.54
Malaria endemicity of facility PfPR<9.8% ref 9.9%<PfPR<13.9% 1.28 0.64 - 2.57 PfPR>14% 1.03 0.49 - 2.16
Malaria transmission season Off-peak ref Peak 1.84 1.00 - 3.39
Facility has national guidelines for diagnosis and treatment of malaria No 1.12 0.61 - 2.05 Yes ref
Facility has mRDT supplies No 0.08*** 0.02 - 0.28 Yes ref
Facility has microscopy supplies No 0.27* 0.08 - 0.87 Yes ref
Facility has ACT availability No 0.11 0.01 - 1.31 Yes ref
*** p<0.001, ** p<0.01, * p<0.05
17
3.2 Tanzania
3.2.1 Descriptive analysis
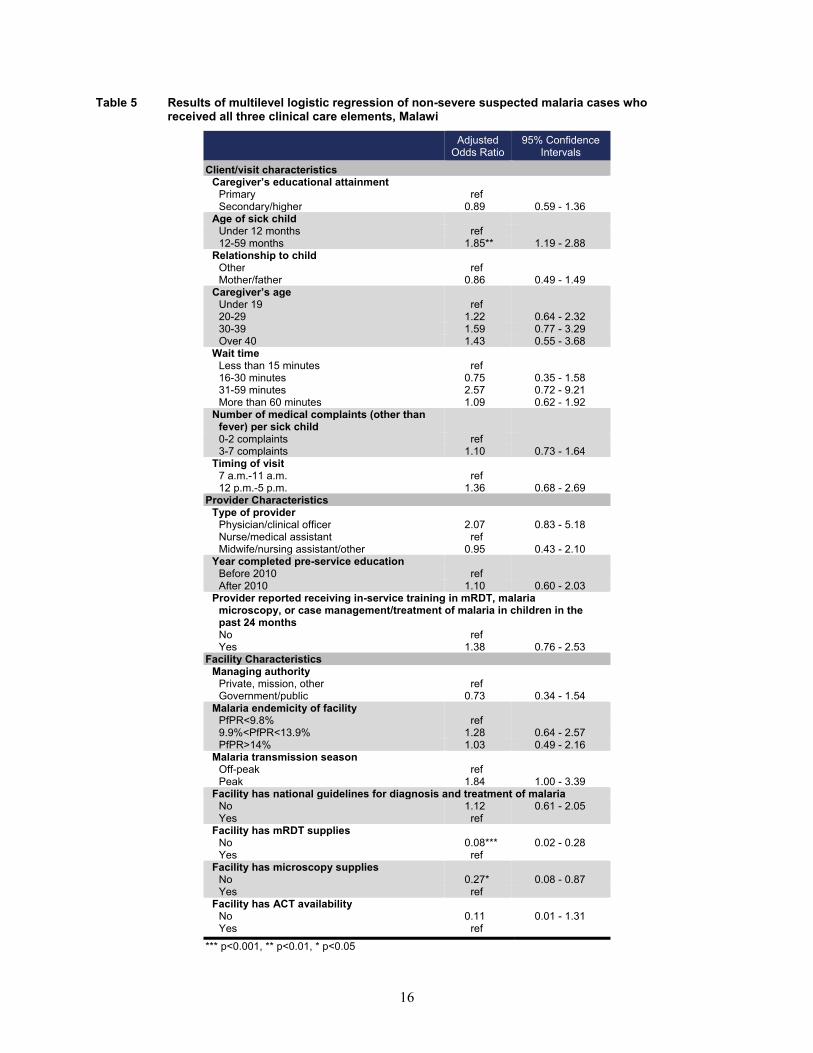
In Tanzania, observations of 4,938 children occurred as part of the observation of sick child care consultation. Of these, 2,693 children were classified as cases of non-severe suspected malaria according to the sample selection criteria, as outlined in Figure 5.
Figure 5 Sample selection for analysis of children classified as a non-severe suspected malaria case, Tanzania
Figure 6 shows the percentage of non-severe suspected malaria cases who received each clinical care element during their visit. These included: 1) provider asked about fever, 2) child was felt for temperature, had temperature taken with a thermometer, or checked for pallor by looking at palms, and 3) provider instructed child to see another provider or laboratory for a finger or heel stick for blood testing. In Tanzania, for 96% of non-severe suspected malaria cases the provider asked if the child had a history of fever, 67% of children had their temperature taken with a thermometer or checked for palmar pallor, and 40% of children were sent for a diagnostic test. Ninety-eight percent of children had at least one of the clinical care elements performed during their visit.
18
Figure 6 Percentage of non-severe suspected malaria cases who received each clinical care element during their visit, Tanzania
Figure 7 shows the number of clinical elements performed for each non-severe suspected malaria case in Tanzania. Two percent received no clinical care elements, 19% received only one clinical care element, 54% received two clinical care elements, and 25% received all three clinical care elements. The largest percentage (54%) of non-severe suspected malaria cases only received two clinical care elements.
Figure 7 Distribution of clinical care elements performed among non-severe suspected malaria cases, Tanzania
2% (95% Confidence Interval: 1.1%-2.8%) No clinical care elements performed
19% (95% Confidence Interval: 15.9%-21.8%) One clinical care element performed
54% (95% Confidence Interval: 50.3%-58.5%) Two clinical care elements performed
25% (95% Confidence Interval: 21.5%-29.2%) Three clinical care elements performed
As Figure 8 shows, among the non-severe suspected malaria cases who only received one clinical care element, 17% were only asked about fever, 1% were only checked for temperature or palmar pallor, and 1% were only sent for diagnostic testing. Among the cases who only received two clinical care elements, 40% were asked for a fever history and checked for temperature or palmar pallor but were not instructed to see another provider or laboratory for a finger or heel stick for blood testing, while 14% were asked a fever history and sent for diagnostic testing but were not felt for temperature or checked for palmar pallor by the
19
provider. Less than 1% of children were felt for temperature or checked for palmar pallor and sent for diagnostic testing but were not asked about fever history.
Figure 8 The specific clinical care elements received among non-severe suspected malaria cases who had one or two clinical care elements performed, Tanzania
19% One clinical care
element performed
54% Two clinical care
elements performed
Among those that only received one
clinical care element
Among those that only received two
clinical care elements
17% Only asked
about fever
40% Fever history and checked for temperature or palmar pallor
1%
Only checked for temperature or
palmar pallor
14% Fever history and diagnostic testing
1% Only sent for
diagnostic testing
<1% Temperature or palmar pallor and diagnostic testing
Table 6 presents the percentage of non-severe suspected malaria cases who received all three clinical care elements by visit, provider, and facility-level background characteristics. For characteristics related to the visit, most children’s caregivers had a primary education (66%) and were age 20-29 (53%). Over two-thirds of children (68%) were age 12-59 months and nearly all children (94%) were taken to the facility by their mother or father. About three-fourths of children (79%) came to the clinic with 0-2 medical complaints other than fever, and about half of children (54%) came to the clinic between 7 a.m.-11 a.m. A little over half of caregivers (54%) had to wait more than 60 minutes before being seen by a provider.
For characteristics of the provider, a physician or clinical officer saw 72% of children, and 95% of the providers who examined children had completed their pre-service education before 2010. The majority of
20
children (57%) were seen by a provider who had received in-service training in mRDT, malaria microscopy, or case management/treatment of malaria in children in the past 24 months.
Among the non-severe suspected malaria cases who received all three clinical care elements, 78% attended government/public facilities, and 68% attended facilities that had national guidelines for diagnosis and treatment of malaria available in the facility. The great majority of patients attended facilities that had mRDT supplies (84%) and ACTs available (94%), but 72% of facilities did not have microscopy supplies. A little over half of children (53%) were observed during the off-peak malaria transmission season.
Table 6 Percent distribution of non-severe suspected malaria cases by client/visit, provider, and facility background characteristics, Tanzania
Characteristic % 95% Confidence
Intervals N Client/visit characteristics
Caregiver’s educational attainment Primary 66.1 [60-71.7] 1,790 Secondary/higher 33.9 [28.3-40.0] 908
Age of sick child Under 12 months 32.1 [26.8-37.9] 954 12-59 months 67.9 [62.1-73.2] 1,744
Relationship to child Mother/father 94.1 [90.2-96.5] 2,564 Other 5.9 [3.5-9.8] 134
Caregiver’s age Under 19 7.7 [5.3-11.2] 280 20-29 52.6 [46.6-58.5] 1,347 30-39 29.5 [24.8-34.7] 784 Over 40 10.2 [7.3-14.1] 287
Wait time Less than 15 minutes 27.5 [21.5-34.3] 772 16-30 minutes 16.2 [12-21.5] 560 31-59 minutes 2.7 [1.4-5.0] 61 More than 60 minutes 53.7 [46.2-61.0] 1,305
Number of medical complaints (other than fever) per sick child 0-2 complaints 78.5 [72.7-83.4] 2,028 3-7 complaints 21.5 [16.6-27.3] 669
Timing of visit 7 a.m.-11 a.m. 54.3 [46.4-62.0] 1,663 12 p.m.-5 p.m. 45.7 [38.0-53.6] 1,035
Provider characteristics Type of provider
Physician/clinical officer 72.2 [63.5-79.5] 1,513 Nurse/medical assistant 21.4 [14.8-30.0] 785 Midwife/nursing assistant/other 6.4 [3.7-10.7] 400
Year completed pre-service education Before 2010 5.2 [2.5-10.5] 272 After 2010 94.8 [89.5-97.5] 2,426
Provider reported receiving in-service training in mRDT, malaria microscopy, or case management/treatment of malaria in children in the past 24 months
No 43.0 [34.3-52.2] 1,224 Yes 57.0 [47.8-65.7] 1,474
Facility characteristics Managing authority
Private, mission, other 22.4 [15.7-30.9] 310 Government/public 77.6 [69.1-84.3] 2,388
Malaria endemicity of facility PfPR<9.8% 32.8 [25.3-41.2] 712 9.9%<PfPR<13.9% 25.7 [19.0-33.6] 836 PfPR>14% 41.6 [32.6-51.2] 1,145
Malaria transmission season Off-peak 52.8 [43.7-61.8] 1,611 Peak 47.2 [38.2-56.3] 1,087
Continued...
21
Table 6—Continued
Characteristic % 95% Confidence
Intervals N Facility has national guidelines for diagnosis and treatment of malaria
No 31.6 [24.3-40.0] 916 Yes 68.4 [60.0-75.7] 1,777
Facility has mRDT supplies No 16.3 [10.5-24.5] 492 Yes 83.7 [75.5-89.5] 2,201
Facility has microscopy supplies No 71.5 [63.2-78.5] 2,329 Yes 28.5 [21.5-36.8] 365
Facility has ACT availability No 5.8 [3.4-9.9] 151 Yes 94.2 [90.1-96.6] 2,543
Total number of non-severe suspected malaria cases 2,698
3.2.2 Multivariable analysis
To assess client/visit-, provider-, and facility-level factors that might explain variations in the quality of diagnostic services of non-severe suspected malaria cases, this analysis used a multilevel, multivariable random-effects logistic regression (Table 7). For visit-level factors, children age 12-59 months with non-severe suspected malaria were significantly more likely to receive all three clinical care elements compared with children under age 12 months. For provider-level factors, non-severe suspected malaria cases seen by a physician or clinical officer had higher odds of receiving all three clinical care elements compared with cases attended to by a nurse/medical assistant. The odds of receiving all three clinical care elements were higher for children seen by providers who had received their pre-service education after 2010 compared with providers who had received pre-service education before 2010.
For facility-level factors, children who were observed at government/public facilities were significantly less likely to receive all three clinical care elements compared with children who were observed at a private, mission, or other type of facility. Children with non-severe suspected malaria who received care in a facility that did not have national guidelines for diagnosis and treatment of malaria, mRDT supplies, microscopy supplies, or ACTs available had lower odds of receiving all three clinical care elements compared with children who received care in a facility that had these items available. Also, children who received care in a facility during peak malaria transmission season were significantly more likely to receive all three clinical care elements compared with children who attended a facility during off-peak malaria transmission season.

22
Table 7 Results of multilevel logistic regression of non-severe suspected malaria cases who received all three clinical care elements, Tanzania
Adjusted
Odds Ratio 95% Confidence
Intervals Client/visit characteristics
Caregiver’s educational attainment Primary ref Secondary/higher 1.25 0.90 - 1.73
Age of sick child Under 12 months ref 12-59 months 1.47* 1.07 - 2.01
Relationship to child Other ref Mother/father 0.67 0.34 - 1.32
Caregiver’s age Under 19 ref 20-29 1.25 0.72 - 2.18 30-39 1.13 0.63 - 2.02 Over 40 0.87 0.44 - 1.71
Wait time Less than 15 minutes ref 16-30 minutes 0.98 0.61 - 1.57 31-59 minutes 2.26 0.82 - 6.21 More than 60 minutes 1.24 0.82 - 1.87
Number of medical complaints (other than fever) per sick child
0-2 complaints ref 3-7 complaints 0.89 0.62 - 1.27
Timing of visit 7 a.m.-11 a.m. ref 12 p.m.-5 p.m. 0.94 0.66 - 1.32
Provider characteristics Type of provider
Physician/clinical officer 1.73 0.99 - 3.03 Nurse/medical assistant ref Midwife/nursing assistant/other 0.56 0.24 - 1.32
Year completed pre-service education Before 2010 ref After 2010 2.74 0.90 - 8.29
Provider reported receiving in-service training in mRDT, malaria microscopy, or case management/treatment of malaria in children in the past 24 months
No ref Yes 1.20 0.73 - 1.96
Facility characteristics Managing authority
Private, mission, other ref Government/public 0.21*** 0.11 - 0.41
Malaria endemicity of facility PfPR<3.9% ref 4.0%<PfPR<6.6% 0.77 0.44 - 1.35 PfPR>6.7% 1.04 0.59 - 1.83
Malaria transmission season Off-peak ref Peak 1.73* 1.08 - 2.77
Facility has national guidelines for diagnosis and treatment of malaria No 0.73 0.45 - 1.19 Yes ref
Facility has mRDT supplies No 0.42* 0.21 - 0.83 Yes ref
Facility has microscopy supplies No 0.21*** 0.12 - 0.37 Yes ref
Facility has ACT availability No 0.73 0.31 - 1.70 Yes ref
*** p<0.001, ** p<0.01, * p<0.05
23
4 DISCUSSION AND CONCLUSIONS
To investigate the factors associated with quality of diagnostic services for non-severe suspected malaria cases, we examined data from the observation of sick child consultations and the exit interview of caretakers in the 2013-14 Malawi SPA and the 2014-15 Tanzania SPA. Here we summarize key results, discuss study limitations, and provide overall conclusions.
4.1 Discussion of Factors Associated with Quality of Diagnostic Services
For both Malawi and Tanzania, the significant factors for children with non-severe suspected malaria receiving all three elements of quality of care were the age of child, malaria endemicity/seasonality, and facilities having adequate supplies for diagnostic testing.
Similar to other studies, child’s age was a significant factor associated with receiving quality clinical services [27, 37]. In this analysis, children age 12-59 months were more likely to receive all three quality-of-care elements compared with children under age 12 months. One possible explanation is that older children have fewer illness symptoms, thus present at the health facility as a less complicated case, and are more likely to be treated according to guidelines. However, some studies have shown that younger children with more symptoms received better quality of care [28, 38, 39]. Further exploration into this result is needed.
Malaria endemicity and seasonality also appear to influence the treatment children receive from health care providers. For both Malawi and Tanzania, children presenting at facilities located in areas with higher malaria endemicity were more likely to receive all three quality clinical care services compared with children presenting at facilities in the lowest malaria endemicity areas of the country. This finding was not statistically significant, however, in either Tanzania or Malawi. Likewise, children attending facilities during the peak transmission season were more likely to receive quality clinical care services compared with children attending facilities during the nonpeak malaria season. This result was only statistically significant in Tanzania. These results indicate that the provider’s perception of malaria risk is a potential influential factor in the quality of malaria care services. While the opposite could also be true (i.e., the provider is in a high-risk area during high transmission season and assumes malaria without testing), it seems that providers located in higher-risk areas and seeing patients during seasons of high malaria risk are more aware of the signs and symptoms of non-severe suspected malaria cases and are providing better-quality malaria services. The results of this analysis are similar to other studies that found increasing malaria service readiness with increasing malaria endemicity [40], as well as reduced odds of IMCI non-severe pneumonia classification during nonpeak malaria transmission season [27].
At the facility level, facilities having adequate supplies for diagnostic testing were significant factors for children receiving all three quality-of-care elements. This finding is logical in that for a provider to instruct a child to see another provider or laboratory for a finger or heel stick for blood testing, the facility has to have supplies to perform this blood test. This aligns with findings of previous studies that the key factor to improving diagnostic testing of malaria is availability of testing supplies in the facility [41, 42].
In both Malawi and Tanzania, children observed at government/public facilities were less likely to receive all three clinical care elements compared with children observed at private, mission, or other facilities. This
24
finding is surprising, since previous studies have shown that in both Malawi and Tanzania government facilities had higher percentages of trained staff, guidelines, and diagnostic supplies compared with private/mission/other facilities [40, 43, 44]. One potential explanation for this difference is that private/mission/other facilities usually operate on a profit-driven model that incentivizes sending a non-severe suspected malaria case to receive a diagnostic test. While past studies have shown similar differences between the quality of care between public and private facilities [28], this should be explored further in future studies.
Lastly, the WHO T3 initiative states that every suspected malaria case (regardless of the patient’s age) should be confirmed by microscopy or RDT before being treated, that every confirmed case should be treated with antimalarial medicine, and that the disease should be tracked by strong surveillance systems. The availability of ACT is critical for confirmed malaria cases to be treated. In our analysis, however, ACT availability does not emerge as a statistically significant factor. This is possibly due the fact that almost all non-severe suspected malaria cases attended a facility where ACTs were available. Ninety-nine percent of facilities in Malawi and 94% of facilities in Tanzania attended by non-severe suspected malaria cases had ACTs available. This is notable in that the availability of ACTs was not a prohibitive factor in a provider’s decision to test a non-severe suspected malaria patient for malaria.
4.2 Study Limitations
One important limitation of this study is the definition of a suspected malaria case. According to the WHO algorithm for malaria diagnosis and treatment for the first visit in highly endemic areas, all patients presenting with a history of fever, temperature ≥37.5°C, palmar pallor, or anyone with a hemoglobin level < 8 g/dl should also be tested for malaria. One limitation in the definition of a suspected malaria case is the assumption of fever history. For this analysis we are basing the history of a child’s fever on the caregiver’s recall in the sick child caretaker exit interview and not the actual temperature of the child, since this is not recorded as part of the observation protocol. Though the exit interview has been shown to be a good proxy of malaria case management [45], the caregiver’s exit interview is subject not only to recall bias (fever history in the past two days), but also to question-order bias. For example, the caregiver’s exit interview takes place after the observation of the sick child care. If the provider did not ask about fever or take the child’s temperature during the observation, the caregiver might state in the exit interview that the child did not have a fever, or vice versa. Also, for this analysis we do not know if the child had palmar pallor or know the child’s hemoglobin level.
Another limitation is that for this analysis we do not know for certain whether the child had severe malaria. The IMCI protocol for fever patients is different when a child is presenting with danger signs or stiff neck. When children present with general danger signs, they should be referred or admitted to an inpatient facility. We attempted to control for this in the analysis by excluding children who presented at a hospital or were referred/admitted at the end of the consultation, but the severity of symptoms is unknown based on data in the SPA.
SPA data are extremely valuable in that they provide insight into the quality of clinical care through the observation of sick child care. However, the observation portion of the SPA has limitations. The Hawthorne effect occurs when individuals change their behavior in response to their awareness of being observed. Since the providers know they are being observed, they might change their behavior to what is expected
25
rather than behaving as they typically do when a child presents with a history of fever. Another limitation is that the interviewer who is observing the sick child care consultation might not have observed all aspects of the care provided. Many times, health workers other than the primary provider routinely perform certain measurements (e.g., taking temperature, checking for palmar pallor) separately from the actual consultation. Since the interviewer did not observe these aspects of care, they might not be reflected in the data for observation consultation. Lastly, observers used a checklist to indicate whether a measurement was taken, a practice was applied, or a piece of information was shared between the provider and the client. They did not attempt to verify whether the practice was correct or if the information was accurate or complete.
Another limitation is that we do not know if a provider performed an mRDT test during the observation. While most facilities perform mRDT tests at the laboratory, in lower-level facilities the providers often do the mRDT tests themselves. Although the Malawi SPA tried to capture this information with a country-specific limited re-examination protocol, this information is still not verified. In the core SPA Sick Child Caretaker Exit Interview Questionnaire the caregiver is asked, “Did the provider instruct you to take [NAME] to see another provider or to a laboratory for a finger or heel stick for blood to be taken for a test?” This is the only information we have about an mRDT being conducted. The provider performing the mRDT is also not captured in the Observation of Sick Child Care Consultation. Future versions of the SPA questionnaire should include an option in the “Other Assessments” portion of the Observation of Sick Child Care Consultation about whether the provider performed an mRDT during the consultation.
Finally, malaria endemicity and seasonality in this analysis are only an estimation of malaria risk. The variable for malaria endemicity is a modeled (5km x 5km) estimate of malaria prevalence that we are assigning to the GPS location of the health facility. Some patients travel over 5km to reach a health care facility and could thus be traveling from a lower-risk area to a high-risk area, based on the modeled estimates. Moreover, the categorization of peak and nonpeak malaria season is an estimate based on the month of the survey fieldwork. Country malaria transmission seasons change yearly by location, and in some years the rainy season starts earlier or is worse than in previous years. These factors are not completely captured in this analysis.
4.3 Conclusions
This report investigated the factors associated with quality of diagnostic services for non-severe suspected malaria cases through the examination of data from the observation of sick child consultations and the exit interview of caretakers from the Malawi and Tanzania SPA surveys of health facilities.
In both Malawi and Tanzania, overall adherence to the three elements of clinical quality of diagnosis for non-severe suspected malaria cases was low. This finding is similar to other studies in Malawi and Tanzania [46-48]. In both Malawi and Tanzania, the age of child, malaria endemicity/seasonality, and facilities having adequate supplies for diagnostic testing were significant factors for children receiving all three elements of quality of care. Also, non-severe suspected malaria cases observed at government/public facilities were less likely to receive all three elements of clinical care compared with children observed at private/mission/other facilities, although further exploration into this result is needed.
IMCI guidelines in conjunction with the T3 initiative provide clear guidance for the diagnosis, testing, and treatment for non-severe suspected malaria cases; however, providers at health facilities do not always follow these recommended steps. This study explored the quality of malaria services with the goal of better
26
informing health care providers and policymakers about factors that might influence whether a child receives the proper care when presenting to a facility with non-severe suspected malaria. While the study found that factors related to characteristics of the provider and the facility had the most influence on the quality of diagnostic services, it is important that providers always adhere to guidance for non-severe suspected malaria cases presenting at a facility.
27
REFERENCES
1. World Health Organization. Malaria Fact Sheets. 2019; Available from: https://www.who.int/news-room/fact-sheets/detail/malaria.
2. Gera, T., D. Shah, P. Garner, M. Richardson, and H.S. Sachdev, Integrated management of childhood illness (IMCI) strategy for children under five. Cochrane Database of Systematic Reviews, 2016(6). https://doi.org/10.1002/14651858.CD010123.pub2.
3. World Health Organization, IMCI chart booklet. 2014.
4. World Health Organization. Integrated Management of Childhood Illness (IMCI). 2018;
Available from: https://www.who.int/maternal_child_adolescent/topics/child/imci/en/.
5. World Health Organization. T3: Test. Treat. Track initiative. 2012; Available from: https://www.who.int/malaria/areas/test_treat_track/en/.
6. World Health Organization, Universal access to malaria diagnostic testing – An operational
manual, 2013.
7. World Health Organization, Guidelines for the treatment of malaria. Third edition, 2015.
8. Zurovac, D., S. Githinji, D. Memusi, S. Kigen, B. Machini, A. Muturi, G. Otieno, R.W. Snow, and A. Nyandigisi, Major Improvements in the Quality of Malaria Case-Management under the “Test and Treat” Policy in Kenya. PLOS ONE, 2014. 9(3): p. e92782. https://dx.doi.org/10.1371%2Fjournal.pone.0092782.
9. Graz, B., M. Willcox, T. Szeless, and A. Rougemont, “Test and treat” or presumptive treatment for malaria in high transmission situations? A reflection on the latest WHO guidelines. Malaria Journal, 2011. 10(1): p. 136. https://doi.org/10.1186/1475-2875-10-136.
10. Johansson, E.W., K.E. Selling, H. Nsona, B. Mappin, P.W. Gething, M. Petzold, S.S. Peterson, and H. Hildenwall, Integrated paediatric fever management and antibiotic over-treatment in Malawi health facilities: data mining a national facility census. Malaria Journal, 2016. 15(1): p. 396. https://doi.org/10.1186/s12936-016-1439-7.
11. Bennett, A., T. Eisele, J. Keating, and J. Yukich, Global trends in care seeking and access to diagnosis and treatment of childhood illnesses, in DHS Working Papers No. 116, 2015, ICF International: Rockville, Maryland, USA.
12. Shayo, E.H., S.F. Rumisha, M.R. Mlozi, V.M. Bwana, B.K. Mayala, R.C. Malima, T. Mlacha,
and L.E. Mboera, Social determinants of malaria and health care seeking patterns among rice farming and pastoral communities in Kilosa District in central Tanzania. Acta Trop, 2015. 144: p. 41-9. https://doi.org/10.1016/j.actatropica.2015.01.003.
13. Mitiku, I. and A. Assefa, Caregivers’ perception of malaria and treatment-seeking behaviour for
under five children in Mandura District, West Ethiopia: a cross-sectional study. Malaria Journal, 2017. 16(1): p. 144-144. https://doi.org/10.1186/s12936-017-1798-8.
28
14. Chukwuocha, U.M., A.C. Okpanma, G.C. Nwakwuo, and I.N. Dozie, Determinants of delay in seeking malaria treatment for children under-five years in parts of South Eastern Nigeria. J Community Health, 2014. 39(6): p. 1171-8. https://doi.org/10.1007/s10900-014-9872-4.
15. Ibe, O.P., L. Mangham-Jefferies, B. Cundill, V. Wiseman, B.S. Uzochukwu, and O.E.
Onwujekwe, Quality of care for the treatment for uncomplicated malaria in South-East Nigeria: how important is socioeconomic status? International journal for equity in health, 2015. 14: p. 19-19. https://dx.doi.org/10.1186%2Fs12939-015-0150-6.
16. Onwujekwe, O., E. Obikeze, B. Uzochukwu, I. Okoronkwo, and O.C. Onwujekwe, Improving
quality of malaria treatment services: assessing inequities in consumers’ perceptions and providers’ behaviour in Nigeria. International journal for equity in health, 2010. 9: p. 22-22. https://dx.doi.org/10.1186%2F1475-9276-9-22.
17. Diggle, E., R. Asgary, G. Gore-Langton, E. Nahashon, J. Mungai, R. Harrison, A. Abagira, K.
Eves, Z. Grigoryan, D. Soti, E. Juma, and R. Allan, Perceptions of malaria and acceptance of rapid diagnostic tests and related treatment practises among community members and health care providers in Greater Garissa, North Eastern Province, Kenya. Malaria Journal, 2014. 13(1): p. 502. https://dx.doi.org/10.1186%2F1475-2875-13-502.
18. Huicho, L., R.W. Scherpbier, A.M. Nkowane, and C.G. Victora, How much does quality of child
care vary between health workers with differing durations of training? An observational multicountry study. Lancet, 2008. 372(9642): p. 910-6. https://doi.org/10.1016/S0140-6736(08)61401-4.
19. Edward, A., V. Dwivedi, L. Mustafa, P.M. Hansen, D.H. Peters, and G. Burnham, Trends in the
quality of health care for children aged less than 5 years in Afghanistan, 2004-2006. Bulletin of the World Health Organization, 2009. 87(12): p. 940-949. https://doi.org/10.2471/BLT.08.054858.
20. Arifeen, S.E., J. Bryce, E. Gouws, A.H. Baqui, R.E. Black, D.M. Hoque, E.K. Chowdhury, M.
Yunus, N. Begum, T. Akter, and A. Siddique, Quality of care for under-fives in first-level health facilities in one district of Bangladesh. Bulletin of the World Health Organization, 2005. 83(4): p. 260-7.
21. Uwemedimo, O.T., T.P. Lewis, E.A. Essien, G.J. Chan, H. Nsona, M.E. Kruk, and H.H. Leslie,
Distribution and determinants of pneumonia diagnosis using Integrated Management of Childhood Illness guidelines: a nationally representative study in Malawi. BMJ Glob Health, 2018. 3(2): p. 2017-000506. https://doi.org/10.1136/bmjgh-2017-000506.
22. Steinhardt, L.C., J. Chinkhumba, A. Wolkon, M. Luka, M. Luhanga, J. Sande, J. Oyugi, D. Ali,
D. Mathanga, and J. Skarbinski, Patient-, health worker-, and health facility-level determinants of correct malaria case management at publicly funded health facilities in Malawi: results from a nationally representative health facility survey. Malaria Journal, 2014. 13(1): p. 64. https://doi.org/10.1186/1475-2875-13-64.
23. Mokuolu, O.A., O.O. Ajumobi, G.N. Ntadom, O.T. Adedoyin, A.A. Roberts, C.O. Agomo, K.U.
Edozieh, H.U. Okafor, R.D. Wammanda, F.A. Odey, I.K. Maikore, O.O. Abikoye, A.D. Alabi, C. Amajoh, and B.M. Audu, Provider and patient perceptions of malaria rapid diagnostic test use in Nigeria: a cross-sectional evaluation. Malaria Journal, 2018. 17(1): p. 200. https://doi.org/10.1186/s12936-018-2346-x.
29
24. Rowe, A.K., D. de Savigny, C.F. Lanata, and C.G. Victora, How can we achieve and maintain high-quality performance of health workers in low-resource settings? Lancet, 2005. 366(9490): p. 1026-35. https://doi.org/10.1016/S0140-6736(05)67028-6.
25. Lee, E.H., C.H. Olsen, T. Koehlmoos, P. Masuoka, A. Stewart, J.W. Bennett, and J. Mancuso, A
cross-sectional study of malaria endemicity and health system readiness to deliver services in Kenya, Namibia and Senegal. Health Policy Plan, 2017. 32(suppl_3). https://doi.org/10.1093/heapol/czx114.
26. Poyer, S., T. Shewchuk, S. Tougher, Y. Ye, A.G. Mann, B.A. Willey, R. Thomson, J.H. Amuasi,
R. Ren, M. Wamukoya, M. Taylor, S.B. Nguah, B. Mberu, A. Kalolella, E. Juma, C. Festo, B. Johanes, G. Diap, K. Bruxvoort, D. Ansong, K. Hanson, F. Arnold, and C. Goodman, Availability and price of malaria rapid diagnostic tests in the public and private health sectors in 2011: results from 10 nationally representative cross-sectional retail surveys. Trop Med Int Health, 2015. 20(6): p. 744-56. https://doi.org/10.1111/tmi.12491.
27. Johansson, E.W., H. Nsona, L. Carvajal-Aguirre, A. Amouzou, and H. Hildenwall, Determinants
of Integrated Management of Childhood Illness (IMCI) non-severe pneumonia classification and care in Malawi health facilities: Analysis of a national facility census. J Glob Health, 2017. 7(2): p. 020408. https://doi.org/10.7189/jogh.07.020408.
28. Kruk, M.E., A. Chukwuma, G. Mbaruku, and H.H. Leslie, Variation in quality of primary-care
services in Kenya, Malawi, Namibia, Rwanda, Senegal, Uganda and United Republic of Tanzania. 95(6). http://dx.doi.org/10.2471/BLT.16.175869.
29. Kazembe, L.N., I. Kleinschmidt, T.H. Holtz, and B.L. Sharp, Spatial analysis and mapping of
malaria risk in Malawi using point-referenced prevalence of infection data. International journal of health geographics, 2006. 5: p. 41-41. https://dx.doi.org/10.1186%2F1476-072X-5-41.
30. President’s Malaria Initiative, Malawi-Malaria Operational Plan 2018. 31. Malawi National Malaria Control Programme, Guidelines for the Treatment fo Malaria in
Malawi, 2013. 32. National Malaria Control Programme-The United Republic of Tanzania, National Malaria
Strategic Plan 2014–2020, 2014. 33. Zanzibar Malaria Elimination Programme-Revolutionary Government of Zanizbar Ministry of
Health, Zanzibar Malaria Elimination Strategic Plan IV 2018/19-2022/23, 2017. 34. United Republic of Tanzania, National Guidelines for Diagnosis and Treatment of Malaria,
National Malaria Control Programme, Editor 2014. 35. Zurovac, D. and A.K. Rowe, Quality of treatment for febrile illness among children at outpatient
facilities in sub-Saharan Africa. Ann Trop Med Parasitol, 2006. 100(4): p. 283-96. https://doi.org/10.1179/136485906X105633.
36. Leslie, H.H., A. Malata, Y. Ndiaye, and M.E. Kruk, Effective coverage of primary care services
in eight high-mortality countries. BMJ Global Health, 2017. 2(3): p. e000424. http://orcid.org/0000-0002-7464-3645.
30
37. Zurovac, D., A. Rowe, S. Ochola, A. Noor, B. Midia, M. English, and R. Snow, Predictors of the quality of health worker treatment practices for uncomplicated malaria at government health facilities in Kenya. International Journal of Epidemiology, 2004. 33(5): p. 1080-1091. https://doi.org/10.1093/ije/dyh253.
38. Steinhardt, L.C., F. Onikpo, J. Kouamé, E. Piercefield, M. Lama, M.S. Deming, and A.K. Rowe,
Predictors of health worker performance after Integrated Management of Childhood Illness training in Benin: a cohort study. BMC Health Services Research, 2015. 15(1): p. 276. https://doi.org/10.1186/s12913-015-0910-4.
39. Naimoli, J.F., A.K. Rowe, A. Lyaghfouri, R. Larbi, and L.A. Lamrani, Effect of the Integrated
Management of Childhood Illness strategy on health care quality in Morocco. International Journal for Quality in Health Care, 2006. 18(2): p. 134-144. https://doi.org/10.1093/intqhc/mzi097.
40. Lee, E.H., C.H. Olsen, T. Koehlmoos, P. Masuoka, A. Stewart, J.W. Bennett, and J. Mancuso, A
cross-sectional study of malaria endemicity and health system readiness to deliver services in Kenya, Namibia and Senegal. Health Policy and Planning, 2017. 32(suppl_3): p. iii75-iii87. https://doi.org/10.1093/heapol/czx114.
41. Plucinski, M.M., M. Ferreira, C.M. Ferreira, J. Burns, P. Gaparayi, L. Joao, O. da Costa, P. Gill,
C. Samutondo, J. Quivinja, E. Mbounga, G.P. de Leon, E.S. Halsey, P.R. Dimbu, and F. Fortes, Evaluating malaria case management at public health facilities in two provinces in Angola. Malar J, 2017. 16(1): p. 017-1843. https://doi.org/10.1186/s12936-017-1843-7.
42. Usman, R., A.A. Umar, S. Gidado, A.A. Gobir, I.F. Obi, I. Ajayi, and O. Ajumobi, Predictors of
malaria Rapid Diagnostic Tests’ utilisation among healthcare workers in Zamfara State. PLOS ONE, 2018. 13(12): p. e0200856. https://doi.org/10.1371/journal.pone.0200856.
43. Taylor, C., A. Linn, W. Wang, and H. Moussa, Gaps in service utilization and service provision:
An analysis of DHS and SPA malaria data from Malawi, Senegal, and Tanzania, in DHS Analytical Studies No. 67, 2018, ICF: Rockville, Maryland, USA.
44. Bennett, A., A.L.V. Avanceña, J. Wegbreit, C. Cotter, K. Roberts, and R. Gosling, Engaging the
private sector in malaria surveillance: a review of strategies and recommendations for elimination settings. Malaria Journal, 2017. 16(1): p. 252-252. https://doi.org/10.1186/s12936-017-1901-1.
45. Pulford, J., P.M. Siba, I. Mueller, and M.W. Hetzel, The exit interview as a proxy measure of
malaria case management practice: sensitivity and specificity relative to direct observation. BMC Health Services Research, 2014. 14(1): p. 628. https://doi.org/10.1186/s12913-014-0628-8.
46. Eriksen, J., G. Tomson, P. Mujinja, M.Y. Warsame, A. Jahn, and L.L. Gustafsson, Assessing
health worker performance in malaria case management of underfives at health facilities in a rural Tanzanian district. Tropical Medicine & International Health, 2007. 12(1): p. 52-61. https://doi.org/10.1111/j.1365-3156.2006.01753.x.
47. Johansson, E.W., K.E. Selling, H. Nsona, B. Mappin, P.W. Gething, M. Petzold, S.S. Peterson,
and H. Hildenwall, Integrated paediatric fever management and antibiotic over-treatment in Malawi health facilities: data mining a national facility census. Malaria Journal, 2016. 15(1): p. 396. https://doi.org/10.1186/s12936-016-1439-7.
31
48. Steinhardt, L.C., J. Chinkhumba, A. Wolkon, M. Luka, M. Luhanga, J. Sande, J. Oyugi, D. Ali, D. Mathanga, and J. Skarbinski, Quality of malaria case management in Malawi: results from a nationally representative health facility survey. PLOS ONE, 2014. 9(2): p. e89050-e89050. https://doi.org/10.1371/journal.pone.0089050.

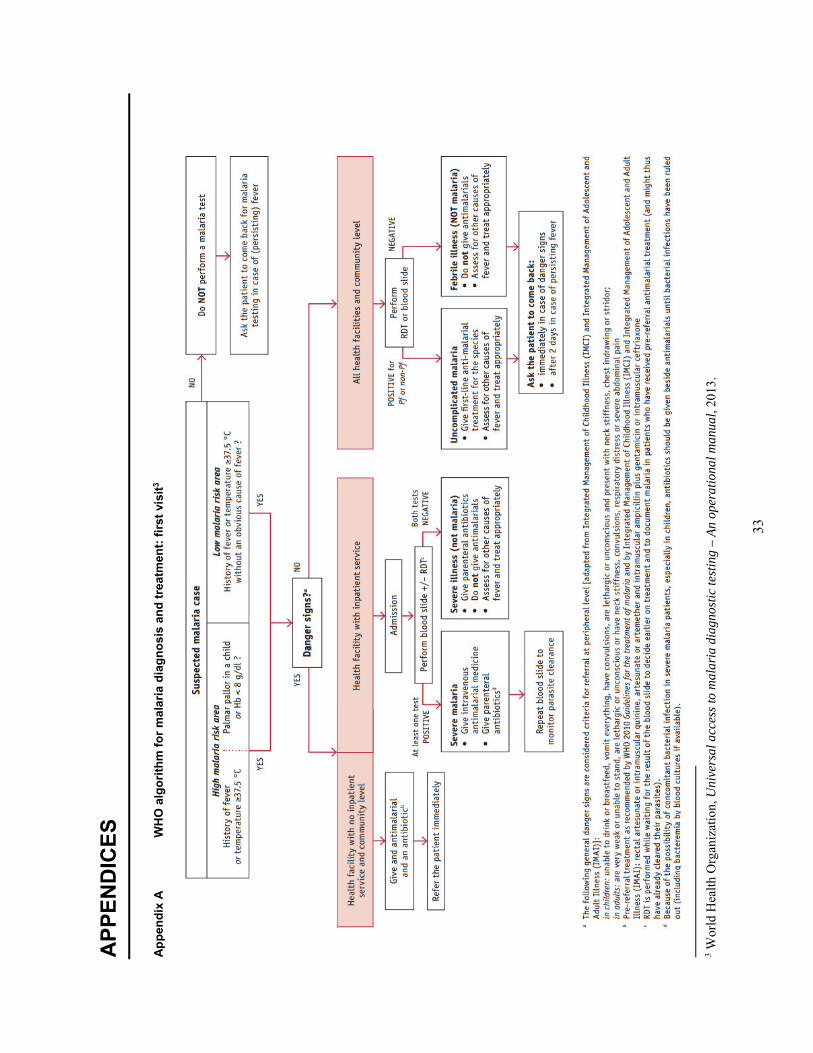
33
APP
END
ICES
Appe
ndix
A
WH
O a
lgor
ithm
for m
alar
ia d
iagn
osis
and
trea
tmen
t: fir
st v
isit3
3 W
orld
Hea
lth O
rgan
izat
ion,
Uni
vers
al a
cces
s to
mal
aria
dia
gnos
tic te
stin
g –
An o
pera
tiona
l man
ual,
2013
.
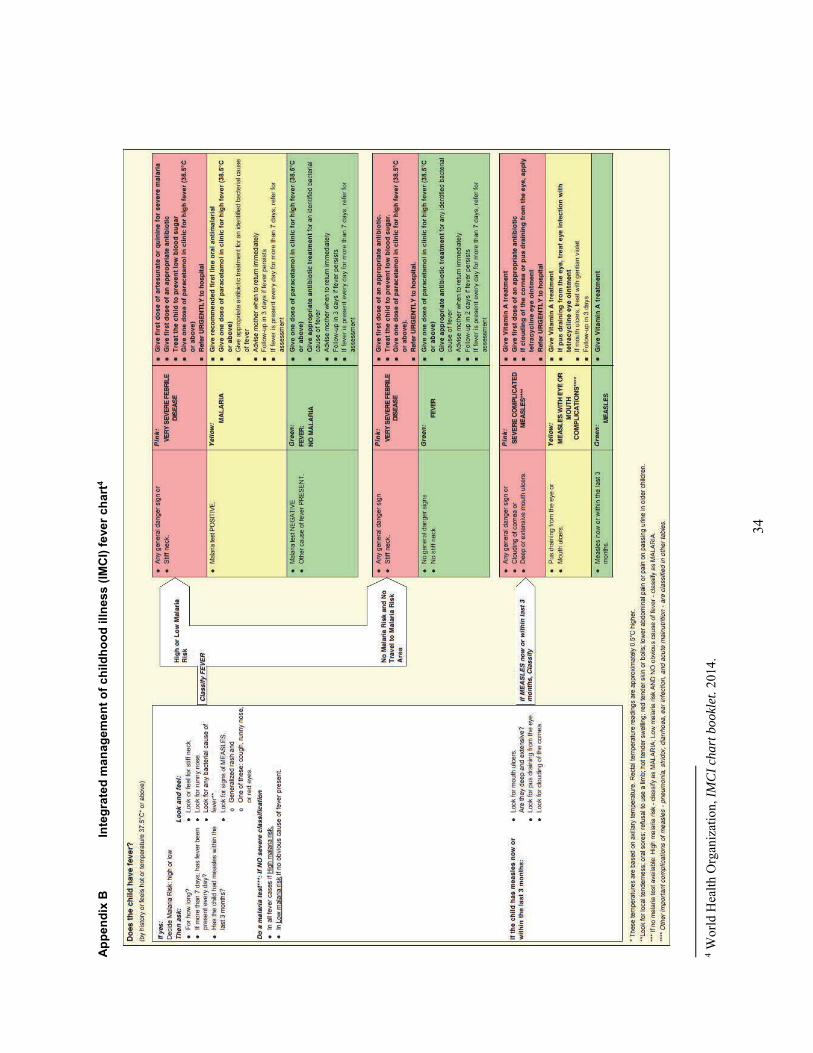
34
Appe
ndix
B
Inte
grat
ed m
anag
emen
t of c
hild
hood
illn
ess
(IMC
I) fe
ver c
hart
4
4 Wor
ld H
ealth
Org
aniz
atio
n, IM
CI c
hart
boo
klet
. 201
4.

![FASSST a new gas phase analytical tool - Physicsuwave/2013site/Resources/pdf scans/… · Volume 70, Number 21, Pages 719A-727A . Instrumentation FASSST] A New Gas-Phase Analytical](https://img.pdfslide.us/doc/110x75/5f06e1127e708231d41a30d1/fassst-a-new-gas-phase-analytical-tool-uwave2013siteresourcespdf-scans-volume.jpg)