Embed Size (px)
Citation preview

DHHS COE Meeting Agenda
□Welcome□Introductions□Contract Compliance Reporting□Questions and Answers□Contract Updates
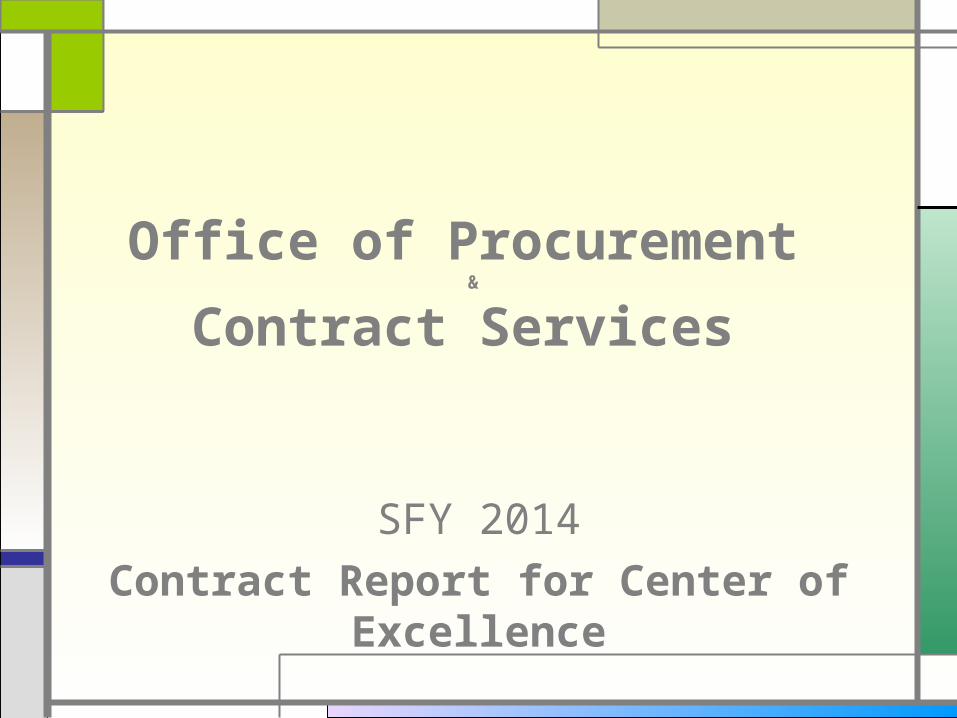
Office of Procurement &
Contract Services
SFY 2014Contract Report for Center of
Excellence
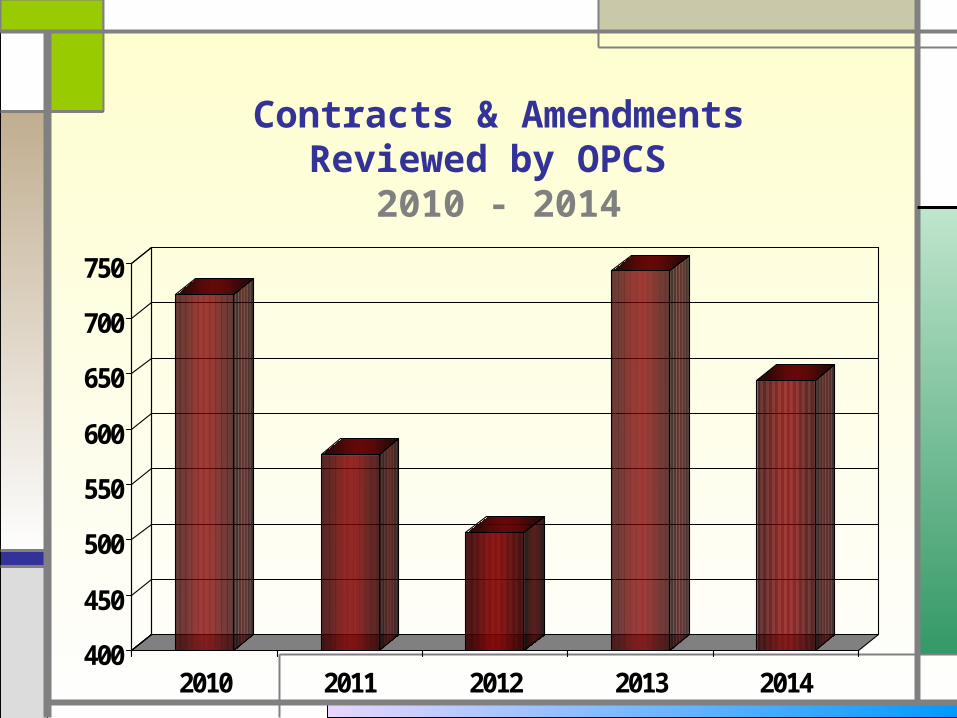
Contracts & AmendmentsReviewed by OPCS
2010 - 2014
400
450
500
550
600
650
700
750
2010 2011 2012 2013 2014
Average Number of Days Comparison
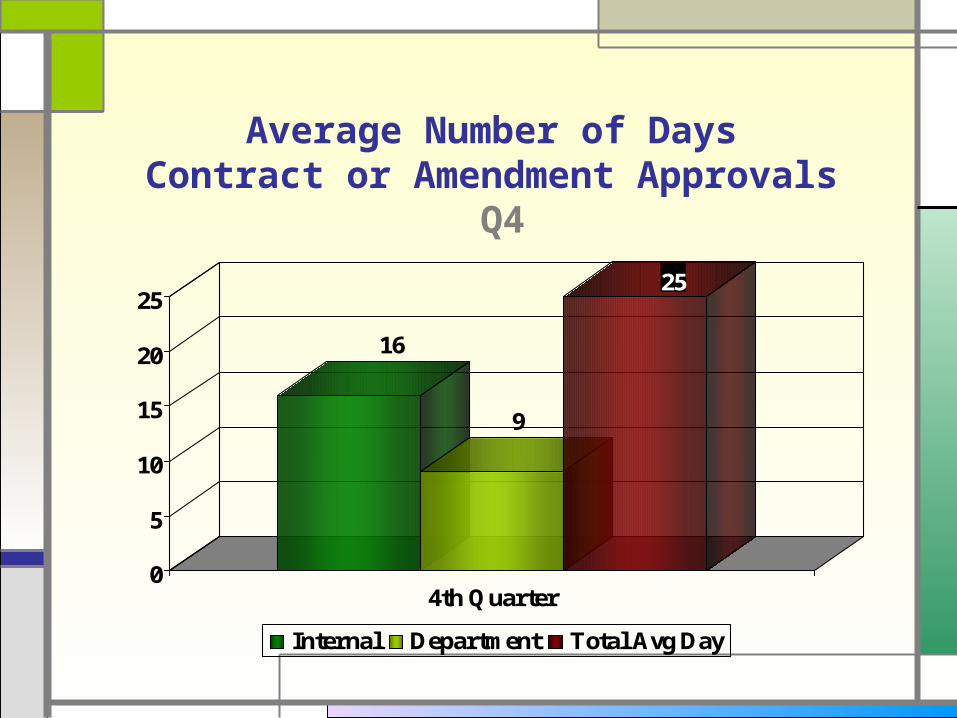
Average Number of Days Contract or Amendment
Approvals Q4
16
9
25
0
5
10
15
20
25
4th Quarter
Internal Department Total Avg Day
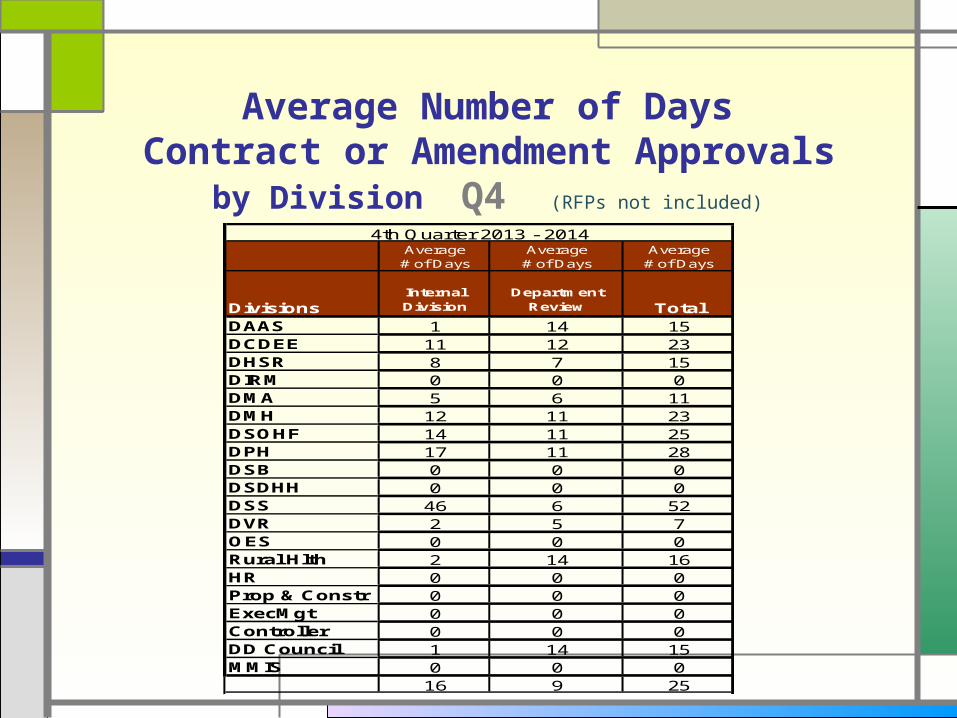
Average Number of Days Contract or Amendment
Approvals by Division Q4 (RFPs not included)
Average# of Days
Average# of Days
Average# of Days
DivisionsInternal Division
DepartmentReview Total
DAAS 1 14 15DCDEE 11 12 23DHSR 8 7 15DIRM 0 0 0DMA 5 6 11DMH 12 11 23DSOHF 14 11 25DPH 17 11 28DSB 0 0 0DSDHH 0 0 0DSS 46 6 52DVR 2 5 7OES 0 0 0Rural Hlth 2 14 16HR 0 0 0Prop & Constr 0 0 0ExecMgt 0 0 0Controller 0 0 0DD Council 1 14 15MMIS 0 0 0
16 9 25
4th Quarter 2013 - 2014
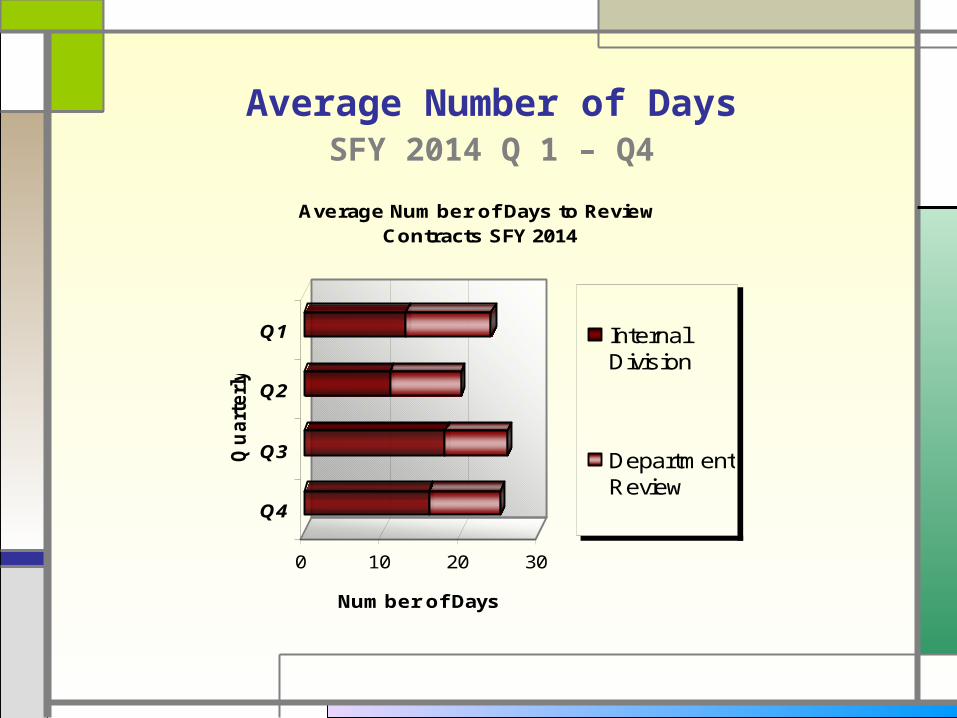
Average Number of Days SFY 2014 Q 1 – Q4
0 10 20 30
Number of Days
Q1
Q2
Q3
Q4
Qu
art
erl
y
Average Number of Days to Review Contracts SFY 2014
Internal Division
DepartmentReview
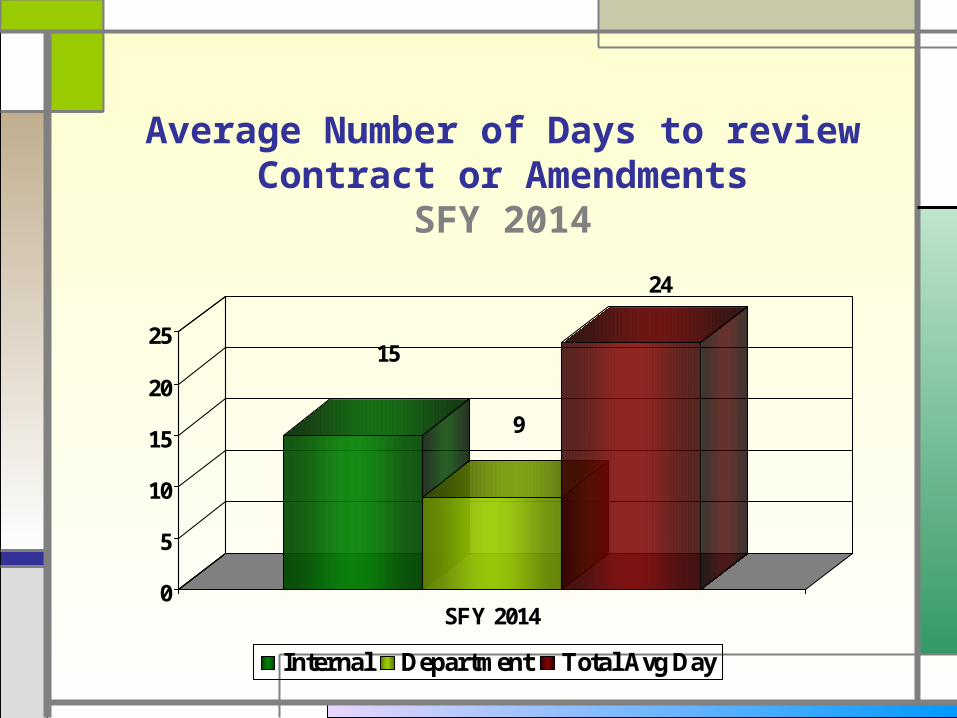
Average Number of Days to review Contract or Amendments
SFY 2014
15
9
24
0
5
10
15
20
25
SFY 2014
Internal Department Total Avg Day
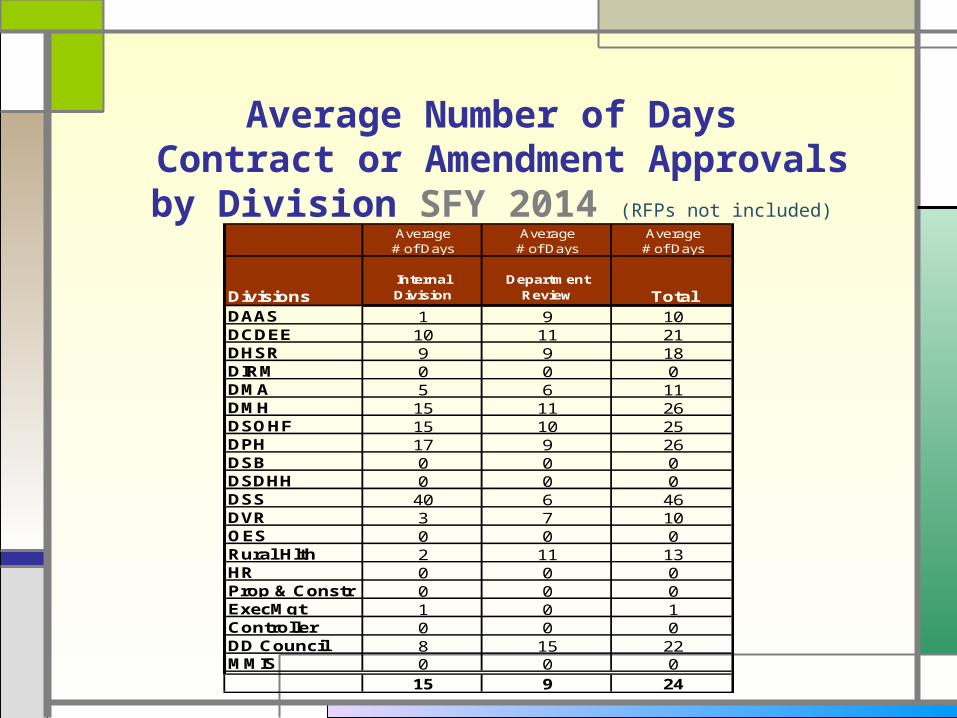
Average Number of Days Contract or Amendment
Approvalsby Division SFY 2014 (RFPs not included) Average
# of DaysAverage# of Days
Average# of Days
DivisionsInternal Division
DepartmentReview Total
DAAS 1 9 10DCDEE 10 11 21DHSR 9 9 18DIRM 0 0 0DMA 5 6 11DMH 15 11 26DSOHF 15 10 25DPH 17 9 26DSB 0 0 0DSDHH 0 0 0DSS 40 6 46DVR 3 7 10OES 0 0 0Rural Hlth 2 11 13HR 0 0 0Prop & Constr 0 0 0ExecMgt 1 0 1Controller 0 0 0DD Council 8 15 22MMIS 0 0 0
15 9 24
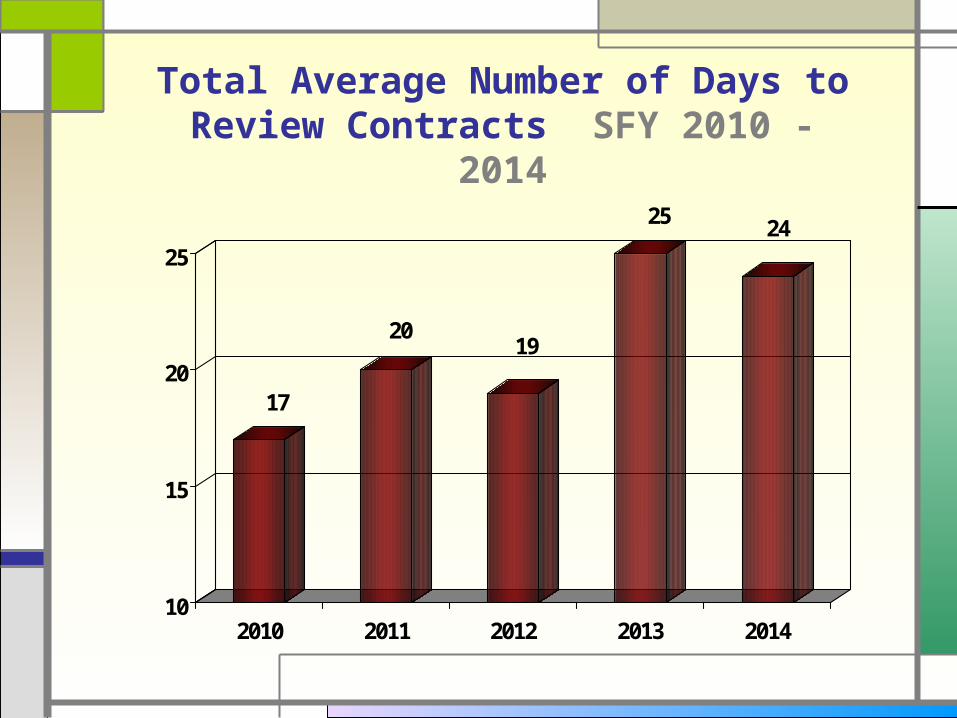
Total Average Number of Days to Review Contracts SFY 2010 -
2014
17
2019
25 24
10
15
20
25
2010 2011 2012 2013 2014
Timely Approvals Comparison
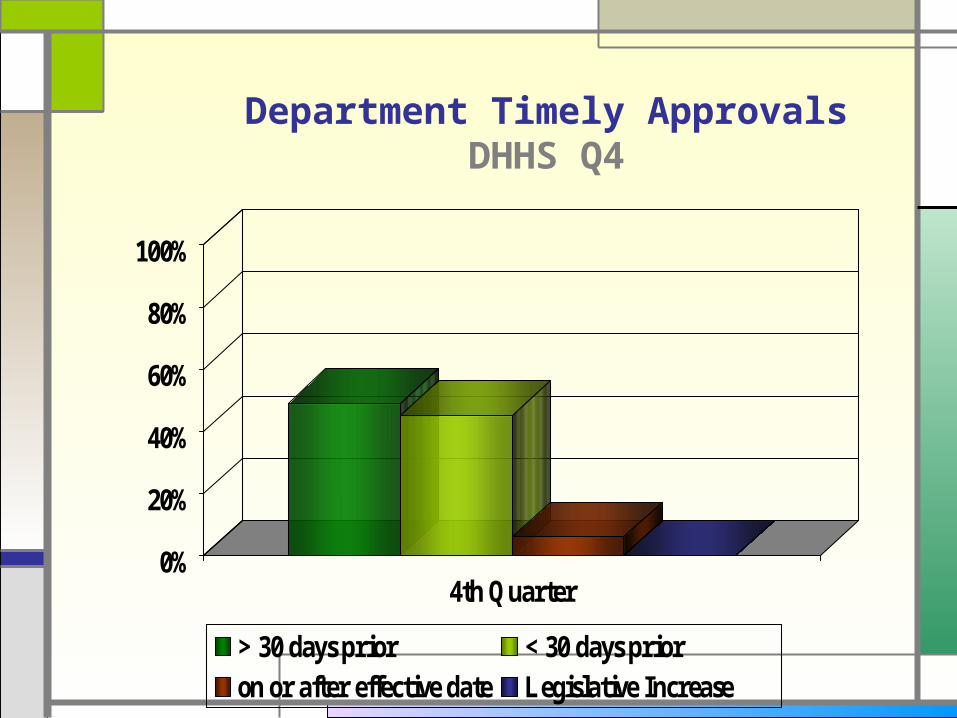
Department Timely ApprovalsDHHS Q4
0%
20%
40%
60%
80%
100%
4th Quarter
> 30 days prior < 30 days prior on or after effective date Legislative Increase
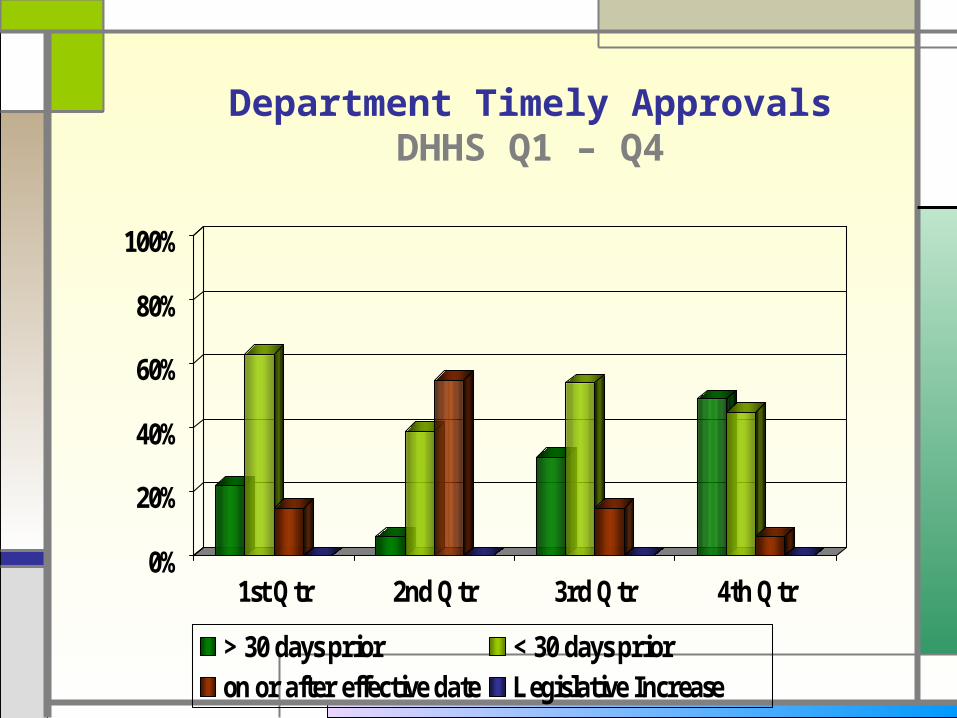
Department Timely ApprovalsDHHS Q1 – Q4
0%
20%
40%
60%
80%
100%
1st Qtr 2nd Qtr 3rd Qtr 4th Qtr
> 30 days prior < 30 days prior on or after effective date Legislative Increase
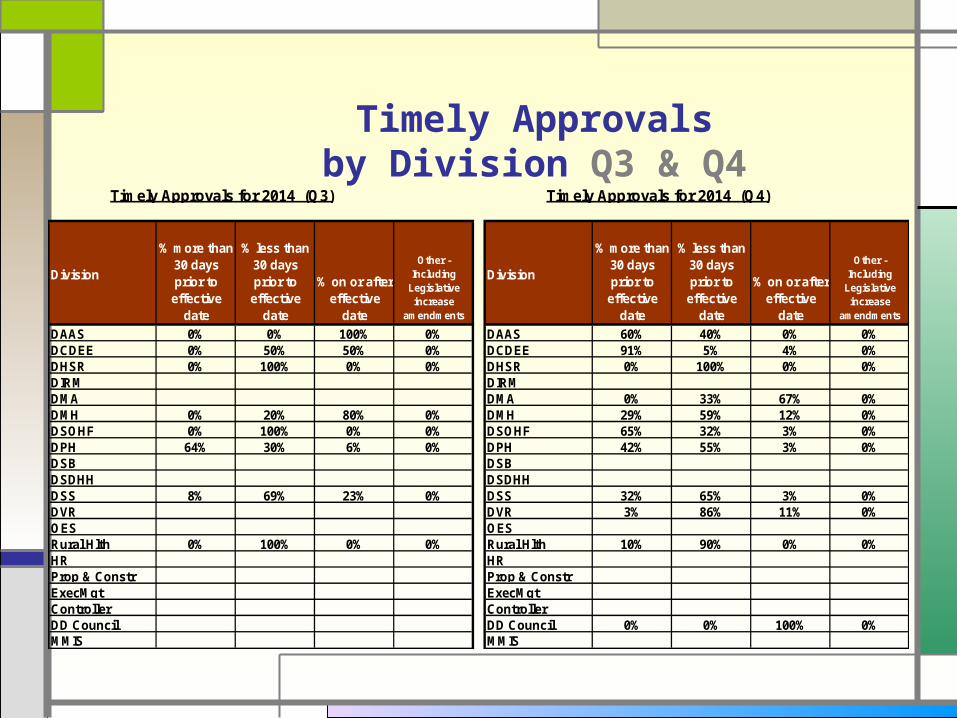
Timely Approvalsby Division Q3 & Q4
Division
% more than 30 days prior to
effective date
% less than 30 days prior to
effective date
% on or after effective
date
Other - Including
Legislative increase
amendments
Division
% more than 30 days prior to
effective date
% less than 30 days prior to
effective date
% on or after effective
date
Other - Including
Legislative increase
amendments
DAAS 0% 0% 100% 0% DAAS 60% 40% 0% 0%DCDEE 0% 50% 50% 0% DCDEE 91% 5% 4% 0%DHSR 0% 100% 0% 0% DHSR 0% 100% 0% 0%DIRM DIRMDMA DMA 0% 33% 67% 0%DMH 0% 20% 80% 0% DMH 29% 59% 12% 0%DSOHF 0% 100% 0% 0% DSOHF 65% 32% 3% 0%DPH 64% 30% 6% 0% DPH 42% 55% 3% 0%DSB DSBDSDHH DSDHHDSS 8% 69% 23% 0% DSS 32% 65% 3% 0%DVR DVR 3% 86% 11% 0%OES OESRural Hlth 0% 100% 0% 0% Rural Hlth 10% 90% 0% 0%HR HRProp & Constr Prop & ConstrExecMgt ExecMgtController ControllerDD Council DD Council 0% 0% 100% 0%MMIS MMIS
Timely Approvals for 2014 (Q3) Timely Approvals for 2014 (Q4)
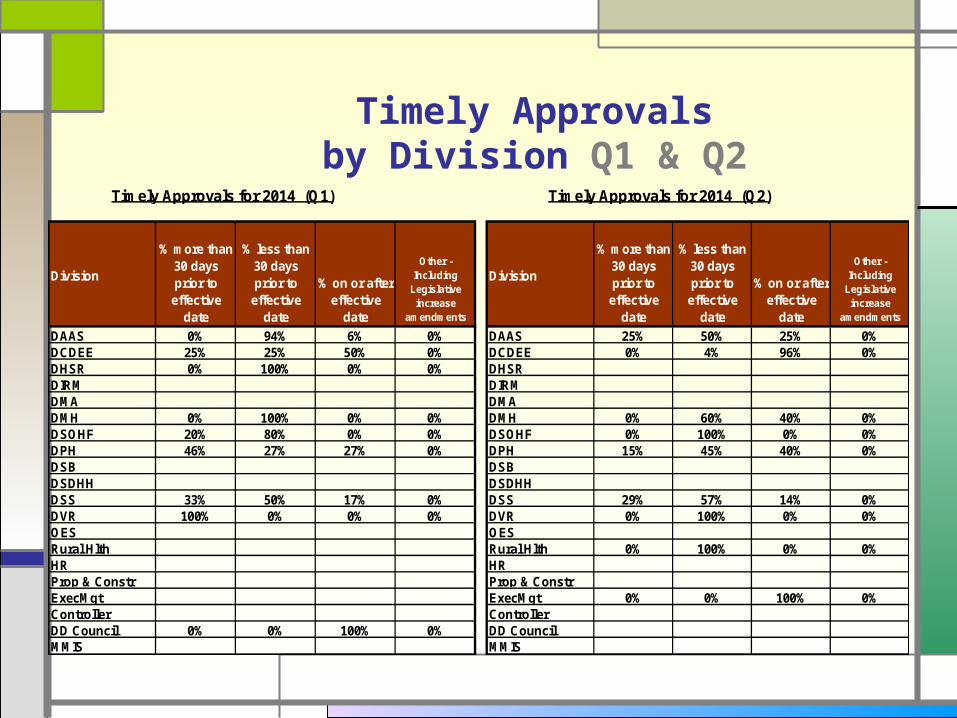
Timely Approvalsby Division Q1 & Q2
Division
% more than 30 days prior to
effective date
% less than 30 days prior to
effective date
% on or after effective
date
Other - Including
Legislative increase
amendments
Division
% more than 30 days prior to
effective date
% less than 30 days prior to
effective date
% on or after effective
date
Other - Including
Legislative increase
amendments
DAAS 0% 94% 6% 0% DAAS 25% 50% 25% 0%DCDEE 25% 25% 50% 0% DCDEE 0% 4% 96% 0%DHSR 0% 100% 0% 0% DHSRDIRM DIRMDMA DMADMH 0% 100% 0% 0% DMH 0% 60% 40% 0%DSOHF 20% 80% 0% 0% DSOHF 0% 100% 0% 0%DPH 46% 27% 27% 0% DPH 15% 45% 40% 0%DSB DSBDSDHH DSDHHDSS 33% 50% 17% 0% DSS 29% 57% 14% 0%DVR 100% 0% 0% 0% DVR 0% 100% 0% 0%OES OESRural Hlth Rural Hlth 0% 100% 0% 0%HR HRProp & Constr Prop & ConstrExecMgt ExecMgt 0% 0% 100% 0%Controller ControllerDD Council 0% 0% 100% 0% DD CouncilMMIS MMIS
Timely Approvals for 2014 (Q2)Timely Approvals for 2014 (Q1)
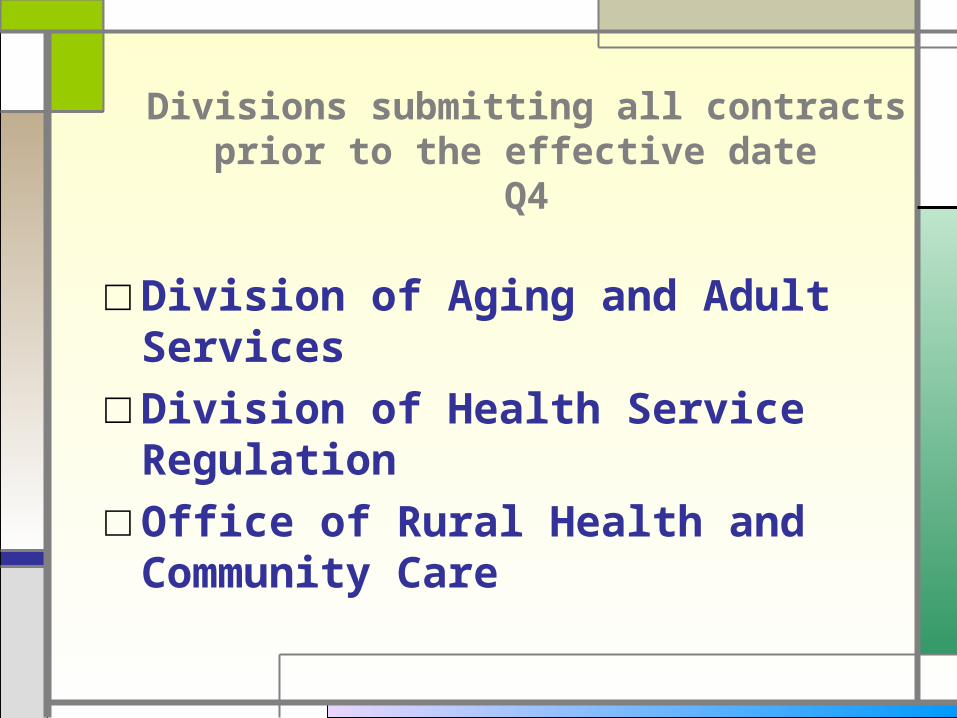
Divisions submitting all contracts prior to the effective date
Q4
□Division of Aging and Adult Services
□Division of Health Service Regulation
□Office of Rural Health and Community Care
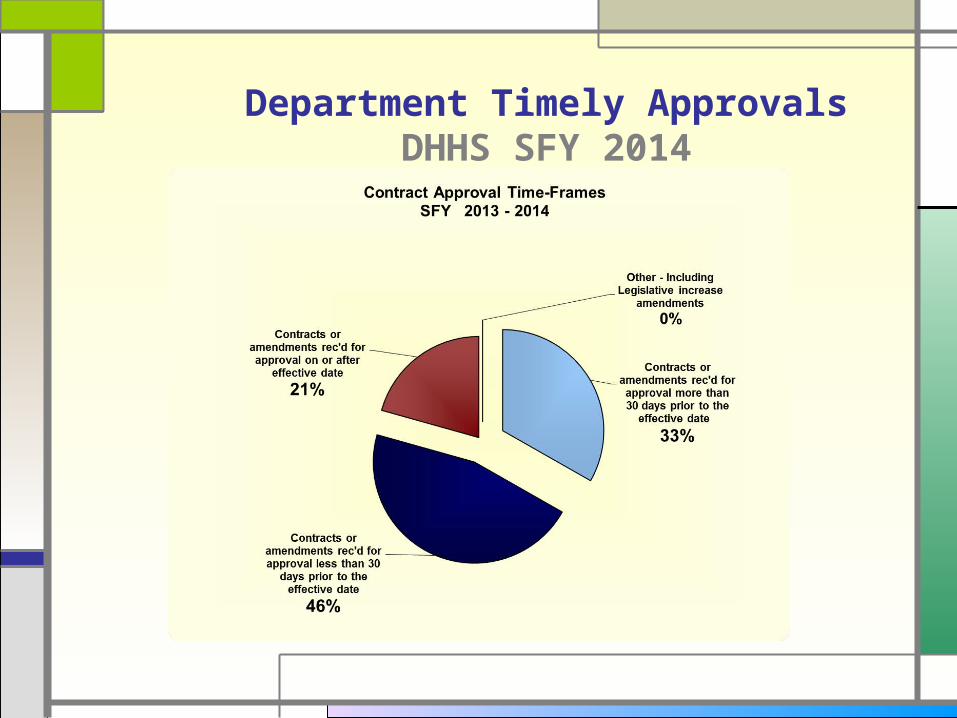
Department Timely ApprovalsDHHS SFY 2014
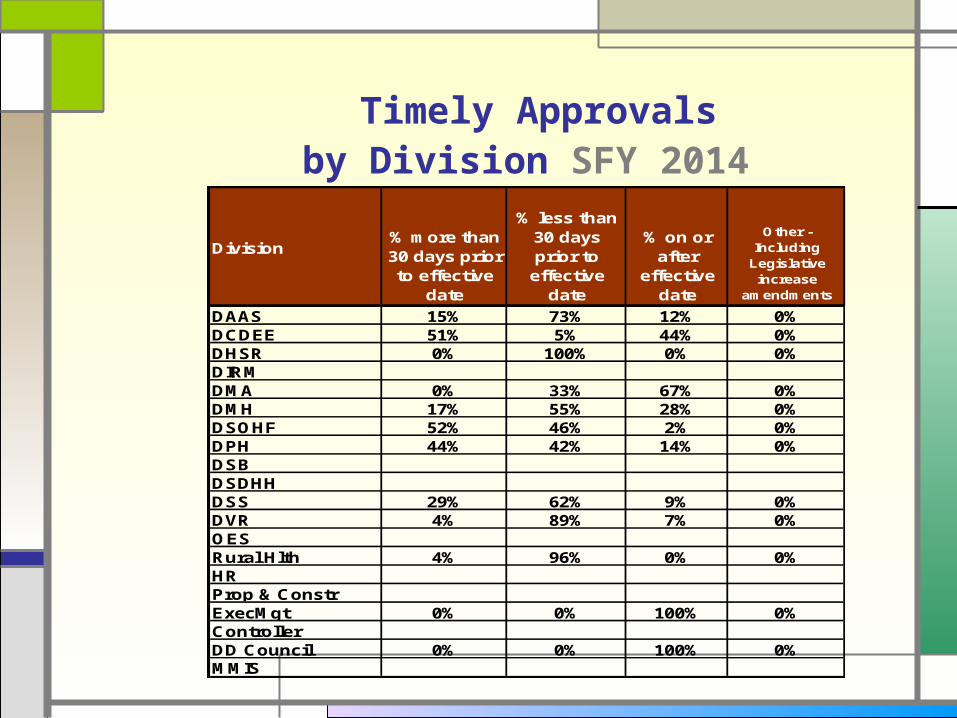
Timely Approvalsby Division SFY 2014
Division% more than 30 days prior to effective
date
% less than 30 days prior to
effective date
% on or after
effective date
Other - Including
Legislative increase
amendments
DAAS 15% 73% 12% 0%DCDEE 51% 5% 44% 0%DHSR 0% 100% 0% 0%DIRMDMA 0% 33% 67% 0%DMH 17% 55% 28% 0%DSOHF 52% 46% 2% 0%DPH 44% 42% 14% 0%DSBDSDHHDSS 29% 62% 9% 0%DVR 4% 89% 7% 0%OESRural Hlth 4% 96% 0% 0%HRProp & ConstrExecMgt 0% 0% 100% 0%ControllerDD Council 0% 0% 100% 0%MMIS
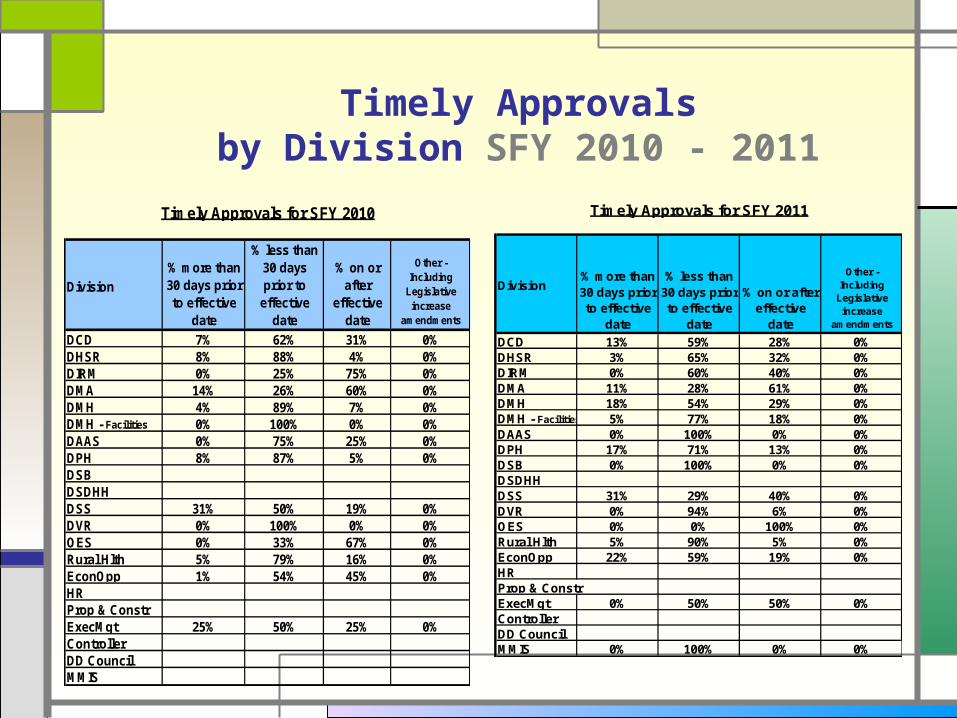
Timely Approvalsby Division SFY 2010 - 2011
Division
% more than 30 days prior to effective
date
% less than 30 days prior to
effective date
% on or after
effective date
Other - Including
Legislative increase
amendments
DCD 7% 62% 31% 0%DHSR 8% 88% 4% 0%DIRM 0% 25% 75% 0%DMA 14% 26% 60% 0%DMH 4% 89% 7% 0%DMH - Facilities 0% 100% 0% 0%DAAS 0% 75% 25% 0%DPH 8% 87% 5% 0%DSBDSDHHDSS 31% 50% 19% 0%DVR 0% 100% 0% 0%OES 0% 33% 67% 0%Rural Hlth 5% 79% 16% 0%EconOpp 1% 54% 45% 0%HRProp & ConstrExecMgt 25% 50% 25% 0%ControllerDD CouncilMMIS
Timely Approvals for SFY 2010
Division% more than 30 days prior to effective
date
% less than 30 days prior to effective
date
% on or after effective
date
Other - Including
Legislative increase
amendments
DCD 13% 59% 28% 0%DHSR 3% 65% 32% 0%DIRM 0% 60% 40% 0%DMA 11% 28% 61% 0%DMH 18% 54% 29% 0%DMH - Facilities 5% 77% 18% 0%DAAS 0% 100% 0% 0%DPH 17% 71% 13% 0%DSB 0% 100% 0% 0%DSDHHDSS 31% 29% 40% 0%DVR 0% 94% 6% 0%OES 0% 0% 100% 0%Rural Hlth 5% 90% 5% 0%EconOpp 22% 59% 19% 0%HRProp & ConstrExecMgt 0% 50% 50% 0%ControllerDD CouncilMMIS 0% 100% 0% 0%
Timely Approvals for SFY 2011
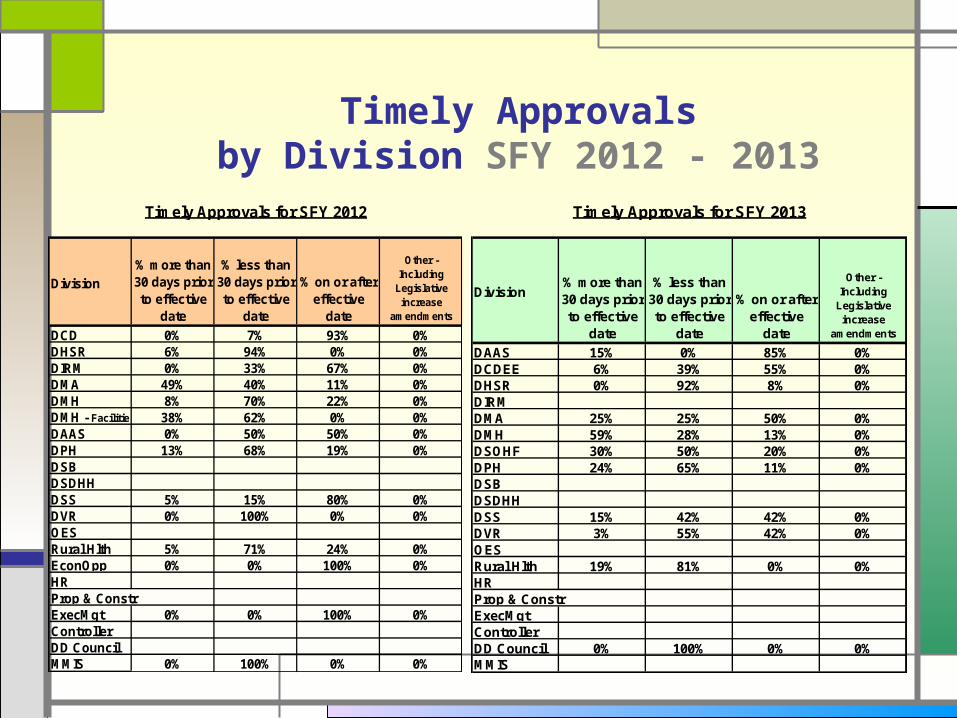
Timely Approvalsby Division SFY 2012 - 2013
Division
% more than 30 days prior to effective
date
% less than 30 days prior to effective
date
% on or after effective
date
Other - Including
Legislative increase
amendments
DCD 0% 7% 93% 0%DHSR 6% 94% 0% 0%DIRM 0% 33% 67% 0%DMA 49% 40% 11% 0%DMH 8% 70% 22% 0%DMH - Facilities 38% 62% 0% 0%DAAS 0% 50% 50% 0%DPH 13% 68% 19% 0%DSBDSDHHDSS 5% 15% 80% 0%DVR 0% 100% 0% 0%OESRural Hlth 5% 71% 24% 0%EconOpp 0% 0% 100% 0%HRProp & ConstrExecMgt 0% 0% 100% 0%ControllerDD CouncilMMIS 0% 100% 0% 0%
Timely Approvals for SFY 2012
Division% more than 30 days prior to effective
date
% less than 30 days prior to effective
date
% on or after effective
date
Other - Including
Legislative increase
amendments
DAAS 15% 0% 85% 0%DCDEE 6% 39% 55% 0%DHSR 0% 92% 8% 0%DIRMDMA 25% 25% 50% 0%DMH 59% 28% 13% 0%DSOHF 30% 50% 20% 0%DPH 24% 65% 11% 0%DSBDSDHHDSS 15% 42% 42% 0%DVR 3% 55% 42% 0%OESRural Hlth 19% 81% 0% 0%HRProp & ConstrExecMgtControllerDD Council 0% 100% 0% 0%MMIS
Timely Approvals for SFY 2013
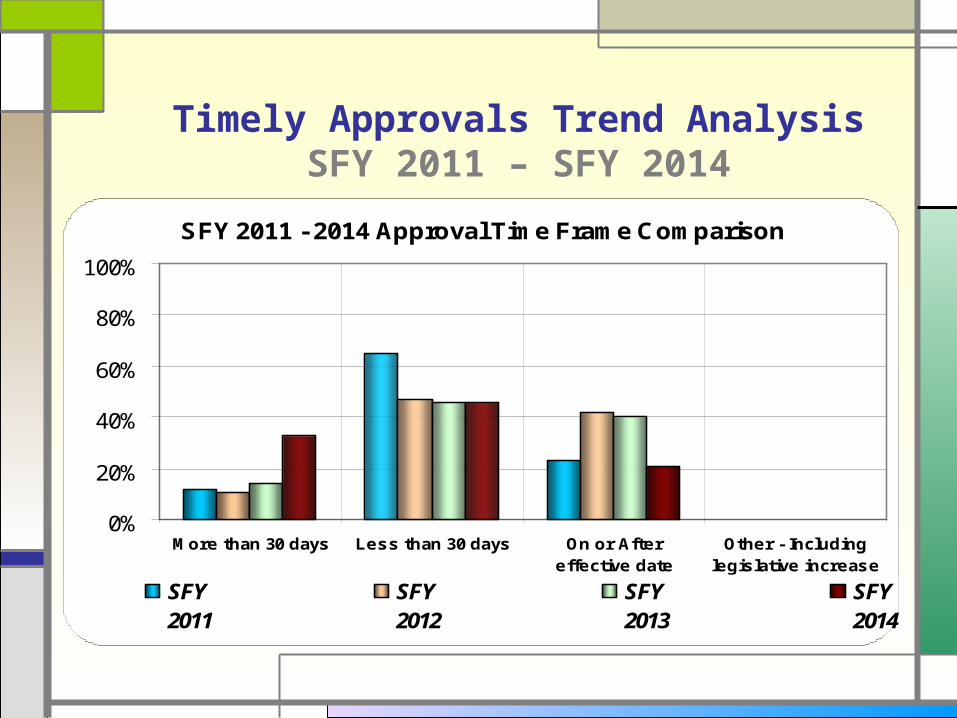
Timely Approvals Trend AnalysisSFY 2011 – SFY 2014
SFY 2011 - 2014 Approval Time Frame Comparison
0%
20%
40%
60%
80%
100%
More than 30 days Less than 30 days On or Aftereffective date
Other - Includinglegislative increase
SFY 2011
SFY 2012
SFY 2013
SFY2014
Divisions submitting all contracts prior to the effective date
SFY 2014
□Division of Health Service Regulation
□Office of Rural Health and Community Care
ComplianceComparison
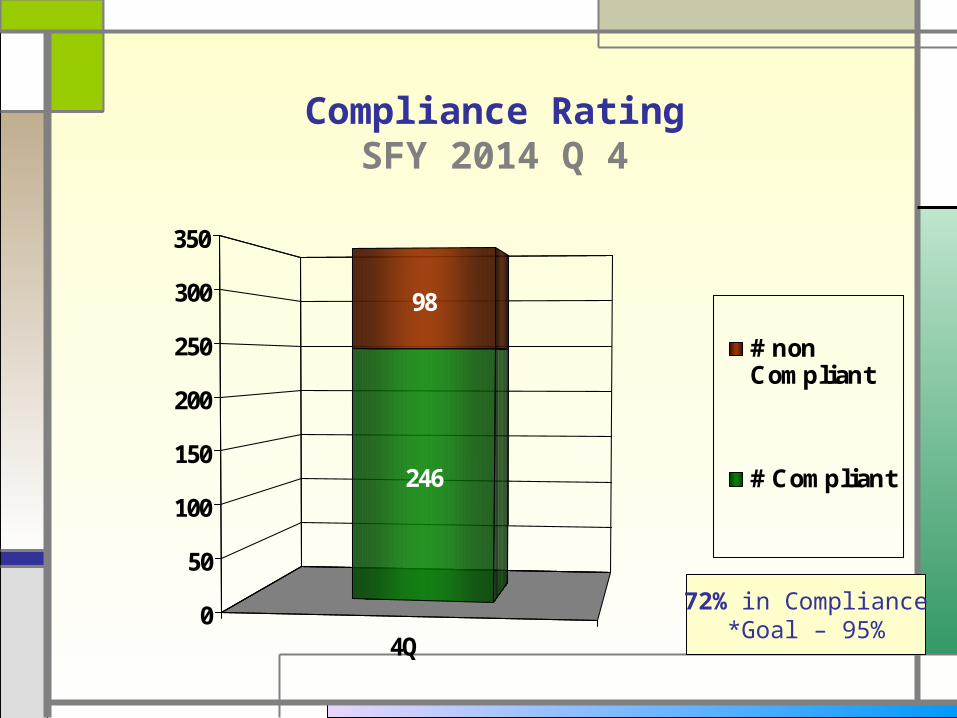
Compliance RatingSFY 2014 Q 4
4Q
246
98
0
50
100
150
200
250
300
350
# nonCompliant
# Compliant
72% in Compliance*Goal – 95%
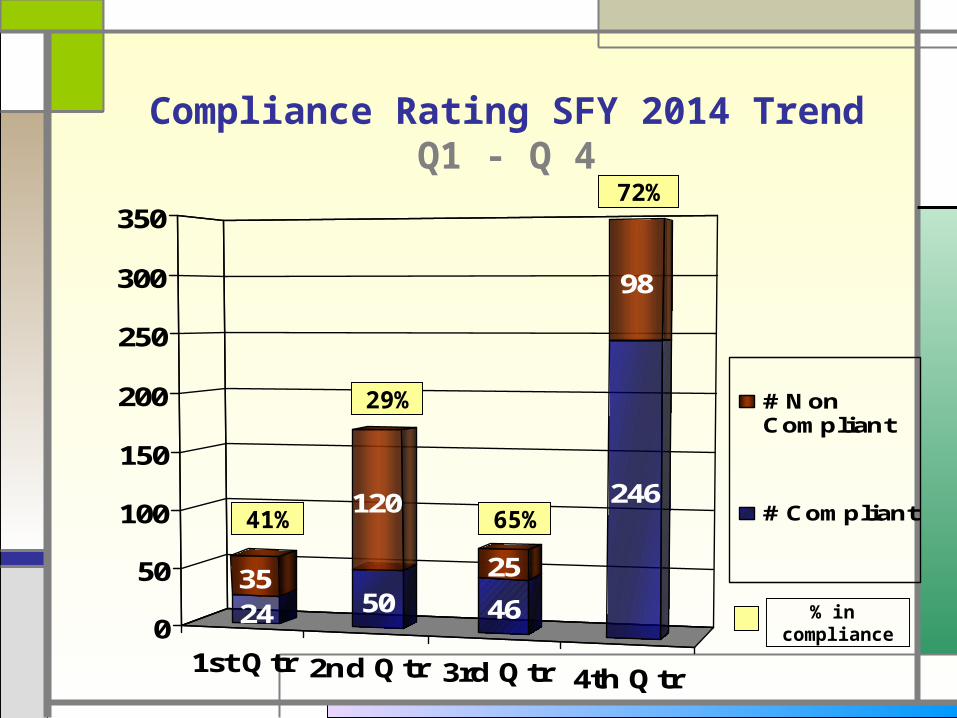
Compliance Rating SFY 2014 TrendQ1 - Q 4
1st Qtr 2nd Qtr 3rd Qtr 4th Qtr
2435
50
120
46
25
246
98
0
50
100
150
200
250
300
350
# NonCompliant
# Compliant41% 65%
29%
72%
% in compliance
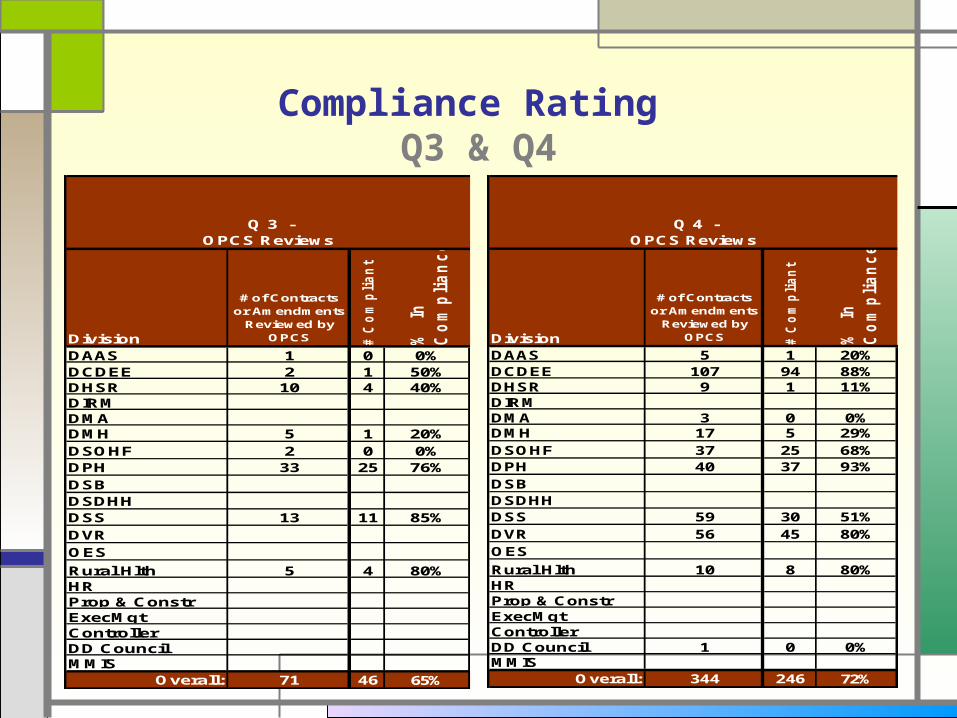
Compliance Rating Q3 & Q4
Division
# of Contracts or Amendments
Reviewed by OPCS
# C
om
pli
an
t
%
In
Co
mp
lia
nc
e
DAAS 1 0 0%DCDEE 2 1 50%DHSR 10 4 40%DIRMDMADMH 5 1 20%DSOHF 2 0 0%DPH 33 25 76%DSBDSDHHDSS 13 11 85%DVROES
Rural Hlth 5 4 80%HRProp & ConstrExecMgtControllerDD CouncilMMIS
Overall: 71 46 65%
Q 3 - OPCS Reviews
Division
# of Contracts or Amendments
Reviewed by OPCS
# C
om
pli
an
t
%
In
Co
mp
lia
nc
e
DAAS 5 1 20%DCDEE 107 94 88%DHSR 9 1 11%DIRMDMA 3 0 0%DMH 17 5 29%DSOHF 37 25 68%DPH 40 37 93%DSBDSDHHDSS 59 30 51%DVR 56 45 80%OES
Rural Hlth 10 8 80%HRProp & ConstrExecMgtControllerDD Council 1 0 0%MMIS
Overall: 344 246 72%
Q 4 - OPCS Reviews
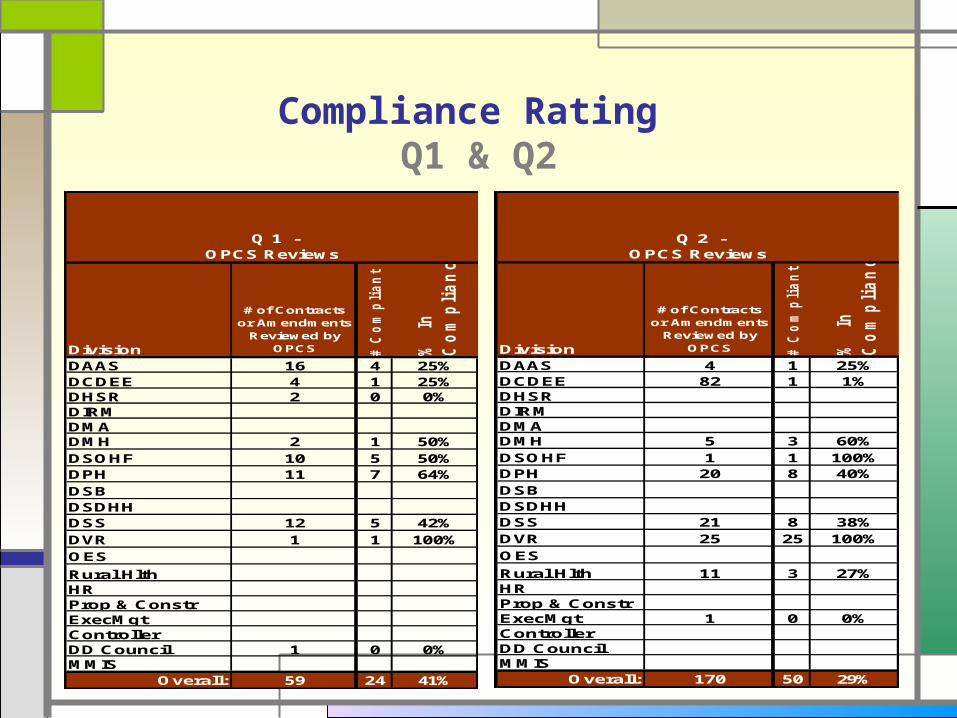
Compliance Rating Q1 & Q2
Division
# of Contracts or Amendments
Reviewed by OPCS
# C
om
pli
an
t
%
In
Co
mp
lia
nc
e
DAAS 16 4 25%DCDEE 4 1 25%DHSR 2 0 0%DIRMDMADMH 2 1 50%DSOHF 10 5 50%DPH 11 7 64%DSBDSDHHDSS 12 5 42%DVR 1 1 100%OES
Rural HlthHRProp & ConstrExecMgtControllerDD Council 1 0 0%MMIS
Overall: 59 24 41%
Q 1 - OPCS Reviews
Division
# of Contracts or Amendments
Reviewed by OPCS
# C
om
pli
an
t
%
In
Co
mp
lia
nc
e
DAAS 4 1 25%DCDEE 82 1 1%DHSRDIRMDMADMH 5 3 60%DSOHF 1 1 100%DPH 20 8 40%DSBDSDHHDSS 21 8 38%DVR 25 25 100%OES
Rural Hlth 11 3 27%HRProp & ConstrExecMgt 1 0 0%ControllerDD CouncilMMIS
Overall: 170 50 29%
Q 2 - OPCS Reviews
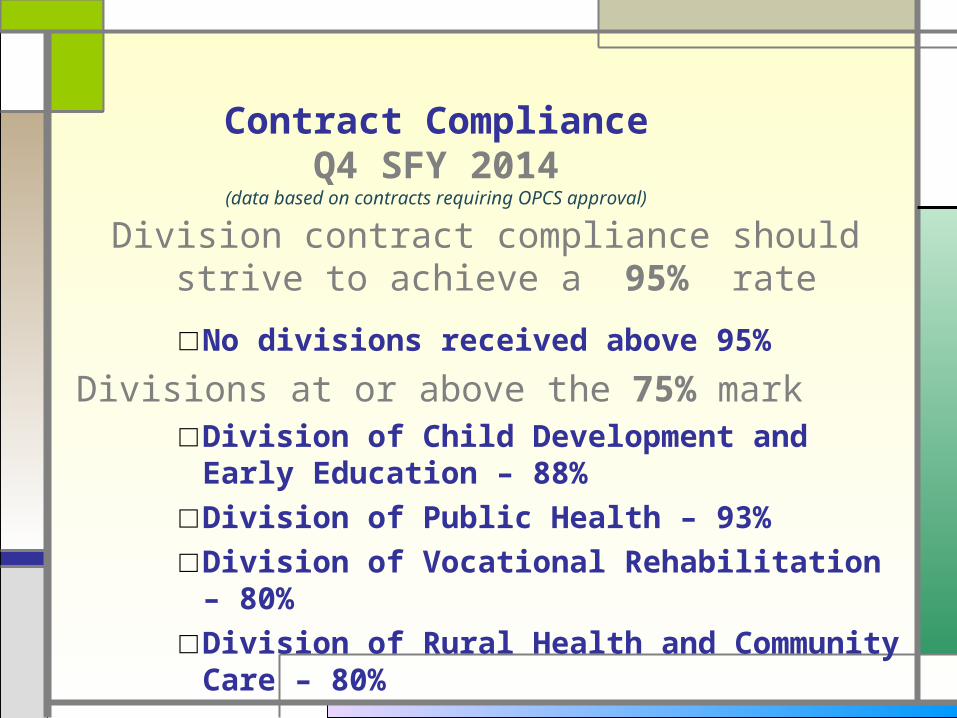
Contract ComplianceQ4 SFY 2014
(data based on contracts requiring OPCS approval)
Division contract compliance should strive to achieve a 95% rate
□No divisions received above 95%
Divisions at or above the 75% mark□Division of Child Development and
Early Education – 88%□Division of Public Health – 93%□Division of Vocational Rehabilitation –
80%□Division of Rural Health and
Community Care – 80%
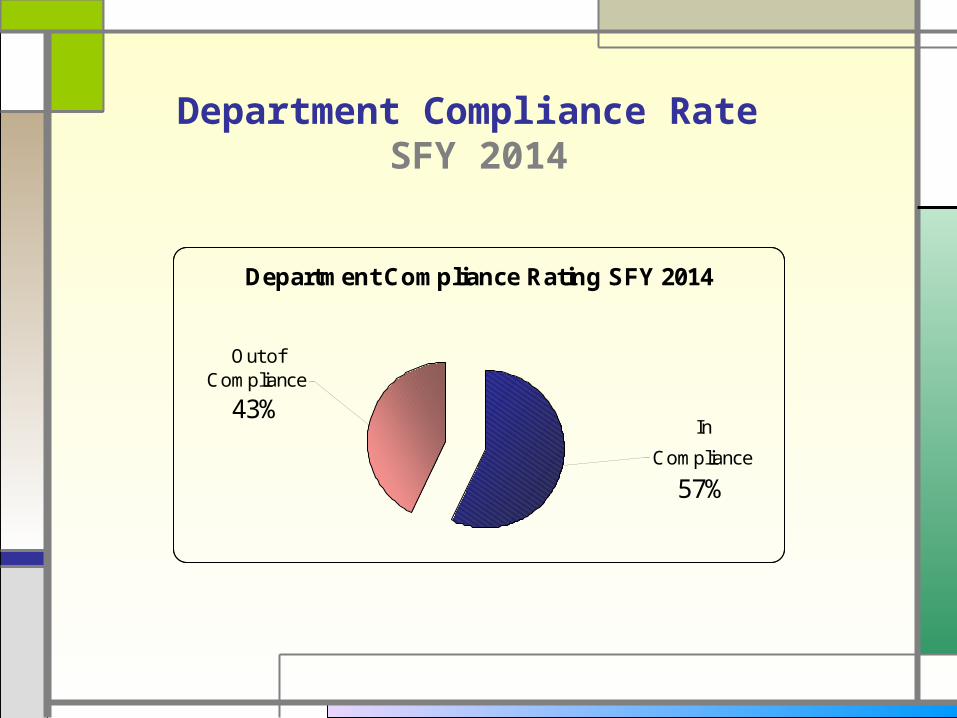
Department Compliance Rate SFY 2014
Department Compliance Rating SFY 2014
Out of Compliance
43%In
Compliance
57%
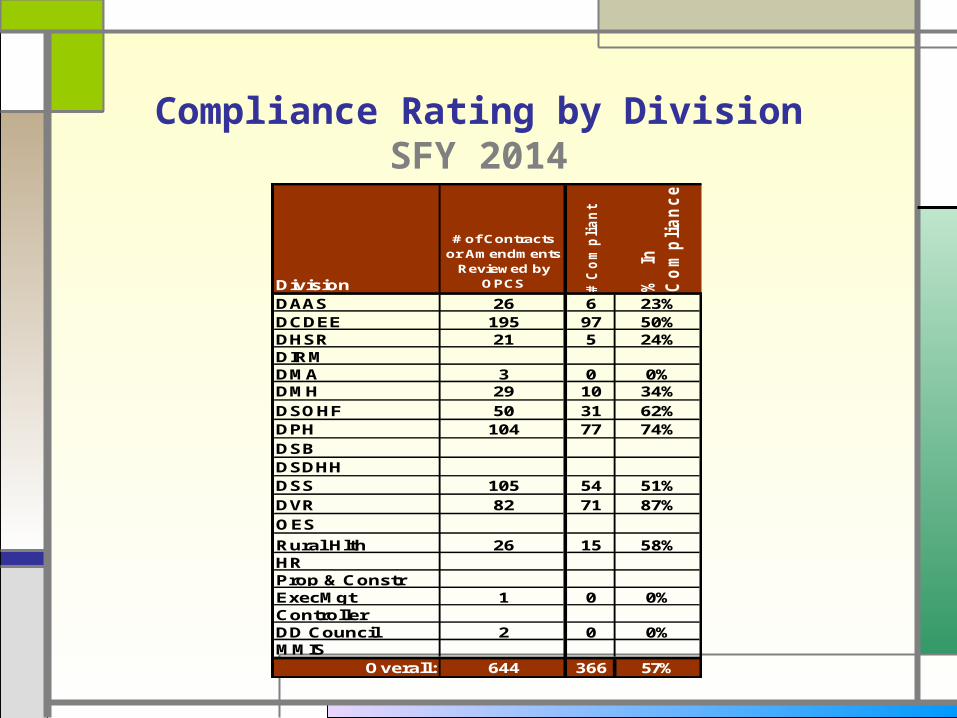
Compliance Rating by DivisionSFY 2014
Division
# of Contracts or Amendments
Reviewed by OPCS
# C
om
pli
an
t
%
In
Co
mp
lia
nc
e
DAAS 26 6 23%DCDEE 195 97 50%DHSR 21 5 24%DIRMDMA 3 0 0%DMH 29 10 34%DSOHF 50 31 62%DPH 104 77 74%DSBDSDHHDSS 105 54 51%DVR 82 71 87%OES
Rural Hlth 26 15 58%HRProp & ConstrExecMgt 1 0 0%ControllerDD Council 2 0 0%MMIS
Overall: 644 366 57%
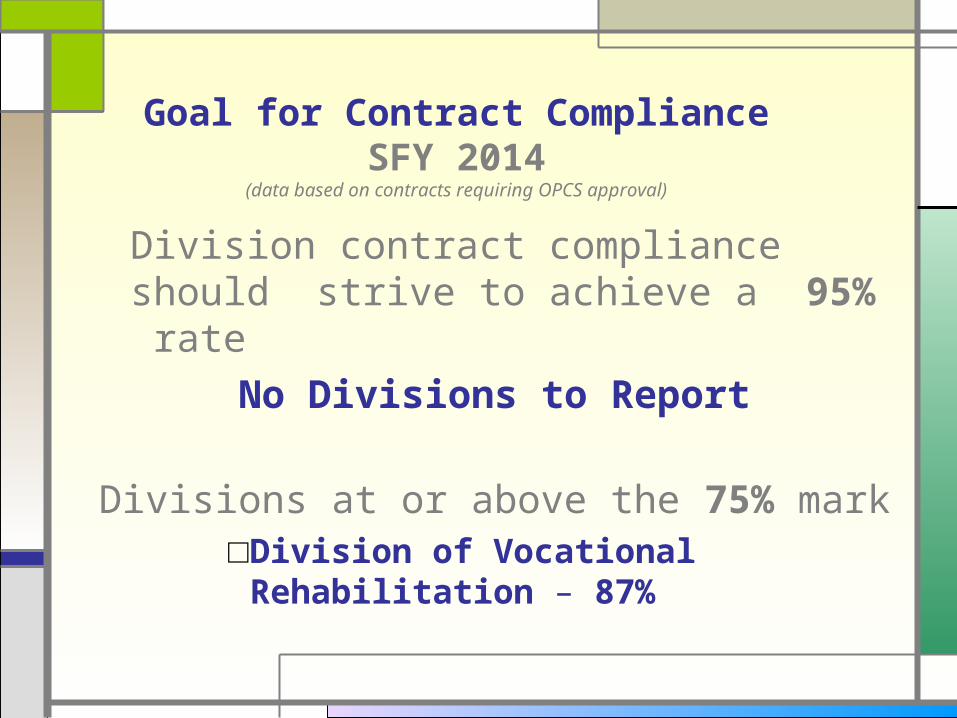
Goal for Contract ComplianceSFY 2014
(data based on contracts requiring OPCS approval)
Division contract compliance should strive to achieve a 95% rate
No Divisions to Report
Divisions at or above the 75% mark□Division of Vocational Rehabilitation – 87%
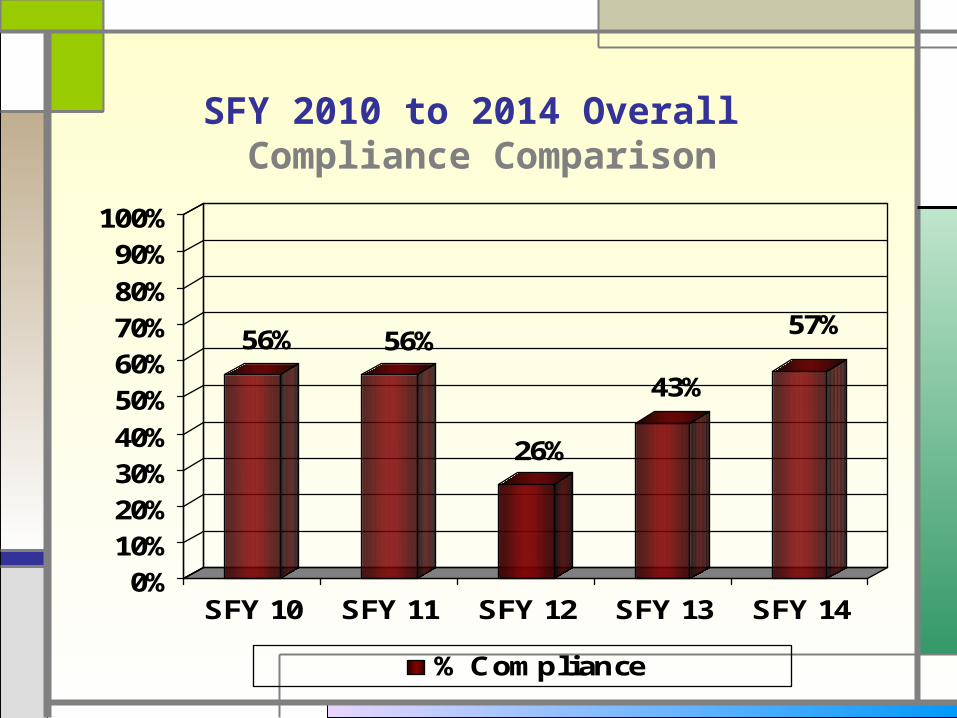
SFY 2010 to 2014 Overall Compliance Comparison
56% 56%
26%
43%
57%
0%10%20%30%40%50%60%70%80%90%
100%
SFY 10 SFY 11 SFY 12 SFY 13 SFY 14
% Compliance
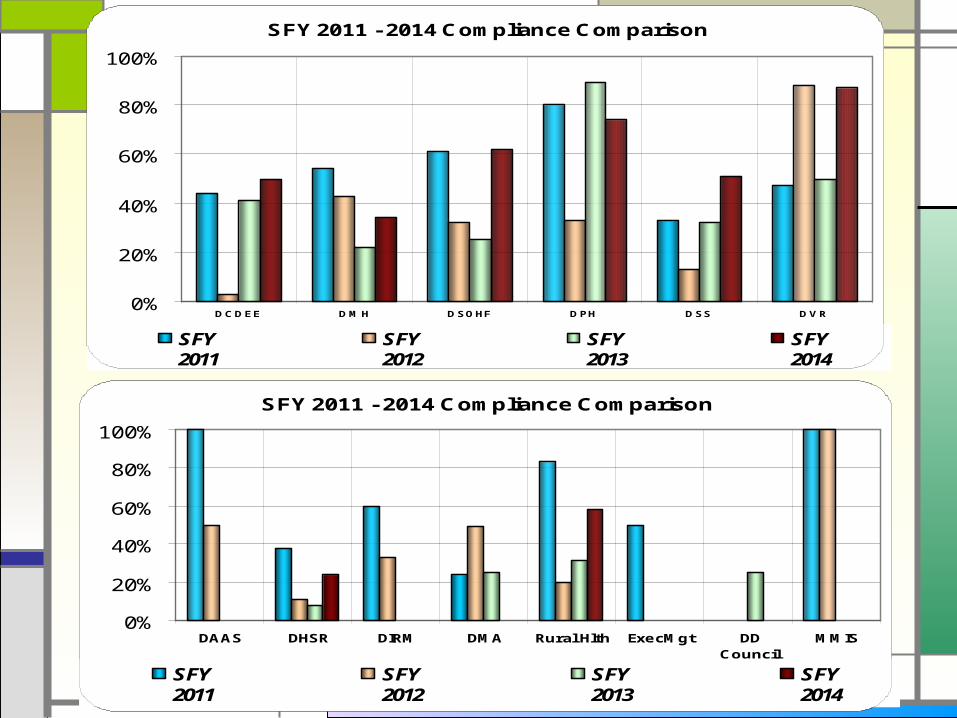
SFY 2011 - 2014 Compliance Comparison
0%
20%
40%
60%
80%
100%
DCDEE DMH DSOHF DPH DSS DVR
SFY 2011
SFY 2012
SFY 2013
SFY2014
SFY 2011 - 2014 Compliance Comparison
0%
20%
40%
60%
80%
100%
DAAS DHSR DIRM DMA Rural Hlth ExecMgt DDCouncil
MMIS
SFY 2011
SFY 2012
SFY 2013
SFY2014
Division # No
n Co
mpl
iant
# No
n Co
mpl
iant
Mis
sing
Div
. Ap
prov
als
# No
n Co
mpl
iant
Mis
sing
Dep
t. ap
prov
als
# No
n Co
mpl
iant
Cont
ract
or
Form
s#
Non
Com
plia
nt
Wor
kshe
ets
# No
n Co
mpl
iant
Gen
eral
Cov
er
# No
n Co
mpl
iant
Scop
e of
Wor
k
# No
n Co
mpl
iant
Perfo
rman
ce
Mea
sure
s#
Non
Com
plia
nt
Oth
er E
dits
re
quie
rd#
Non
Com
plia
nt
HR S
alar
y &
Frin
ge#
Non
Com
plia
nt
Cont
ract
or
Budg
et#
Non
Com
plia
nt
Fund
ing
# No
n Co
mpl
iant
Oth
er
# No
n Co
mpl
iant
Mai
n Re
cord
# No
n Co
mpl
iant
Eval
uatio
n Se
ctio
n#
Non
Com
plia
nt
Cont
ract
G
ener
atio
n
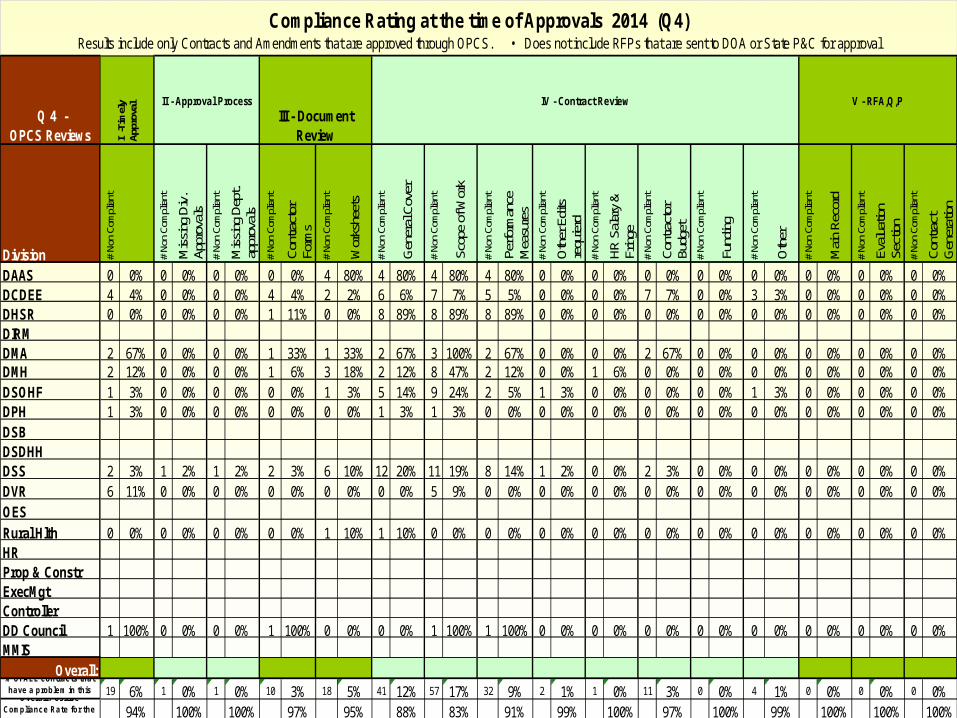
DAAS 0 0% 0 0% 0 0% 0 0% 4 80% 4 80% 4 80% 4 80% 0 0% 0 0% 0 0% 0 0% 0 0% 0 0% 0 0% 0 0%DCDEE 4 4% 0 0% 0 0% 4 4% 2 2% 6 6% 7 7% 5 5% 0 0% 0 0% 7 7% 0 0% 3 3% 0 0% 0 0% 0 0%DHSR 0 0% 0 0% 0 0% 1 11% 0 0% 8 89% 8 89% 8 89% 0 0% 0 0% 0 0% 0 0% 0 0% 0 0% 0 0% 0 0%DIRMDMA 2 67% 0 0% 0 0% 1 33% 1 33% 2 67% 3 100% 2 67% 0 0% 0 0% 2 67% 0 0% 0 0% 0 0% 0 0% 0 0%DMH 2 12% 0 0% 0 0% 1 6% 3 18% 2 12% 8 47% 2 12% 0 0% 1 6% 0 0% 0 0% 0 0% 0 0% 0 0% 0 0%DSOHF 1 3% 0 0% 0 0% 0 0% 1 3% 5 14% 9 24% 2 5% 1 3% 0 0% 0 0% 0 0% 1 3% 0 0% 0 0% 0 0%DPH 1 3% 0 0% 0 0% 0 0% 0 0% 1 3% 1 3% 0 0% 0 0% 0 0% 0 0% 0 0% 0 0% 0 0% 0 0% 0 0%DSBDSDHHDSS 2 3% 1 2% 1 2% 2 3% 6 10% 12 20% 11 19% 8 14% 1 2% 0 0% 2 3% 0 0% 0 0% 0 0% 0 0% 0 0%DVR 6 11% 0 0% 0 0% 0 0% 0 0% 0 0% 5 9% 0 0% 0 0% 0 0% 0 0% 0 0% 0 0% 0 0% 0 0% 0 0%OES
Rural Hlth 0 0% 0 0% 0 0% 0 0% 1 10% 1 10% 0 0% 0 0% 0 0% 0 0% 0 0% 0 0% 0 0% 0 0% 0 0% 0 0%HRProp & ConstrExecMgtControllerDD Council 1 100% 0 0% 0 0% 1 100% 0 0% 0 0% 1 100% 1 100% 0 0% 0 0% 0 0% 0 0% 0 0% 0 0% 0 0% 0 0%MMIS
Overall:19 6% 1 0% 1 0% 10 3% 18 5% 41 12% 57 17% 32 9% 2 1% 1 0% 11 3% 0 0% 4 1% 0 0% 0 0% 0 0%
94% 100% 100% 97% 95% 88% 83% 91% 99% 100% 97% 100% 99% 100% 100% 100%
Compliance Rating at the time of Approvals 2014 (Q4)Results include only Contracts and Amendments that are approved through OPCS. • Does not include RFPs that are sent to DOA or State P&C for approval
Q 4 - OPCS Reviews I
-Tim
ely
Appr
oval
II - Approval ProcessIII - Document
Review
IV - Contract Review V - RFA,Q,P
% of ALL contracts that have a problem in this
Overall Positive Compliance Rate for the
Division # No
n Co
mpl
iant
# No
n Co
mpl
iant
Mis
sing
Div
. Ap
prov
als
# No
n Co
mpl
iant
Mis
sing
Dep
t. ap
prov
als
# No
n Co
mpl
iant
Cont
ract
or
Form
s#
Non
Com
plia
nt
Wor
kshe
ets
# No
n Co
mpl
iant
Gen
eral
Cov
er
# No
n Co
mpl
iant
Scop
e of
Wor
k
# No
n Co
mpl
iant
Perfo
rman
ce
Mea
sure
s#
Non
Com
plia
nt
Oth
er E
dits
re
quie
rd#
Non
Com
plia
nt
HR S
alar
y &
Frin
ge#
Non
Com
plia
nt
Cont
ract
or
Budg
et#
Non
Com
plia
nt
Fund
ing
# No
n Co
mpl
iant
Oth
er
# No
n Co
mpl
iant
Mai
n Re
cord
# No
n Co
mpl
iant
Eval
uatio
n Se
ctio
n#
Non
Com
plia
nt
Cont
ract
G
ener
atio
n
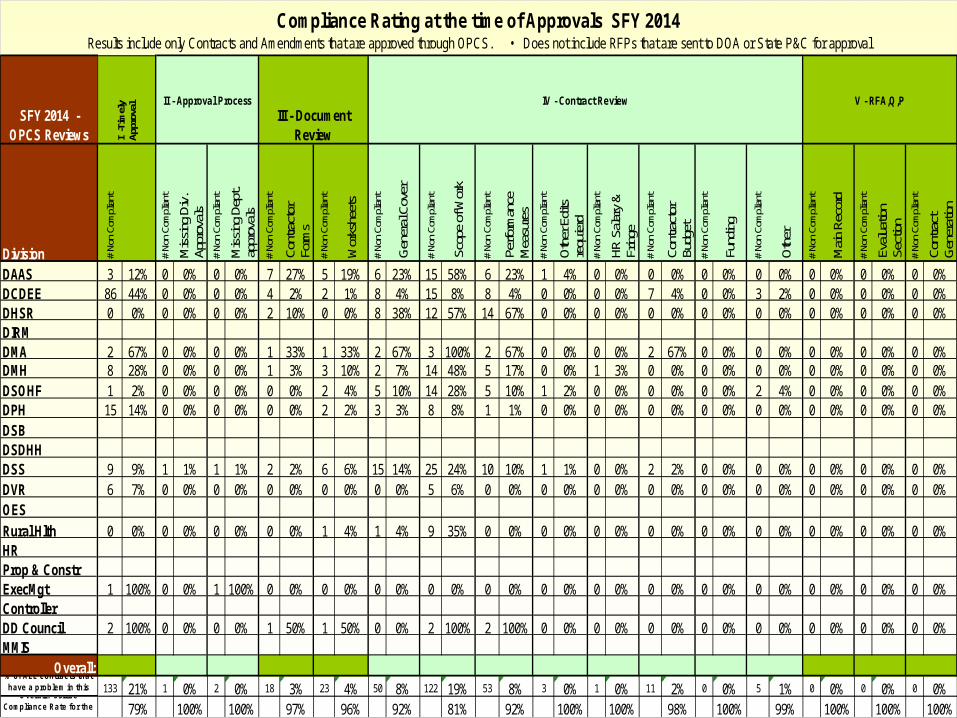
DAAS 3 12% 0 0% 0 0% 7 27% 5 19% 6 23% 15 58% 6 23% 1 4% 0 0% 0 0% 0 0% 0 0% 0 0% 0 0% 0 0%DCDEE 86 44% 0 0% 0 0% 4 2% 2 1% 8 4% 15 8% 8 4% 0 0% 0 0% 7 4% 0 0% 3 2% 0 0% 0 0% 0 0%DHSR 0 0% 0 0% 0 0% 2 10% 0 0% 8 38% 12 57% 14 67% 0 0% 0 0% 0 0% 0 0% 0 0% 0 0% 0 0% 0 0%DIRMDMA 2 67% 0 0% 0 0% 1 33% 1 33% 2 67% 3 100% 2 67% 0 0% 0 0% 2 67% 0 0% 0 0% 0 0% 0 0% 0 0%DMH 8 28% 0 0% 0 0% 1 3% 3 10% 2 7% 14 48% 5 17% 0 0% 1 3% 0 0% 0 0% 0 0% 0 0% 0 0% 0 0%DSOHF 1 2% 0 0% 0 0% 0 0% 2 4% 5 10% 14 28% 5 10% 1 2% 0 0% 0 0% 0 0% 2 4% 0 0% 0 0% 0 0%DPH 15 14% 0 0% 0 0% 0 0% 2 2% 3 3% 8 8% 1 1% 0 0% 0 0% 0 0% 0 0% 0 0% 0 0% 0 0% 0 0%DSBDSDHHDSS 9 9% 1 1% 1 1% 2 2% 6 6% 15 14% 25 24% 10 10% 1 1% 0 0% 2 2% 0 0% 0 0% 0 0% 0 0% 0 0%DVR 6 7% 0 0% 0 0% 0 0% 0 0% 0 0% 5 6% 0 0% 0 0% 0 0% 0 0% 0 0% 0 0% 0 0% 0 0% 0 0%OES
Rural Hlth 0 0% 0 0% 0 0% 0 0% 1 4% 1 4% 9 35% 0 0% 0 0% 0 0% 0 0% 0 0% 0 0% 0 0% 0 0% 0 0%HRProp & ConstrExecMgt 1 100% 0 0% 1 100% 0 0% 0 0% 0 0% 0 0% 0 0% 0 0% 0 0% 0 0% 0 0% 0 0% 0 0% 0 0% 0 0%ControllerDD Council 2 100% 0 0% 0 0% 1 50% 1 50% 0 0% 2 100% 2 100% 0 0% 0 0% 0 0% 0 0% 0 0% 0 0% 0 0% 0 0%MMIS
Overall:133 21% 1 0% 2 0% 18 3% 23 4% 50 8% 122 19% 53 8% 3 0% 1 0% 11 2% 0 0% 5 1% 0 0% 0 0% 0 0%
79% 100% 100% 97% 96% 92% 81% 92% 100% 100% 98% 100% 99% 100% 100% 100%
% of ALL contracts that have a problem in this
Overall Positive Compliance Rate for the
SFY 2014 - OPCS Reviews
Compliance Rating at the time of Approvals SFY 2014 Results include only Contracts and Amendments that are approved through OPCS. • Does not include RFPs that are sent to DOA or State P&C for approval
I -T
imel
y Ap
prov
al
II - Approval ProcessIII - Document
Review
IV - Contract Review V - RFA,Q,P
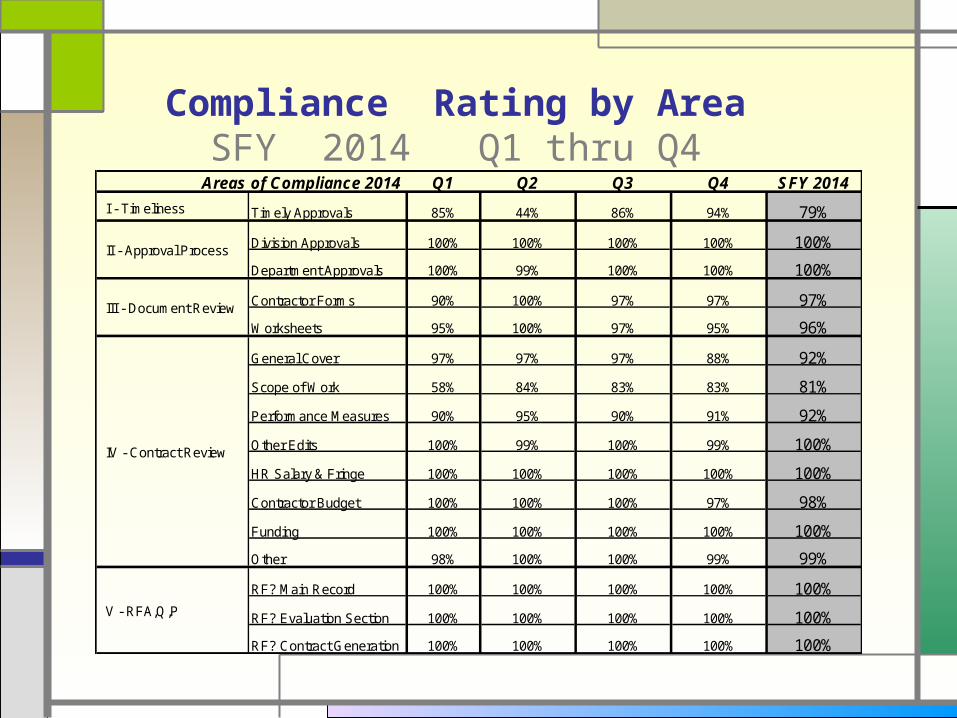
Compliance Rating by AreaSFY 2014 Q1 thru Q4
Areas of Compliance 2014 Q1 Q2 Q3 Q4 SFY 2014
I - Timeliness Timely Approvals 85% 44% 86% 94% 79%
Division Approvals 100% 100% 100% 100% 100%
Department Approvals 100% 99% 100% 100% 100%
Contractor Forms 90% 100% 97% 97% 97%
Worksheets 95% 100% 97% 95% 96%
General Cover 97% 97% 97% 88% 92%
Scope of Work 58% 84% 83% 83% 81%
Performance Measures 90% 95% 90% 91% 92%
Other Edits 100% 99% 100% 99% 100%
HR Salary & Fringe 100% 100% 100% 100% 100%
Contractor Budget 100% 100% 100% 97% 98%
Funding 100% 100% 100% 100% 100%
Other 98% 100% 100% 99% 99%
RF? Main Record 100% 100% 100% 100% 100%
RF? Evaluation Section 100% 100% 100% 100% 100%
RF? Contract Generation 100% 100% 100% 100% 100%
II - Approval Process
III - Document Review
IV - Contract Review
V - RFA,Q,P
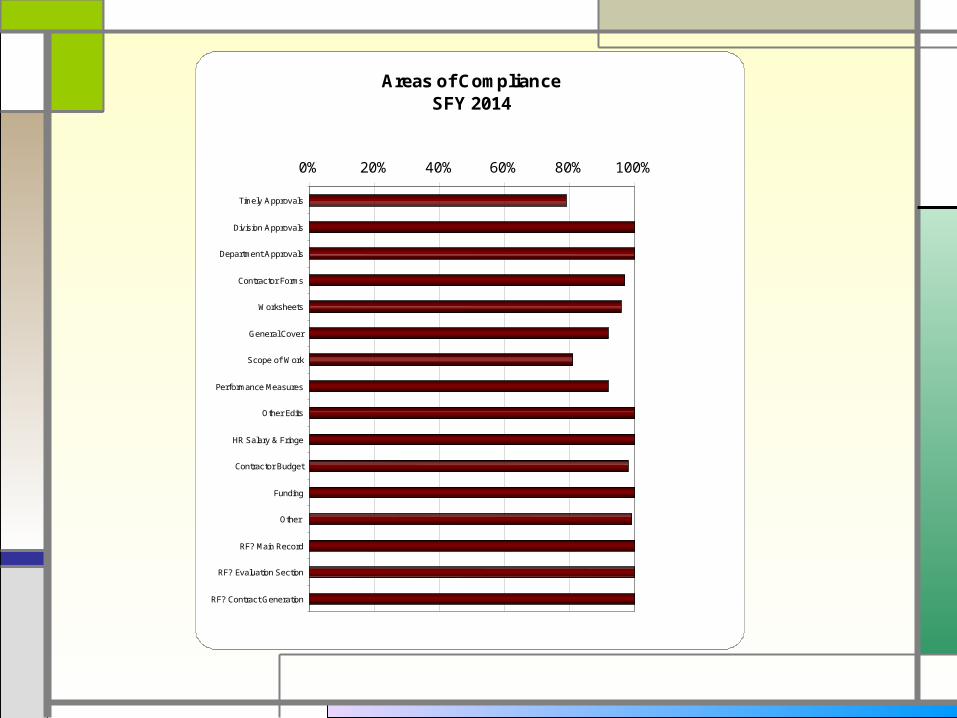
Areas of ComplianceSFY 2014
0% 20% 40% 60% 80% 100%
Timely Approvals
Division Approvals
Department Approvals
Contractor Forms
Worksheets
General Cover
Scope of Work
Performance Measures
Other Edits
HR Salary & Fringe
Contractor Budget
Funding
Other
RF? Main Record
RF? Evaluation Section
RF? Contract Generation
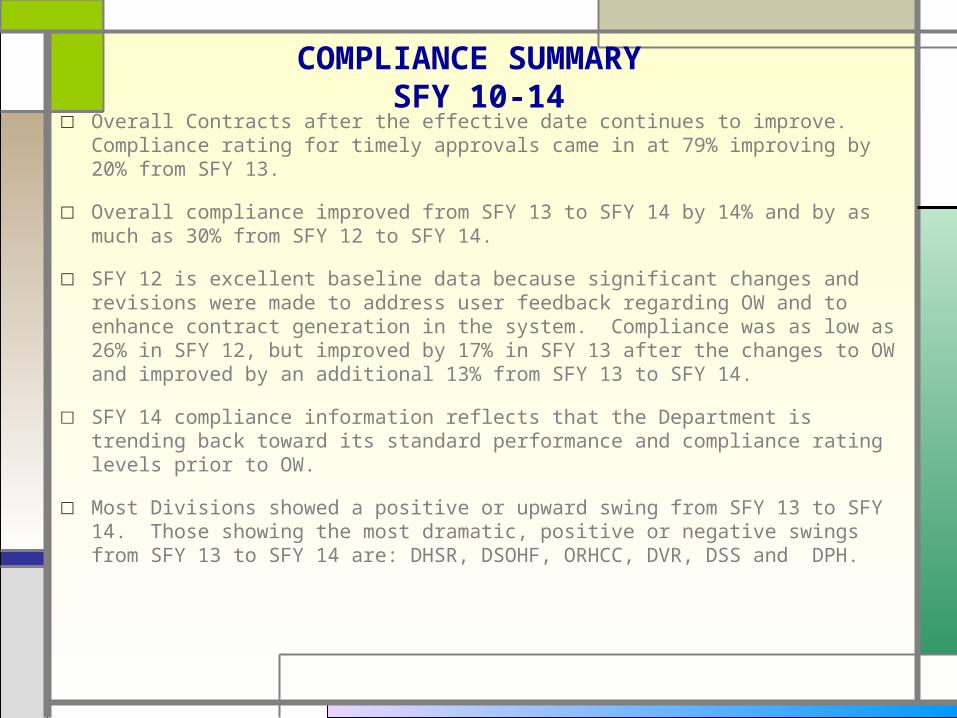
COMPLIANCE SUMMARY SFY 10-14
□ Overall Contracts after the effective date continues to improve. Compliance rating for timely approvals came in at 79% improving by 20% from SFY 13.
□ Overall compliance improved from SFY 13 to SFY 14 by 14% and by as much as 30% from SFY 12 to SFY 14.
□ SFY 12 is excellent baseline data because significant changes and revisions were made to address user feedback regarding OW and to enhance contract generation in the system. Compliance was as low as 26% in SFY 12, but improved by 17% in SFY 13 after the changes to OW and improved by an additional 13% from SFY 13 to SFY 14.
□ SFY 14 compliance information reflects that the Department is trending back toward its standard performance and compliance rating levels prior to OW.
□ Most Divisions showed a positive or upward swing from SFY 13 to SFY 14. Those showing the most dramatic, positive or negative swings from SFY 13 to SFY 14 are: DHSR, DSOHF, ORHCC, DVR, DSS and DPH.
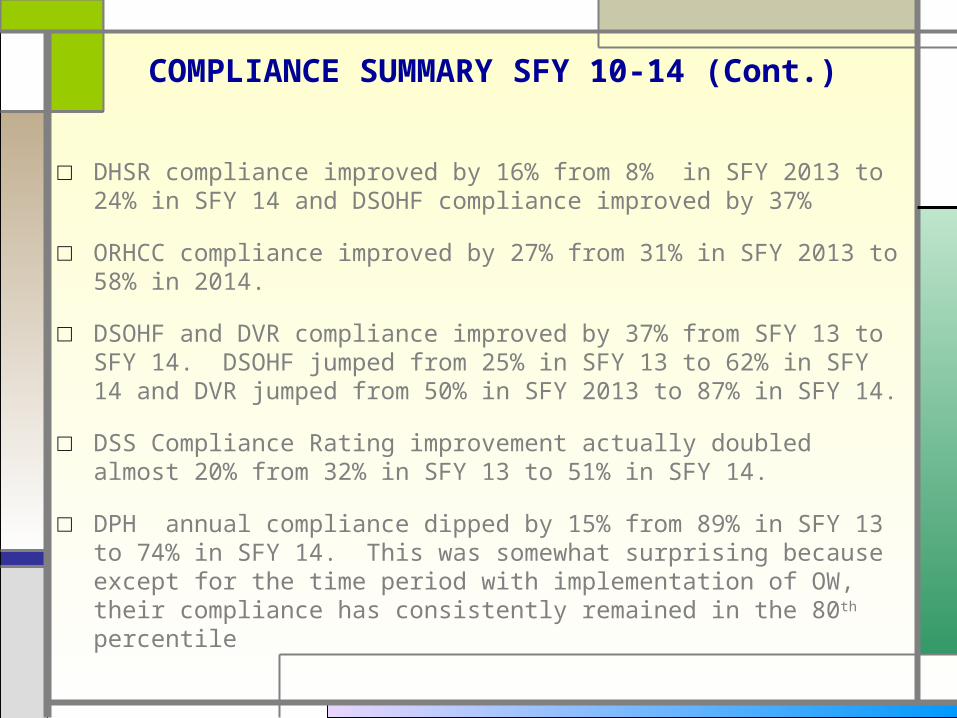
COMPLIANCE SUMMARY SFY 10-14 (Cont.)
□ DHSR compliance improved by 16% from 8% in SFY 2013 to 24% in SFY 14 and DSOHF compliance improved by 37%
□ ORHCC compliance improved by 27% from 31% in SFY 2013 to 58% in 2014.
□ DSOHF and DVR compliance improved by 37% from SFY 13 to SFY 14. DSOHF jumped from 25% in SFY 13 to 62% in SFY 14 and DVR jumped from 50% in SFY 2013 to 87% in SFY 14.
□ DSS Compliance Rating improvement actually doubled almost 20% from 32% in SFY 13 to 51% in SFY 14.
□ DPH annual compliance dipped by 15% from 89% in SFY 13 to 74% in SFY 14. This was somewhat surprising because except for the time period with implementation of OW, their compliance has consistently remained in the 80th percentile
COMPLIANCE SUMMARY SFY 10-14 (Cont.)
Division with the longest cycle time still remains to be
DSS (46 days) followed by DPH (26 days), DMH (26 days), DSOHF (25 days) and DCDEE (21 days) for SFY 2013
The cycle time for these divisions were almost the same or higher in 2013
In summary compliance rating is still way below expectation by as much as 40% in SFY 14 and in SFY 10 and SFY 11 years
prior to OW.
COMPLIANCE SUMMARY SFY 14 (Q1-Q4)
There are five core areas of compliance: I - Timeliness; II - Approval Process, III - Document Review, IV - Contract Review and V - RFA, Q, P
These areas are further broken down in to 14 sub categories.
The biggest areas of opportunity continues to be : I - Timeliness and IV - Contract Review (scope of work and
performance measures). However all areas of compliance have improved from SF 13 to SFY 14
COMPLIANCE SUMMARY SFY 14 (Q1-Q4) (Cont.)
□ Contracts after the effective date (timely approvals) dipped by almost 40% from 85% to 44% from Q1 to Q2 for SFY 14, but rebound by 50% from Q2 to Q4 to 94% compliance and 79% for the year.
□ No major issues with the contract going through the correct approval process.
□ Contractor Forms improved by 10% from 87% in SFY 13 to 96% in SFY 14
□ Worksheets compliance rating improved by 18% from 78% in SFY 13 to 96% in SFY 14
□ General Cover compliance rating improved by3% from 89% in SFY 13 to 92% in SFY 14
□ Scope of Work compliance rating improved by 25% from Q1 to Q4 from 58% to 83% and improved by 18% from SFY 13 to SFY 14 (from 63% to 81%). Divisions with the most SOW and Performance Measures defects are DAAS, DMH, DSS and SOHF
COMPLIANCE SUMMARY SFY 14 (Q1-Q4) (Cont.)
□ Performance Measures compliance rating improved by 13% in SFY 14 from 79% in SFY 13 to 92%
□ Other Edits compliance rating improved by 16% from 84% in SFY 13 to 100% in SFY 14
□ Salary and Fringe compliance rating improved by 6% from 94% in SFY 13 to 100% I SFY 14
□ Contractor Budget compliance rating improved by 17% from 81% in SFY 13 to 96% in SFY 14
□ Funding compliance rating improved by 5% from 95% in SFY 13 to 100% in SFY 14
□ Other funding issues compliance rating improved by 14% from 86% in SFY 14 to 100% in SFY 14
□ No major issues with the RFA,Q, P areas.

REMINDERS□ Complete all data fields in OW
□ Upload all executed contracts and amendments in OW.
□ Hard Copy of executed contracts are no longer required to be sent to the Controllers Office. The controllers office was trained in May to review the executed contracts and other ancillary documents in OW. See email sent out regarding this matter for instructions.
□ Update contract statuses, start/end dates, funding, how procured, contract selection, performance measure data and all information pertaining to the contract appropriately in OW so that accurate reports can be run.
This is very IMPORTANT
□ View Lessons Learned on OPCS website
□ Run Reports and Manage Your Contracts