Embed Size (px)
Citation preview
1
CANADA’S INTERMEDIATE GOLD PRODUCER
Detour Lake Mine TourJune 4, 2015
2
Forward Looking InformationThis presentation contains certain forward-looking information and statements as defined in applicable securities law (referred to herein as“forward-looking statements”). Forward-looking statements include, but are not limited to, statements with respect to 2015 guidance forproduction, total cash costs, all-in sustaining costs, operating costs, capital costs, deferred stripping costs, exploration costs and potentialcost reductions; expected throughput, mining and recovery rates; expected future production, mining activities and long term targets forimprovements including mill consumables improvements; opportunities to optimize the mine operation and mitigate near term risks; timelinefor the life of mine plan update, second test for the processing of fines, planned shutdowns, tailings management area construction, Block Apit development and exploration program; and credit facilities, debt repayment and hedging.
Forward-looking statements involve known and unknown risks, uncertainties and other factors which may cause actual results, performanceor achievements to be materially different from any of its future results, performance or achievements expressed or implied by forward-looking statements. These risks, uncertainties and other factors include, but are not limited to, assumptions and parameters underlying thelife of mine update not being realized, a decrease in the future gold price, discrepancies between actual and estimated production, changesin costs (including labour, supplies, fuel and equipment), changes to tax rates; environmental compliance and changes in environmentallegislation and regulation, exchange rate fluctuations, general economic conditions and other risks involved in the gold exploration anddevelopment industry, as well as those risk factors discussed in the section entitled “Description of Business - Risk Factors” in DetourGold’s 2014 AIF and in the continuous disclosure documents filed by Detour Gold on and available on SEDAR at www.sedar.com.
Such forward-looking statements are also based on a number of assumptions which may prove to be incorrect, including, but not limited to,assumptions about the following: the availability of financing for exploration and development activities; operating and sustaining capitalcosts; the Company’s ability to attract and retain skilled staff; sensitivity to metal prices and other sensitivities; the supply and demand for,and the level and volatility of the price of, gold; the supply and availability of consumables and services; the exchange rates of the Canadiandollar to the U.S. dollar; energy and fuel costs; the accuracy of reserve and resource estimates and the assumptions on which the reserveand resource estimates are based; market competition; ongoing relations with employees and impacted communities and general businessand economic conditions. Accordingly, readers should not place undue reliance on forward-looking statements. The forward-lookingstatements contained herein are made as of the date hereof, or such other date or dates specified in such statements.
All forward-looking statements in this presentation are necessarily based on opinions and estimates made as of the date such statementsare made and are subject to important risk factors and uncertainties, many of which cannot be controlled or predicted. Detour Gold and theQualified Persons who authored the associated Technical Report undertake no obligation to update publicly or otherwise revise anyforward-looking statements contained herein whether as a result of new information or future events or otherwise, except as may berequired by law.
3
Notes to Investors
The scientific and technical content of this presentation was reviewed, verified and approved by Drew Anwyll, P.Eng., Senior Vice President Technical Services, and exploration results was reviewed, verified and approved by Guy MacGillivray, P.Geo., Exploration Manager , both Qualified Person as defined by Canadian Securities Administrators National Instrument 43-101 “Standards of Disclosure for Mineral Projects”.
Qualified Persons
Non-IFRS Financial Performance MeasuresThe Company has included non-IFRS measures in this presentation: total cash costs, all-in sustaining costs, adjusted net loss and adjusted net loss pershare. The Company believes that these measures, in addition to conventional measures prepared in accordance with IFRS, provide investors an improvedability to evaluate the underlying performance of the Company. The non-IFRS measures are intended to provide additional information and should not beconsidered in isolation or as a substitute for measures of performance prepared in accordance with IFRS. These measures do not have any standardizedmeaning prescribed under IFRS, and therefore may not be comparable to other issuers. Other companies may calculate these measure differently.
Detour Gold reports total cash costs on a sales basis. Total cash costs include production costs such as mining, processing, refining and siteadministration, less non-cash share-based compensation and net of silver sales divided by gold ounces sold to arrive at total cash costs per gold ouncesold. The measure also includes other mine related costs incurred such as mine standby costs and current inventory write downs. Production costs areexclusive of depreciation and depletion. Production costs include the costs associated with providing the royalty in kind ounces.
Commencing in 2015, the Company adopted all-in sustaining costs on a prospective basis. The Company believes this measure more fully defines the totalcosts associated with producing gold. The Company calculates all-in sustaining costs as the sum of total cash costs (as described above), share-basedcompensation, corporate general and administrative expense, exploration and evaluation expenses that are sustaining in nature, reclamation costaccretion, sustaining capital including deferred stripping, and realized gains and losses on hedges due to operating and capital costs, all divided by the goldounces sold to arrive at a per ounce figure.
Costs excluded from all-in sustaining costs are non-sustaining capital expenditures and exploration costs that are expected to materially increaseproduction, financing costs and tax expense. Consequently, this measure is not representative of all of the Company’s cash expenditures. In addition, thecalculation of all-in sustaining costs does not include depreciation and depletion expense as it does not reflect the impact of expenditures incurred in priorperiods.
Adjusted net loss and adjusted basic loss per share are used by management and investors to measure the underlying operating performance of theCompany. Presenting these measures from period to period helps management and investors evaluate earnings trends more readily in comparison withresults from prior periods. Adjusted net loss is defined as net loss adjusted to exclude specific items that are significant, but not reflective of the underlyingoperations of the Company, including: fair value change of the convertible notes, the impact of foreign exchange gains and losses, including the foreignexchange on deferred income and mining taxes, non-cash unrealized gains and losses on derivative instruments, accretion on convertible notes, unwindingof discount on decommissioning and restoration provisions, impairment provisions and reversals thereof, and other non-recurring items. Adjusted basic netloss per share is calculated using the weighted average number of shares outstanding under the basic method of loss per share as determined underIFRS.
4
Morning Presentations (in the bus): Welcoming remarks – Paul Martin, President & CEO Detour Lake Operation – Pierre Beaudoin, COO Financial review – Paul Martin, President & CEO Near-term opportunities – Pierre Beaudoin, COOSite Visit Tour Plant – Andrew Nugent, Process Plant Operations Manager and Keiran Whitefield,
Business Improvement Manager (former Maintenance Manager) Mine plan – Craig Rintoul, Open Pit Manager and Josh Hurrell, Technical Services
SuperintendentLunch Time Presentations: Q&A with Mine and Processing Plant team Exploration – Jean-Francois Metail, VP Mineral Resource Management and Guy
MacGillivray, Exploration Manager Core display of Lower Detour
Agenda
5
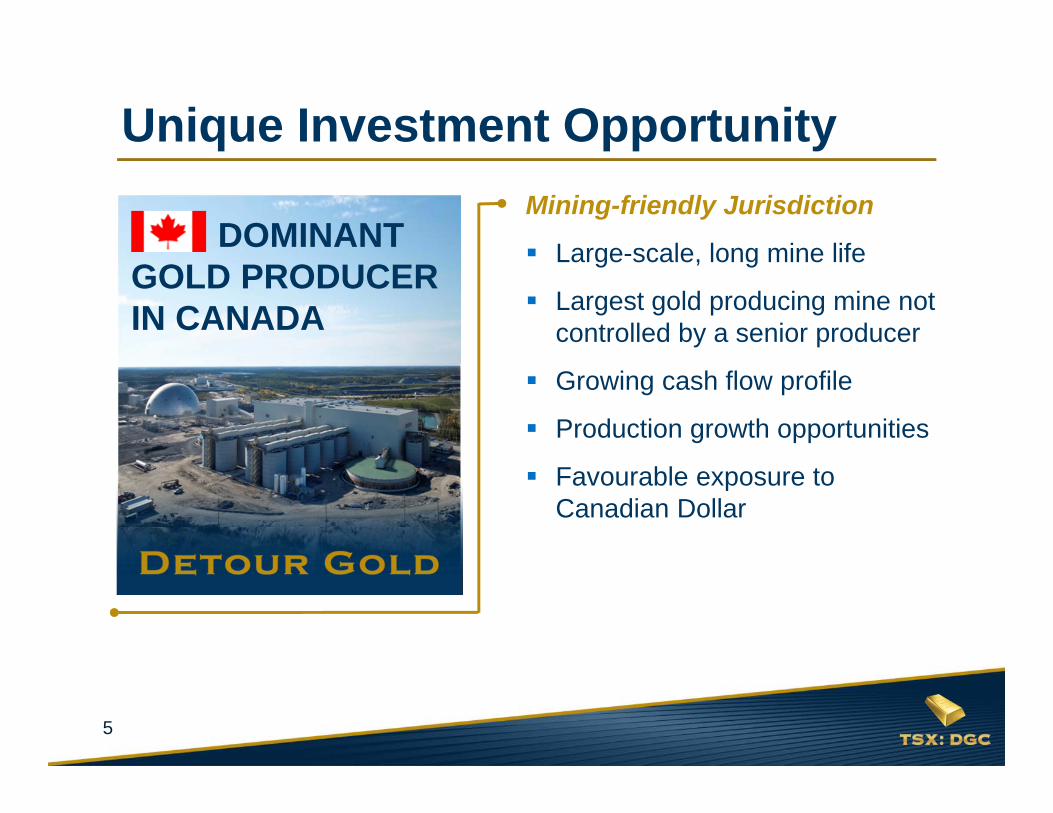
Unique Investment OpportunityMining-friendly Jurisdiction
Large-scale, long mine life
Largest gold producing mine not controlled by a senior producer
Growing cash flow profile
Production growth opportunities
Favourable exposure to Canadian Dollar
DOMINANTGOLD PRODUCER IN CANADA
6
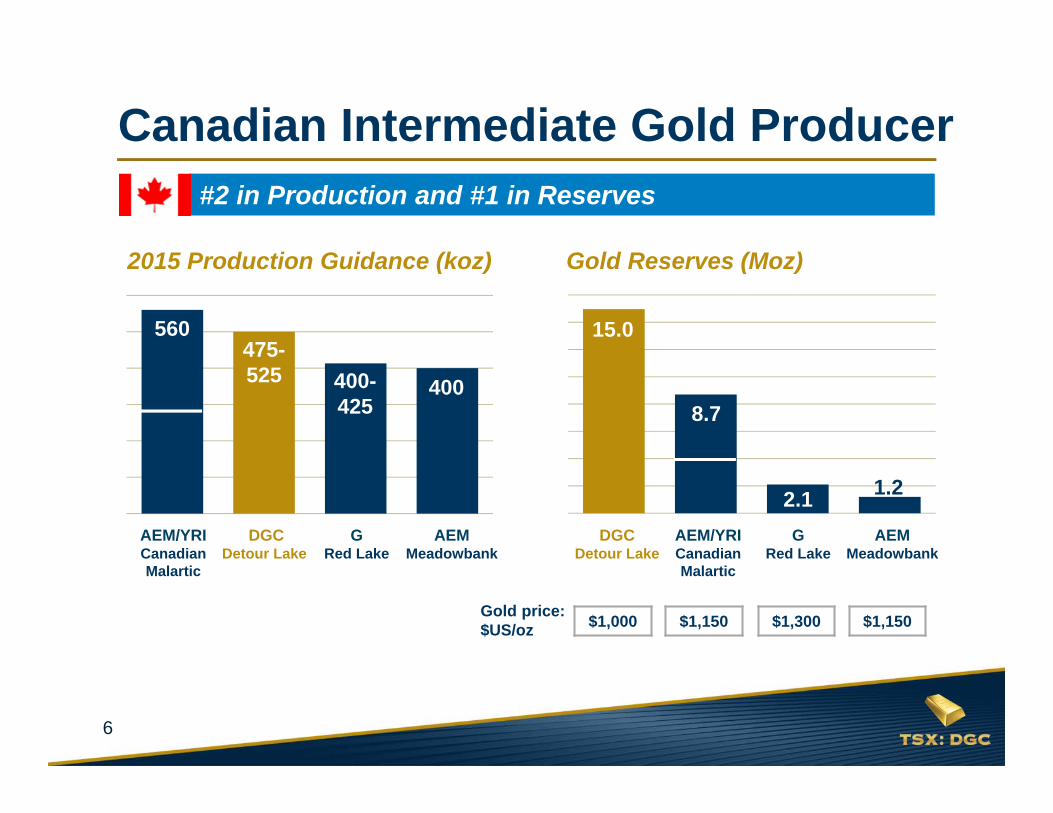
2015 Production Guidance (koz)
#2 in Production and #1 in Reserves
DGCDetour Lake
AEM/YRICanadian Malartic
AEMMeadowbank
GRed Lake
Canadian Intermediate Gold Producer
400-425
560475-525 400
Gold Reserves (Moz)
DGCDetour Lake
AEM/YRICanadian Malartic
AEMMeadowbank
GRed Lake
2.1
15.0
8.7
1.2
$1,000 $1,150 $1,300 $1,150Gold price: $US/oz
7
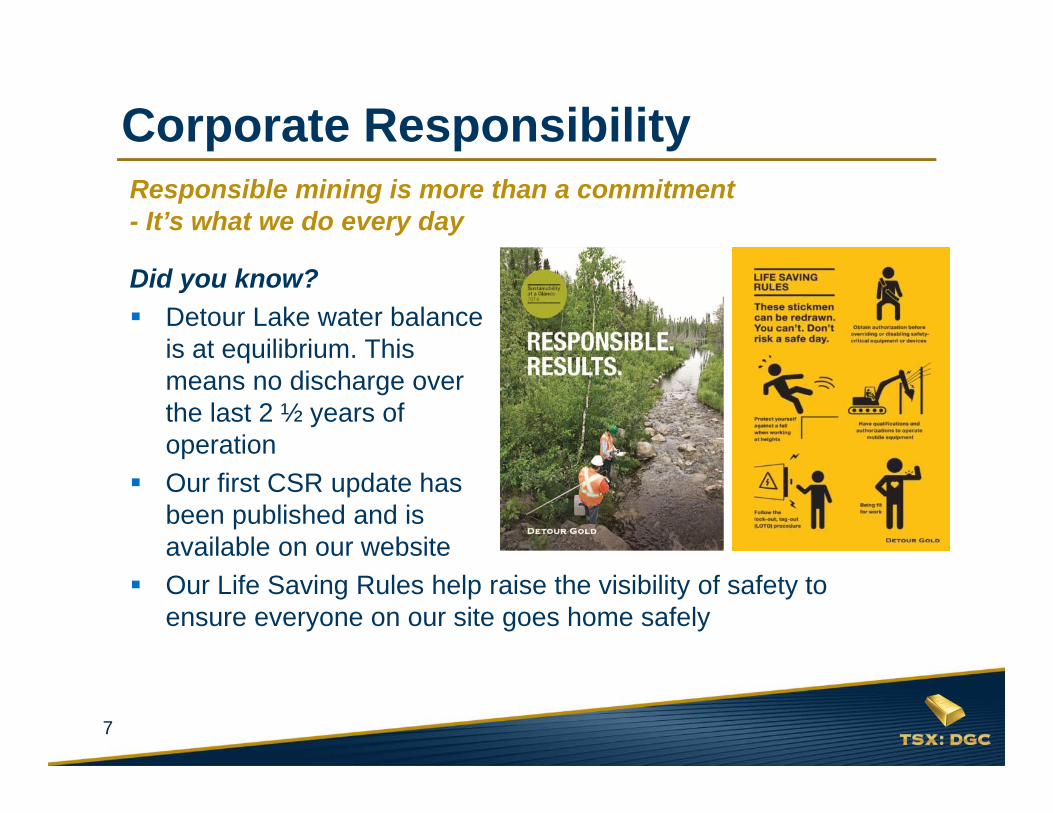
Responsible mining is more than a commitment- It’s what we do every day
Did you know? Detour Lake water balance
is at equilibrium. Thismeans no discharge overthe last 2 ½ years ofoperation
Our first CSR update has been published and is available on our website
Our Life Saving Rules help raise the visibility of safety to ensure everyone on our site goes home safely
Corporate Responsibility
MAINTENANCE
LABOUR18%
8
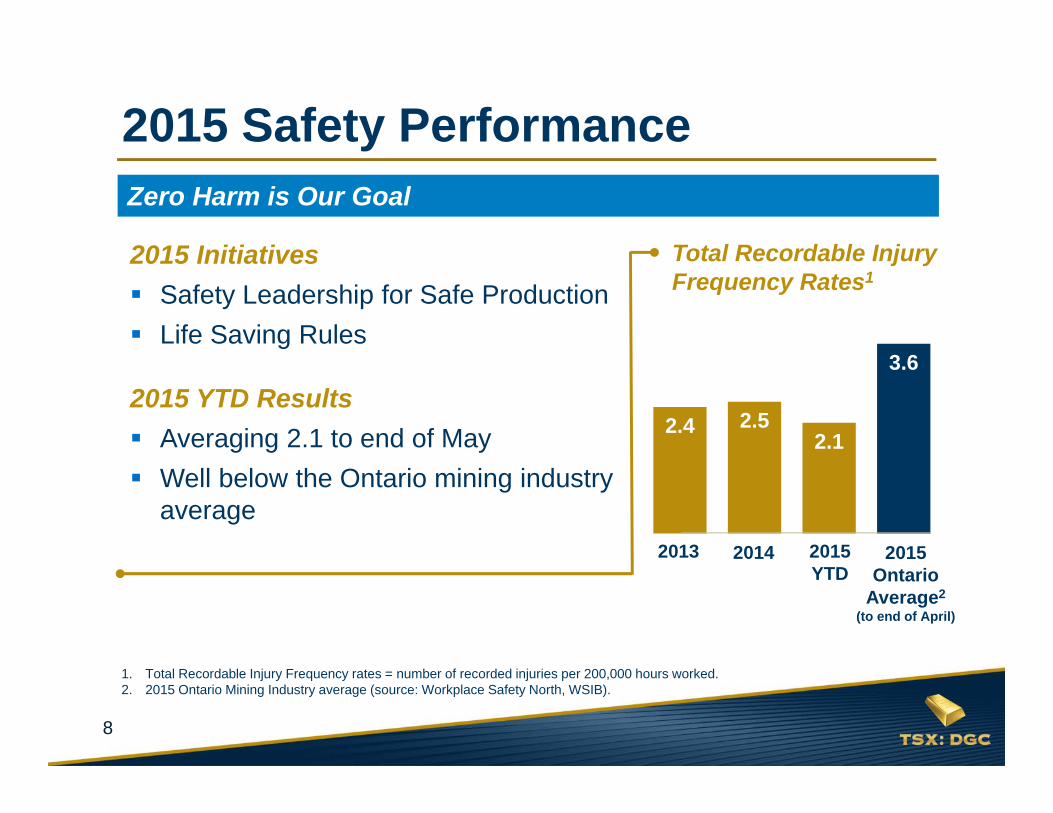
Zero Harm is Our Goal
Total Recordable Injury Frequency Rates1
2.4 2.52.1
3.6
00.5
11.5
22.5
33.5
4
2015 Safety Performance
2013 2014 2015 Ontario
Average2
(to end of April)
2015 Initiatives Safety Leadership for Safe Production Life Saving Rules
2015 YTD Results Averaging 2.1 to end of May Well below the Ontario mining industry
average
1. Total Recordable Injury Frequency rates = number of recorded injuries per 200,000 hours worked.2. 2015 Ontario Mining Industry average (source: Workplace Safety North, WSIB).
2015 YTD
9
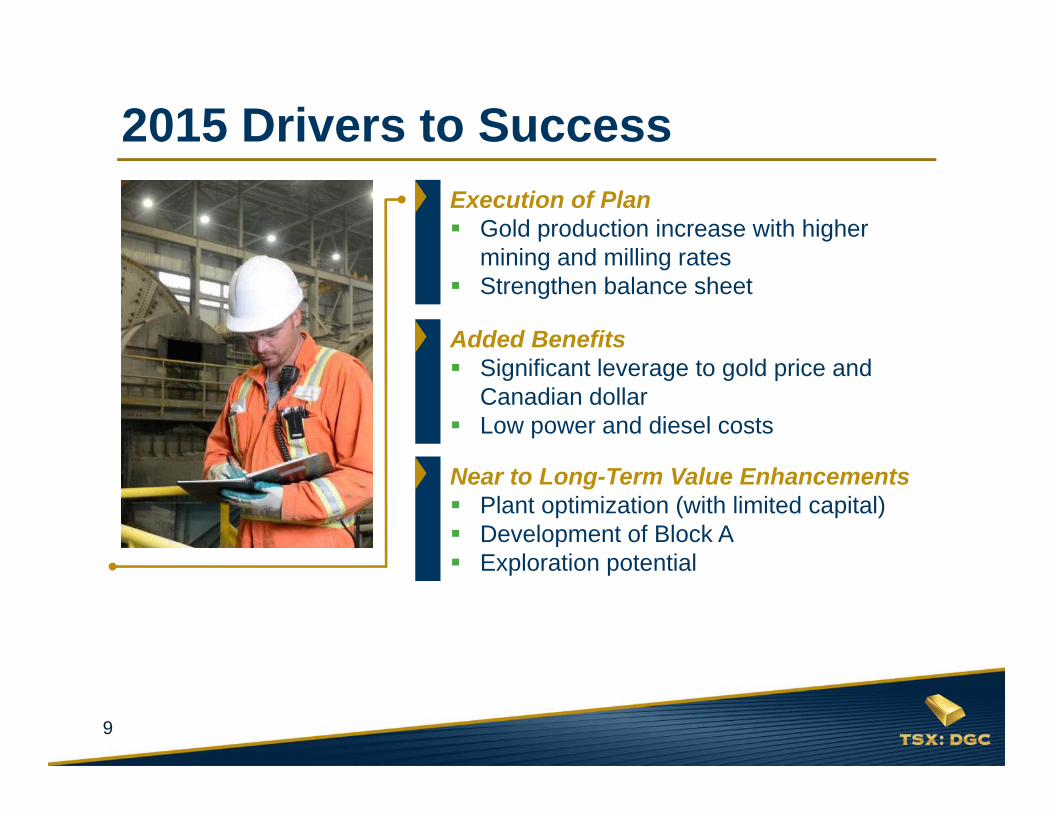
2015 Drivers to SuccessExecution of Plan Gold production increase with higher
mining and milling rates Strengthen balance sheet
Added Benefits Significant leverage to gold price and
Canadian dollar Low power and diesel costs
Near to Long-Term Value Enhancements Plant optimization (with limited capital) Development of Block A Exploration potential
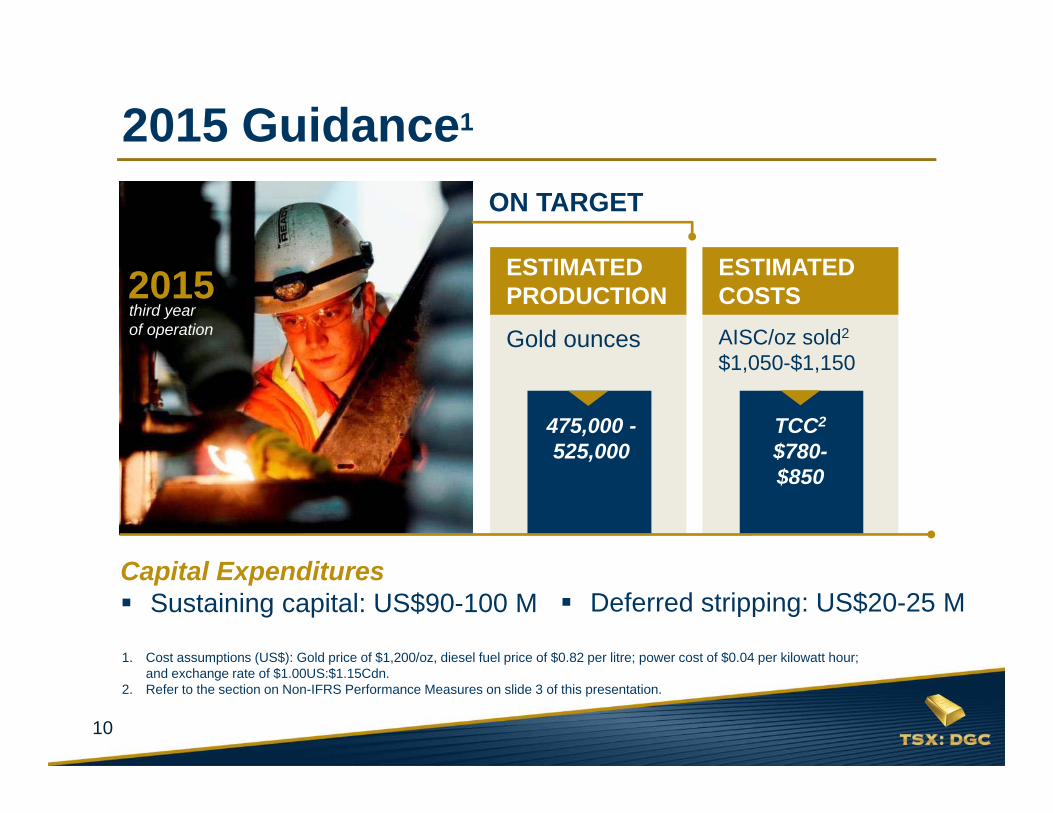
10
third year of operation
2015
2015 Guidance1
TCC2
$780-$850
AISC/oz sold2
$1,050-$1,150
Capital Expenditures Sustaining capital: US$90-100 M
ON TARGET
475,000 -525,000
Gold ounces
ESTIMATED COSTS
ESTIMATED PRODUCTION
Deferred stripping: US$20-25 M
1. Cost assumptions (US$): Gold price of $1,200/oz, diesel fuel price of $0.82 per litre; power cost of $0.04 per kilowatt hour; and exchange rate of $1.00US:$1.15Cdn.
2. Refer to the section on Non-IFRS Performance Measures on slide 3 of this presentation.
11
DETOUR LAKE OPERATIONPierre Beaudoin, COO 2015
12
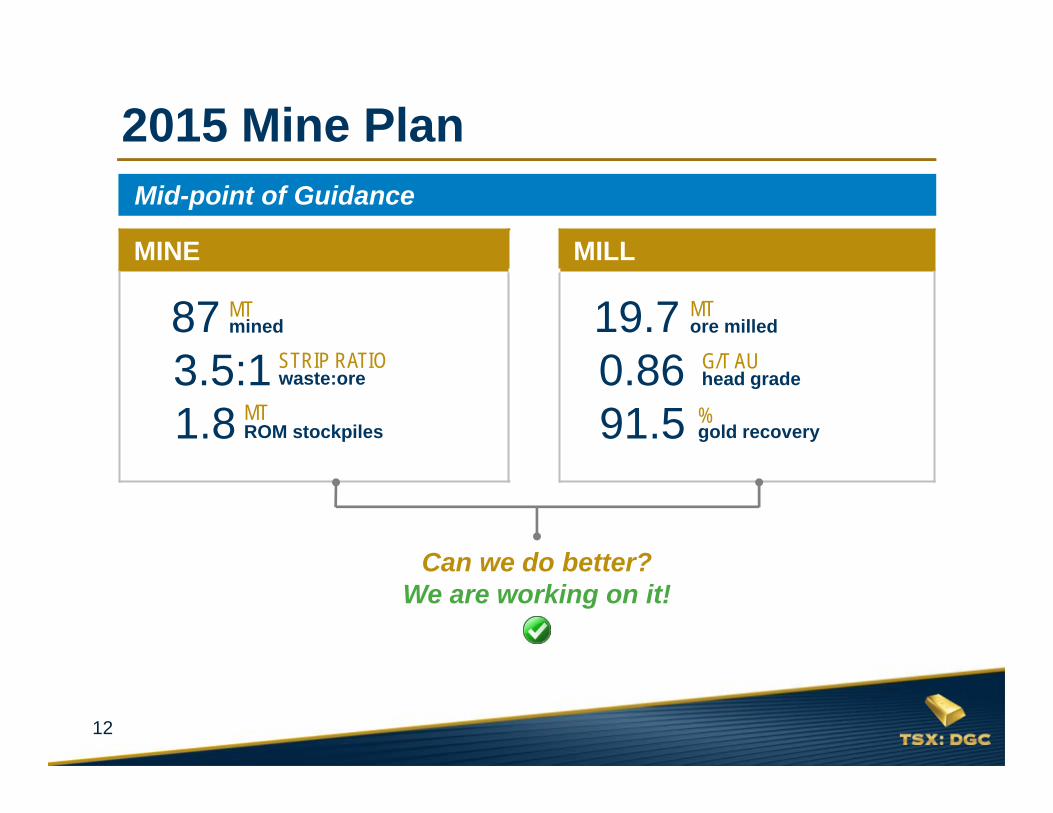
MINE MILL
2015 Mine PlanMid-point of Guidance
MTmined
3.5:1 STRIP RATIOwaste:ore
MTROM stockpiles
87
1.8
MTore milled
0.86 G/T AUhead grade
%gold recovery
19.7
91.5
Can we do better?We are working on it!
13
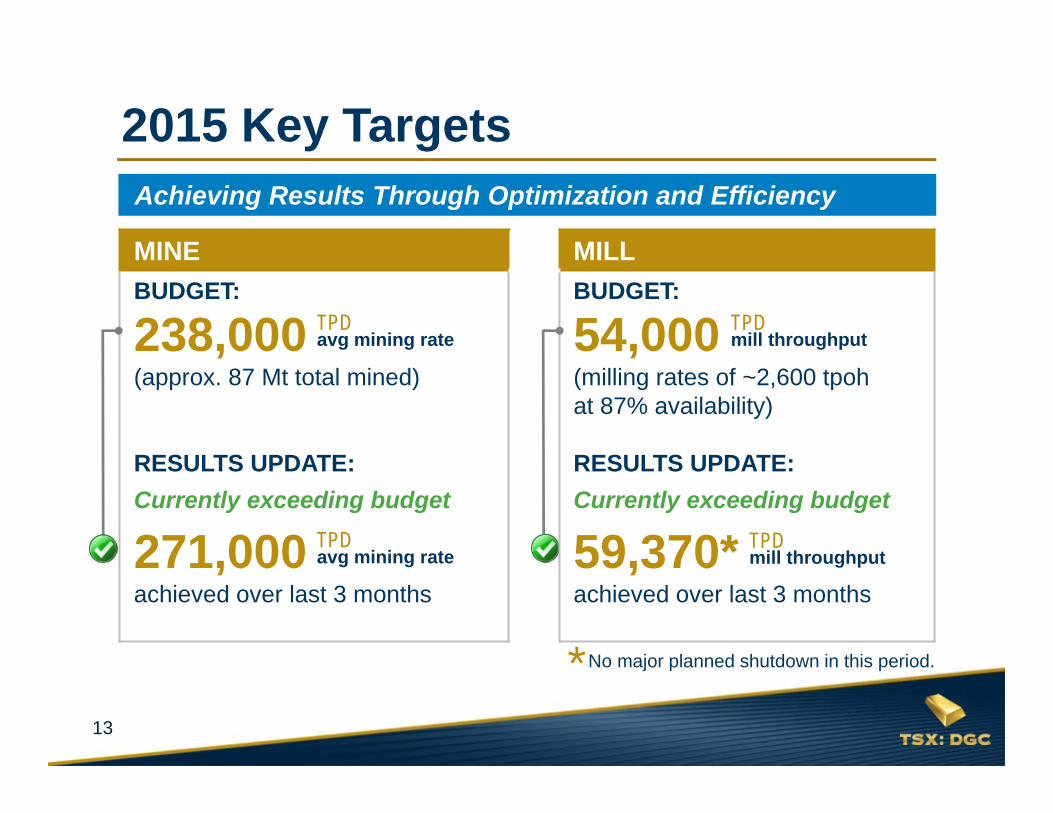
MINE MILLBUDGET:
238,000(approx. 87 Mt total mined)
RESULTS UPDATE:Currently exceeding budget
271,000achieved over last 3 months
BUDGET:
54,000(milling rates of ~2,600 tpohat 87% availability)
RESULTS UPDATE:Currently exceeding budget
59,370*achieved over last 3 months
2015 Key TargetsAchieving Results Through Optimization and Efficiency
TPDavg mining rate
TPDavg mining rate
TPDmill throughput
TPDmill throughput
No major planned shutdown in this period.*
14
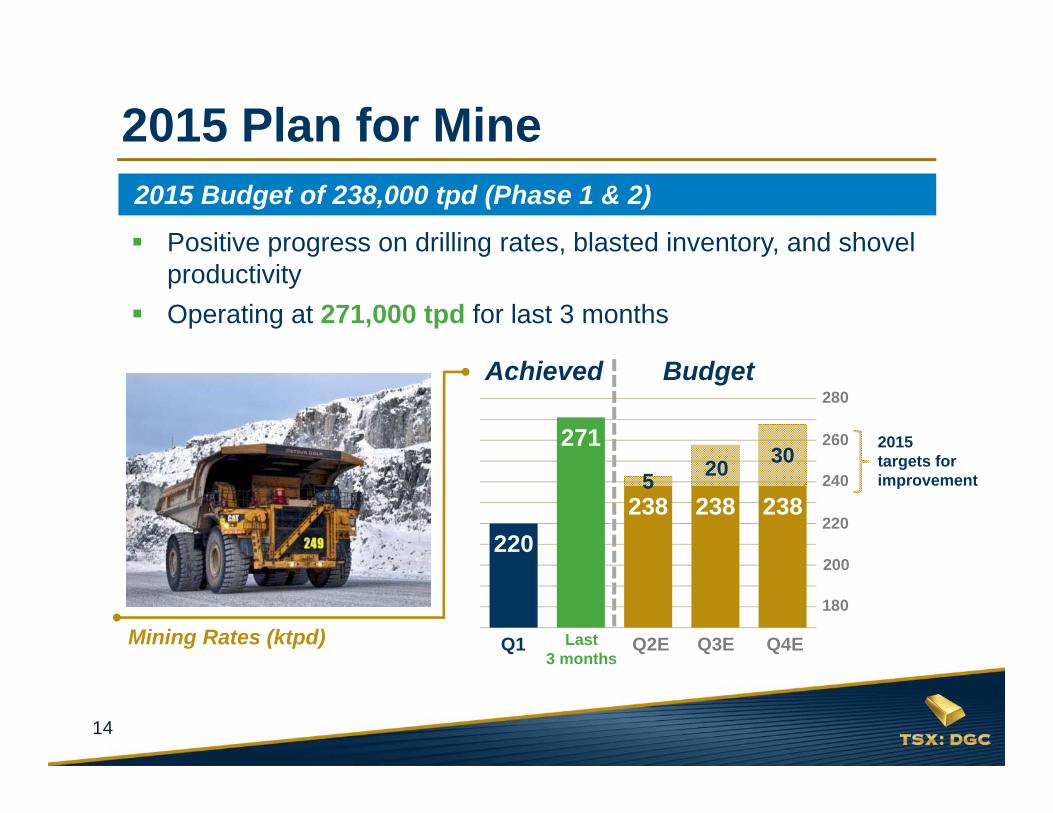
220
271
238 238 2385 20 30
Q1
280
Positive progress on drilling rates, blasted inventory, and shovel productivity
Operating at 271,000 tpd for last 3 months
Q2E Q4EQ3EMining Rates (ktpd)
2015 targets for improvement
260
220
180
2015 Plan for Mine2015 Budget of 238,000 tpd (Phase 1 & 2)
200
240
Last 3 months
Achieved Budget
15
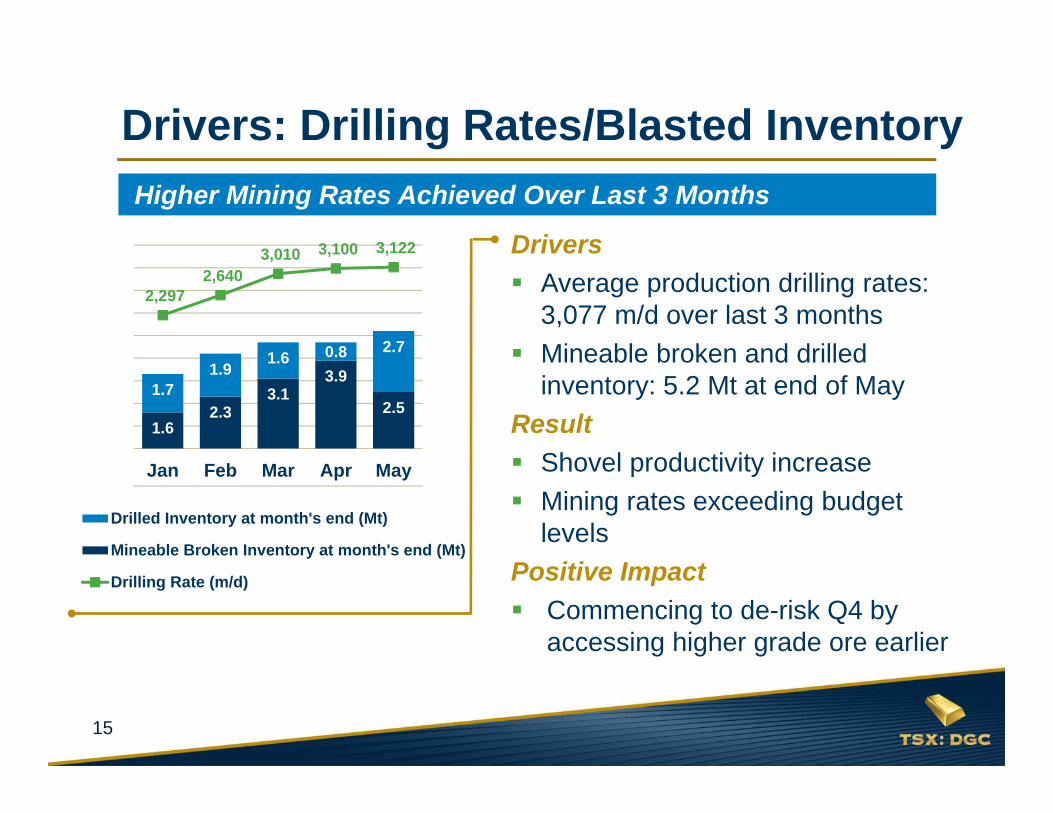
Drivers Average production drilling rates:
3,077 m/d over last 3 months Mineable broken and drilled
inventory: 5.2 Mt at end of MayResult Shovel productivity increase Mining rates exceeding budget
levelsPositive Impact Commencing to de-risk Q4 by
accessing higher grade ore earlier
Drivers: Drilling Rates/Blasted Inventory
1.62.3
3.13.9
2.51.7
1.91.6 0.8 2.7
2,297 2,640
3,010 3,100 3,122
0
500
1,000
1,500
2,000
2,500
3,000
3,500
0.01.02.03.04.05.06.07.08.09.0
Jan Feb Mar Apr May
Drilled Inventory at month's end (Mt)
Mineable Broken Inventory at month's end (Mt)
Drilling Rate (m/d)
Higher Mining Rates Achieved Over Last 3 Months
16
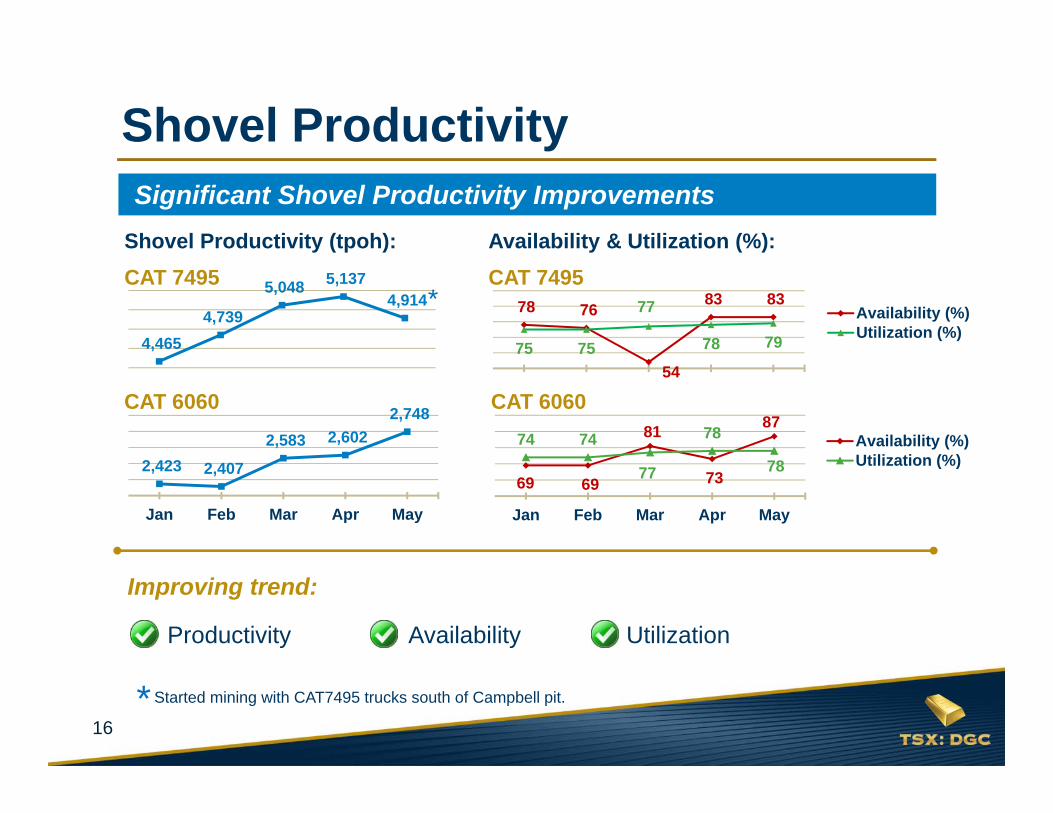
4,465 4,739
5,048 5,137 4,914
4,400.04,600.04,800.05,000.05,200.0
69 69
81
73
87 74 74
77
78
78
50.060.070.080.090.0
100.0
Jan Feb Mar Apr May
Availability (%)Utilization (%)2,423 2,407
2,583 2,602 2,748
2,350.02,450.02,550.02,650.02,750.02,850.0
Jan Feb Mar Apr May
78 76
54
83 83
75 75
77
78 7950.060.070.080.090.0
100.0
Jan Feb Mar Apr May
Availability (%)Utilization (%)
Shovel Productivity
Availability & Utilization (%):Shovel Productivity (tpoh):CAT 7495
CAT 6060CAT 6060
CAT 7495
Significant Shovel Productivity Improvements
Improving trend:
Productivity Availability Utilization
*Started mining with CAT7495 trucks south of Campbell pit.
*
17
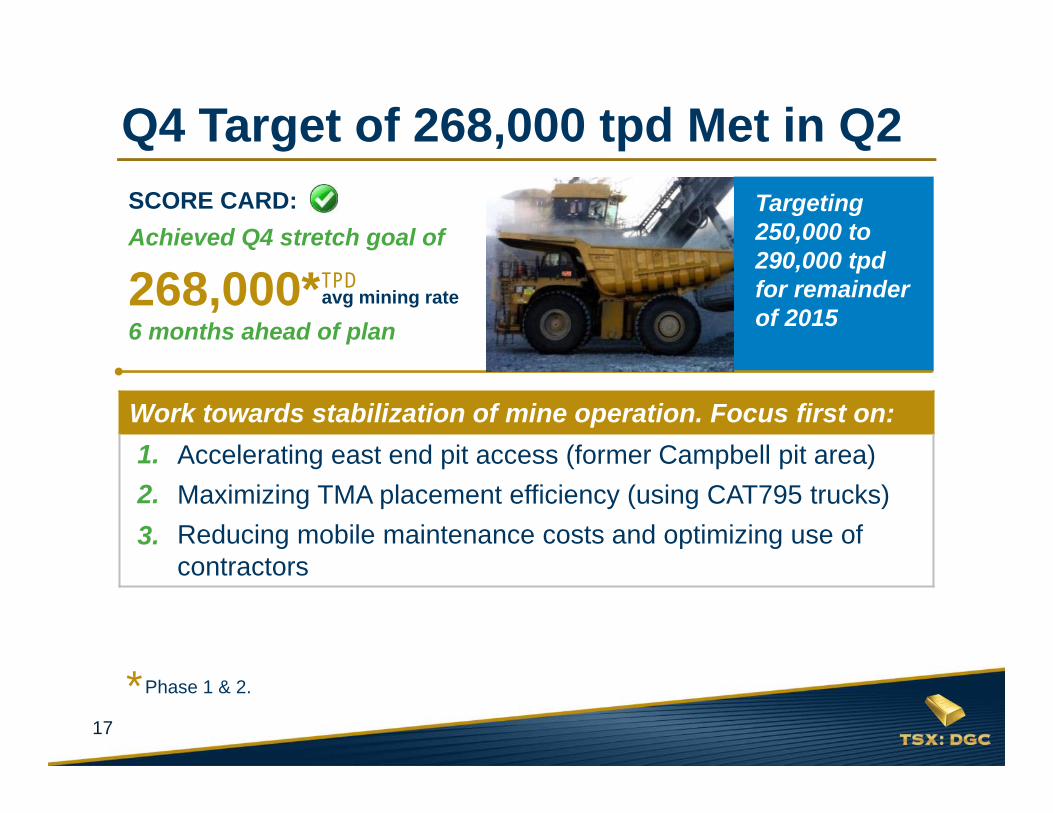
Q4 Target of 268,000 tpd Met in Q2SCORE CARD:Achieved Q4 stretch goal of
268,000*6 months ahead of plan
TPDavg mining rate
Phase 1 & 2.*
Targeting 250,000 to 290,000 tpdfor remainder of 2015
Work towards stabilization of mine operation. Focus first on:1. Accelerating east end pit access (former Campbell pit area)2. Maximizing TMA placement efficiency (using CAT795 trucks)3. Reducing mobile maintenance costs and optimizing use of
contractors
1.2.3.
18
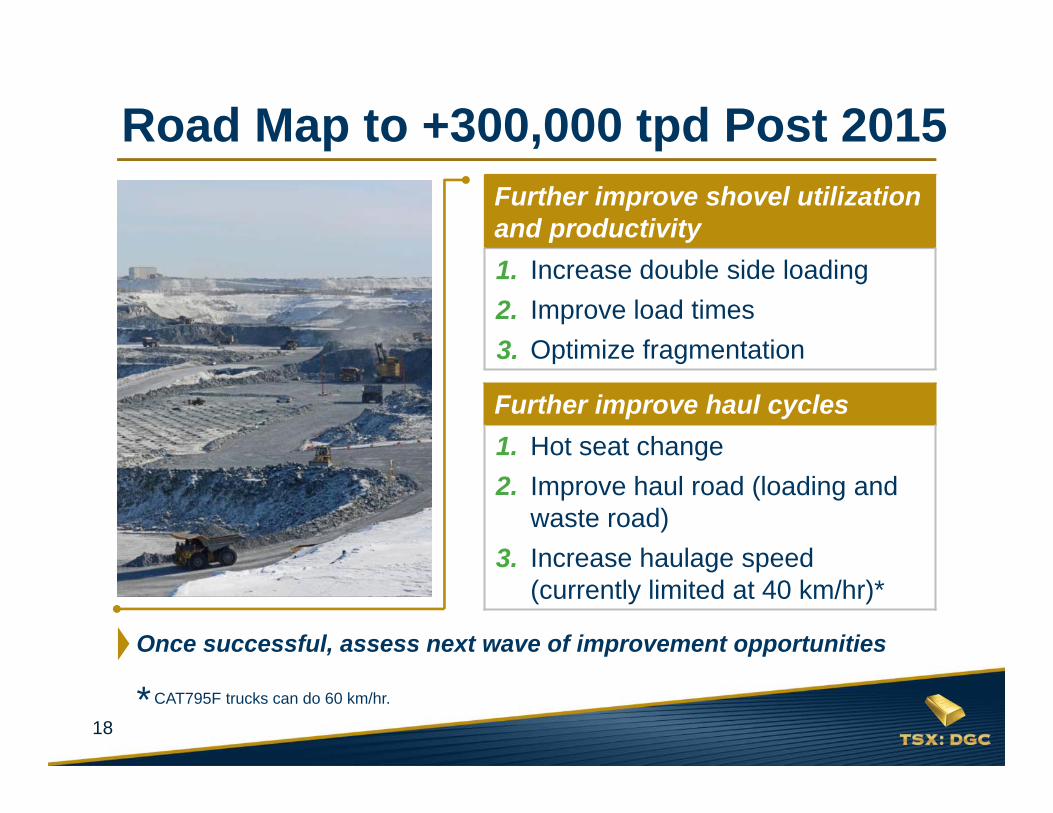
Road Map to +300,000 tpd Post 2015Further improve shovel utilization and productivity Increase double side loading Improve load times Optimize fragmentation
Further improve haul cycles Hot seat change Improve haul road (loading and
waste road) Increase haulage speed
(currently limited at 40 km/hr)*
1.2.
3.
1.2.3.
Once successful, assess next wave of improvement opportunities
*CAT795F trucks can do 60 km/hr.
19
020406080
100120140160180200
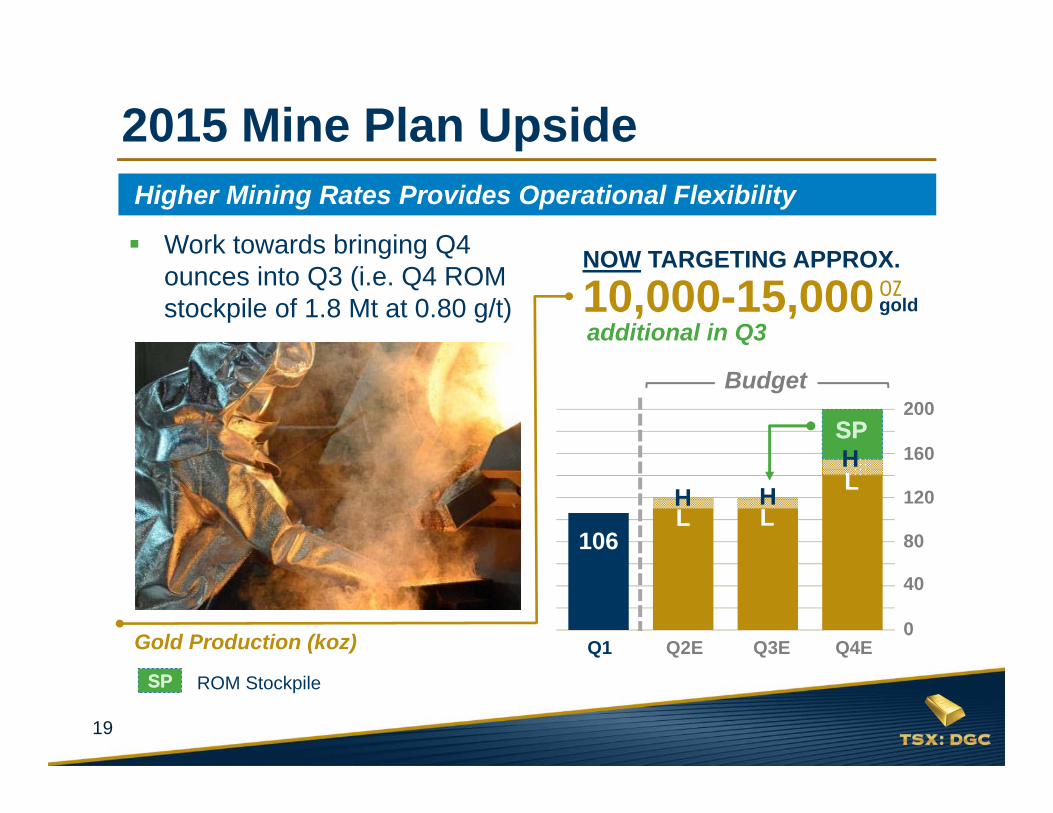
Work towards bringing Q4 ounces into Q3 (i.e. Q4 ROM stockpile of 1.8 Mt at 0.80 g/t)
200
160
120
80
40
0
Higher Mining Rates Provides Operational Flexibility
2015 Mine Plan Upside
H HHL
L L
SPSP
106
Q2E Q4EQ3EQ1Gold Production (koz)
ROM Stockpile
10,000-15,000additional in Q3
OZgold
NOW TARGETING APPROX.
Budget
SPSP
20
48
5955 55 55
30
35
40
45
50
55
60
Q1'15 Last 3months
Q2'15 Q3'15 Q4'15
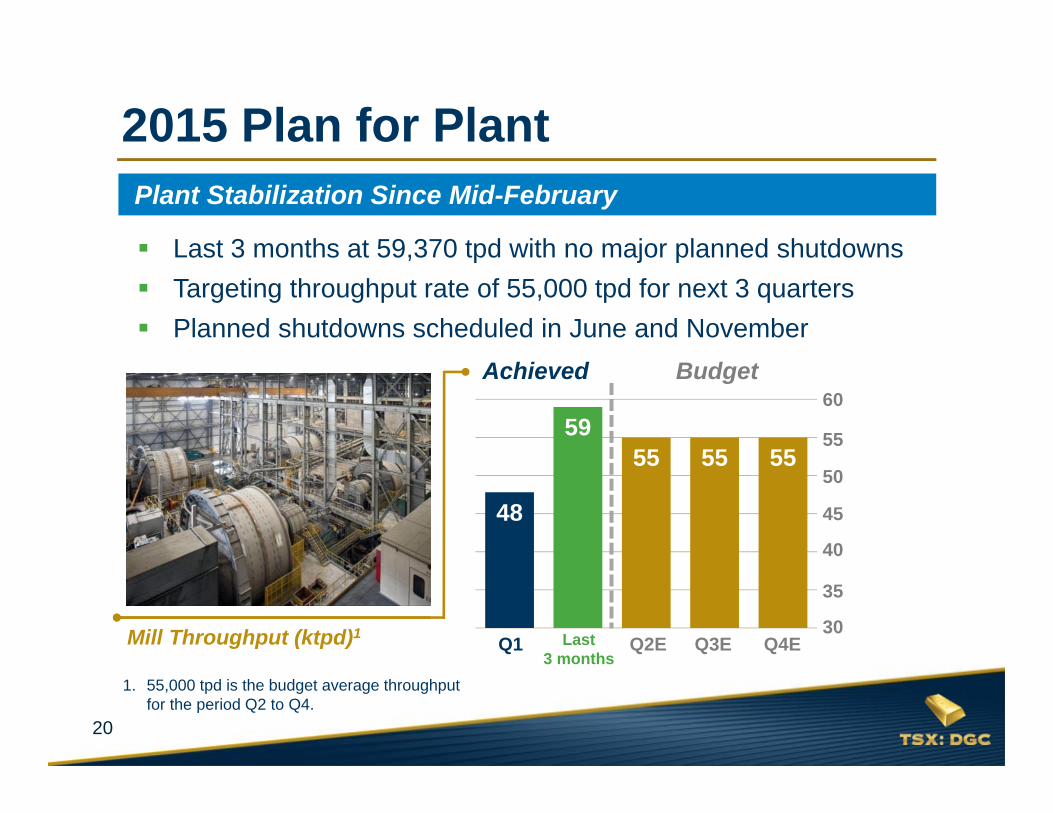
Last 3 months at 59,370 tpd with no major planned shutdowns Targeting throughput rate of 55,000 tpd for next 3 quarters Planned shutdowns scheduled in June and November
Plant Stabilization Since Mid-February
2015 Plan for Plant
Mill Throughput (ktpd)1
1. 55,000 tpd is the budget average throughput for the period Q2 to Q4.
60
50
40
30Q2E Q4EQ3EQ1 Last
3 months
Achieved Budget
35
55
45
21
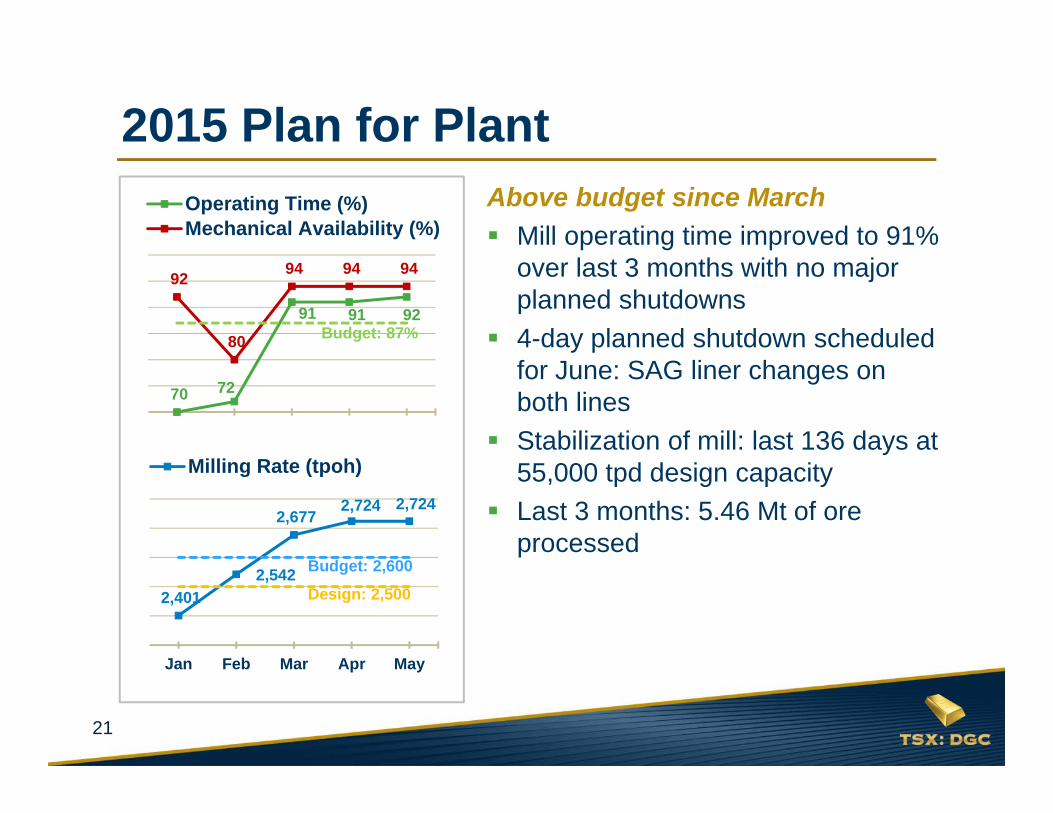
70 72
91 91 92
92
80
94 94 94
70.0
75.0
80.0
85.0
90.0
95.0
100.0
Jan Feb Mar Apr May
Operating Time (%)Mechanical Availability (%)
Above budget since March Mill operating time improved to 91%
over last 3 months with no major planned shutdowns
4-day planned shutdown scheduled for June: SAG liner changes on both lines
Stabilization of mill: last 136 days at 55,000 tpd design capacity
Last 3 months: 5.46 Mt of ore processed
2,401 2,542
2,677 2,724 2,724
2,300.0
2,400.0
2,500.0
2,600.0
2,700.0
2,800.0
Jan Feb Mar Apr May
Milling Rate (tpoh)
2015 Plan for Plant
Budget: 2,600
Budget: 87%
Design: 2,500
22
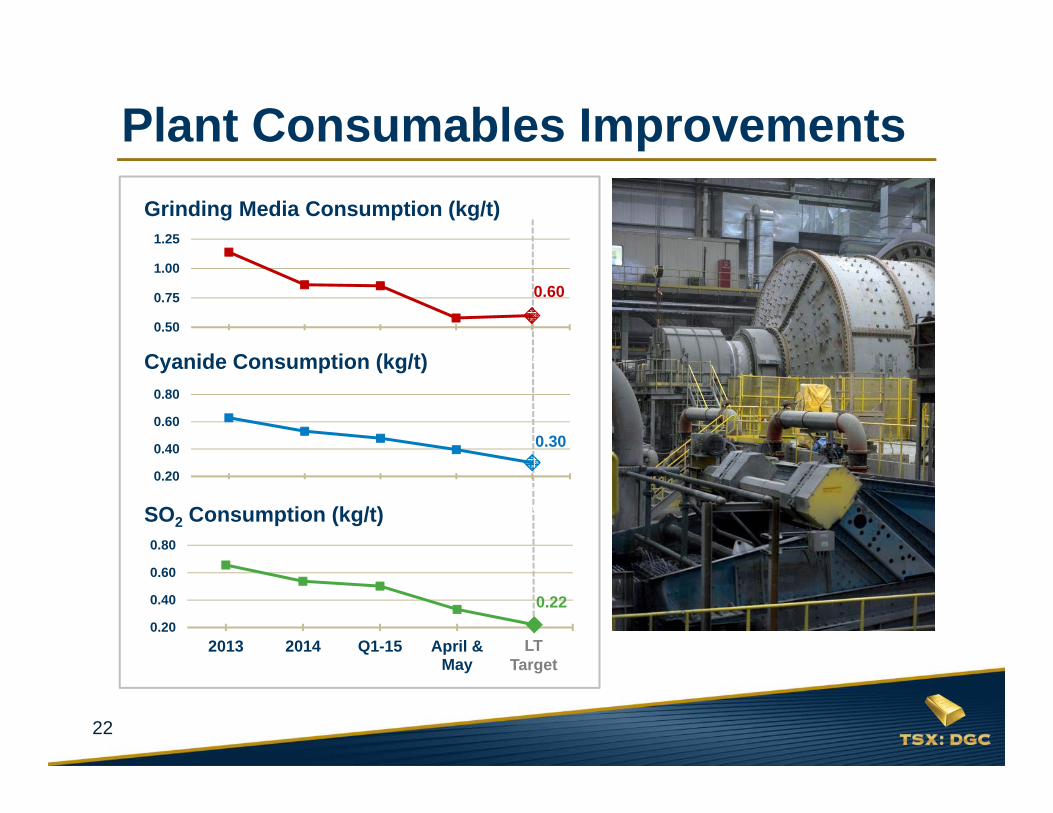
0.60
0.50
0.75
1.00
1.25
2013 2014 Q1-15 Q2-15to May 21
LTTarget
0.30
0.20
0.40
0.60
0.80
2013 2014 Q1-15 Q2-15to May 21
LTTarget
0.220.20
0.40
0.60
0.80
2013 2014 Q1-15 April &May
LTTarget
Grinding Media Consumption (kg/t)
SO2 Consumption (kg/t)
Cyanide Consumption (kg/t)
LT Target
Plant Consumables Improvements
23
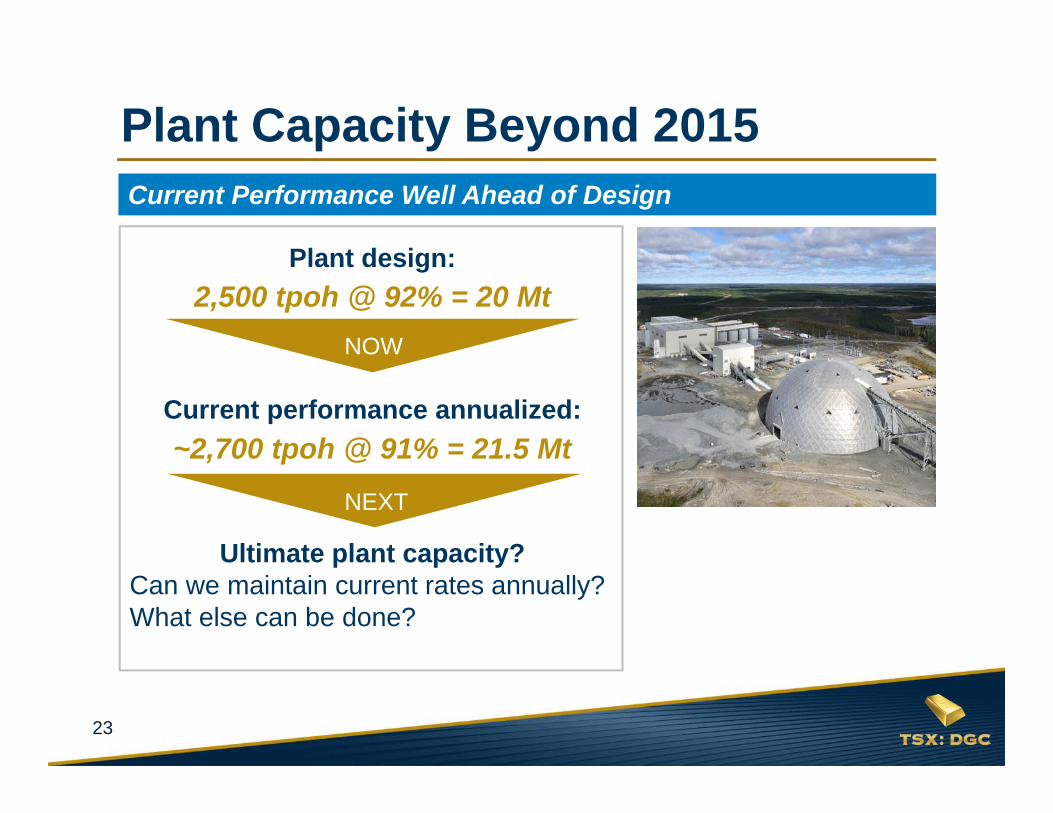
Plant design:
Current performance annualized:
Ultimate plant capacity?Can we maintain current rates annually?What else can be done?
Plant Capacity Beyond 2015Current Performance Well Ahead of Design
~2,700 tpoh @ 91% = 21.5 Mt
2,500 tpoh @ 92% = 20 MtNOW
NEXT
24
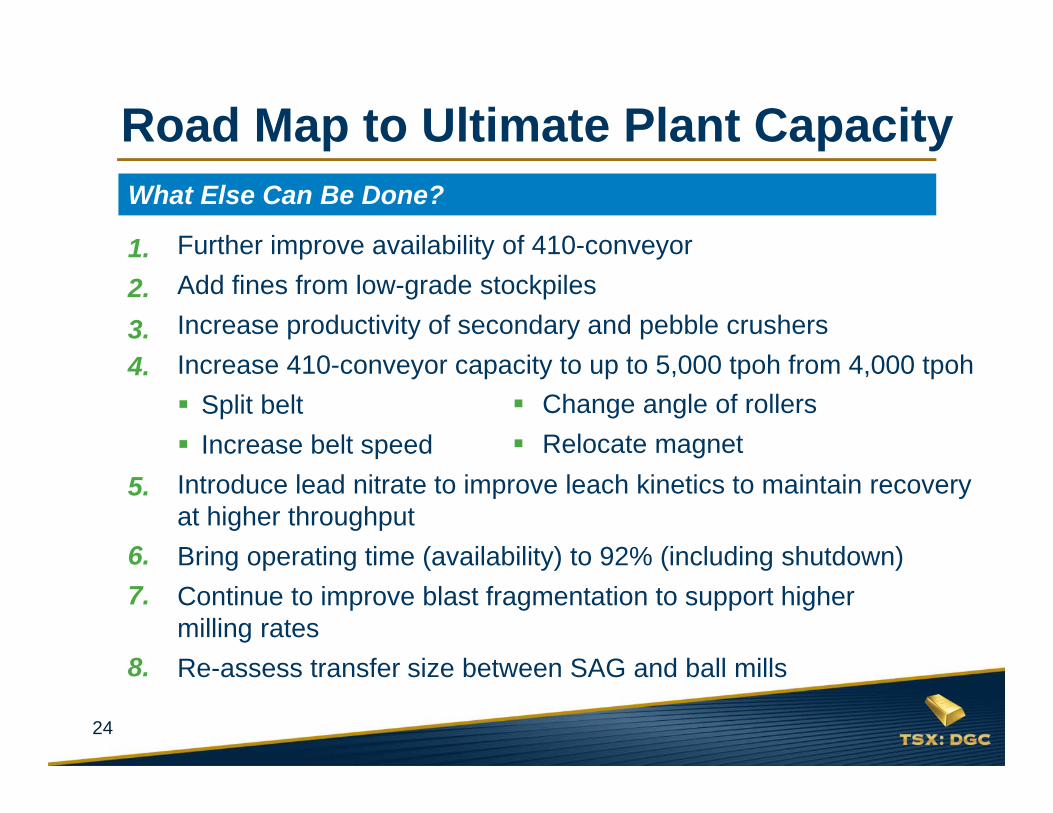
Road Map to Ultimate Plant Capacity
1. Further improve availability of 410-conveyor1. Add fines from low-grade stockpiles2. Increase productivity of secondary and pebble crushers3. Increase 410-conveyor capacity to up to 5,000 tpoh from 4,000 tpoh
Split belt Increase belt speed
4. Introduce lead nitrate to improve leach kinetics to maintain recovery at higher throughput
5. Bring operating time (availability) to 92% (including shutdown)6. Continue to improve blast fragmentation to support higher
milling rates7. Re-assess transfer size between SAG and ball mills
1.2.3.4.
5.
What Else Can Be Done?
6.7.
8.
Change angle of rollers Relocate magnet
25
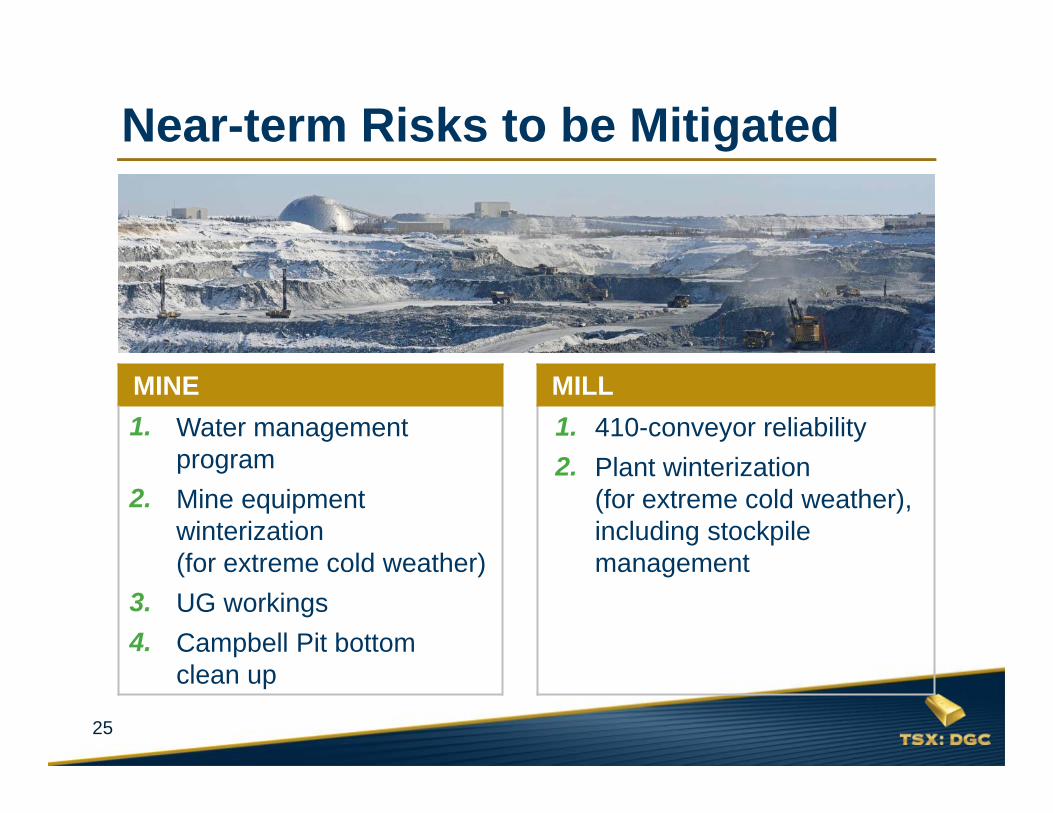
Near-term Risks to be Mitigated
MINE MILL1. Water management
program2. Mine equipment
winterization (for extreme cold weather)
3. UG workings4. Campbell Pit bottom
clean up
1. 410-conveyor reliability2. Plant winterization
(for extreme cold weather), including stockpile management
1.
2.
3.
1.2.
4.
26
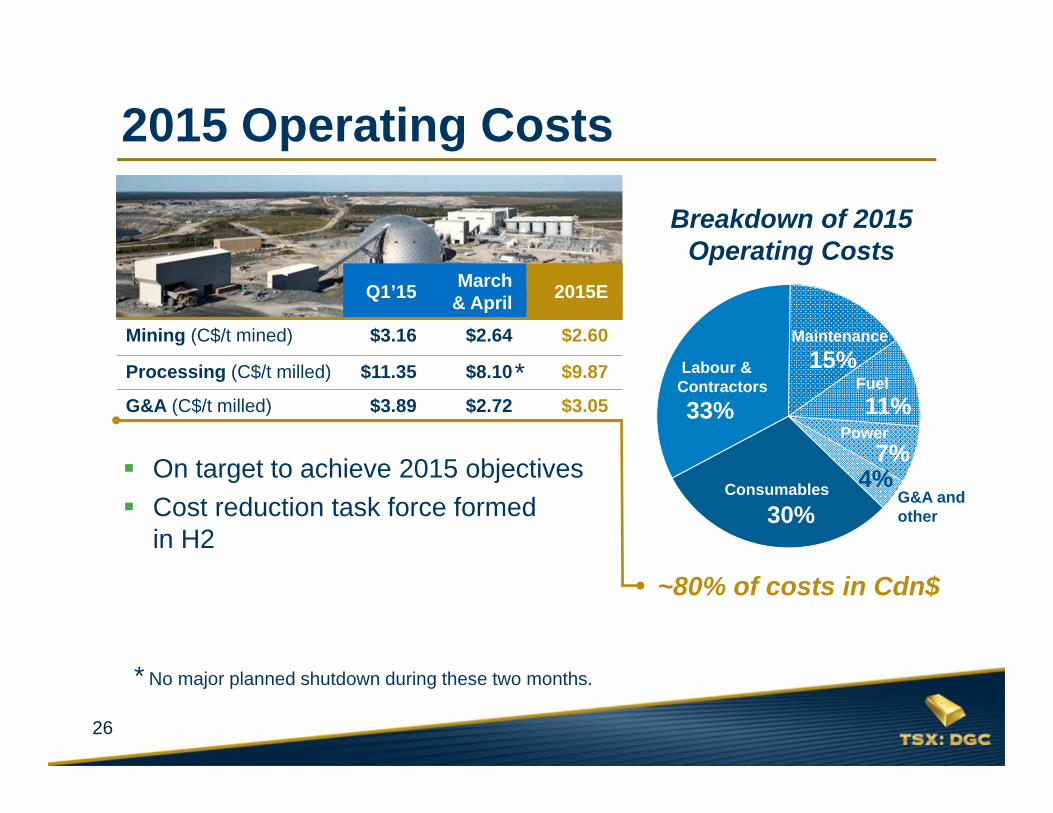
~80% of costs in Cdn$
2015 Operating Costs
Maintenance
Labour & Contractors
Power
Fuel
G&A and other
Consumables
30%
15%
33%
7%
11%
4% On target to achieve 2015 objectives Cost reduction task force formed
in H2
Breakdown of 2015 Operating Costs
Q1’15 March & April 2015E
Mining (C$/t mined) $3.16 $2.64 $2.60
Processing (C$/t milled) $11.35 $8.10 $9.87
G&A (C$/t milled) $3.89 $2.72 $3.05
* No major planned shutdown during these two months.
*
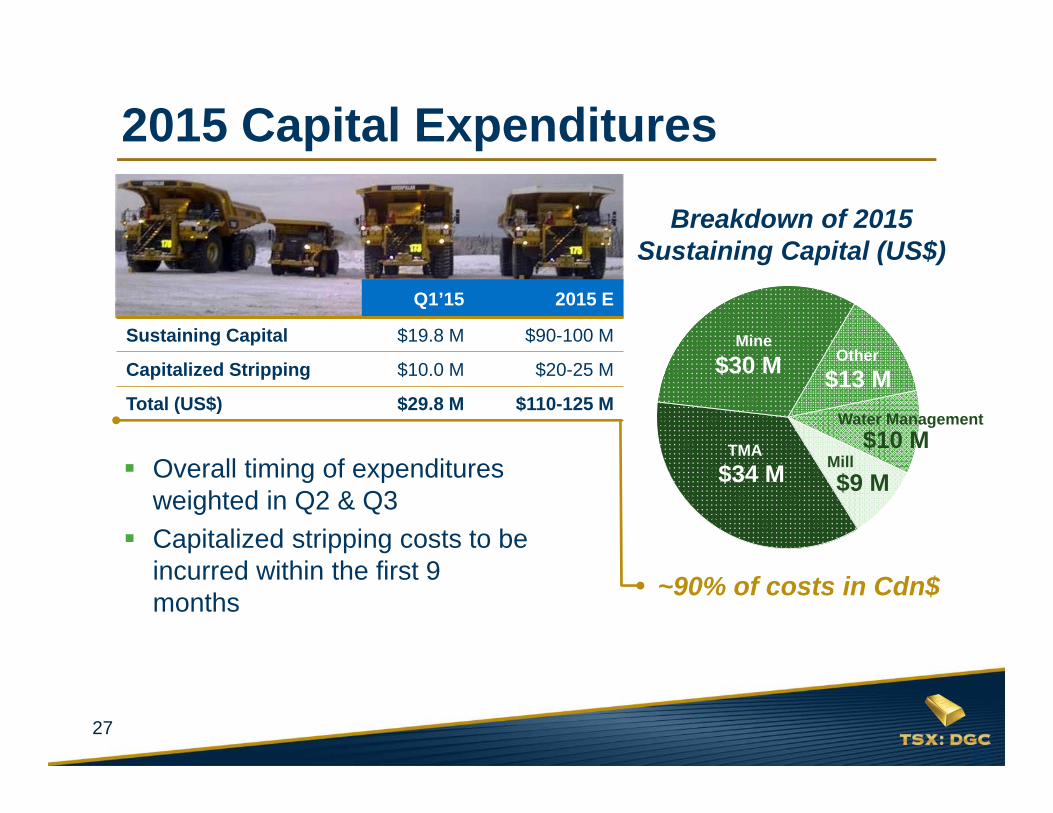
27
Overall timing of expenditures weighted in Q2 & Q3
Capitalized stripping costs to be incurred within the first 9 months
Mine$30 M
TMA$34 M
Other$13 M
Mill$9 M
Water Management$10 M
Breakdown of 2015 Sustaining Capital (US$)
~90% of costs in Cdn$
27
2015 Capital Expenditures
Q1’15 2015 E
Sustaining Capital $19.8 M $90-100 M
Capitalized Stripping $10.0 M $20-25 M
Total (US$) $29.8 M $110-125 M
28
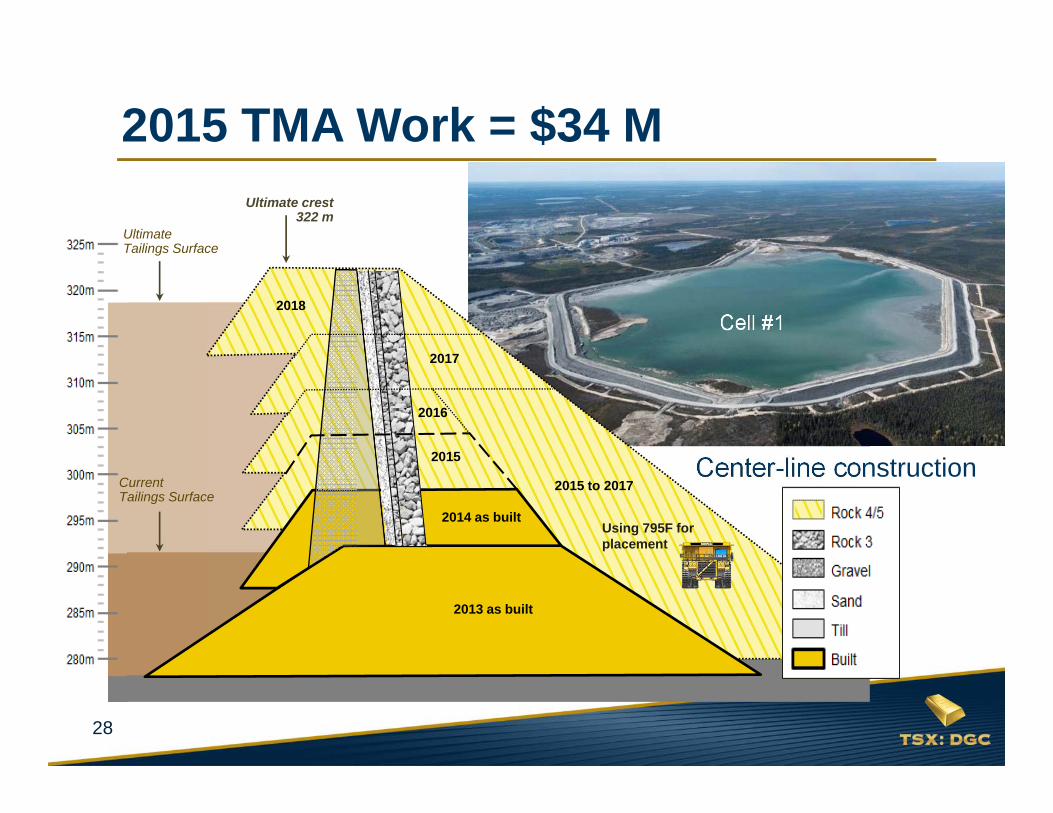
Cell #1
2015 TMA Work = $34 M
Center-line constructionCurrent Tailings Surface
Ultimate Tailings Surface
2014 as built
2013 as built
2016
2017
2015
2018
2015 to 2017
Ultimate crest322 m
Using 795F for placement
29
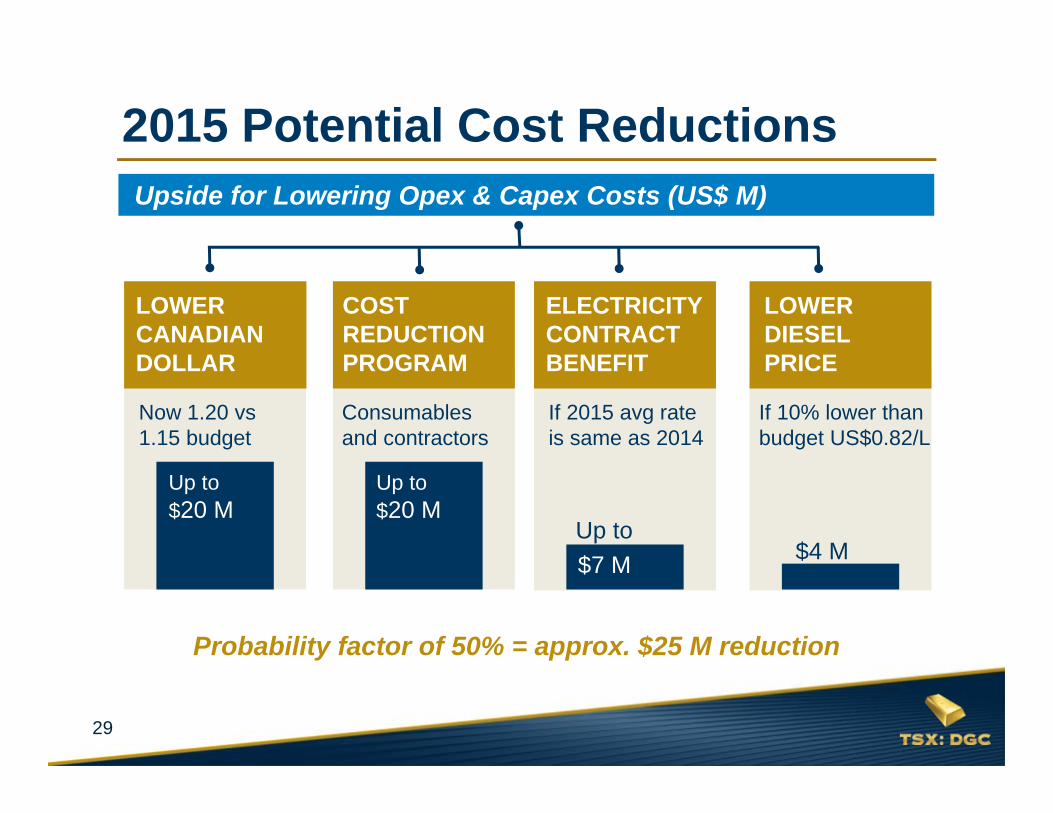
Upside for Lowering Opex & Capex Costs (US$ M)
Now 1.20 vs 1.15 budget
If 2015 avg rateis same as 2014
If 10% lower than budget US$0.82/L
Up to $20 M
LOWER CANADIAN DOLLAR
COST REDUCTION PROGRAM
ELECTRICITY CONTRACT BENEFIT
LOWER DIESEL PRICE
Consumables and contractors
$4 M
Probability factor of 50% = approx. $25 M reduction
$7 M
2015 Potential Cost Reductions
Up to $20 M
Up to
30
FINANCIAL REVIEWPaul Martin, President & CEO2015
31
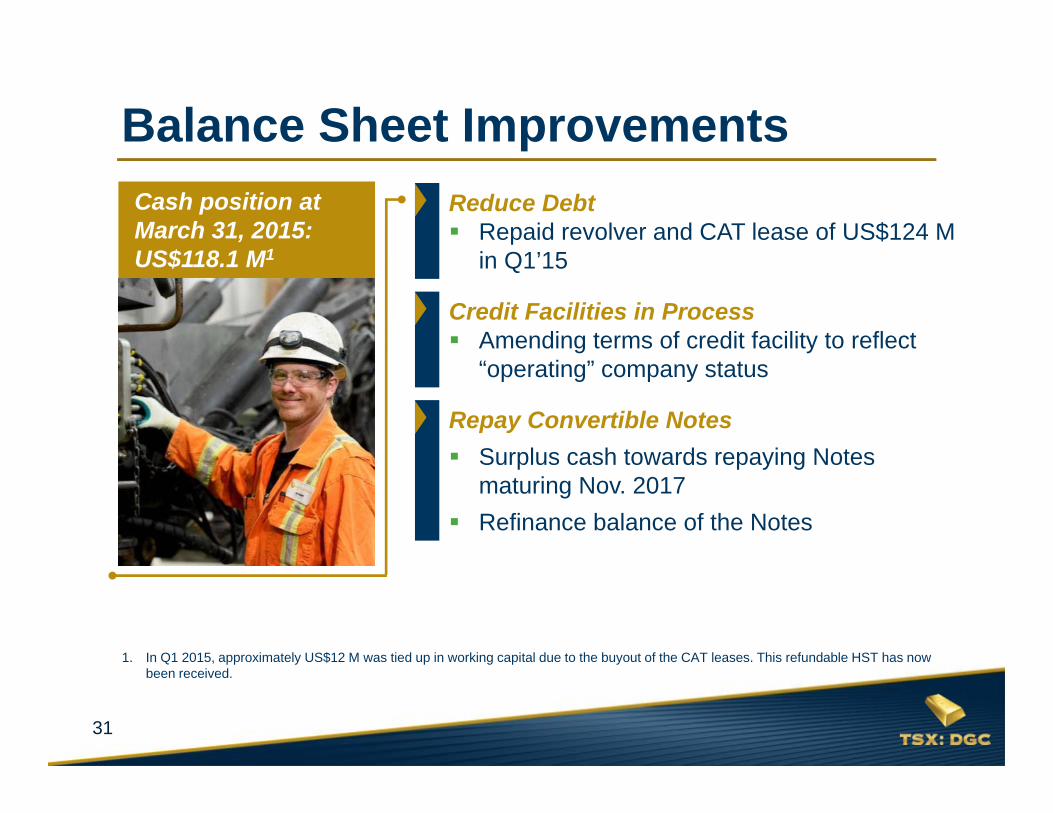
Cash position at March 31, 2015: US$118.1 M1
Balance Sheet ImprovementsReduce Debt Repaid revolver and CAT lease of US$124 M
in Q1’15
Credit Facilities in Process Amending terms of credit facility to reflect
“operating” company status
Repay Convertible Notes Surplus cash towards repaying Notes
maturing Nov. 2017 Refinance balance of the Notes
1. In Q1 2015, approximately US$12 M was tied up in working capital due to the buyout of the CAT leases. This refundable HST has now been received.
32
Credit Facility of US$50-70 M Amend prior facility to eliminate Completion Test and improve
covenant structure Good banking relationships with 5 banks (BMO, CIBC, CBA,
RBC, and TD) Finalize by mid-2015Equipment Lease Facility Re-establish a US$50 M equipment lease facility
Available Credit Facilities in Place
33
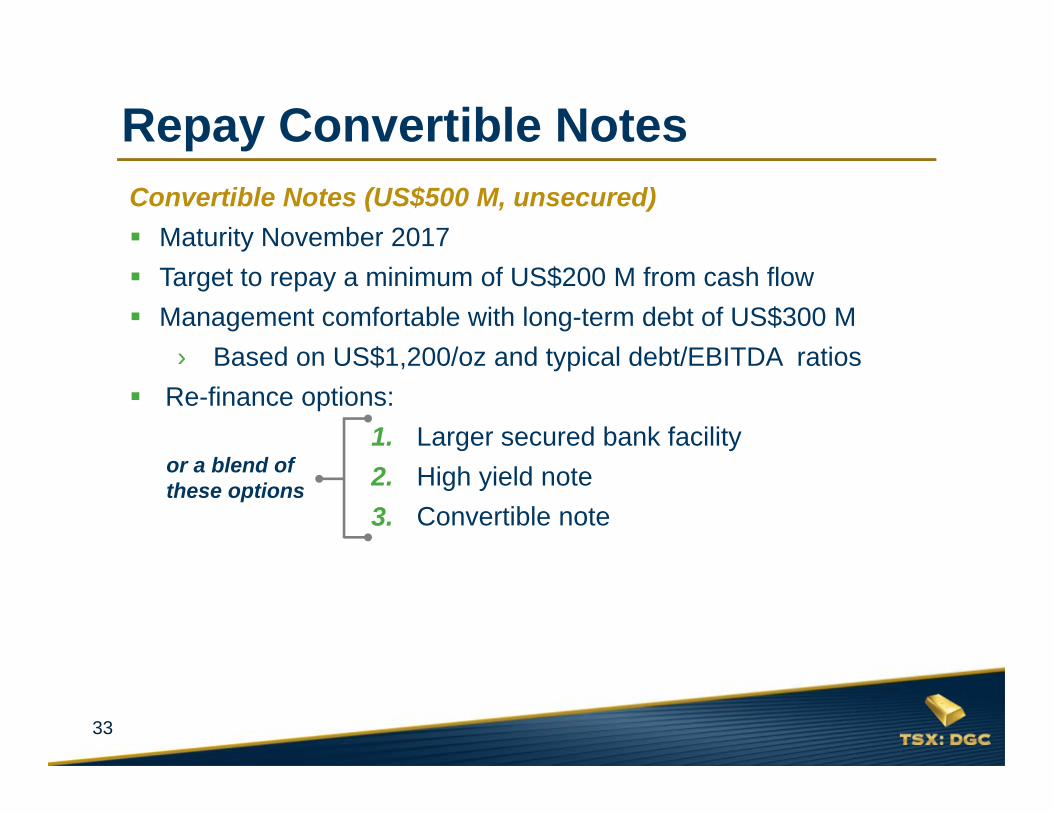
Convertible Notes (US$500 M, unsecured) Maturity November 2017 Target to repay a minimum of US$200 M from cash flow Management comfortable with long-term debt of US$300 M
› Based on US$1,200/oz and typical debt/EBITDA ratios Re-finance options:
1. Larger secured bank facility2. High yield note3. Convertible note
Repay Convertible Notes
or a blend of these options
1.2.3.
34
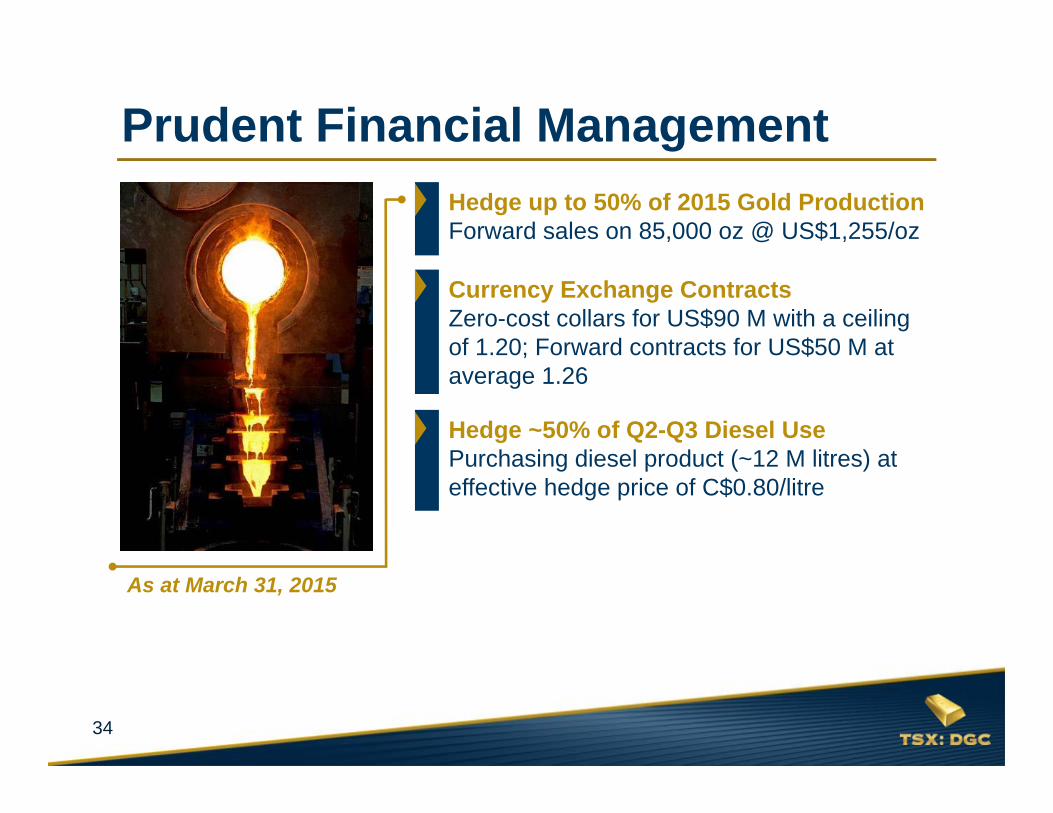
Prudent Financial ManagementHedge up to 50% of 2015 Gold ProductionForward sales on 85,000 oz @ US$1,255/oz
Currency Exchange ContractsZero-cost collars for US$90 M with a ceiling of 1.20; Forward contracts for US$50 M at average 1.26
Hedge ~50% of Q2-Q3 Diesel UsePurchasing diesel product (~12 M litres) at effective hedge price of C$0.80/litre
As at March 31, 2015
35
OPPORTUNITIESPierre Beaudoin, COONEAR-TERM
36
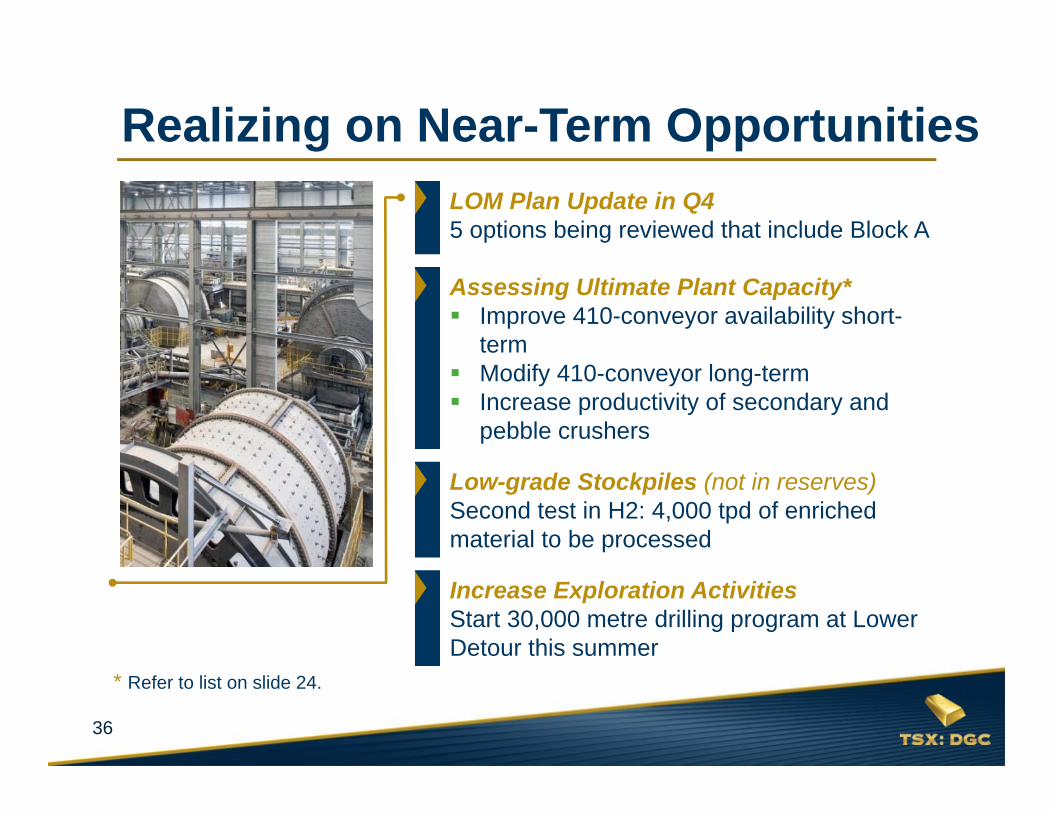
Realizing on Near-Term Opportunities LOM Plan Update in Q45 options being reviewed that include Block A
Assessing Ultimate Plant Capacity* Improve 410-conveyor availability short-
term Modify 410-conveyor long-term Increase productivity of secondary and
pebble crushers
Low-grade Stockpiles (not in reserves)Second test in H2: 4,000 tpd of enriched material to be processed
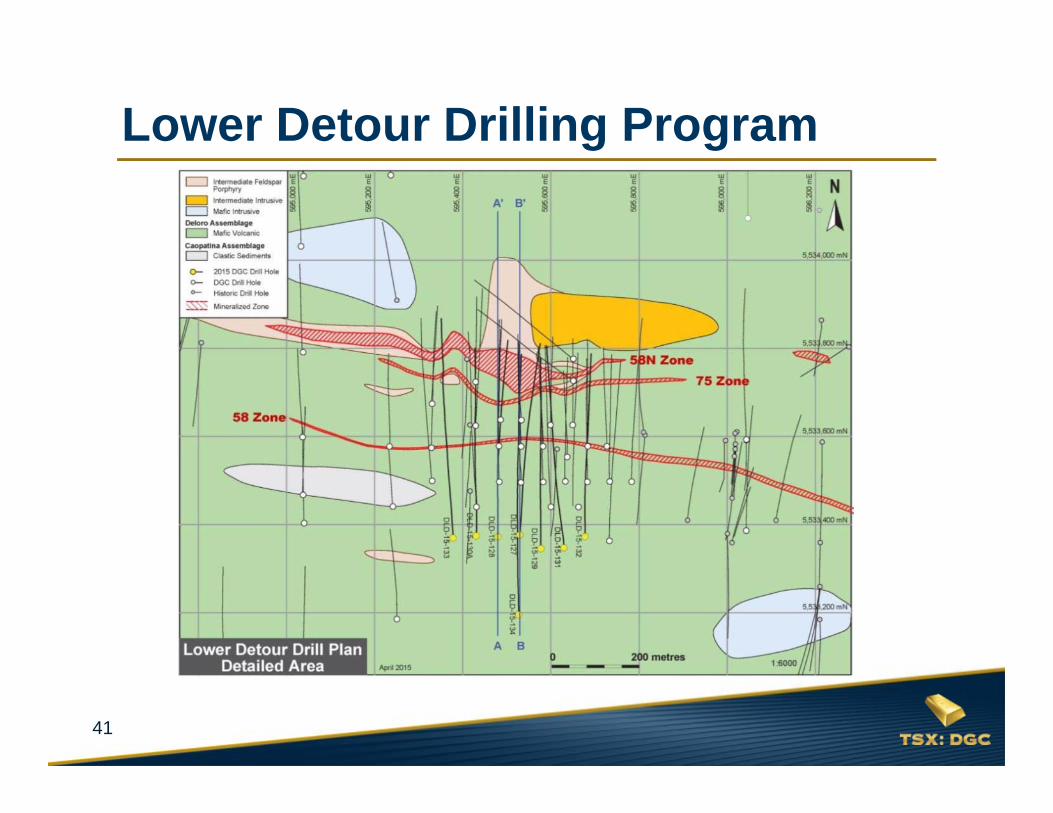
Increase Exploration ActivitiesStart 30,000 metre drilling program at Lower Detour this summer
* Refer to list on slide 24.
37
Pit shells based on US$1,000/oz Maximize returns for next 5-10 years and optimize NAV Optimize capital allocation of the mining fleet Add only valuable incremental ounces Mining rates and pit sequences will establish plant feed grades
Block A included in scenario development for LOM plan
LOM Plan UpdateTechnical Report to be Issued With 2016 Guidance
38
Key evaluations focusing on: Evaluate production ranging from 105 to 140 Mt annually
(equivalent to mining rates of 288,000 to 385,000 tpd) Mining rates and timing of ongoing production increases year to
year:1. No new shovels2. Incremental shovel(s):
CAT6030 and/or CAT6060
Timing of Block A (at earliest 2018) TMA options and potential co-disposal in Block A pit
LOM Plan UpdateEvaluating 5 Scenarios
Options being considered
1.2.
39
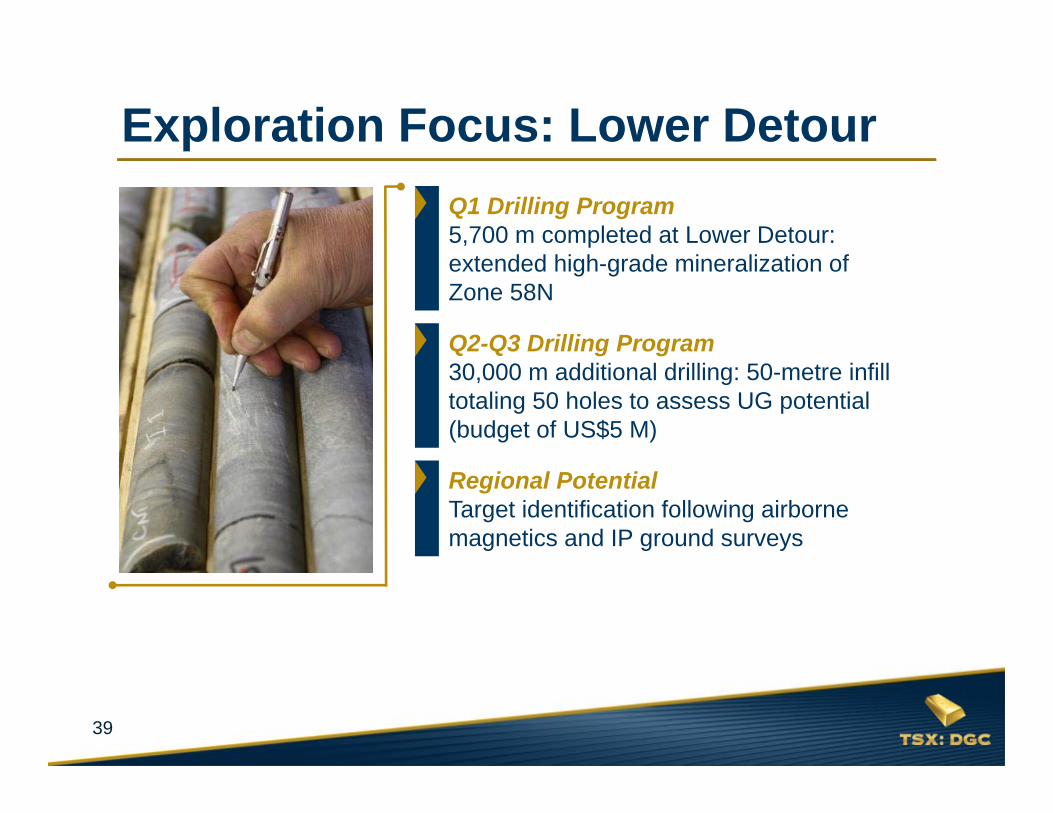
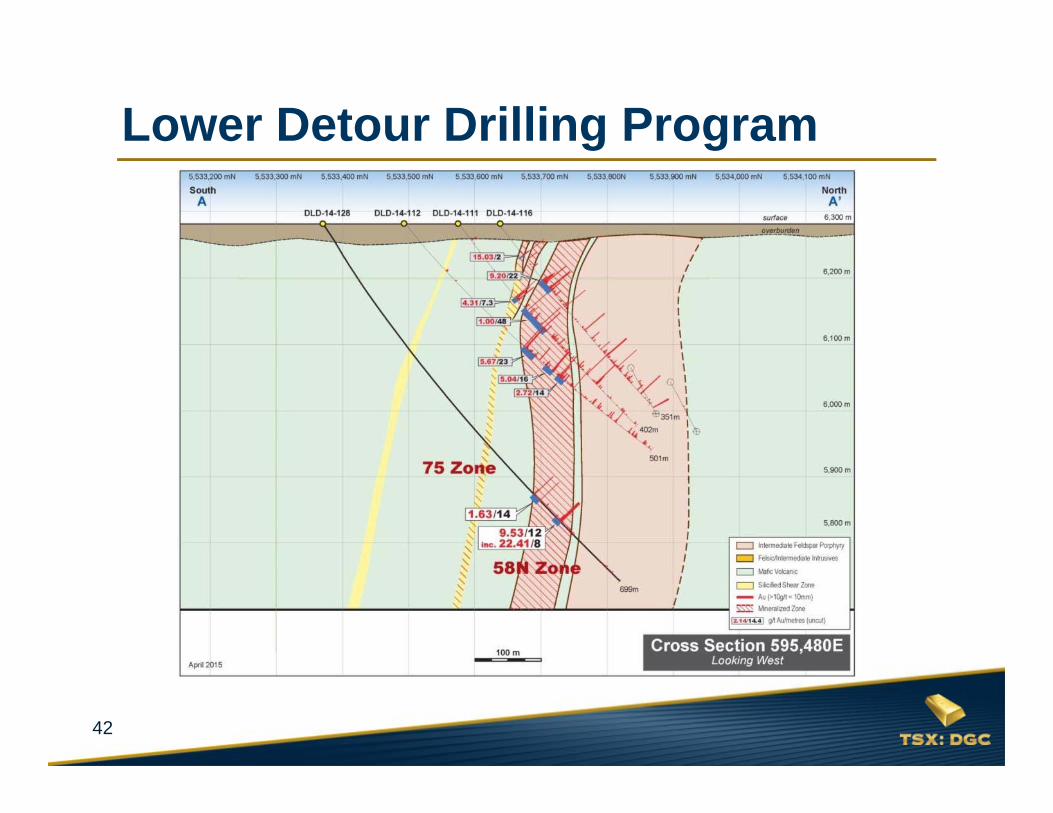
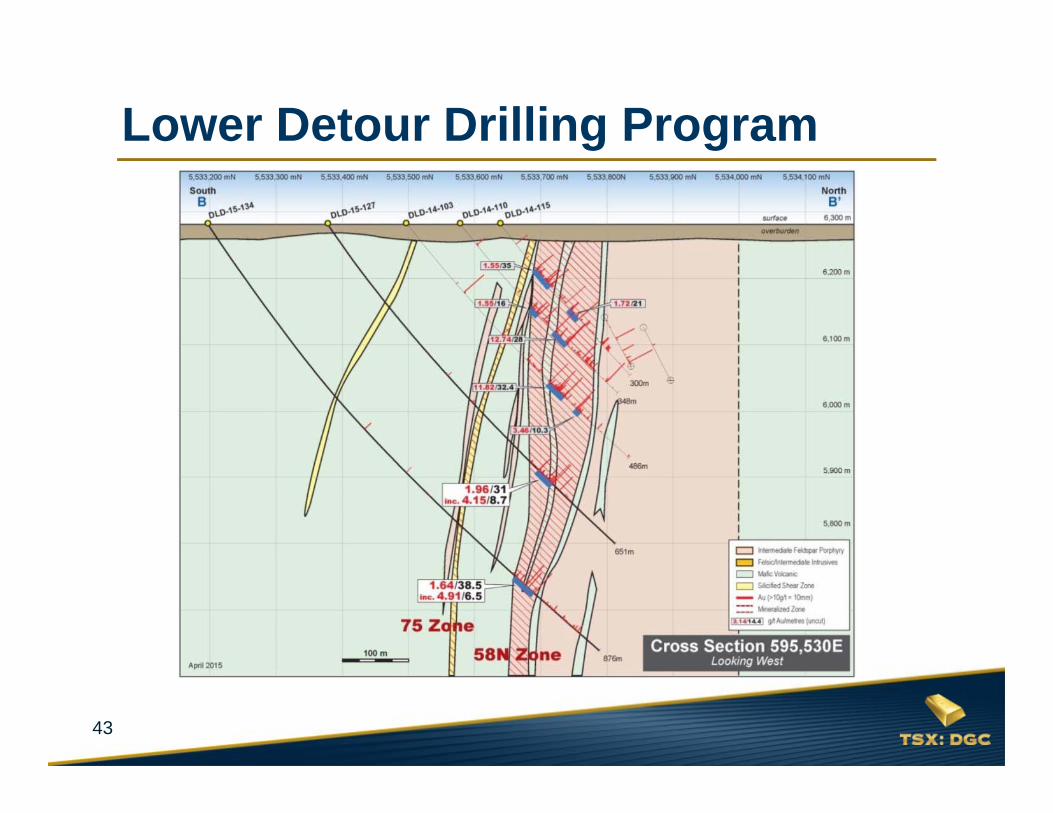
Exploration Focus: Lower Detour Q1 Drilling Program5,700 m completed at Lower Detour: extended high-grade mineralization of Zone 58N
Q2-Q3 Drilling Program30,000 m additional drilling: 50-metre infill totaling 50 holes to assess UG potential(budget of US$5 M)
Regional PotentialTarget identification following airborne magnetics and IP ground surveys
40
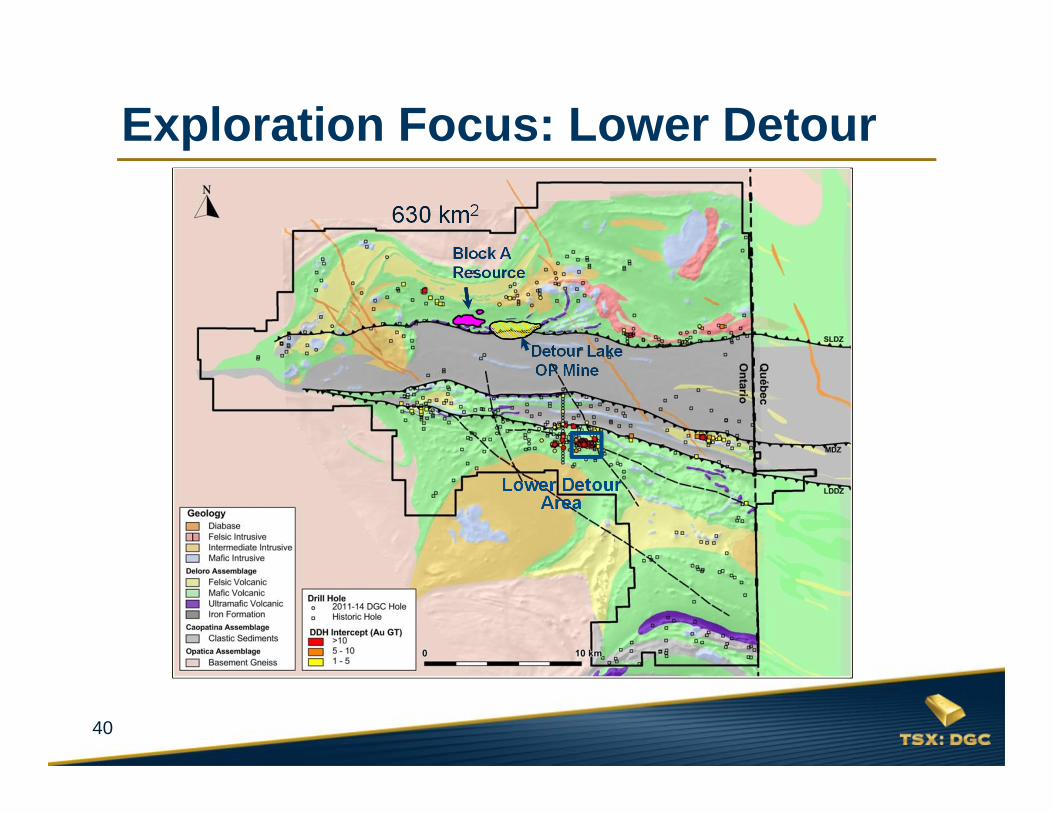
Lower Detour Area
630 km2
Exploration Focus: Lower Detour
Block A Resource
Detour LakeOP Mine
41
Lower Detour Drilling Program
42
Lower Detour Drilling Program
43
Lower Detour Drilling Program
44
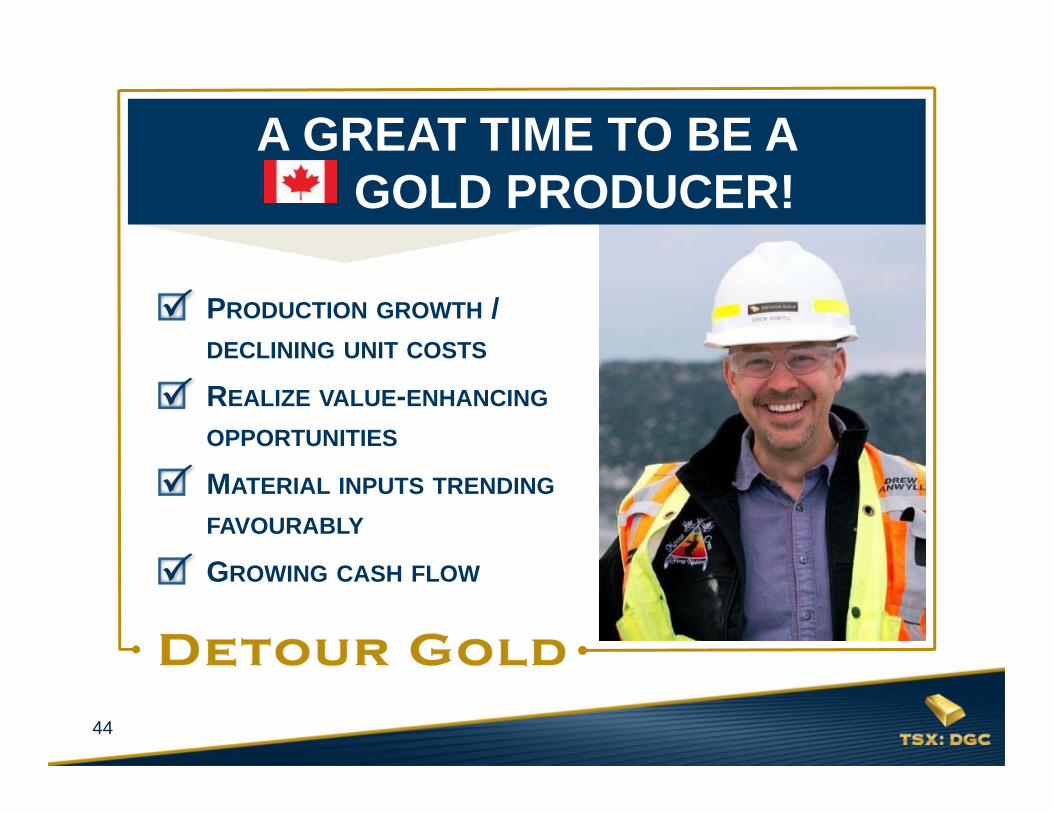
PRODUCTION GROWTH / DECLINING UNIT COSTS
REALIZE VALUE-ENHANCINGOPPORTUNITIES
MATERIAL INPUTS TRENDINGFAVOURABLY
GROWING CASH FLOW
A GREAT TIME TO BE A GOLD PRODUCER!
45
ADDITIONALinformation Operations Team Block Model Reconciliation Detour Gold Reserves &
Resources Detour Lake & Block A Q1 2015 Operational Statistics Q1 2015 Financial Results Contact Information
46
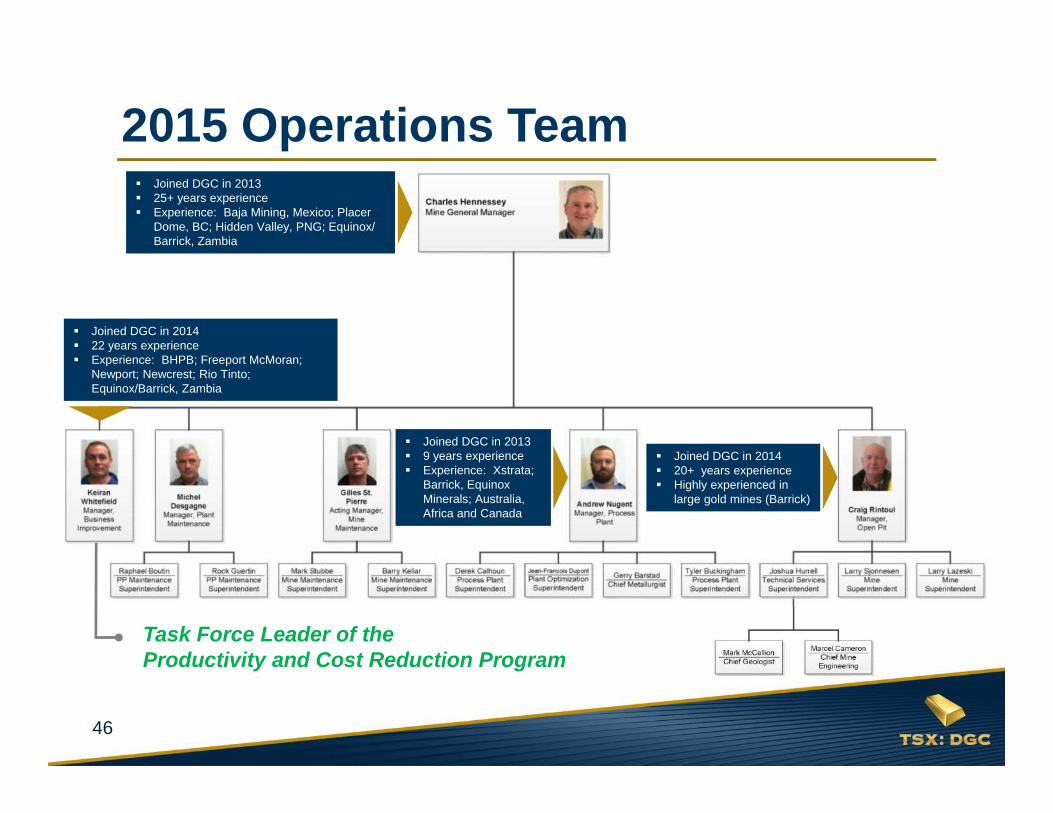
2015 Operations Team Joined DGC in 2013 25+ years experience Experience: Baja Mining, Mexico; Placer
Dome, BC; Hidden Valley, PNG; Equinox/ Barrick, Zambia
Joined DGC in 2013 9 years experience Experience: Xstrata;
Barrick, Equinox Minerals; Australia, Africa and Canada
Joined DGC in 2014 20+ years experience Highly experienced in
large gold mines (Barrick)
Joined DGC in 2014 22 years experience Experience: BHPB; Freeport McMoran;
Newport; Newcrest; Rio Tinto; Equinox/Barrick, Zambia
Task Force Leader of theProductivity and Cost Reduction Program
47
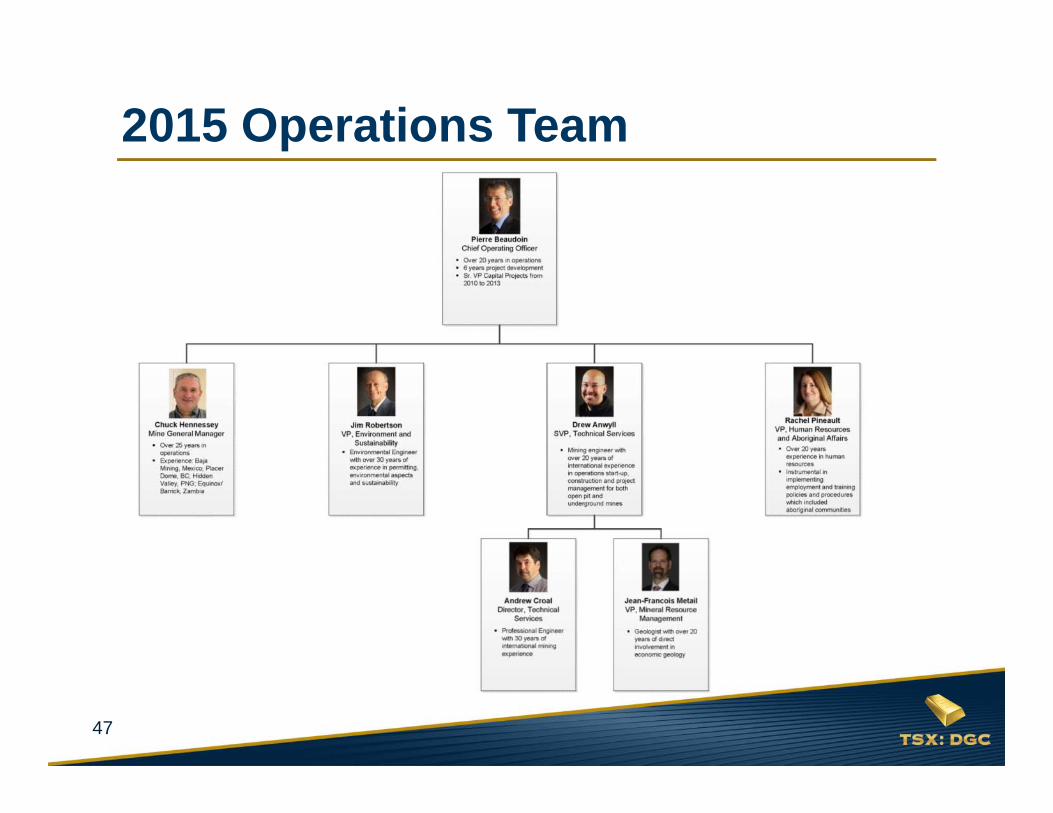
2015 Operations Team
48
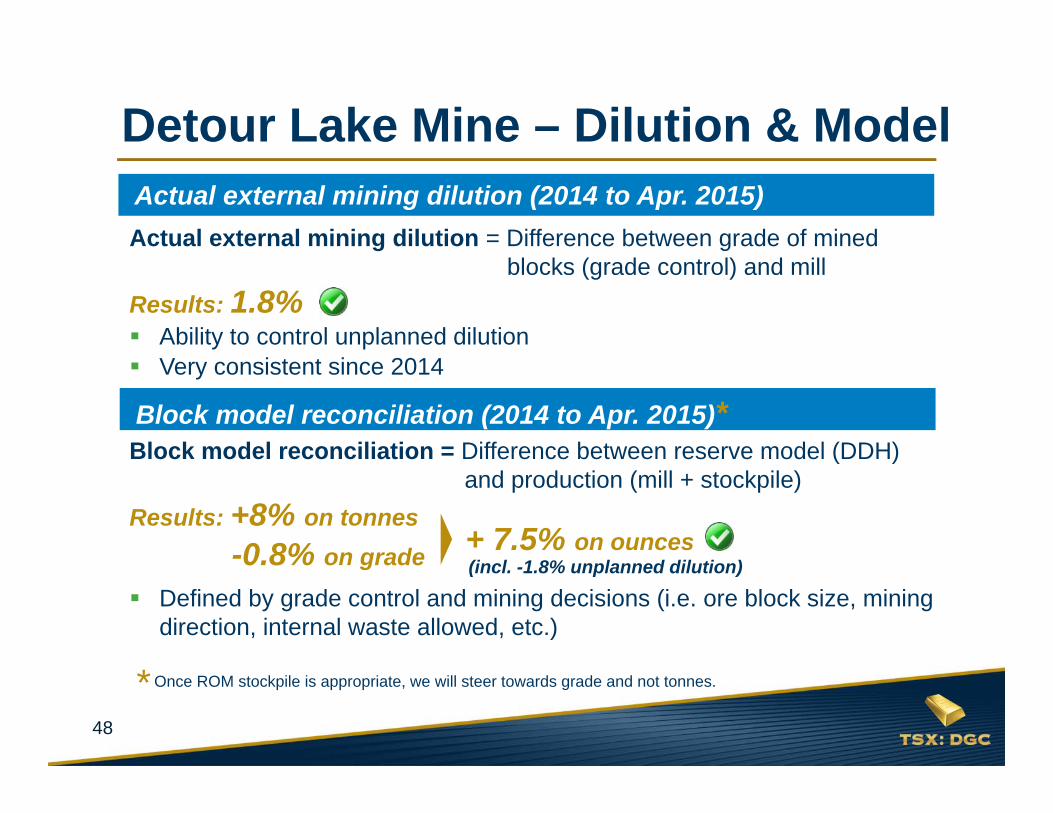
Detour Lake Mine – Dilution & Model
Actual external mining dilution = Difference between grade of mined blocks (grade control) and mill
Results: 1.8% Ability to control unplanned dilution Very consistent since 2014
Actual external mining dilution (2014 to Apr. 2015)
Block model reconciliation (2014 to Apr. 2015)*Block model reconciliation = Difference between reserve model (DDH)
and production (mill + stockpile)Results: +8% on tonnes
-0.8% on grade Defined by grade control and mining decisions (i.e. ore block size, mining
direction, internal waste allowed, etc.)
+ 7.5% on ounces(incl. -1.8% unplanned dilution)
*Once ROM stockpile is appropriate, we will steer towards grade and not tonnes.
49
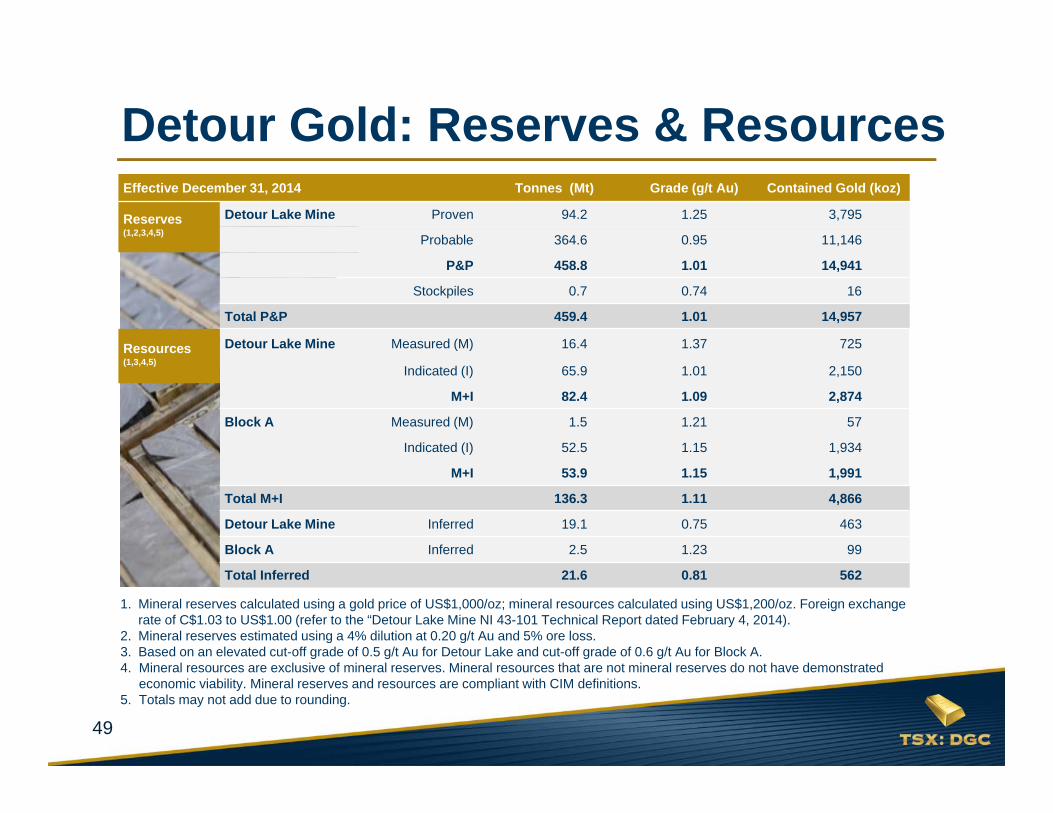
Effective December 31, 2014 Tonnes (Mt) Grade (g/t Au) Contained Gold (koz)
Reserves(1,2,3,4,5)
Detour Lake Mine Proven 94.2 1.25 3,795
Probable 364.6 0.95 11,146
P&P 458.8 1.01 14,941
Stockpiles 0.7 0.74 16
Total P&P 459.4 1.01 14,957
Resources (1,3,4,5)
Detour Lake Mine Measured (M) 16.4 1.37 725
Indicated (I) 65.9 1.01 2,150
M+I 82.4 1.09 2,874
Block A Measured (M) 1.5 1.21 57
Indicated (I) 52.5 1.15 1,934
M+I 53.9 1.15 1,991
Total M+I 136.3 1.11 4,866
Detour Lake Mine Inferred 19.1 0.75 463
Block A Inferred 2.5 1.23 99
Total Inferred 21.6 0.81 562
Detour Gold: Reserves & Resources
1. Mineral reserves calculated using a gold price of US$1,000/oz; mineral resources calculated using US$1,200/oz. Foreign exchange rate of C$1.03 to US$1.00 (refer to the “Detour Lake Mine NI 43-101 Technical Report dated February 4, 2014).
2. Mineral reserves estimated using a 4% dilution at 0.20 g/t Au and 5% ore loss.3. Based on an elevated cut-off grade of 0.5 g/t Au for Detour Lake and cut-off grade of 0.6 g/t Au for Block A.4. Mineral resources are exclusive of mineral reserves. Mineral resources that are not mineral reserves do not have demonstrated
economic viability. Mineral reserves and resources are compliant with CIM definitions.5. Totals may not add due to rounding.
50
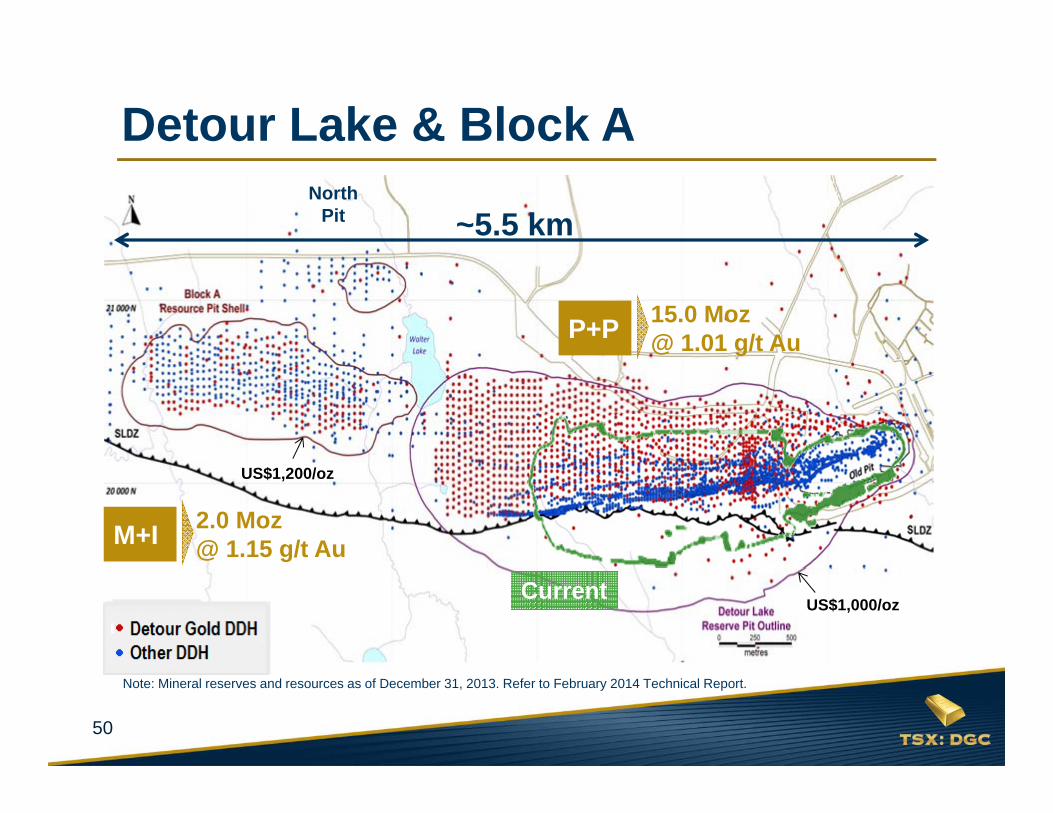
Detour Lake & Block A
US$1,000/oz
US$1,200/oz
15.0 Moz@ 1.01 g/t AuP+P
2.0 Moz@ 1.15 g/t AuM+I
~5.5 km
Current
North Pit
Note: Mineral reserves and resources as of December 31, 2013. Refer to February 2014 Technical Report.
51
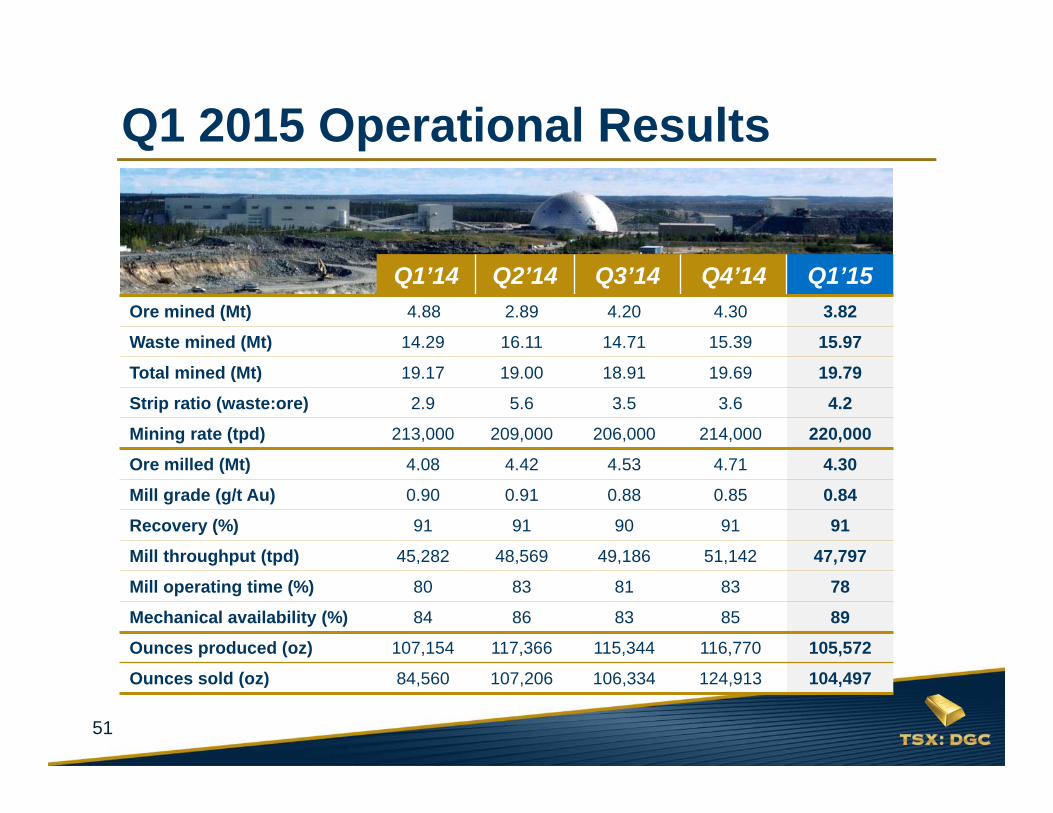
Q1 2015 Operational Results
Q1’14 Q2’14 Q3’14 Q4’14 Q1’15Ore mined (Mt) 4.88 2.89 4.20 4.30 3.82
Waste mined (Mt) 14.29 16.11 14.71 15.39 15.97
Total mined (Mt) 19.17 19.00 18.91 19.69 19.79
Strip ratio (waste:ore) 2.9 5.6 3.5 3.6 4.2
Mining rate (tpd) 213,000 209,000 206,000 214,000 220,000
Ore milled (Mt) 4.08 4.42 4.53 4.71 4.30
Mill grade (g/t Au) 0.90 0.91 0.88 0.85 0.84
Recovery (%) 91 91 90 91 91
Mill throughput (tpd) 45,282 48,569 49,186 51,142 47,797
Mill operating time (%) 80 83 81 83 78
Mechanical availability (%) 84 86 83 85 89
Ounces produced (oz) 107,154 117,366 115,344 116,770 105,572
Ounces sold (oz) 84,560 107,206 106,334 124,913 104,497
52
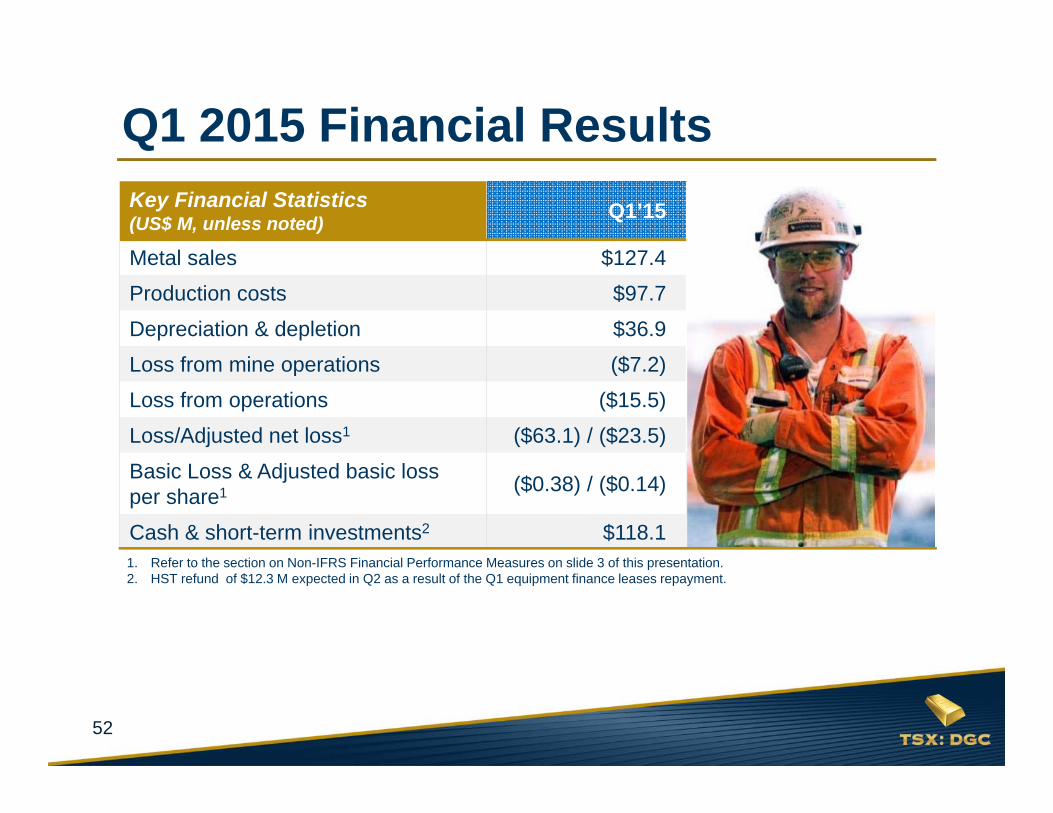
Q1 2015 Financial ResultsKey Financial Statistics (US$ M, unless noted) Q1’15
Metal sales $127.4
Production costs $97.7
Depreciation & depletion $36.9
Loss from mine operations ($7.2)
Loss from operations ($15.5)
Loss/Adjusted net loss1 ($63.1) / ($23.5)
Basic Loss & Adjusted basic loss per share1 ($0.38) / ($0.14)
Cash & short-term investments2 $118.11. Refer to the section on Non-IFRS Financial Performance Measures on slide 3 of this presentation.2. HST refund of $12.3 M expected in Q2 as a result of the Q1 equipment finance leases repayment.
53
Laurie GaboritDirector Investor RelationsEmail: [email protected]: 416.304.0581
Paul MartinPresident and Chief Executive OfficerEmail: [email protected]: 416.304.0800
www.detourgold.com
Contact Information
Pierre BeaudoinChief Operating OfficerEmail: [email protected]: 416.304.0800