Embed Size (px)
Citation preview
DeviceAnywhere Enterprise Monitoring
Best Practice Workflow Release 6.0
DAE Monitoring Workflow
ii Keynote Confidential
DeviceAnywhere Enterprise Monitoring 6.0
June 2013
Copyright Notice Copyright © 1995-2013 Keynote Systems, Inc. All rights reserved
THE INFORMATION CONTAINED IN THIS DOCUMENT IS PROVIDED “AS IS” WITHOUT ANY EXPRESS REPRESENTATIONS OF WARRANTIES. IN ADDITION, KEYNOTE DISCLAIMS ALL IMPLIED REPRESENTATIONS AND WARRANTIES, INCLUDING ANY WARRANTY OF MERCHANTABILITY, FITNESS FOR A PARTICULAR PURPOSE, OR NON-INFRINGEMENT OF THIRD PARTY INTELLECTURAL PROPERTY RIGHTS.
All text and figures included in this publication are the exclusive property of Keynote and may not be copied, reproduced, or used in any way without the express permission in writing of Keynote. Information in this document is subject to change without notice and does not represent a commitment on the part of Keynote. Keynote may have patents or pending patent applications covering subject matter in this document. The furnishing of this document does not give you any license to these patents except as expressly provided in any written license agreement from Keynote.
The trademarks or registered trademarks of Keynote Systems, Inc. in the United States and other countries include Keynote®, DataPulse®, CustomerScope®, Keynote Customer Experience Rankings®, Perspective®, Keynote Red Alert®, Keynote WebEffective®, The Internet Performance Authority®, MyKeynote®, SIGOS®, SITE®, keynote® The Mobile & Internet Performance Authority™, Keynote FlexUse®, Keynote DeviceAnywhere®, DeviceAnywhere®, Keynote DemoAnywhere®, Keynote MonitorAnywhere®. All related trademarks, trade names, logos, characters, design and trade dress are trademarks or registered trademarks of Keynote Systems, Inc. in the United States and other countries and may not be used without written permission. All other trademarks are the property of their respective owners.
Please forward any comments or suggestions regarding this document to Keynote Support.
Keynote Systems, Inc. 777 Mariners Island Blvd. San Mateo, CA 94404
Workflow DAE Monitoring
Keynote Confidential iii
Contents About This Document ...................................................................................................... 5
Document Outline ........................................................................................................................................ 5 Typographical Conventions ........................................................................................................................ 5 Contacting Support ...................................................................................................................................... 6 Additional Documentation ......................................................................................................................... 6
1 Prerequisites and Product Overview.................................................................. 7 1.1 Prerequisites .................................................................................................................................... 7
1.1.1 System Requirements for DeviceAnywhere Studio .................................................... 7 1.2 Features ........................................................................................................................................... 8 1.3 Benefits ............................................................................................................................................ 8 1.4 Product Components ..................................................................................................................... 9
1.4.1 DeviceAnywhere Studio Modules................................................................................. 9 1.4.2 DeviceAnywhere Enterprise Monitoring Portal ........................................................ 13 1.4.3 Java API ........................................................................................................................... 14
2 Concepts and Basic Workflow ........................................................................... 15 2.1 DAE Monitoring Concepts ......................................................................................................... 15
2.1.1 Scripting and Scheduling Concepts ............................................................................ 15 2.1.2 Execution and Reporting Concepts ............................................................................. 19
2.2 Best Practice Scripting Workflow............................................................................................... 23
3 Scripting Workflow: Round One ....................................................................... 26 3.1 Step: Identify Key Interactions to Track .................................................................................... 26 3.2 Step: Conceptualize the End-to-End Monitor Scenario .......................................................... 26 3.3 Step: Identify Monitor Building Blocks ..................................................................................... 27 3.4 Step: Create a Project ................................................................................................................... 27 3.5 Step: Begin Scripting – Create Actions ...................................................................................... 29
3.5.1 Creating an Action and Implementation .................................................................... 30 3.5.2 What an Action Should Contain .................................................................................. 31
3.6 Step: Reference Points.................................................................................................................. 31 3.6.1 Description ...................................................................................................................... 31 3.6.2 General Guidelines on Using Reference Points ......................................................... 33 3.6.3 Reference Points in Transactions ................................................................................. 33
3.7 Step: Proofs to Be Collected ........................................................................................................ 34 3.7.1 Capturing Proofs ............................................................................................................ 34 3.7.2 Viewing Proofs ............................................................................................................... 36
3.8 Step: Test Case .............................................................................................................................. 38 3.8.1 Creating a Test Case ...................................................................................................... 38
3.9 Step: Transactions ........................................................................................................................ 39
DAE Monitoring Workflow
iv Keynote Confidential
3.9.1 Reasons for Using Transactions ................................................................................... 39 3.9.2 What Transactions Consist Of ...................................................................................... 40 3.9.3 Creating Transactions.................................................................................................... 40 3.9.4 Guidelines for Transactions .......................................................................................... 45
3.10 Step: Error Definitions in Project Properties ............................................................................ 47 3.10.1 Description ...................................................................................................................... 47 3.10.2 Guidelines for Error Definitions .................................................................................. 49
3.11 Step: Variables .............................................................................................................................. 50 3.12 Step: Validate and Debug Scripts ............................................................................................... 51
3.12.1 Validation ........................................................................................................................ 51 3.12.2 Debug Runs .................................................................................................................... 52
3.13 Step: Monitor Schedule ............................................................................................................... 53 3.13.1 Creating a Monitor Schedule ........................................................................................ 53 3.13.2 Monitor Guidelines ........................................................................................................ 57
3.14 Step: Monitor Policy .................................................................................................................... 58 3.14.1 Creating a Monitor Policy ............................................................................................. 58 3.14.2 Monitor Policy Guidelines ............................................................................................ 61
3.15 Step: Deploy Monitor .................................................................................................................. 61 3.16 Step: View Dashboard ................................................................................................................. 61
4 Scripting Workflow: Round Two ...................................................................... 62 4.1 Step: Review Initial Results in Portal ........................................................................................ 62
4.1.1 Detailed Results for Failed Runs and Proofs .............................................................. 62 4.1.2 Monitor Details .............................................................................................................. 63 4.1.3 Performance Charts ....................................................................................................... 64
4.2 Step: Rework Scripts .................................................................................................................... 65 4.3 Step: Adjust Error Types ............................................................................................................. 66 4.4 Step: Adjust Transaction Settings .............................................................................................. 66 4.5 Step: Alerts .................................................................................................................................... 67
4.5.1 Creating an Alert ............................................................................................................ 67 4.5.2 Guidelines for Alerts ..................................................................................................... 69
4.6 Step: Build Out Monitor Policies ................................................................................................ 70 4.7 Step: Transaction Policies ............................................................................................................ 70
4.7.1 Creating Transaction Policies ....................................................................................... 70 4.7.2 Transaction Policy Guidelines...................................................................................... 72
4.8 Step: Deploy Monitor in Production Mode .............................................................................. 73 4.9 Step: Track Results ....................................................................................................................... 73
Workflow DAE Monitoring
Keynote Confidential 5
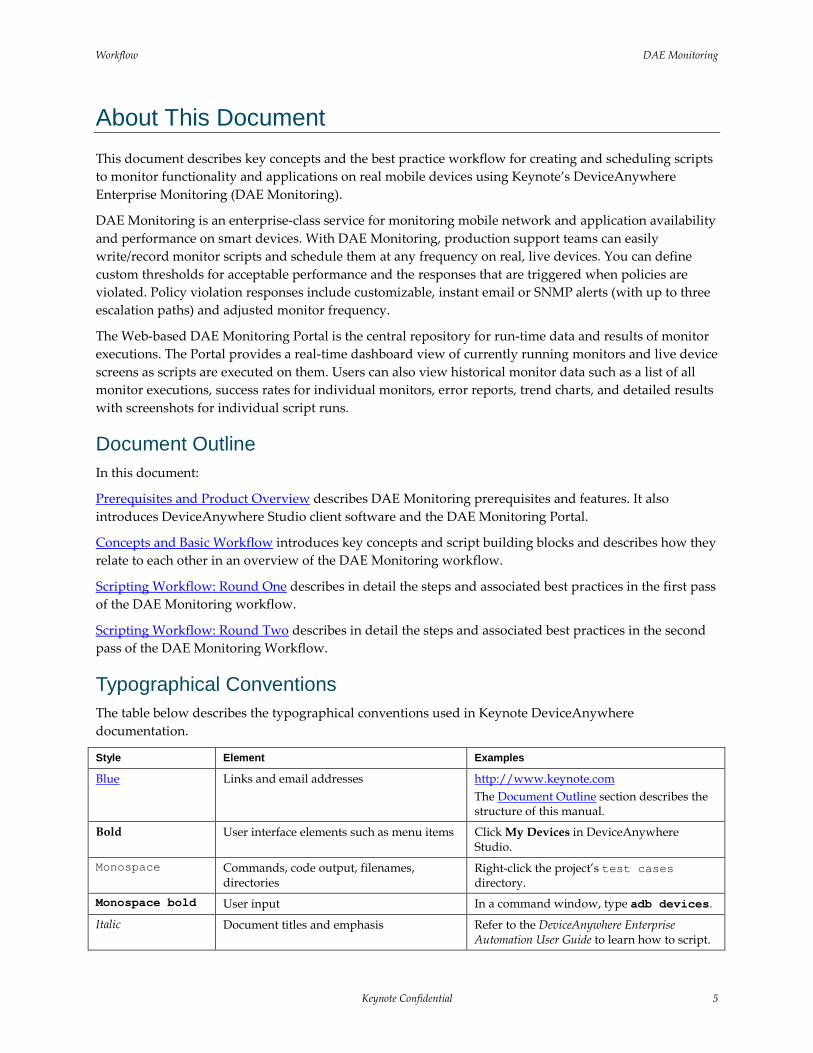
About This Document This document describes key concepts and the best practice workflow for creating and scheduling scripts to monitor functionality and applications on real mobile devices using Keynote’s DeviceAnywhere Enterprise Monitoring (DAE Monitoring).
DAE Monitoring is an enterprise-class service for monitoring mobile network and application availability and performance on smart devices. With DAE Monitoring, production support teams can easily write/record monitor scripts and schedule them at any frequency on real, live devices. You can define custom thresholds for acceptable performance and the responses that are triggered when policies are violated. Policy violation responses include customizable, instant email or SNMP alerts (with up to three escalation paths) and adjusted monitor frequency.
The Web-based DAE Monitoring Portal is the central repository for run-time data and results of monitor executions. The Portal provides a real-time dashboard view of currently running monitors and live device screens as scripts are executed on them. Users can also view historical monitor data such as a list of all monitor executions, success rates for individual monitors, error reports, trend charts, and detailed results with screenshots for individual script runs.
Document Outline In this document:
Prerequisites and Product Overview describes DAE Monitoring prerequisites and features. It also introduces DeviceAnywhere Studio client software and the DAE Monitoring Portal.
Concepts and Basic Workflow introduces key concepts and script building blocks and describes how they relate to each other in an overview of the DAE Monitoring workflow.
Scripting Workflow: Round One describes in detail the steps and associated best practices in the first pass of the DAE Monitoring workflow.
Scripting Workflow: Round Two describes in detail the steps and associated best practices in the second pass of the DAE Monitoring Workflow.
Typographical Conventions The table below describes the typographical conventions used in Keynote DeviceAnywhere documentation.
Style Element Examples
Blue Links and email addresses
http://www.keynote.com The Document Outline section describes the structure of this manual.
Bold User interface elements such as menu items Click My Devices in DeviceAnywhere Studio.
Monospace Commands, code output, filenames, directories
Right-click the project’s test cases directory.
Monospace bold User input In a command window, type adb devices.
Italic Document titles and emphasis Refer to the DeviceAnywhere Enterprise Automation User Guide to learn how to script.
DAE Monitoring Workflow
6 Keynote Confidential
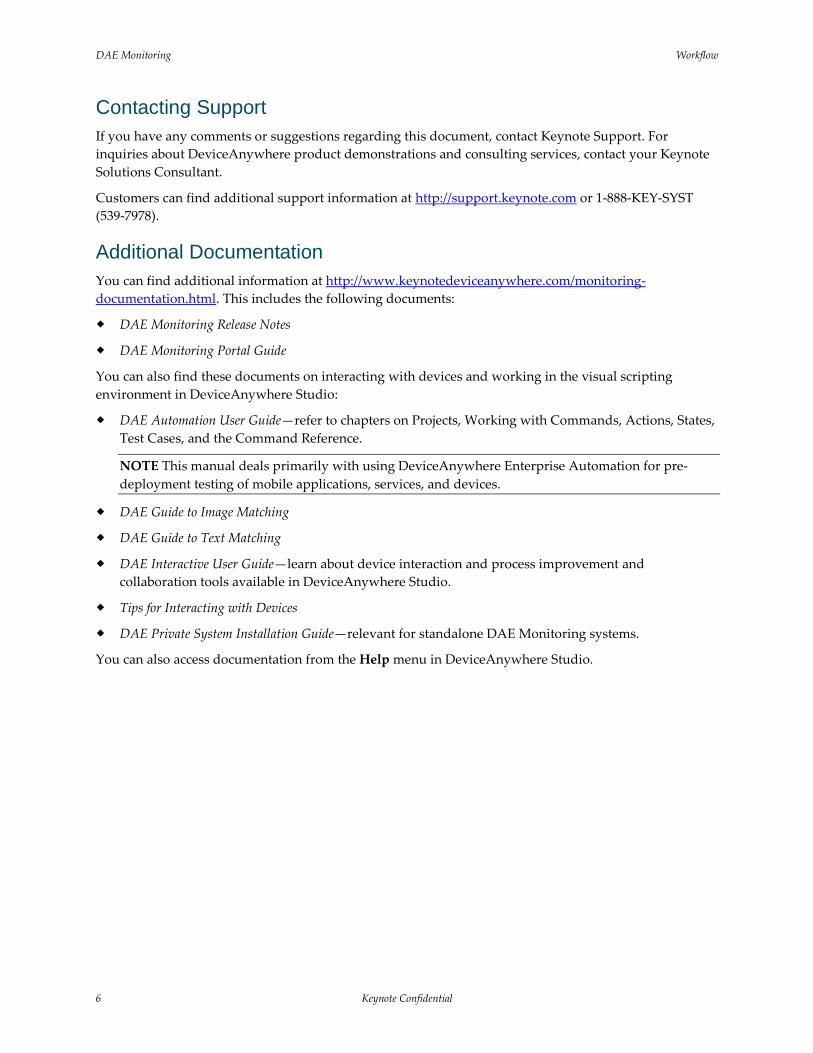
Contacting Support If you have any comments or suggestions regarding this document, contact Keynote Support. For inquiries about DeviceAnywhere product demonstrations and consulting services, contact your Keynote Solutions Consultant.
Customers can find additional support information at http://support.keynote.com or 1-888-KEY-SYST (539-7978).
Additional Documentation You can find additional information at http://www.keynotedeviceanywhere.com/monitoring-documentation.html. This includes the following documents:
DAE Monitoring Release Notes
DAE Monitoring Portal Guide
You can also find these documents on interacting with devices and working in the visual scripting environment in DeviceAnywhere Studio:
DAE Automation User Guide—refer to chapters on Projects, Working with Commands, Actions, States, Test Cases, and the Command Reference.
NOTE This manual deals primarily with using DeviceAnywhere Enterprise Automation for pre-deployment testing of mobile applications, services, and devices.
DAE Guide to Image Matching
DAE Guide to Text Matching
DAE Interactive User Guide—learn about device interaction and process improvement and collaboration tools available in DeviceAnywhere Studio.
Tips for Interacting with Devices
DAE Private System Installation Guide—relevant for standalone DAE Monitoring systems.
You can also access documentation from the Help menu in DeviceAnywhere Studio.
Workflow DAE Monitoring
Keynote Confidential 7
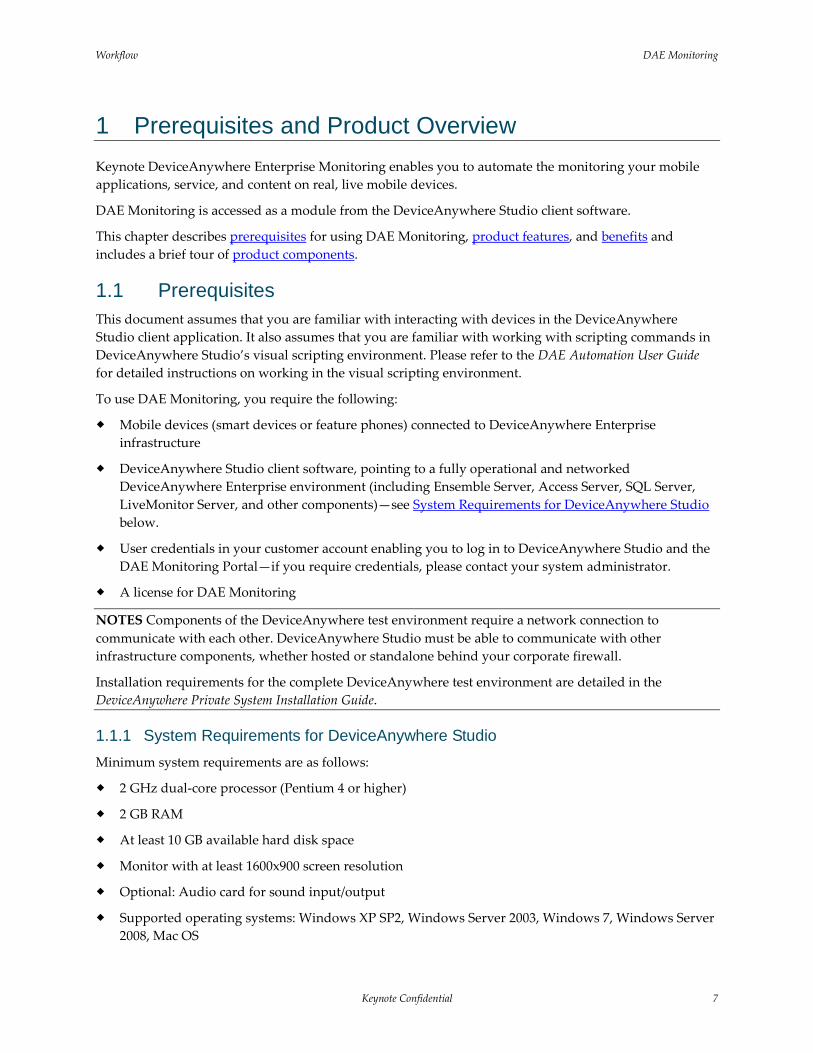
1 Prerequisites and Product Overview Keynote DeviceAnywhere Enterprise Monitoring enables you to automate the monitoring your mobile applications, service, and content on real, live mobile devices.
DAE Monitoring is accessed as a module from the DeviceAnywhere Studio client software.
This chapter describes prerequisites for using DAE Monitoring, product features, and benefits and includes a brief tour of product components.
1.1 Prerequisites This document assumes that you are familiar with interacting with devices in the DeviceAnywhere Studio client application. It also assumes that you are familiar with working with scripting commands in DeviceAnywhere Studio’s visual scripting environment. Please refer to the DAE Automation User Guide for detailed instructions on working in the visual scripting environment.
To use DAE Monitoring, you require the following:
Mobile devices (smart devices or feature phones) connected to DeviceAnywhere Enterprise infrastructure
DeviceAnywhere Studio client software, pointing to a fully operational and networked DeviceAnywhere Enterprise environment (including Ensemble Server, Access Server, SQL Server, LiveMonitor Server, and other components)—see System Requirements for DeviceAnywhere Studio below.
User credentials in your customer account enabling you to log in to DeviceAnywhere Studio and the DAE Monitoring Portal—if you require credentials, please contact your system administrator.
A license for DAE Monitoring
NOTES Components of the DeviceAnywhere test environment require a network connection to communicate with each other. DeviceAnywhere Studio must be able to communicate with other infrastructure components, whether hosted or standalone behind your corporate firewall.
Installation requirements for the complete DeviceAnywhere test environment are detailed in the DeviceAnywhere Private System Installation Guide.
1.1.1 System Requirements for DeviceAnywhere Studio Minimum system requirements are as follows:
2 GHz dual-core processor (Pentium 4 or higher)
2 GB RAM
At least 10 GB available hard disk space
Monitor with at least 1600x900 screen resolution
Optional: Audio card for sound input/output
Supported operating systems: Windows XP SP2, Windows Server 2003, Windows 7, Windows Server 2008, Mac OS
DAE Monitoring Workflow
8 Keynote Confidential
NOTE Both 32- and 64-bit processing are supported on Windows.
JDK v1.5+ must be installed for Mac OS.
1.2 Features With DAE Monitoring, you can:
Automate the monitoring of any functionality or application across all platforms and device models.
Work with real smart devices or feature phones for real-time interaction and display of device and application behavior on live networks.
Access devices from any location.
Measure performance of overall monitor scripts as well as of key transactions within the script.
Define custom thresholds for acceptable performance for monitors and transactions—failure responses include sending out alerts and adjusting monitor frequency.
Avail of a visual scripting interface with drag and drop commands or program in Java in DeviceAnywhere Studio or an IDE of your choice.
Run monitors 24x7 at any frequency for continuous monitoring of performance and availability.
Schedule monitors to run only on specific days of the week or hours of the day.
Execute tests ad hoc from DeviceAnywhere Studio for immediate validation.
Receive customized alerts (with up to three levels of escalation) of performance violations and incident resolution.
Set up maintenance windows during which monitors are executed but there are no escalations and alerts are therefore suppressed.
View real-time monitor status and live device screens during execution on Web-based dashboard.
View a list of all monitor executions, success rates, error reports, post-run trend charts, and detailed results for individual script runs complete with device screenshots in Web Portal.
Define reference points for script verification based on pixel-to-pixel image matching, text recognition, or web elements.
Use parameters and variables to implement complex script logic (data variations, loops, branches).
Define multiple-device tests (e.g., messaging, chat).
1.3 Benefits DAE Monitoring combines the convenience of 24x7 automated monitoring with the accuracy of real, live devices (as opposed to emulators and simulators) and enables you to:
Measure from the point of view of a real user, using real devices on live networks.
Generate accurate, repeatable, and reportable results from automated monitor scripts.
Make devices available for in-network testing to local as well as remote employees.
Accurately define expected results (in terms of device screen images, text, or audio from devices) when building test scripts.
Workflow DAE Monitoring
Keynote Confidential 9
Define scripts in terms of modular components that can be reused across devices and platforms.
Generate meaningful comparative data by reusing transaction settings to measure the same interactions across different monitors, e.g., opening a Web page on different browsers or on different devices.
Reuse alerts across different monitor or transaction polices, e.g., use the same alert for a level 2 violation of different transaction policies.
View and manage your monitoring results in a central location, accessible over a network connection.
Use test results and charting tools in the portal to determine crucial data such as times of day when a service is not available, how long it takes for content to be downloaded, and whether content appears exactly as it should.
Use portal data to aid immediate incident tracking as well as mid- to long-term trend analysis.
1.4 Product Components This section describes the components of DAE Monitoring.
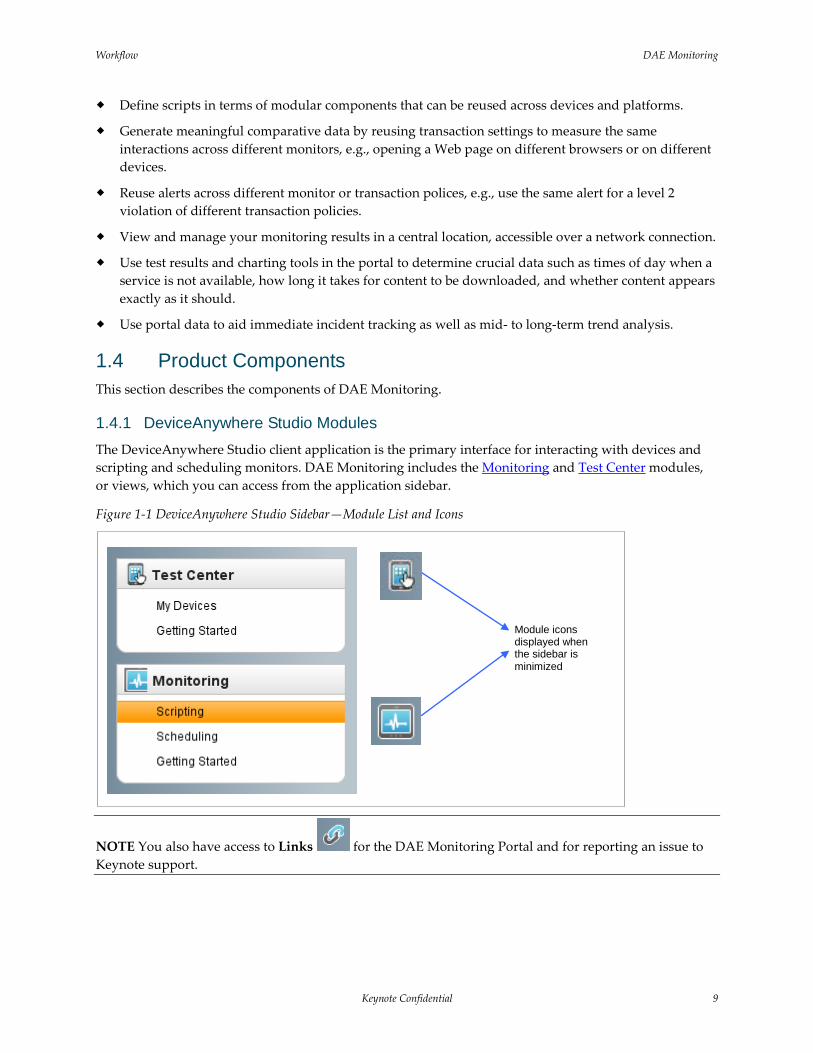
1.4.1 DeviceAnywhere Studio Modules The DeviceAnywhere Studio client application is the primary interface for interacting with devices and scripting and scheduling monitors. DAE Monitoring includes the Monitoring and Test Center modules, or views, which you can access from the application sidebar.
Figure 1-1 DeviceAnywhere Studio Sidebar—Module List and Icons
NOTE You also have access to Links for the DAE Monitoring Portal and for reporting an issue to Keynote support.
Module icons displayed when the sidebar is minimized
DAE Monitoring Workflow
10 Keynote Confidential
1.4.1.1 Monitoring
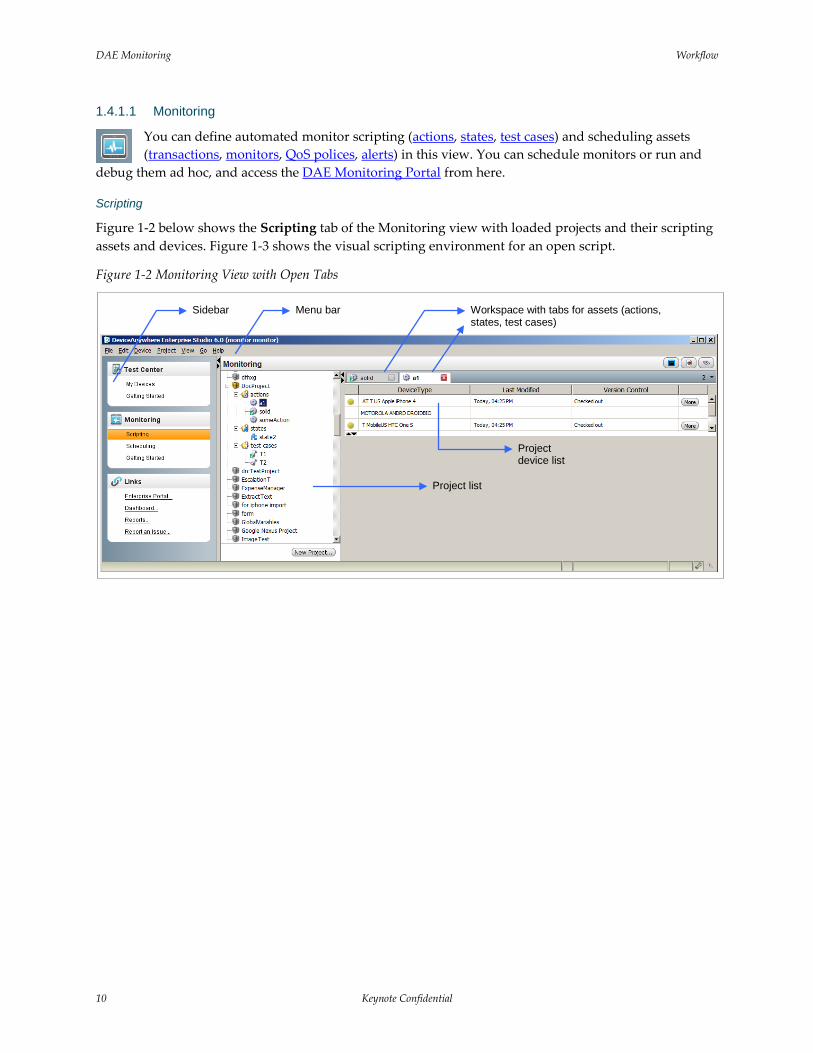
You can define automated monitor scripting (actions, states, test cases) and scheduling assets (transactions, monitors, QoS polices, alerts) in this view. You can schedule monitors or run and
debug them ad hoc, and access the DAE Monitoring Portal from here.
Scripting
Figure 1-2 below shows the Scripting tab of the Monitoring view with loaded projects and their scripting assets and devices. Figure 1-3 shows the visual scripting environment for an open script.
Figure 1-2 Monitoring View with Open Tabs
Project device list
Workspace with tabs for assets (actions, states, test cases)
Project list
Menu bar Sidebar
Workflow DAE Monitoring
Keynote Confidential 11
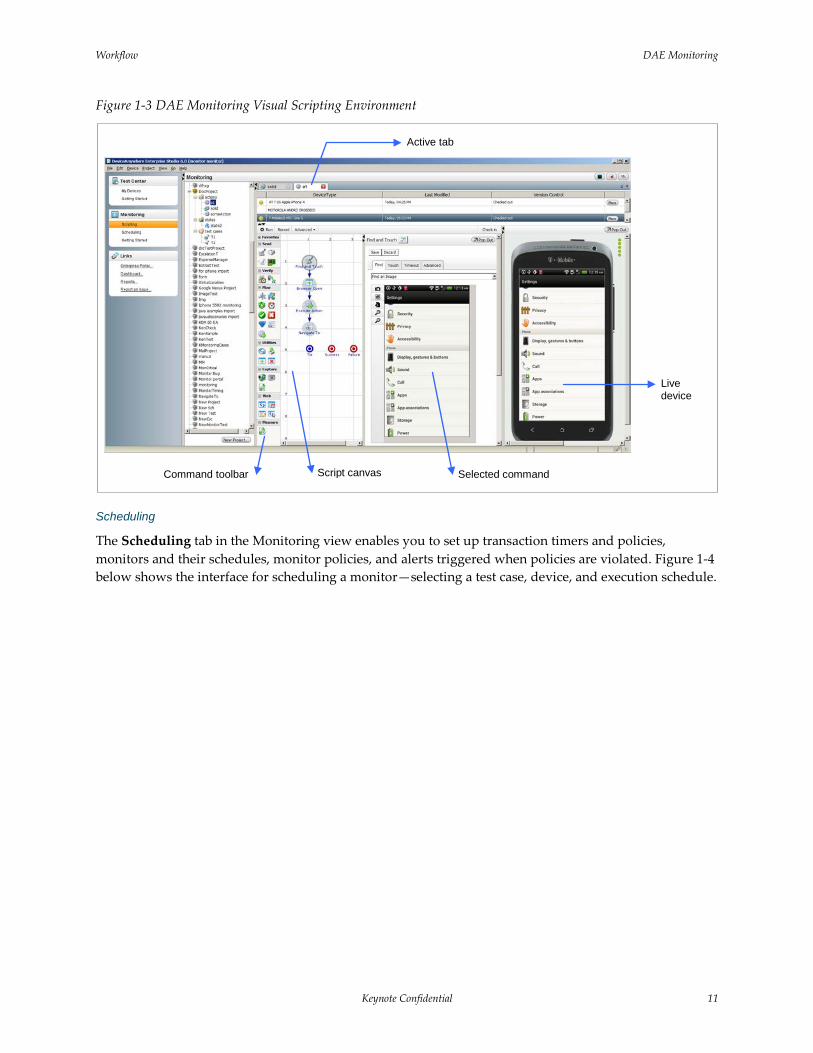
Figure 1-3 DAE Monitoring Visual Scripting Environment
Scheduling
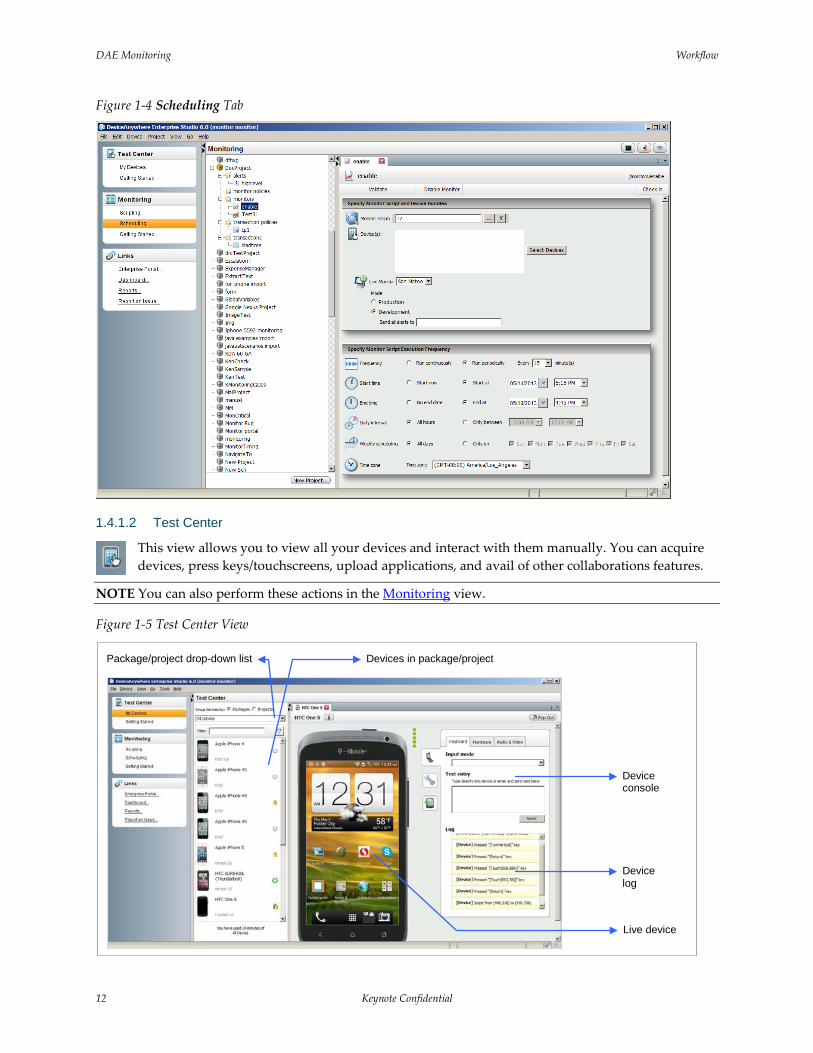
The Scheduling tab in the Monitoring view enables you to set up transaction timers and policies, monitors and their schedules, monitor policies, and alerts triggered when policies are violated. Figure 1-4 below shows the interface for scheduling a monitor—selecting a test case, device, and execution schedule.
Live device
Command toolbar
Active tab
Script canvas Selected command
DAE Monitoring Workflow
12 Keynote Confidential
Figure 1-4 Scheduling Tab
1.4.1.2 Test Center
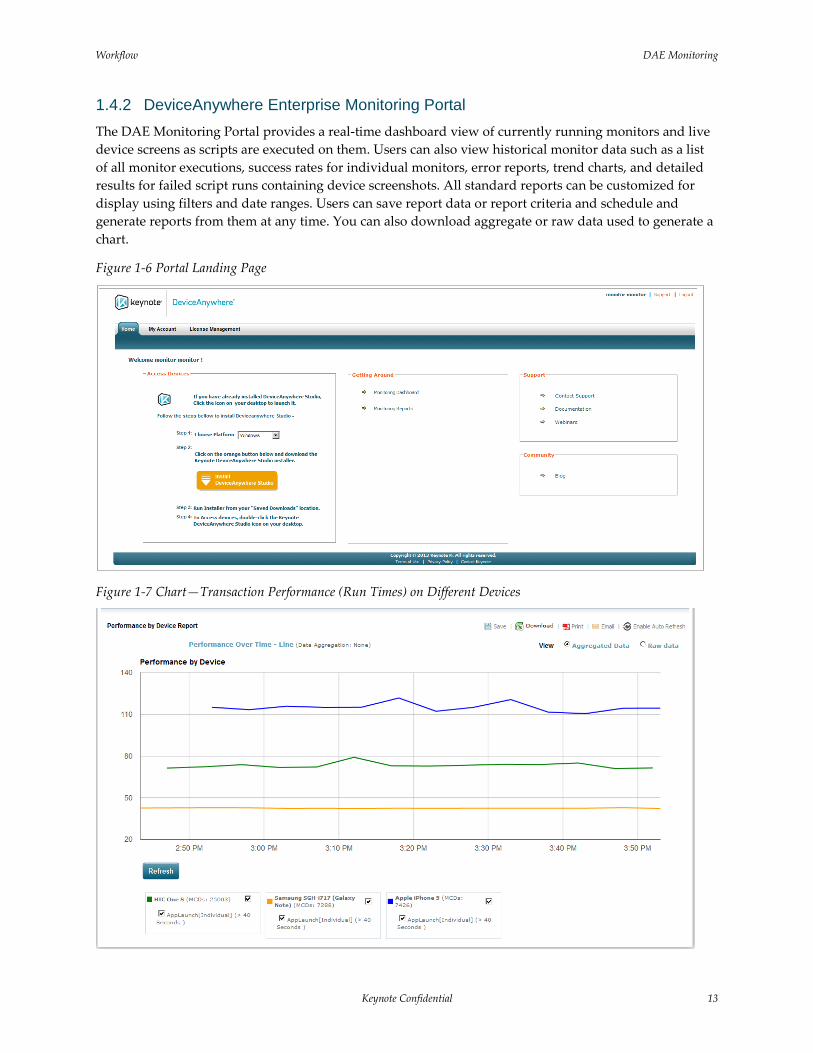
This view allows you to view all your devices and interact with them manually. You can acquire devices, press keys/touchscreens, upload applications, and avail of other collaborations features.
NOTE You can also perform these actions in the Monitoring view.
Figure 1-5 Test Center View
Device console
Live device
Package/project drop-down list Devices in package/project
Device log
Workflow DAE Monitoring
Keynote Confidential 13
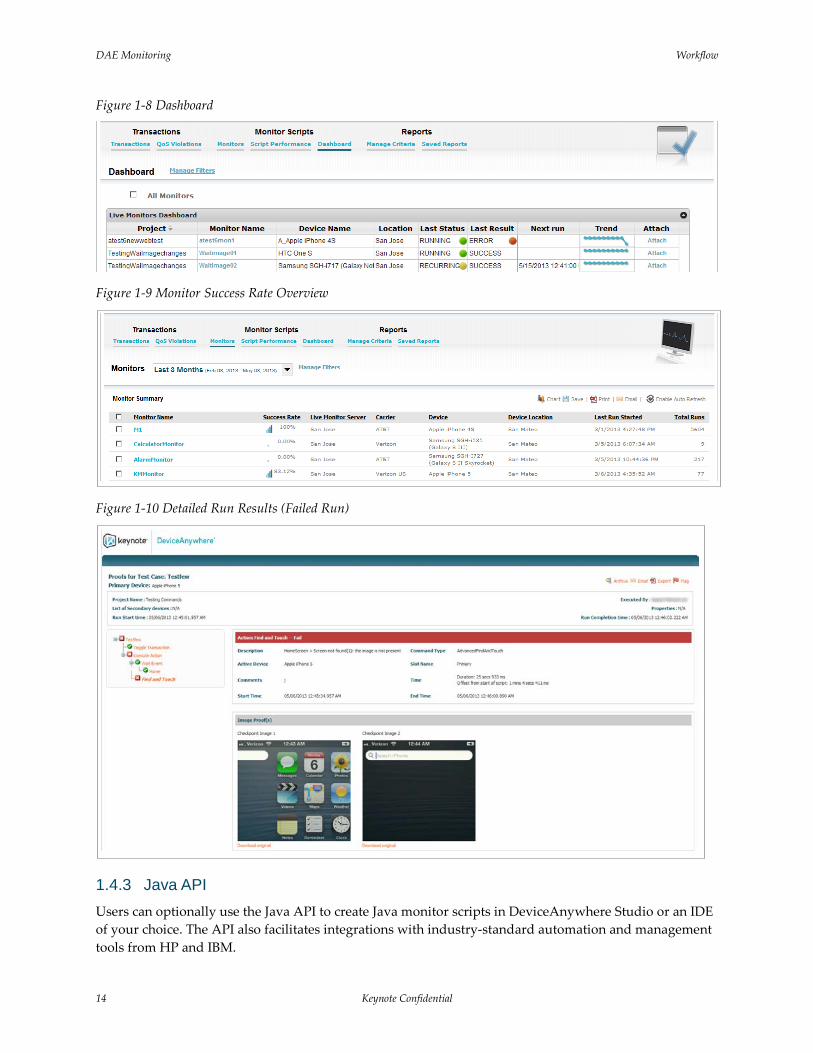
1.4.2 DeviceAnywhere Enterprise Monitoring Portal The DAE Monitoring Portal provides a real-time dashboard view of currently running monitors and live device screens as scripts are executed on them. Users can also view historical monitor data such as a list of all monitor executions, success rates for individual monitors, error reports, trend charts, and detailed results for failed script runs containing device screenshots. All standard reports can be customized for display using filters and date ranges. Users can save report data or report criteria and schedule and generate reports from them at any time. You can also download aggregate or raw data used to generate a chart.
Figure 1-6 Portal Landing Page
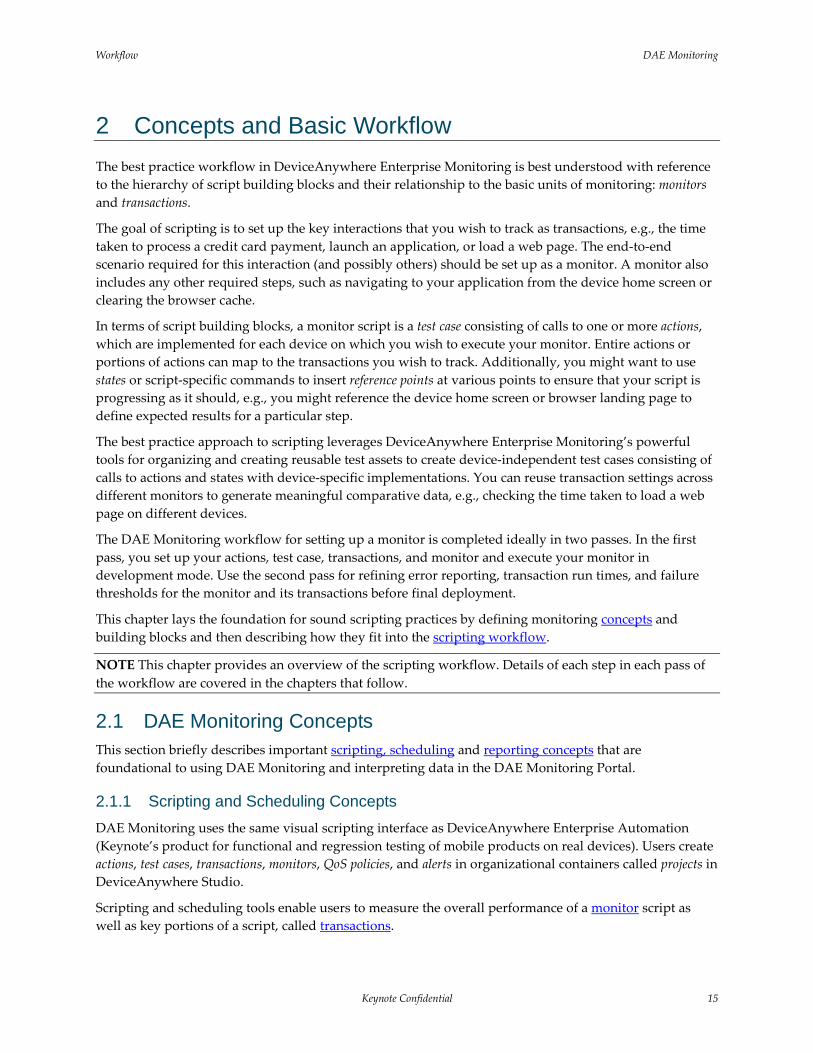
Figure 1-7 Chart—Transaction Performance (Run Times) on Different Devices
DAE Monitoring Workflow
14 Keynote Confidential
Figure 1-8 Dashboard
Figure 1-9 Monitor Success Rate Overview
Figure 1-10 Detailed Run Results (Failed Run)
1.4.3 Java API Users can optionally use the Java API to create Java monitor scripts in DeviceAnywhere Studio or an IDE of your choice. The API also facilitates integrations with industry-standard automation and management tools from HP and IBM.
Workflow DAE Monitoring
Keynote Confidential 15
2 Concepts and Basic Workflow The best practice workflow in DeviceAnywhere Enterprise Monitoring is best understood with reference to the hierarchy of script building blocks and their relationship to the basic units of monitoring: monitors and transactions.
The goal of scripting is to set up the key interactions that you wish to track as transactions, e.g., the time taken to process a credit card payment, launch an application, or load a web page. The end-to-end scenario required for this interaction (and possibly others) should be set up as a monitor. A monitor also includes any other required steps, such as navigating to your application from the device home screen or clearing the browser cache.
In terms of script building blocks, a monitor script is a test case consisting of calls to one or more actions, which are implemented for each device on which you wish to execute your monitor. Entire actions or portions of actions can map to the transactions you wish to track. Additionally, you might want to use states or script-specific commands to insert reference points at various points to ensure that your script is progressing as it should, e.g., you might reference the device home screen or browser landing page to define expected results for a particular step.
The best practice approach to scripting leverages DeviceAnywhere Enterprise Monitoring’s powerful tools for organizing and creating reusable test assets to create device-independent test cases consisting of calls to actions and states with device-specific implementations. You can reuse transaction settings across different monitors to generate meaningful comparative data, e.g., checking the time taken to load a web page on different devices.
The DAE Monitoring workflow for setting up a monitor is completed ideally in two passes. In the first pass, you set up your actions, test case, transactions, and monitor and execute your monitor in development mode. Use the second pass for refining error reporting, transaction run times, and failure thresholds for the monitor and its transactions before final deployment.
This chapter lays the foundation for sound scripting practices by defining monitoring concepts and building blocks and then describing how they fit into the scripting workflow.
NOTE This chapter provides an overview of the scripting workflow. Details of each step in each pass of the workflow are covered in the chapters that follow.
2.1 DAE Monitoring Concepts This section briefly describes important scripting, scheduling and reporting concepts that are foundational to using DAE Monitoring and interpreting data in the DAE Monitoring Portal.
2.1.1 Scripting and Scheduling Concepts DAE Monitoring uses the same visual scripting interface as DeviceAnywhere Enterprise Automation (Keynote’s product for functional and regression testing of mobile products on real devices). Users create actions, test cases, transactions, monitors, QoS policies, and alerts in organizational containers called projects in DeviceAnywhere Studio.
Scripting and scheduling tools enable users to measure the overall performance of a monitor script as well as key portions of a script, called transactions.
DAE Monitoring Workflow
16 Keynote Confidential
Project
A project is an organizational container for test assets and devices, generally specific to an application or functionality you wish to test.
Projects consist of:
Associated devices
Scripting assets: actions, states, and test cases
Scheduling assets: transactions, monitors, monitor policies, transaction policies, and alerts
Project metadata: permissions, error definitions, project variables, alert suppression window, and project dependency information
When you create a project, folders are automatically created in the project directory for different assets in both the Scripting and Scheduling tabs of the Monitoring view. Actions, test cases, and states are the main building blocks of your automated monitoring scripts and are created in the Scripting tab. Transaction and monitor settings, policies, and alerts triggered when policies are violated are created in the Scheduling tab. Scheduling assets enable you to monitor your mobile application effectively and generate meaningful reporting data.
You can further organize assets by creating sub-folders, as for separating test cases that deal with a distinct functional area of an application. A project defines reusability of assets, e.g., you can reuse an action in multiple test cases contained within a project.
Action
Actions are the basic unit of scripting and the building blocks of test cases. Actions accomplish specific tasks that might result in a change to the device state.
You can think of actions as the discrete procedures that make up the larger process that is a test case—each broad step in a test case corresponds to an action consisting of a series of device interactions and verifications. While the size of actions is not limited, they are best thought of as mini-scripts that can be reliably reused across test cases.
Actions are device-independent, that is, they are defined for all project devices and consist of device-specific implementations to account for differences in interfaces. However, actions with Web commands that operate directly on web elements can operate across devices and do not require separate implementations. Examples of actions in a test case that tests a Web site are resetting a device, opening a web browser, and navigating to a URL.
Implementation
While an action or state can be generically defined for all project devices, differences in how the devices look or behave make it necessary to create device-specific implementations. An implementation contains the specific commands or device screens that make up an action or state on a particular device.
Implementations can be created from scratch or cloned and altered from other implementations for like devices.
NOTE You can create unpartitioned actions and states where like devices share a single implementation. You can also create unpartitioned actions and states when creating scripts that interact with web elements (e.g., when testing a web application).
Workflow DAE Monitoring
Keynote Confidential 17
Test Case
A test case is the broad process that accomplishes a test goal on your mobile application or content. For example, a test case might consist of viewing and deleting call records from a device, searching for directions to a specified address in a mobile web browser, or getting the weather report for a specified zip code from a short-code weather service.
Test cases are device-independent. They generally consist of calls to previously defined actions and states with additional commands such as branches and loops to control script logic.
State
States define known device conditions (text-, audio-, image-, or web element-based) that can be referenced to verify the result of a sequence of device interactions. For example, states use the device home screen or the browser home page in order to specify an expected result. States can be reused across scripts, i.e., called from several actions and test cases in a project.
States are device-independent, that is, they are defined for all project devices and consist of device-specific implementations to account for differences in interfaces. If an expected result changes over time, a state can be updated in one place, without having to update every script containing a reference to it.
Transaction
DAE Monitoring enables you to measure the overall performance of a monitor script as well as that of different portions of your script called transactions. Setting up transactions enables you to measure the performance of crucial aspects of your application or service, e.g., the time taken for a corporate web site to load, the time taken to process a credit card payment, or whether an image associated with an account is displayed upon login. You would not set up routine interactions such as resetting a device to the home screen as transactions—the success of failure of these operations have no bearing on the performance of your mobile application or service.
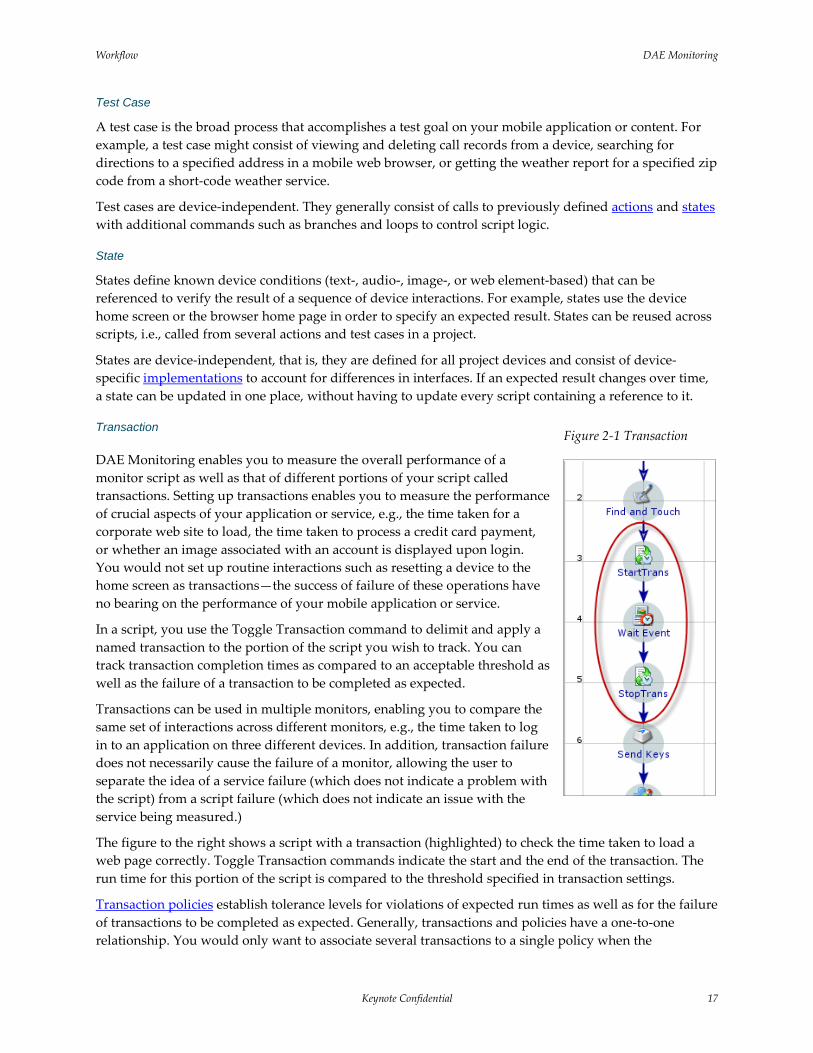
In a script, you use the Toggle Transaction command to delimit and apply a named transaction to the portion of the script you wish to track. You can track transaction completion times as compared to an acceptable threshold as well as the failure of a transaction to be completed as expected.
Transactions can be used in multiple monitors, enabling you to compare the same set of interactions across different monitors, e.g., the time taken to log in to an application on three different devices. In addition, transaction failure does not necessarily cause the failure of a monitor, allowing the user to separate the idea of a service failure (which does not indicate a problem with the script) from a script failure (which does not indicate an issue with the service being measured.)
The figure to the right shows a script with a transaction (highlighted) to check the time taken to load a web page correctly. Toggle Transaction commands indicate the start and the end of the transaction. The run time for this portion of the script is compared to the threshold specified in transaction settings.
Transaction policies establish tolerance levels for violations of expected run times as well as for the failure of transactions to be completed as expected. Generally, transactions and policies have a one-to-one relationship. You would only want to associate several transactions to a single policy when the
Figure 2-1 Transaction
DAE Monitoring Workflow
18 Keynote Confidential
transactions measure similar aspects of a service that you want to track together. When multiple transactions are associated with one policy, all the transactions are evaluated together. So a violation of the acceptable completion time in any one of the transactions contributes to the same incident.
Monitor
In the DAE Monitoring scripting architecture, a test case is the broad process that represents your monitoring scenario for your mobile application or content.
A monitor is defined as a test case script scheduled to run at a specified frequency on a monitor server and on a specified device (or multiple devices for a multi-device test case).
The test case is the broad process that represents the monitoring scenario for your mobile application, content, or device. For example, the test case might consist of logging in to and checking balances in a mobile banking application, or searching for flights based on search criteria entered in a mobile browser. Test cases are comprised of one or more actions (the discrete procedures that make up the larger process that is the test case) and states.
In addition to tracking the overall performance of the monitor script, you can track the performance of key interactions with your application or service called transactions. Transactions can map to entire actions called from the test case or to specific portions of actions.
Monitor failure is tied to the error management system and indicates an issue with the script, device, or measurement system. Monitor policies establish tolerance levels for monitor failure and specify alerts to be sent out for policy violation.
NOTE A monitor can also fail:
Because of outright transaction failure when there are dependent interactions further down the script—specifying outright transaction failure (in addition to performance violation) is discussed in Transactions in Scripting Workflow: Round One.
When the Success command is used to stop a script when a transaction fails outright
Monitors can be scheduled to run continuously or at any frequency through all hours of the day and days of the week. You can also schedule a monitor to run only on certain days of the week and hours of the day.
Error Categories and Types
The error management system consists of error categories containing error types, which you can call from various commands in your scripts to generate error messaging when your script fails at those points. Monitor success/failure is tied to the error management system, and you associate specific error types with a monitor policy. The policy then sets tolerance levels for triggering associated error types in a given number of script runs.
You can create project-wide error definitions in project properties (right-click a project in the project list > Properties > Error Types tab).
QoS Policies for Transactions and Monitors
Quality of service policies are the rules that define when to take action because of monitor or transaction failures and what action to take.
Workflow DAE Monitoring
Keynote Confidential 19
Monitor policies are tied to the error management system and define tolerance levels for monitor failure. You associate specific error types with a monitor policy. The policy then sets tolerance levels for triggering associated error types in a given number of script runs.
Transaction policies establish tolerance levels for violations of expected run times or failure of a transaction to be completed as expected. Both monitor and transaction policies support sending out different alerts for up to three levels of escalation. If a level 1 violation is defined as 3 failed runs out of 6, and 3 out of the first 4 runs have failed, the system triggers an alert immediately; it does not wait to complete 6 runs before sending out the alert.
Alerts
Email or SNMP alerts are triggered when a monitor or transaction policy is violated or when an incident is resolved. Alert settings include method of delivery (email vs. SNMP), recipient list, frequency of delivery, and a customizable message body. In transaction or monitor policies, you specify the alerts triggered for up to three levels of violation as well as incident resolution. Alerts can be reused, e.g., across multiple policies within your project or for multiple violation levels within the same policy.
Alert Suppression
Alert suppression is a window of time during which there no alerts and escalation processing for monitors being executed. This window enables scheduled maintenance and is defined in project properties. Monitor runs during the window appear in the dashboard but not in the execution report.
If there are monitor runs in progress at the start of the window, they trigger the appropriate escalations and alerts. Any existing escalations at the start of the window do not change status during the window.
2.1.2 Execution and Reporting Concepts This section provides brief definitions and descriptions of execution and DAE Monitoring Portal reporting concepts.
Dashboard
The DAE Monitoring Portal dashboard provides the ability to view the status of most recently executed monitor runs, upcoming scheduled runs, and live device screens as monitor scripts are being executed on them. Monitors runs during an alert suppression window also show up in the dashboard. Icons provide a quick visual indication of run result (success or failure) and monitor status (running, disabled, etc.). A link next to each monitor allows you to view the device screen during monitor execution.
Execution Report
The execution report (Execution Report link at the top-right corner of the DAE Monitoring Portal) is the exhaustive list of every monitor run in your system, excluding runs during an alert suppression window. By default, runs are arranged most recent first, with information on device, carrier, run result, and a link to view screen-by-screen results for failed runs. Users with permissions can exclude specific runs from the execution report, which also excludes them from all other reports in the DAE Monitoring Portal.
Monitor Summary Report
The monitor summary in the Monitor Scripts view of the DAE Monitoring Portal displays the overall success rate and total number of runs for every monitor in your system over a specified date range. Each monitor has a link to view monitor details. You can select monitors to be displayed in a comparative chart
DAE Monitoring Workflow
20 Keynote Confidential
of transaction times (monitor performance) or a visual representation of monitor success or failure (monitor availability) over a period of time.
Monitor Details
The monitor details report, which opens up when you click the name of a monitor anywhere in the DAE Monitoring Portal, displays the total number of runs, success rate, a graphic representation of the success rate and failures (by error type), transaction times, and the total number of monitor incidents and escalations at each level. There are also links to view detailed incident reports and screen-by-screen results for failed runs.
Transaction Summary Report
The transaction summary in the Transactions view of the DAE Monitoring Portal displays the success rate and total number of transaction runs over a specified date range for every transaction in your system. Transaction details can be viewed by clicking a transaction name.
You can select transactions to be displayed in a comparative chart of transaction times (transaction performance) or a visual representation of transaction success or failure (transaction availability) over a period of time.
Transaction Details Report
The transaction details report opens up when you click the name of a transaction. It displays the total number of transaction runs with the success rate and its graphic representation. It lists the monitors, devices, and locations from which the transaction has been executed and also lists total number of transaction incidents and escalations at each level.
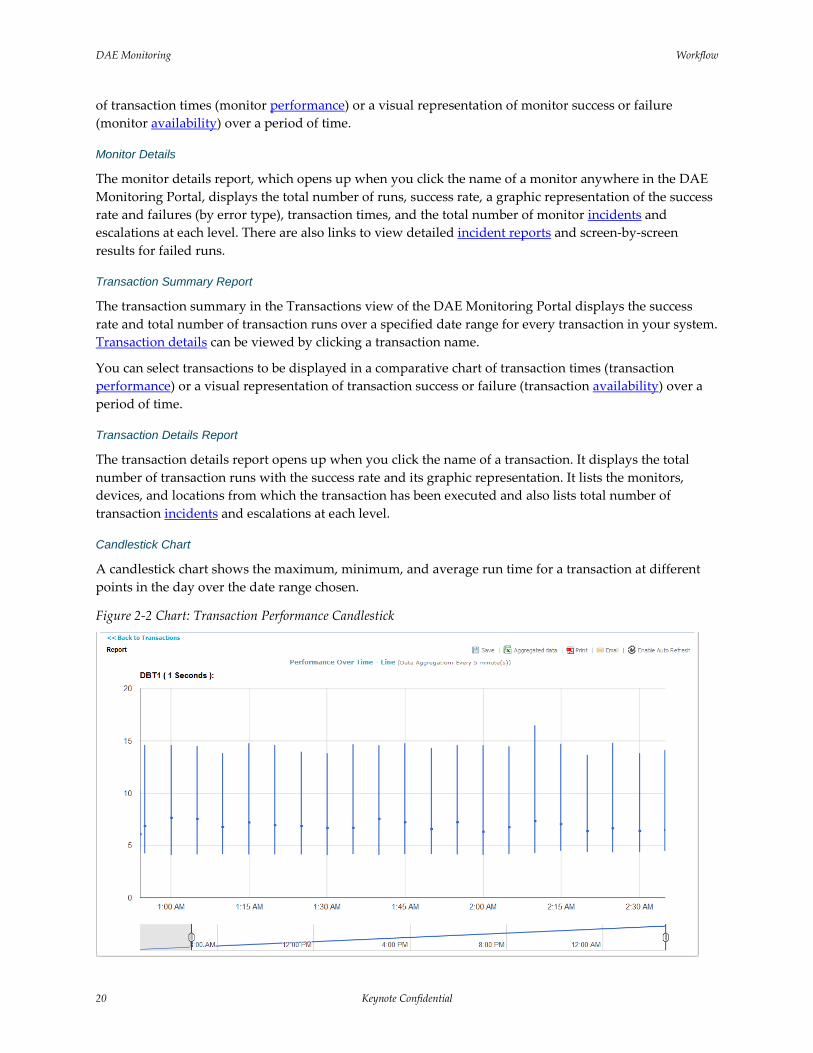
Candlestick Chart
A candlestick chart shows the maximum, minimum, and average run time for a transaction at different points in the day over the date range chosen.
Figure 2-2 Chart: Transaction Performance Candlestick
Workflow DAE Monitoring
Keynote Confidential 21
Incident
The first run that violates a transaction or monitor policy generates an incident. An incident begins at the lowest escalation level and is tracked through up to two further levels until it is resolved. Incidents may be resolved at any escalation level. Incidents and their resolution trigger alerts.
Incident Summary and Details
The most recent monitor incidents and their current status are displayed in the Script Performance tab. The most recent transaction incidents are displayed in the QoS Violations tab. Click an Incident Start Time to view a detailed incident report. An incident report displays a run-by-run analysis of an incident, from the first level of escalation when alerts were sent out to incident resolution.
Monitor incidents (monitor policy violations) are listed in the monitor details report, and transaction incidents are listed in the transaction details report.
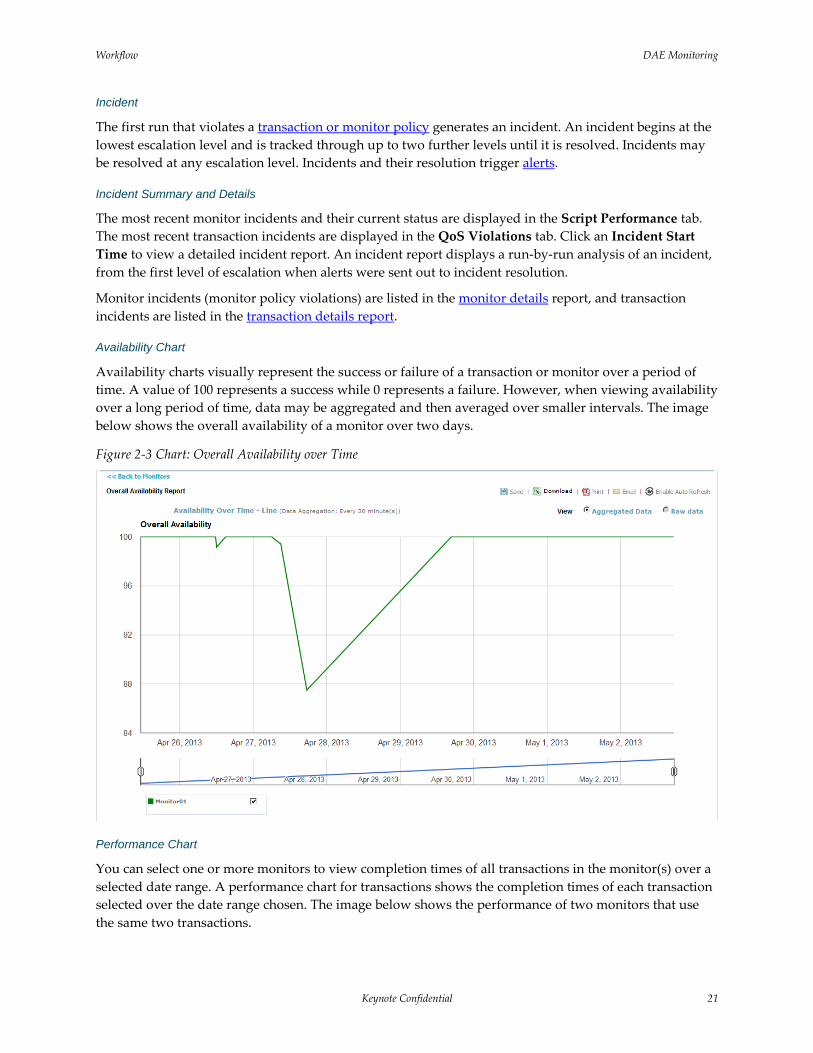
Availability Chart
Availability charts visually represent the success or failure of a transaction or monitor over a period of time. A value of 100 represents a success while 0 represents a failure. However, when viewing availability over a long period of time, data may be aggregated and then averaged over smaller intervals. The image below shows the overall availability of a monitor over two days.
Figure 2-3 Chart: Overall Availability over Time
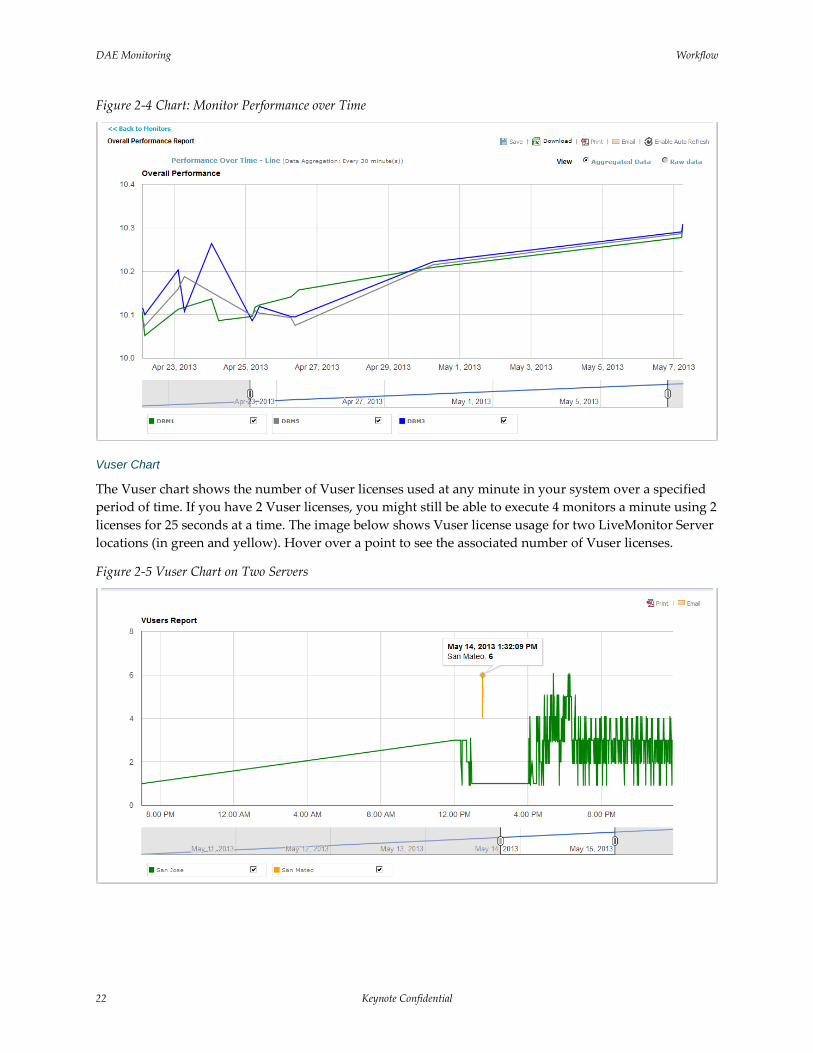
Performance Chart
You can select one or more monitors to view completion times of all transactions in the monitor(s) over a selected date range. A performance chart for transactions shows the completion times of each transaction selected over the date range chosen. The image below shows the performance of two monitors that use the same two transactions.
DAE Monitoring Workflow
22 Keynote Confidential
Figure 2-4 Chart: Monitor Performance over Time
Vuser Chart
The Vuser chart shows the number of Vuser licenses used at any minute in your system over a specified period of time. If you have 2 Vuser licenses, you might still be able to execute 4 monitors a minute using 2 licenses for 25 seconds at a time. The image below shows Vuser license usage for two LiveMonitor Server locations (in green and yellow). Hover over a point to see the associated number of Vuser licenses.
Figure 2-5 Vuser Chart on Two Servers
Workflow DAE Monitoring
Keynote Confidential 23
2.2 Best Practice Scripting Workflow Script building blocks are constructed and refined ideally in two passes. In the first pass, you identify key interactions you wish to track as transactions and define your objectives in terms of the high-level monitoring scenario required to track key interactions. Actual scripting begins with the creation of a project, actions, states, and their implementations. You progressively define building blocks till you are ready to construct modular test cases, which represent the high-level monitors you want to execute. Next, you execute monitors in development mode and check the dashboard.
The second pass consists mainly of refining error types and policies and optimizing ideal transaction run times based on viewing initial results. Finally, you deploy monitors in production mode and track monitoring data.
In this workflow, the actual process of scripting begins with creating actions and implementing them, inserting reference points for verification and error types for reporting. The greater part of scripting consists of creating action implementations.
NOTE The steps identified below cover the monitor scripting workflow in brief. The first pass is covered in detail in Scripting Workflow: Round One and the second pass in Scripting Workflow: Round Two.
The first pass of the scripting workflow consists of the following steps:
1 Identify key interaction(s) with your mobile application, service or content that you wish to track, e.g., the time taken to process a payment. These interactions should be set up as transactions in scripts.
2 Conceptualize the end-to-end scenario you need to construct in order to track these key interactions. This end-to-end scenario should be set up as a device-independent test case in the course of scripting (and deployed as a monitor). For example, in order to track the time taken to process a credit card payment, your end-to-end scenario might include resetting the device to the home screen, navigating to an e-commerce Web site, searching for and adding an item to a shopping cart, entering shipping and credit card details, and finally, placing the order.
3 Identify devices you would like to monitor on and the procedures that can be used as the basis for creating reusable actions.
4 Create a project in the Monitoring view and add devices to it.
5 Begin scripting by creating actions to accomplish specific tasks within the larger test case objective, e.g., navigating to an e-commerce Web site, searching for an item, adding the item to a shopping cart, and completing order details and placing the order.
Create device-specific action implementations to account for differences in device interfaces or use unpartitioned actions when working directly with web elements.
6 Define and use reference points in script-specific commands or in reusable states. Reference points are device output (text, video, audio, or web elements) that verify a sequence of device interactions.
7 Specify proofs to be captured from various commands when your script fails at those points. Proofs are device screenshots or video and are displayed in detailed, step-by-step results for failed runs.
8 Create a test case consisting of calls to actions and states, and any script logic.
9 Set up and use transactions in your scripts to establish run times for key command sequences. You can map an entire action or a portion of it to a transaction. To create a transaction:
a Create a named transaction with an expected run time setting in the Scheduling tab.
DAE Monitoring Workflow
24 Keynote Confidential
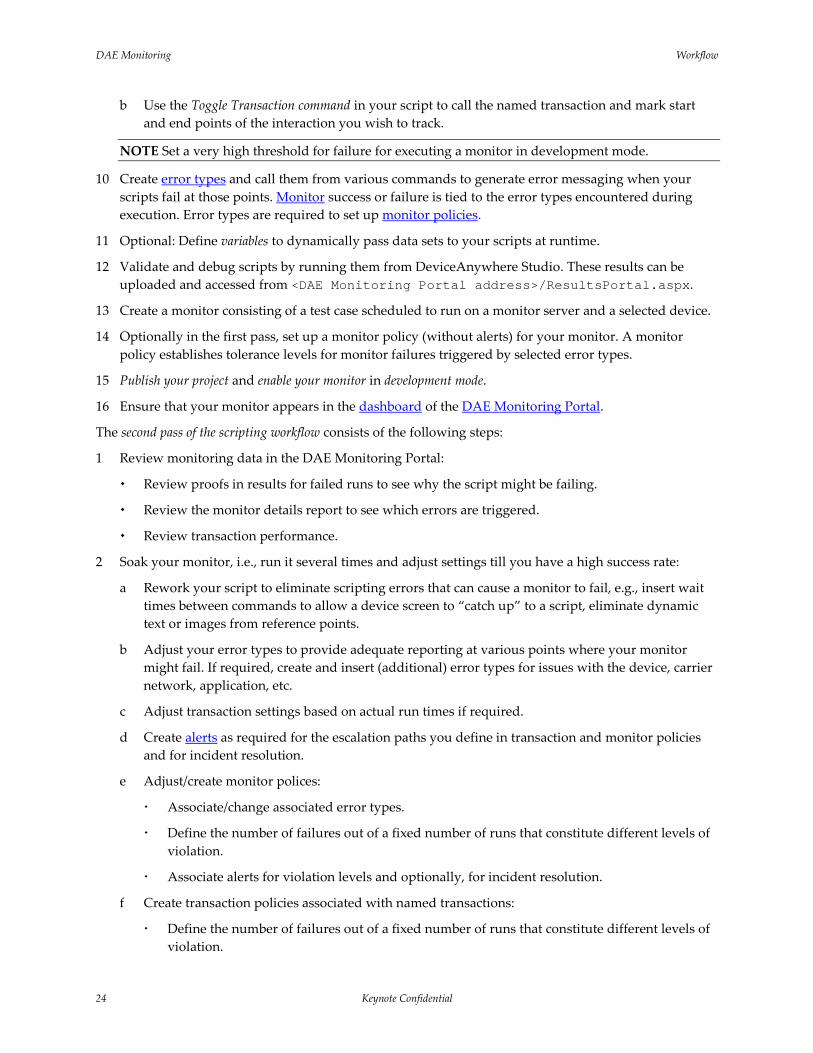
b Use the Toggle Transaction command in your script to call the named transaction and mark start and end points of the interaction you wish to track.
NOTE Set a very high threshold for failure for executing a monitor in development mode.
10 Create error types and call them from various commands to generate error messaging when your scripts fail at those points. Monitor success or failure is tied to the error types encountered during execution. Error types are required to set up monitor policies.
11 Optional: Define variables to dynamically pass data sets to your scripts at runtime.
12 Validate and debug scripts by running them from DeviceAnywhere Studio. These results can be uploaded and accessed from <DAE Monitoring Portal address>/ResultsPortal.aspx.
13 Create a monitor consisting of a test case scheduled to run on a monitor server and a selected device.
14 Optionally in the first pass, set up a monitor policy (without alerts) for your monitor. A monitor policy establishes tolerance levels for monitor failures triggered by selected error types.
15 Publish your project and enable your monitor in development mode.
16 Ensure that your monitor appears in the dashboard of the DAE Monitoring Portal.
The second pass of the scripting workflow consists of the following steps:
1 Review monitoring data in the DAE Monitoring Portal:
Review proofs in results for failed runs to see why the script might be failing.
Review the monitor details report to see which errors are triggered.
Review transaction performance.
2 Soak your monitor, i.e., run it several times and adjust settings till you have a high success rate:
a Rework your script to eliminate scripting errors that can cause a monitor to fail, e.g., insert wait times between commands to allow a device screen to “catch up” to a script, eliminate dynamic text or images from reference points.
b Adjust your error types to provide adequate reporting at various points where your monitor might fail. If required, create and insert (additional) error types for issues with the device, carrier network, application, etc.
c Adjust transaction settings based on actual run times if required.
d Create alerts as required for the escalation paths you define in transaction and monitor policies and for incident resolution.
e Adjust/create monitor polices:
Associate/change associated error types.
Define the number of failures out of a fixed number of runs that constitute different levels of violation.
Associate alerts for violation levels and optionally, for incident resolution.
f Create transaction policies associated with named transactions:
Define the number of failures out of a fixed number of runs that constitute different levels of violation.

Workflow DAE Monitoring
Keynote Confidential 25
Associate alerts for violation levels and optionally, for incident resolution.
3 Publish your project and execute your monitor in production mode.
4 Review monitoring data in the DAE Monitoring Portal.
DAE Monitoring Workflow
26 Keynote Confidential
3 Scripting Workflow: Round One The first pass of the scripting workflow begins with conceptualizing and identifying key mobile interactions you would like to track, the end-to-end monitoring scenario required to set up these interactions, and reusable script components within the monitoring scenario. Most of the scripting is also completed in the first pass, at the end of which you should have created actions, states, test cases, transactions, and monitors. You can also set up and use error types, which are tied to monitor policies. The purpose of this round of scripting is to create and deploy a monitor in development mode so you can analyze initial returns with a view to refining scripts in the second pass (discussed in Scripting Workflow: Round Two).
This chapter provides instructions and guidelines for each step in the first pass of the scripting workflow, outlined in brief in Best Practice Scripting Workflow.
NOTE This document does not provide exhaustive instruction on using the visual scripting environment—refer to the DAE Automation User Guide for step-by-step information on creating and maintaining script assets, using visual commands, and a command reference.
3.1 Step: Identify Key Interactions to Track Identify key interaction(s) with your mobile application, service or content that you wish to track the performance of, e.g., the time taken to launch a mobile application, the time taken to log in to an application (with and without credentials stored), or the time taken to process a credit card payment. These interactions will need to be set up as transactions in the course of scripting.
The DeviceAnywhere Enterprise Monitoring system does not enforce the creation and tracking of transactions; you can deploy monitors that do not use transactions to accomplish and track a broad test goal, e.g., deleting or creating entries in a list of contacts, searching for flights in an airline schedule, or making an online purchase. However, using transactions helps you to focus attention on critical interactions in a monitor scenario are relevant to your mobile product. It also ensures that script failure at a step that is not relevant to your service does not send out false alarms. You can target key interactions that can vary in performance and impact customer experience by setting up transaction policies that are separate from monitor polices. Transactions are also tracked independently in the DAE Monitoring Portal, and you can find both device-independent and device-specific metrics on transaction performance and availability.
3.2 Step: Conceptualize the End-to-End Monitor Scenario Conceptualize (in device-independent terms) the end-to-end scenario you will need to construct in order to track these key interactions. This end-to-end scenario, or broad monitoring goal, must be set up in the course of scripting as a device-independent test case (and deployed as a monitor).
The end-to-end monitoring scenario includes steps to set up the interaction(s) you wish to track as well as steps to facilitate working with real devices in an automated monitoring environment, e.g., resetting the device to the home screen (in order to start from a known position) or clearing the browser cache.
For example, in order to track the time taken to process a credit card payment, your end-to-end scenario might include resetting the device to the home screen, navigating to an e-commerce website, searching for and adding an item to a shopping cart, entering shipping and card details, and placing the order.
Workflow DAE Monitoring
Keynote Confidential 27
The monitoring goal is accomplished by a modular test case, which can be broken down into discrete procedures, represented by actions. Test cases are generally device-independent; a test case script is valid for all project devices. A test case makes calls to actions or states, which can have device-specific implementations. When working with web elements, however, actions and states are unpartitioned.
3.3 Step: Identify Monitor Building Blocks Identify test case building blocks, or constituent procedures that can be used as the basis for creating reusable actions. Breaking down your monitor scenario into discrete procedures has several advantages:
The task of scripting is broken down into smaller, manageable units.
Each discrete procedure is used as the basis for an action, which can be reused in other test cases within your project. For example, actions for opening an application or closing an application can be reused in multiple test cases that accomplish different application goals.
In a monitoring scenario to track the time taken to process a credit card payment, actions might include resetting the device to the home screen, navigating to an e-commerce website, searching for and adding an item to a shopping cart, entering shipping and credit card details, and finally, placing the order.
Identify devices you would like to execute the monitor on—actions and states must have implementations for each of these devices. When working with web elements, however, actions and states are unpartitioned.
3.4 Step: Create a Project All scripting and scheduling assets (generally, specific to an application or functionality you wish to test) in the DeviceAnywhere Enterprise Monitoring environment are contained within a project.
Projects consist of:
Associated devices
Scripting assets: actions, states, and test cases
Scheduling assets: transactions, monitors, monitor policies, transaction policies, and alerts
Project metadata: permissions, error definitions, project variables, alert suppression window, and project dependency information
A project defines reusability of assets, e.g., actions can be reused across test cases contained within a project.
You can create a project in any of these ways from either the Scripting or the Scheduling tab of the Monitoring view:
Select New Project from the bottom of the project list.
With an open project selected in the project list, select File > New > New Project.
Select Project > New Project.
DAE Monitoring Workflow
28 Keynote Confidential
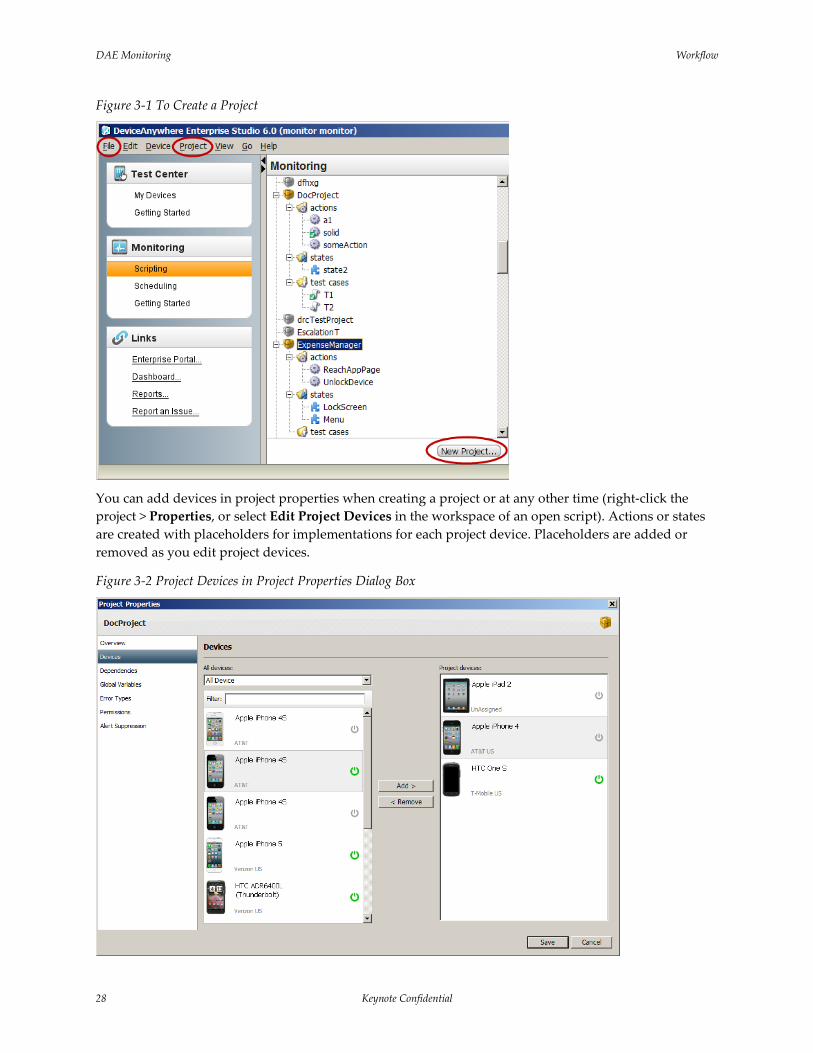
Figure 3-1 To Create a Project
You can add devices in project properties when creating a project or at any other time (right-click the project > Properties, or select Edit Project Devices in the workspace of an open script). Actions or states are created with placeholders for implementations for each project device. Placeholders are added or removed as you edit project devices.
Figure 3-2 Project Devices in Project Properties Dialog Box
Workflow DAE Monitoring
Keynote Confidential 29
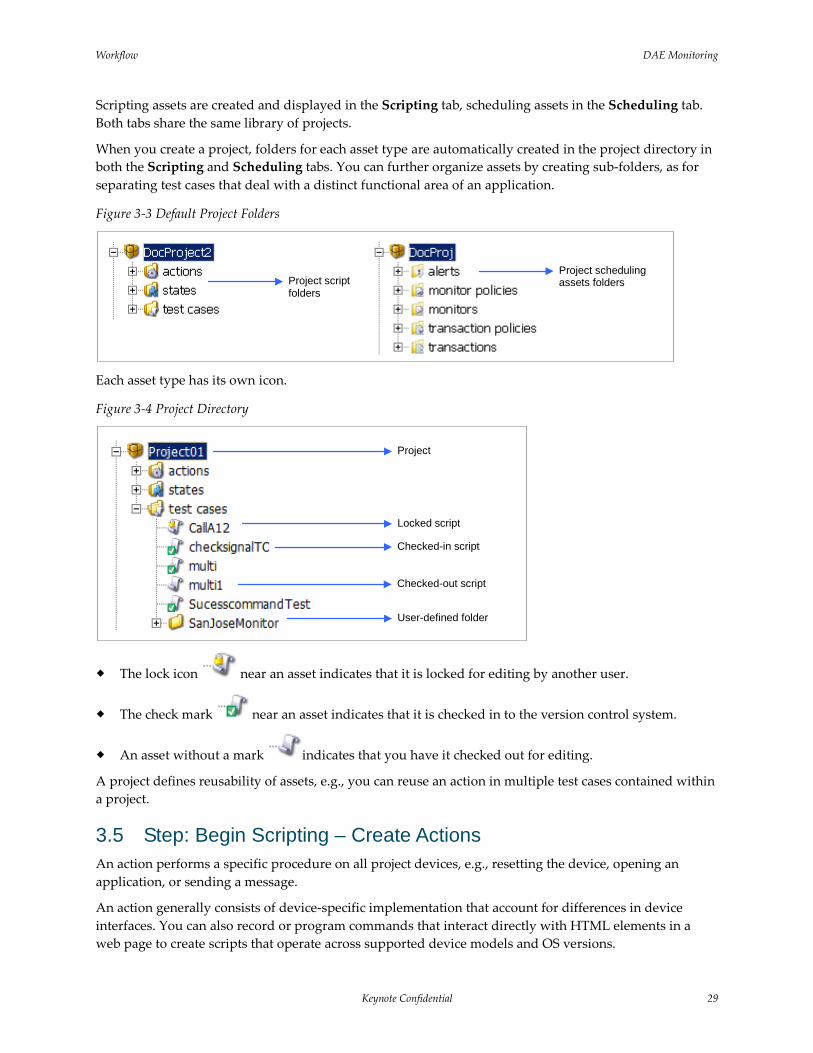
Scripting assets are created and displayed in the Scripting tab, scheduling assets in the Scheduling tab. Both tabs share the same library of projects.
When you create a project, folders for each asset type are automatically created in the project directory in both the Scripting and Scheduling tabs. You can further organize assets by creating sub-folders, as for separating test cases that deal with a distinct functional area of an application.
Figure 3-3 Default Project Folders
Each asset type has its own icon.
Figure 3-4 Project Directory
The lock icon near an asset indicates that it is locked for editing by another user.
The check mark near an asset indicates that it is checked in to the version control system.
An asset without a mark indicates that you have it checked out for editing.
A project defines reusability of assets, e.g., you can reuse an action in multiple test cases contained within a project.
3.5 Step: Begin Scripting – Create Actions An action performs a specific procedure on all project devices, e.g., resetting the device, opening an application, or sending a message.
An action generally consists of device-specific implementation that account for differences in device interfaces. You can also record or program commands that interact directly with HTML elements in a web page to create scripts that operate across supported device models and OS versions.
Project script folders
Project scheduling assets folders
Project
Locked script
User-defined folder
Checked-out script
Checked-in script
DAE Monitoring Workflow
30 Keynote Confidential
NOTE Implementations for like devices can be merged—see the DAE Automation User Guide for details.
Actions are used as building blocks for test cases, which string together several actions and states to perform an end-to-end scenario or accomplish a broad monitoring goal on a mobile device. Once implemented, actions can be reused in any number of test cases.
3.5.1 Creating an Action and Implementation The actual process of scripting begins with creating actions and implementing them.
Use any of these methods to create an action from the Scripting tab of the Monitoring view:
Right-click your project actions folder (or sub-folder) and select New Action.
While in your project, select File > New > Action.
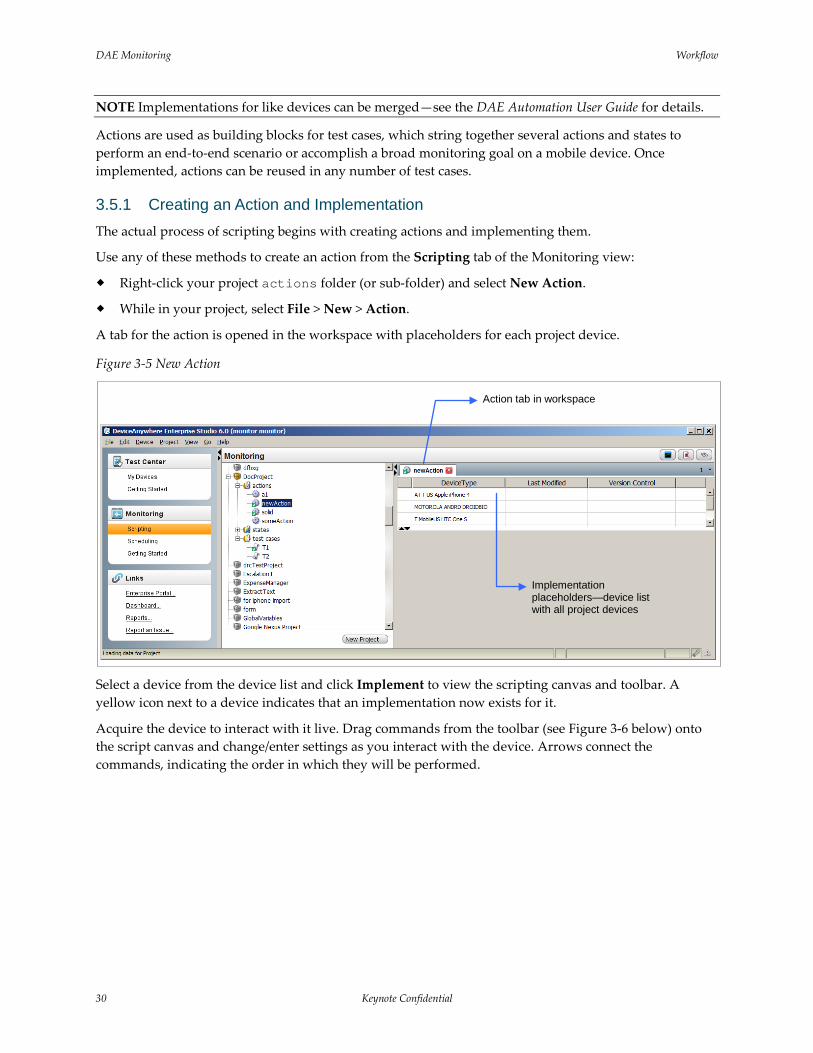
A tab for the action is opened in the workspace with placeholders for each project device.
Figure 3-5 New Action
Select a device from the device list and click Implement to view the scripting canvas and toolbar. A yellow icon next to a device indicates that an implementation now exists for it.
Acquire the device to interact with it live. Drag commands from the toolbar (see Figure 3-6 below) onto the script canvas and change/enter settings as you interact with the device. Arrows connect the commands, indicating the order in which they will be performed.
Action tab in workspace
Implementation placeholders—device list with all project devices
Workflow DAE Monitoring
Keynote Confidential 31
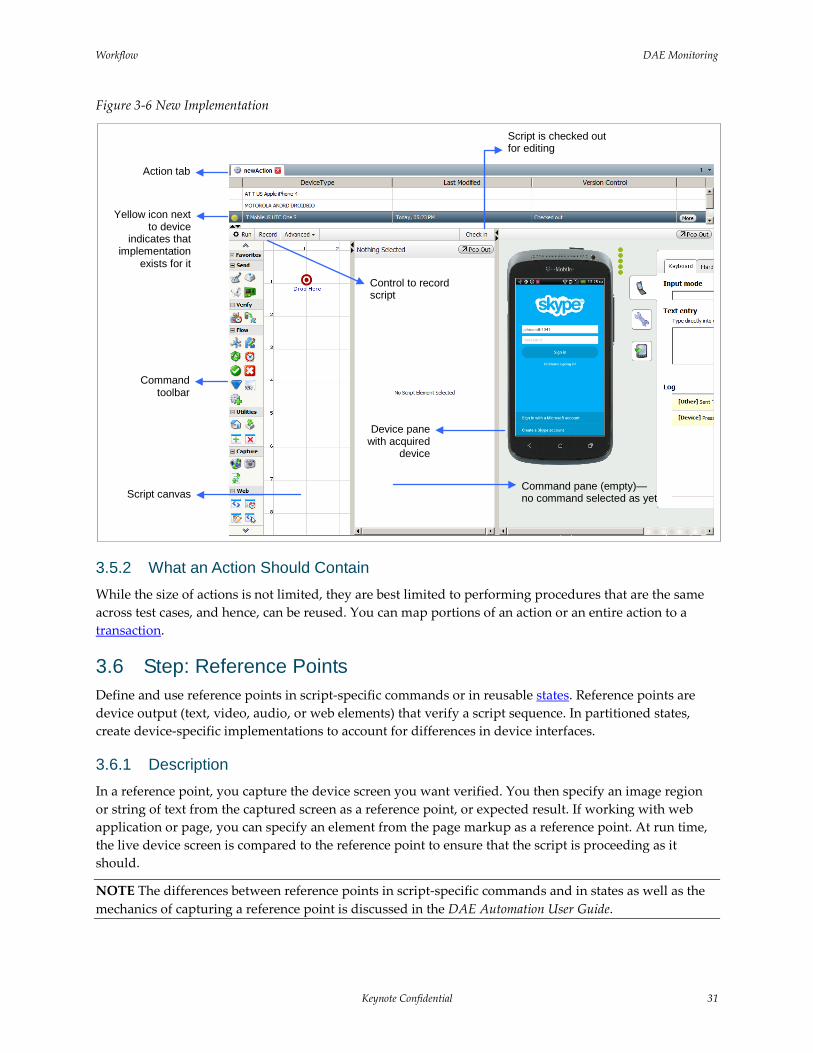
Figure 3-6 New Implementation
3.5.2 What an Action Should Contain While the size of actions is not limited, they are best limited to performing procedures that are the same across test cases, and hence, can be reused. You can map portions of an action or an entire action to a transaction.
3.6 Step: Reference Points Define and use reference points in script-specific commands or in reusable states. Reference points are device output (text, video, audio, or web elements) that verify a script sequence. In partitioned states, create device-specific implementations to account for differences in device interfaces.
3.6.1 Description In a reference point, you capture the device screen you want verified. You then specify an image region or string of text from the captured screen as a reference point, or expected result. If working with web application or page, you can specify an element from the page markup as a reference point. At run time, the live device screen is compared to the reference point to ensure that the script is proceeding as it should.
NOTE The differences between reference points in script-specific commands and in states as well as the mechanics of capturing a reference point is discussed in the DAE Automation User Guide.
Script is checked out for editing
Action tab
Command toolbar
Yellow icon next to device
indicates that implementation
exists for it
Device pane with acquired
device
Script canvas
Control to record script
Command pane (empty)— no command selected as yet
DAE Monitoring Workflow
32 Keynote Confidential
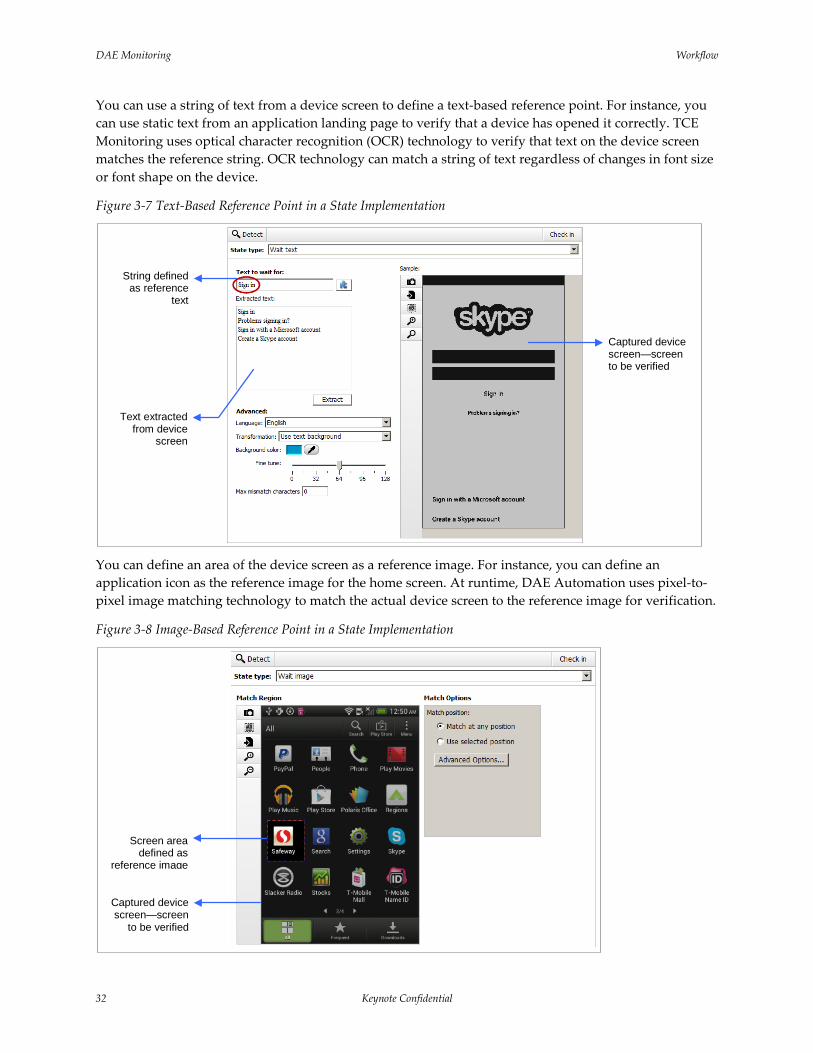
You can use a string of text from a device screen to define a text-based reference point. For instance, you can use static text from an application landing page to verify that a device has opened it correctly. TCE Monitoring uses optical character recognition (OCR) technology to verify that text on the device screen matches the reference string. OCR technology can match a string of text regardless of changes in font size or font shape on the device.
Figure 3-7 Text-Based Reference Point in a State Implementation
You can define an area of the device screen as a reference image. For instance, you can define an application icon as the reference image for the home screen. At runtime, DAE Automation uses pixel-to-pixel image matching technology to match the actual device screen to the reference image for verification.
Figure 3-8 Image-Based Reference Point in a State Implementation
Captured device screen—screen
to be verified
Screen area defined as
reference image
Captured device screen—screen to be verified
Text extracted from device
screen
String defined as reference
text
Workflow DAE Monitoring
Keynote Confidential 33
3.6.2 General Guidelines on Using Reference Points General guidelines:
Use verifications throughout your monitor script and constituent actions.
Set up verification failure to trigger an error, as all errors encountered, whether or not they are tied to monitor policies, are reported in the monitor details report in the DAE Monitoring Portal.
Create and use error categories and types to correctly indicate the type of error, e.g., reserve some error types strictly to indicate problems with your mobile application, service, or content.
Set your script to fail if an error is triggered as a result of verification failure, as subsequent script activity generally depends on successful completion of preceding commands. Script failure farther down the line is more difficult to diagnose when looking at results.
NOTE DAE Guide to Text Matching and DAE Guide to Image Matching contain several guidelines on setting up your device for using reference points and on avoiding false matches and false match failures.
3.6.3 Reference Points in Transactions In transactions:
Use verifications in transactions—very often, your transaction will consist only of a verification command and its branches, e.g., to verify that a page loaded correctly within acceptable run times, you will want to wrap a transaction around a verification command.
Use Wait Event with logic for success/fail branches for verifications in transactions. Wait Event enables you to define a combination of reference points as the basis for creating script branches, e.g., if a reference image is found, the script takes the associated branch. You can call a pre-defined state from Wait Event. This command is useful when there are multiple possible outcomes for a command sequence, and a different course must be followed depending on the outcome.
In addition to wrapping the Toggle Transaction command with Stop and Start settings around a Wait Event command, you can also use the Fail setting of Toggle Transaction in Wait Event branches to specify outcomes where a transaction should fail outright (see transactions).
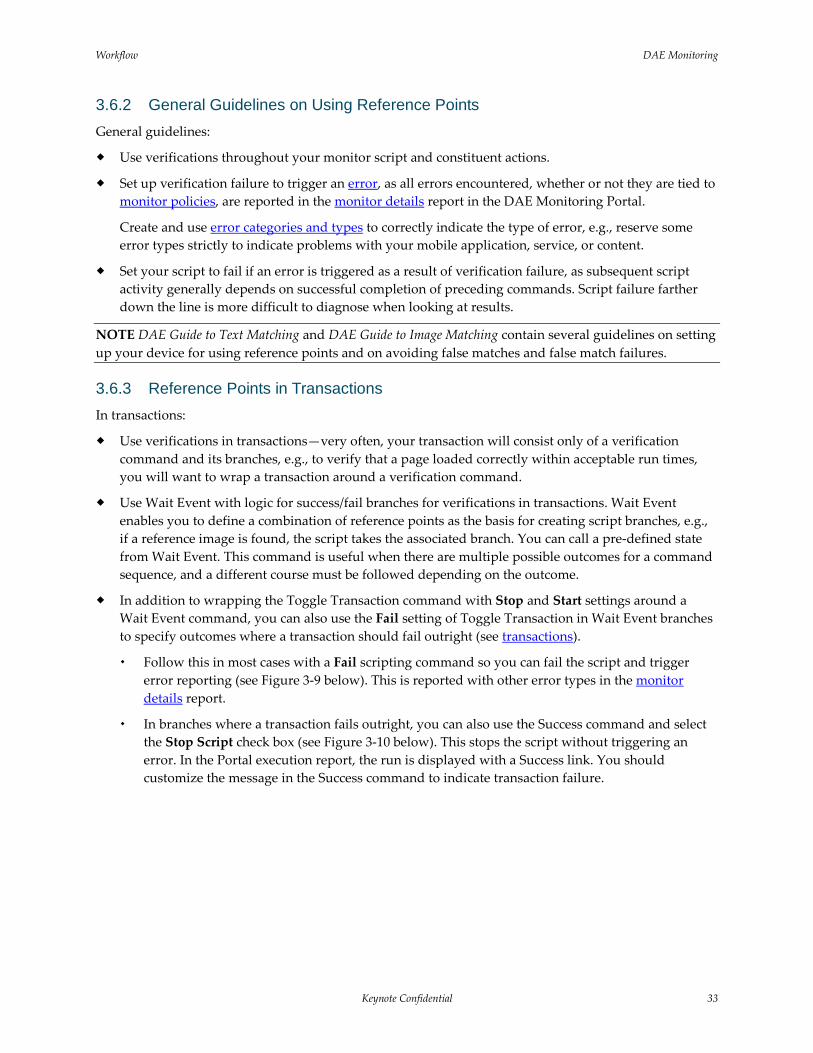
Follow this in most cases with a Fail scripting command so you can fail the script and trigger error reporting (see Figure 3-9 below). This is reported with other error types in the monitor details report.
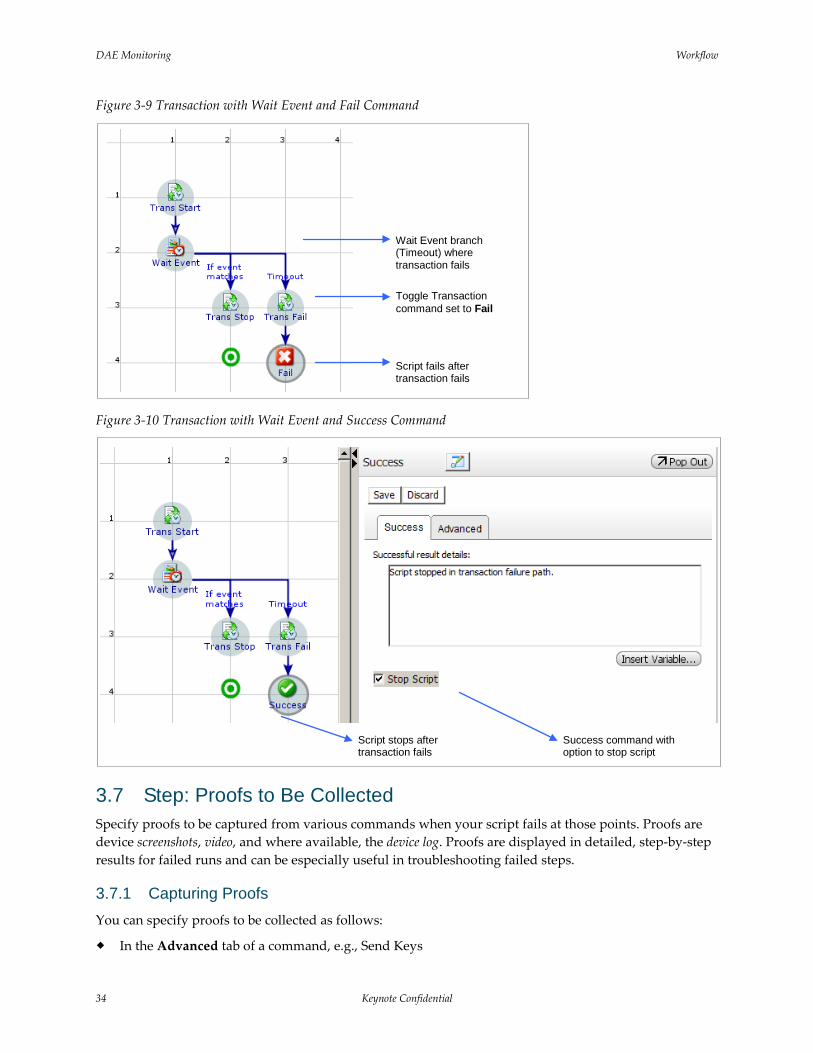
In branches where a transaction fails outright, you can also use the Success command and select the Stop Script check box (see Figure 3-10 below). This stops the script without triggering an error. In the Portal execution report, the run is displayed with a Success link. You should customize the message in the Success command to indicate transaction failure.
DAE Monitoring Workflow
34 Keynote Confidential
Figure 3-9 Transaction with Wait Event and Fail Command
Figure 3-10 Transaction with Wait Event and Success Command
3.7 Step: Proofs to Be Collected Specify proofs to be captured from various commands when your script fails at those points. Proofs are device screenshots, video, and where available, the device log. Proofs are displayed in detailed, step-by-step results for failed runs and can be especially useful in troubleshooting failed steps.
3.7.1 Capturing Proofs You can specify proofs to be collected as follows:
In the Advanced tab of a command, e.g., Send Keys
Script stops after transaction fails
Success command with option to stop script
Wait Event branch (Timeout) where transaction fails
Script fails after transaction fails
Toggle Transaction command set to Fail
Workflow DAE Monitoring
Keynote Confidential 35
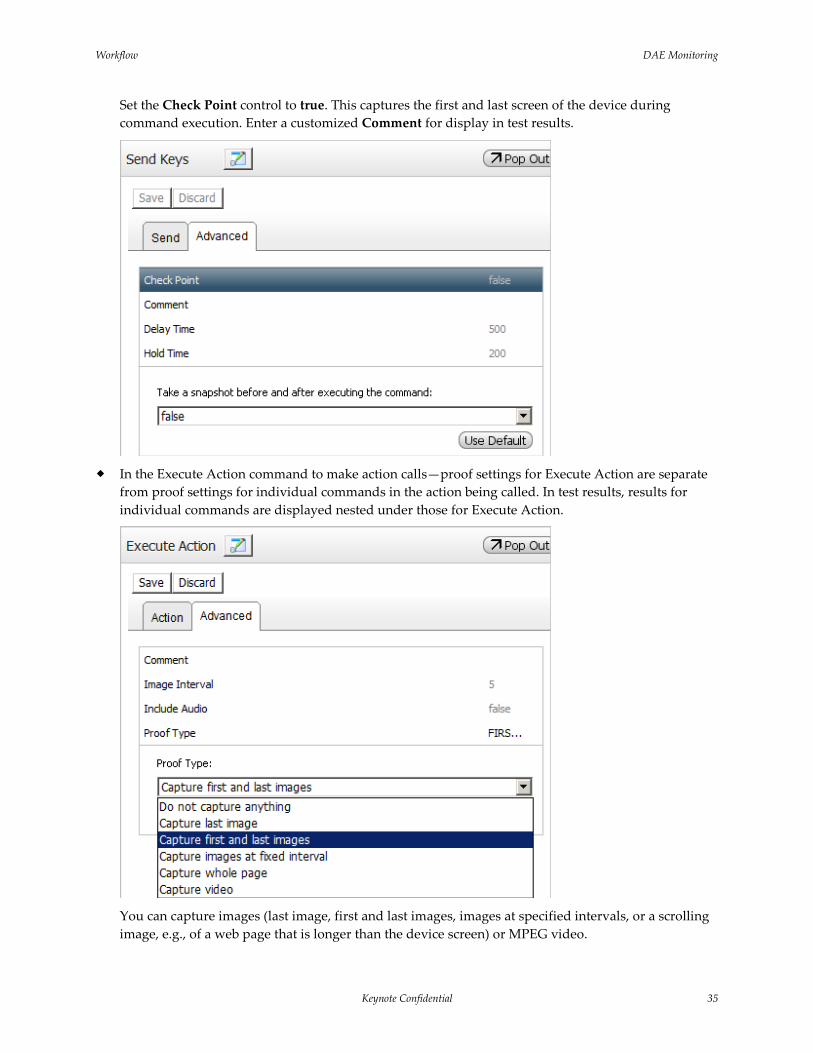
Set the Check Point control to true. This captures the first and last screen of the device during command execution. Enter a customized Comment for display in test results.
In the Execute Action command to make action calls—proof settings for Execute Action are separate
from proof settings for individual commands in the action being called. In test results, results for individual commands are displayed nested under those for Execute Action.
You can capture images (last image, first and last images, images at specified intervals, or a scrolling image, e.g., of a web page that is longer than the device screen) or MPEG video.
DAE Monitoring Workflow
36 Keynote Confidential
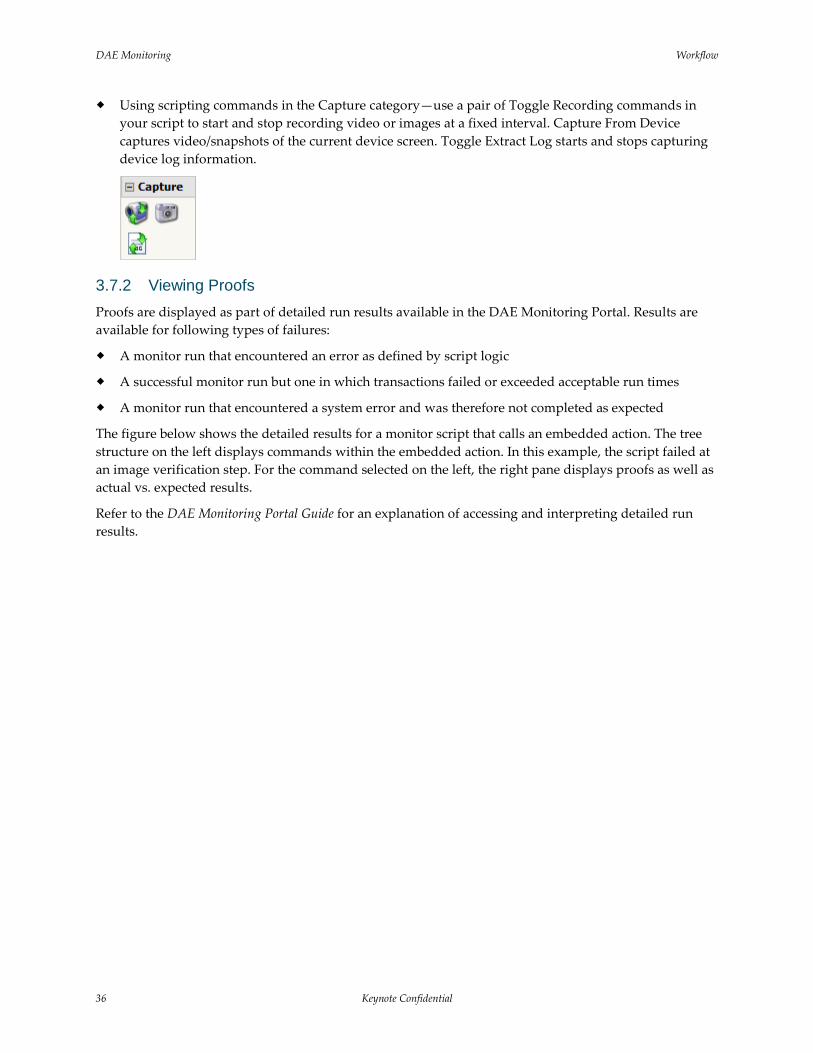
Using scripting commands in the Capture category—use a pair of Toggle Recording commands in your script to start and stop recording video or images at a fixed interval. Capture From Device captures video/snapshots of the current device screen. Toggle Extract Log starts and stops capturing device log information.
3.7.2 Viewing Proofs Proofs are displayed as part of detailed run results available in the DAE Monitoring Portal. Results are available for following types of failures:
A monitor run that encountered an error as defined by script logic
A successful monitor run but one in which transactions failed or exceeded acceptable run times
A monitor run that encountered a system error and was therefore not completed as expected
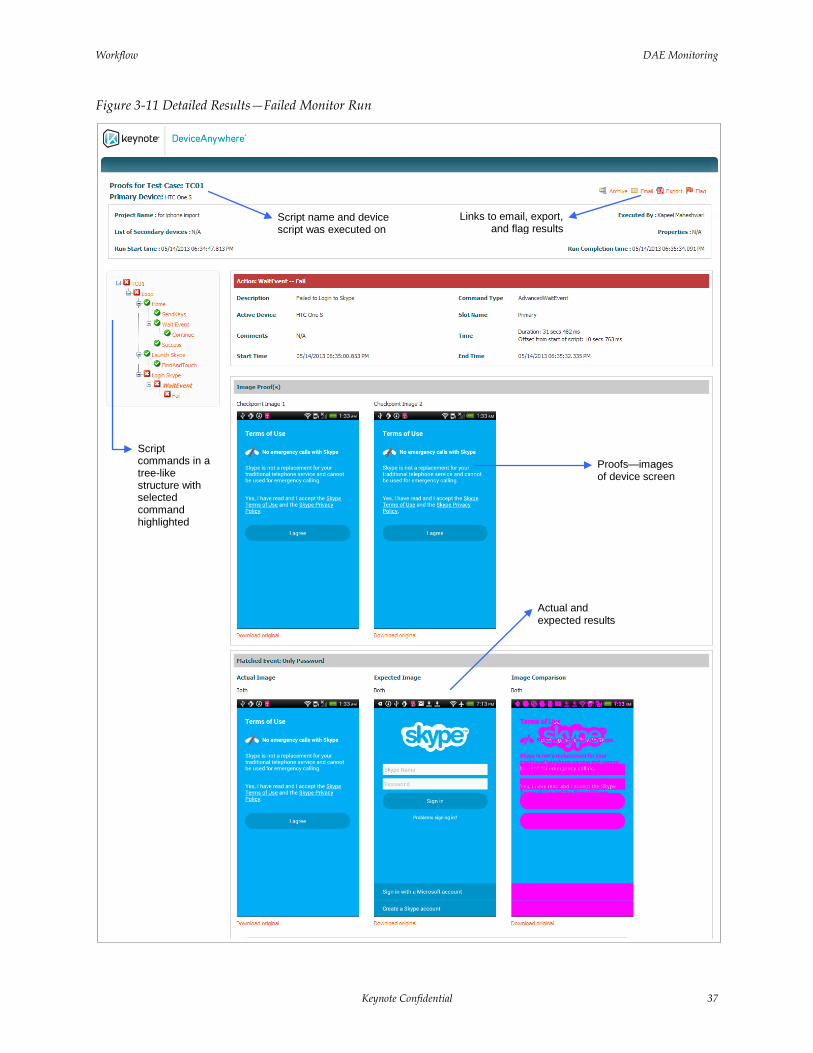
The figure below shows the detailed results for a monitor script that calls an embedded action. The tree structure on the left displays commands within the embedded action. In this example, the script failed at an image verification step. For the command selected on the left, the right pane displays proofs as well as actual vs. expected results.
Refer to the DAE Monitoring Portal Guide for an explanation of accessing and interpreting detailed run results.
Workflow DAE Monitoring
Keynote Confidential 37
Figure 3-11 Detailed Results—Failed Monitor Run
Proofs—images of device screen
Script name and device script was executed on
Links to email, export, and flag results
Actual and expected results
Script commands in a tree-like structure with selected command highlighted
DAE Monitoring Workflow
38 Keynote Confidential
3.8 Step: Test Case An end-to-end monitoring scenario consists of a test case composed of action and state calls with additional commands for script logic. For example, a test case might consist of viewing and deleting call records from a device or getting the weather report for a specified zip code from a website.
A test case script is valid for all project devices—test cases do not have device-specific implementations. However, you can create test case scripts for multiple-device scenarios, e.g., to send and receive a text message from one device to another.
3.8.1 Creating a Test Case Use any of these methods to create a test case from the Scripting tab of the Monitoring view:
Right-click your project test cases folder (or sub-folder) and select New Test Case.
While in your project, select File > New > Test Case.
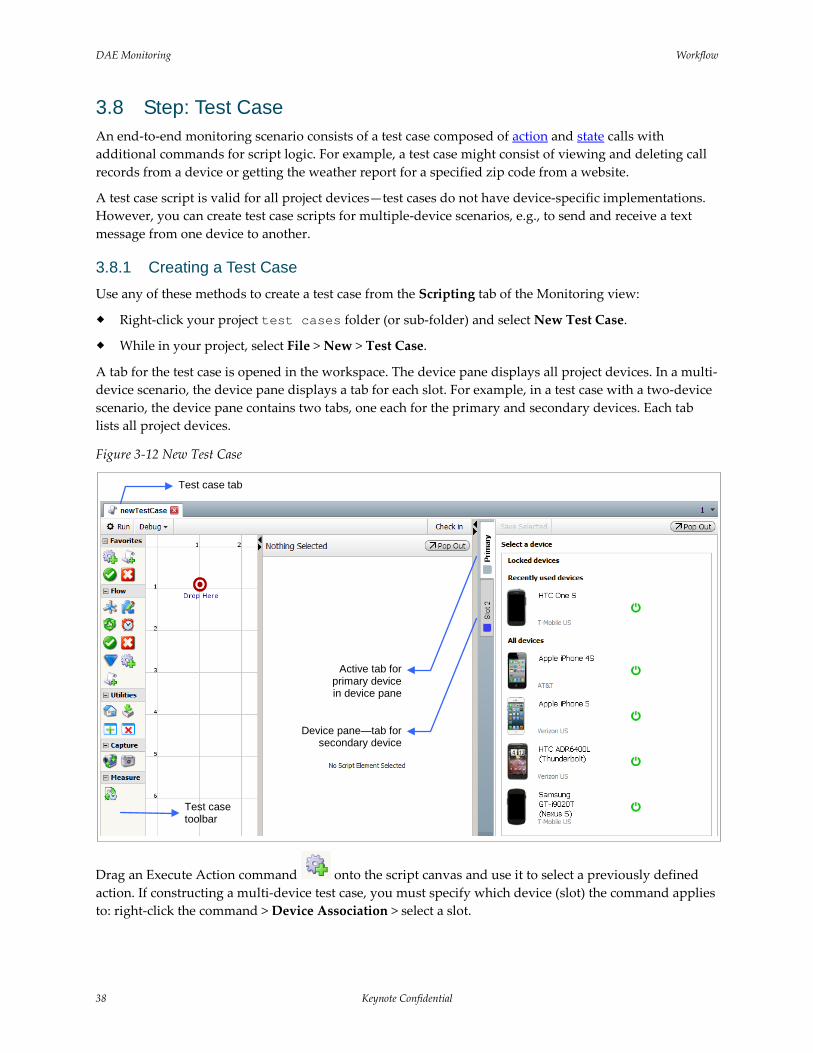
A tab for the test case is opened in the workspace. The device pane displays all project devices. In a multi-device scenario, the device pane displays a tab for each slot. For example, in a test case with a two-device scenario, the device pane contains two tabs, one each for the primary and secondary devices. Each tab lists all project devices.
Figure 3-12 New Test Case
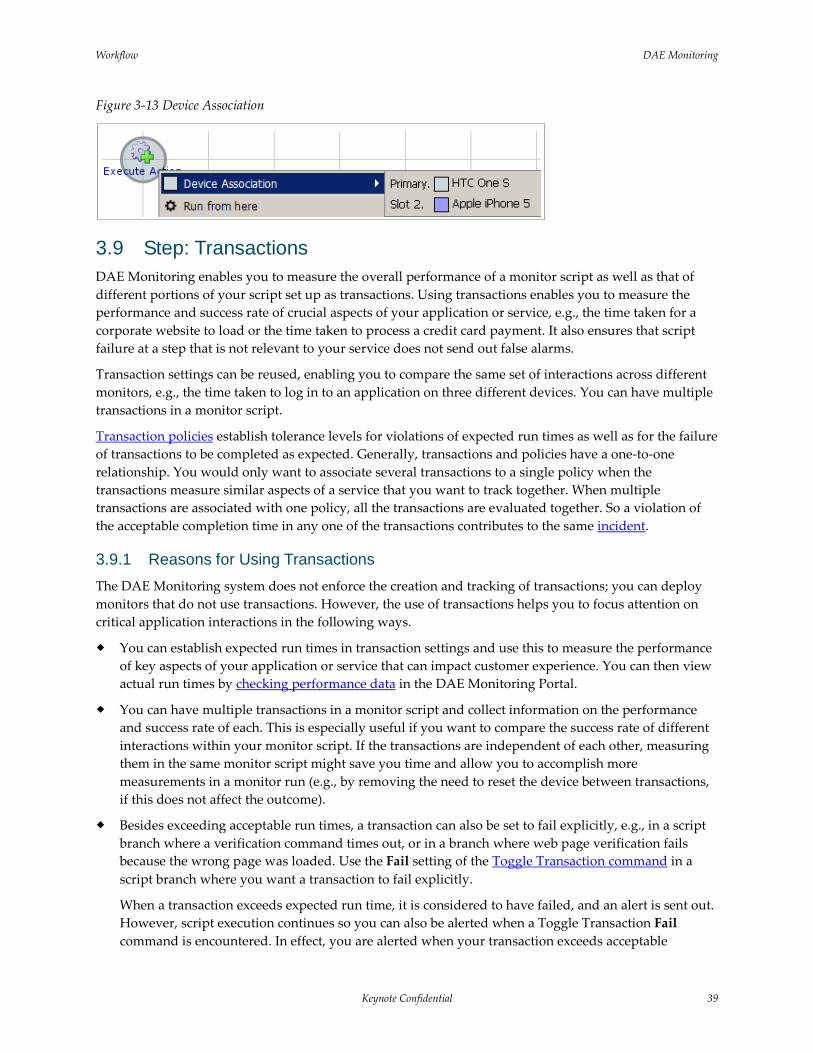
Drag an Execute Action command onto the script canvas and use it to select a previously defined action. If constructing a multi-device test case, you must specify which device (slot) the command applies to: right-click the command > Device Association > select a slot.
Test case tab
Active tab for primary device in device pane
Device pane—tab for secondary device
Test case toolbar
Workflow DAE Monitoring
Keynote Confidential 39
Figure 3-13 Device Association
3.9 Step: Transactions DAE Monitoring enables you to measure the overall performance of a monitor script as well as that of different portions of your script set up as transactions. Using transactions enables you to measure the performance and success rate of crucial aspects of your application or service, e.g., the time taken for a corporate website to load or the time taken to process a credit card payment. It also ensures that script failure at a step that is not relevant to your service does not send out false alarms.
Transaction settings can be reused, enabling you to compare the same set of interactions across different monitors, e.g., the time taken to log in to an application on three different devices. You can have multiple transactions in a monitor script.
Transaction policies establish tolerance levels for violations of expected run times as well as for the failure of transactions to be completed as expected. Generally, transactions and policies have a one-to-one relationship. You would only want to associate several transactions to a single policy when the transactions measure similar aspects of a service that you want to track together. When multiple transactions are associated with one policy, all the transactions are evaluated together. So a violation of the acceptable completion time in any one of the transactions contributes to the same incident.
3.9.1 Reasons for Using Transactions The DAE Monitoring system does not enforce the creation and tracking of transactions; you can deploy monitors that do not use transactions. However, the use of transactions helps you to focus attention on critical application interactions in the following ways.
You can establish expected run times in transaction settings and use this to measure the performance of key aspects of your application or service that can impact customer experience. You can then view actual run times by checking performance data in the DAE Monitoring Portal.
You can have multiple transactions in a monitor script and collect information on the performance and success rate of each. This is especially useful if you want to compare the success rate of different interactions within your monitor script. If the transactions are independent of each other, measuring them in the same monitor script might save you time and allow you to accomplish more measurements in a monitor run (e.g., by removing the need to reset the device between transactions, if this does not affect the outcome).
Besides exceeding acceptable run times, a transaction can also be set to fail explicitly, e.g., in a script branch where a verification command times out, or in a branch where web page verification fails because the wrong page was loaded. Use the Fail setting of the Toggle Transaction command in a script branch where you want a transaction to fail explicitly.
When a transaction exceeds expected run time, it is considered to have failed, and an alert is sent out. However, script execution continues so you can also be alerted when a Toggle Transaction Fail command is encountered. In effect, you are alerted when your transaction exceeds acceptable
DAE Monitoring Workflow
40 Keynote Confidential
performance, but can also see whether it ultimately times out or fails explicitly. For example, when you measure the performance of your website, you might want to know (through an alert) if after 10 seconds, it ultimately timed out at 20 seconds or if it failed to load entirely, say with a 404 error.
By setting up transaction policies that are separate from monitor polices, you can separate the concepts of monitor failure (failure of the script or device) from a transaction failure (issue with your service). That way, script failure at a step that is not relevant to your service does not send out false alarms. You can separately route alerts for service issues and other script issues not directly related to your application or content. For example, you may send transaction alerts to your operations team but a monitor alert to the team that manages the DAE Monitoring deployment. (If Keynote is managing your DAE Monitoring environment, all monitor alerts would be routed to Keynote support.)
Transactions are also tracked independently in the DAE Monitoring Portal, and you can find both device-independent and device-specific metrics on transaction performance (completion time) and availability (success vs. failure).
3.9.2 What Transactions Consist Of Transactions are used to delimit command sequences for key interactions with your application, e.g., the time taken to load a web page, or the time taken to log in to an application.
You would not set up routine interactions such as resetting a device to the home screen as transactions—the success of failure of these operations have no bearing on the performance of your mobile application or service.
3.9.3 Creating Transactions A transaction is created and implemented in two steps:
Naming and setting up a run time for the transaction in the Scheduling tab
Applying the named transaction to a script sequence using the Toggle Transaction command
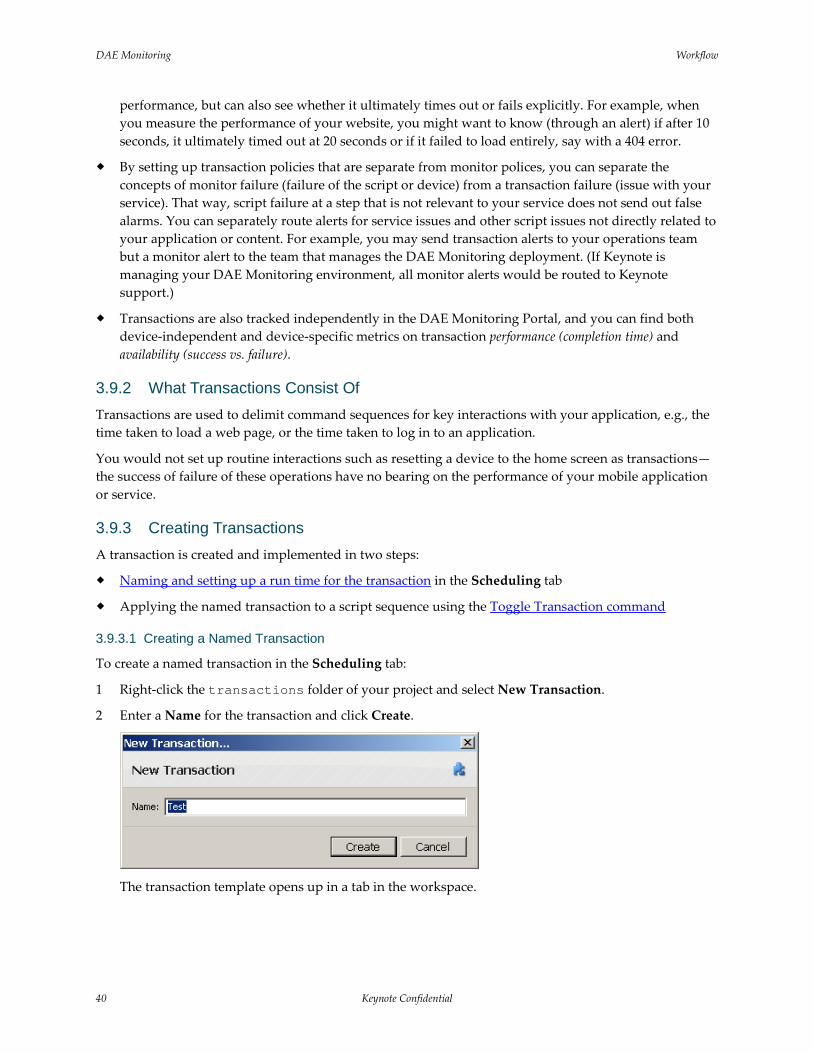
3.9.3.1 Creating a Named Transaction
To create a named transaction in the Scheduling tab:
1 Right-click the transactions folder of your project and select New Transaction.
2 Enter a Name for the transaction and click Create.
The transaction template opens up in a tab in the workspace.
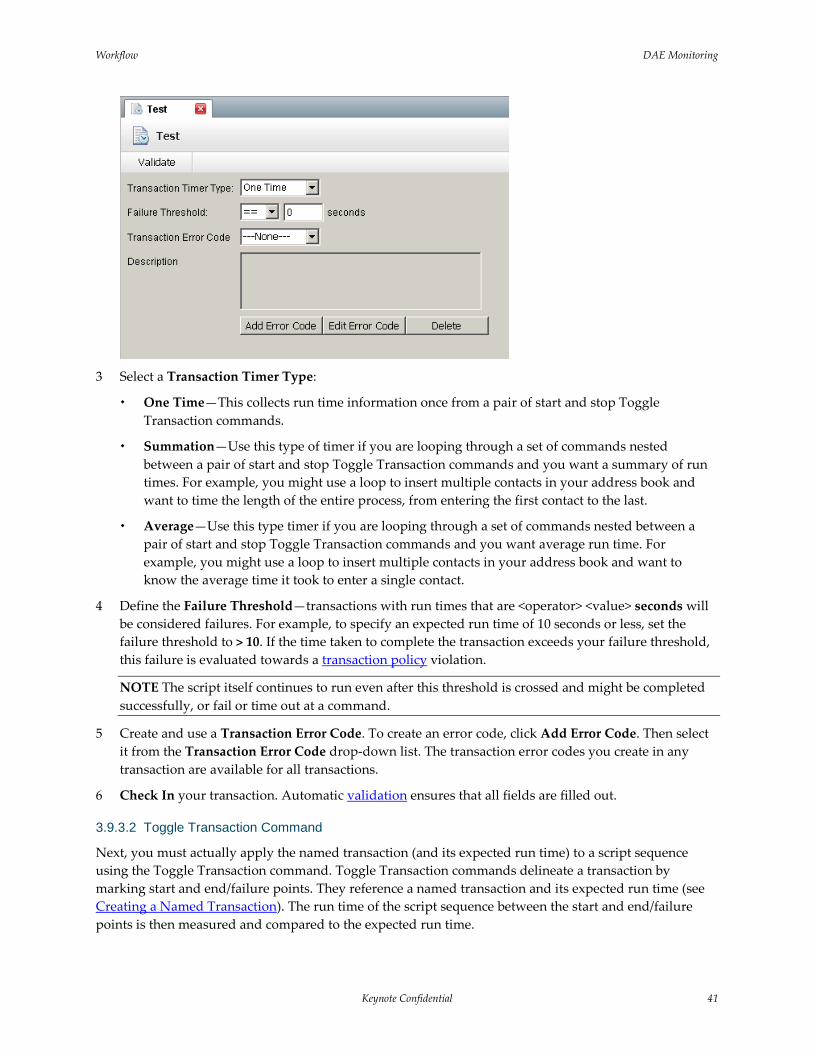
Workflow DAE Monitoring
Keynote Confidential 41
3 Select a Transaction Timer Type:
One Time—This collects run time information once from a pair of start and stop Toggle Transaction commands.
Summation—Use this type of timer if you are looping through a set of commands nested between a pair of start and stop Toggle Transaction commands and you want a summary of run times. For example, you might use a loop to insert multiple contacts in your address book and want to time the length of the entire process, from entering the first contact to the last.
Average—Use this type timer if you are looping through a set of commands nested between a pair of start and stop Toggle Transaction commands and you want average run time. For example, you might use a loop to insert multiple contacts in your address book and want to know the average time it took to enter a single contact.
4 Define the Failure Threshold—transactions with run times that are <operator> <value> seconds will be considered failures. For example, to specify an expected run time of 10 seconds or less, set the failure threshold to > 10. If the time taken to complete the transaction exceeds your failure threshold, this failure is evaluated towards a transaction policy violation.
NOTE The script itself continues to run even after this threshold is crossed and might be completed successfully, or fail or time out at a command.
5 Create and use a Transaction Error Code. To create an error code, click Add Error Code. Then select it from the Transaction Error Code drop-down list. The transaction error codes you create in any transaction are available for all transactions.
6 Check In your transaction. Automatic validation ensures that all fields are filled out.
3.9.3.2 Toggle Transaction Command
Next, you must actually apply the named transaction (and its expected run time) to a script sequence using the Toggle Transaction command. Toggle Transaction commands delineate a transaction by marking start and end/failure points. They reference a named transaction and its expected run time (see Creating a Named Transaction). The run time of the script sequence between the start and end/failure points is then measured and compared to the expected run time.
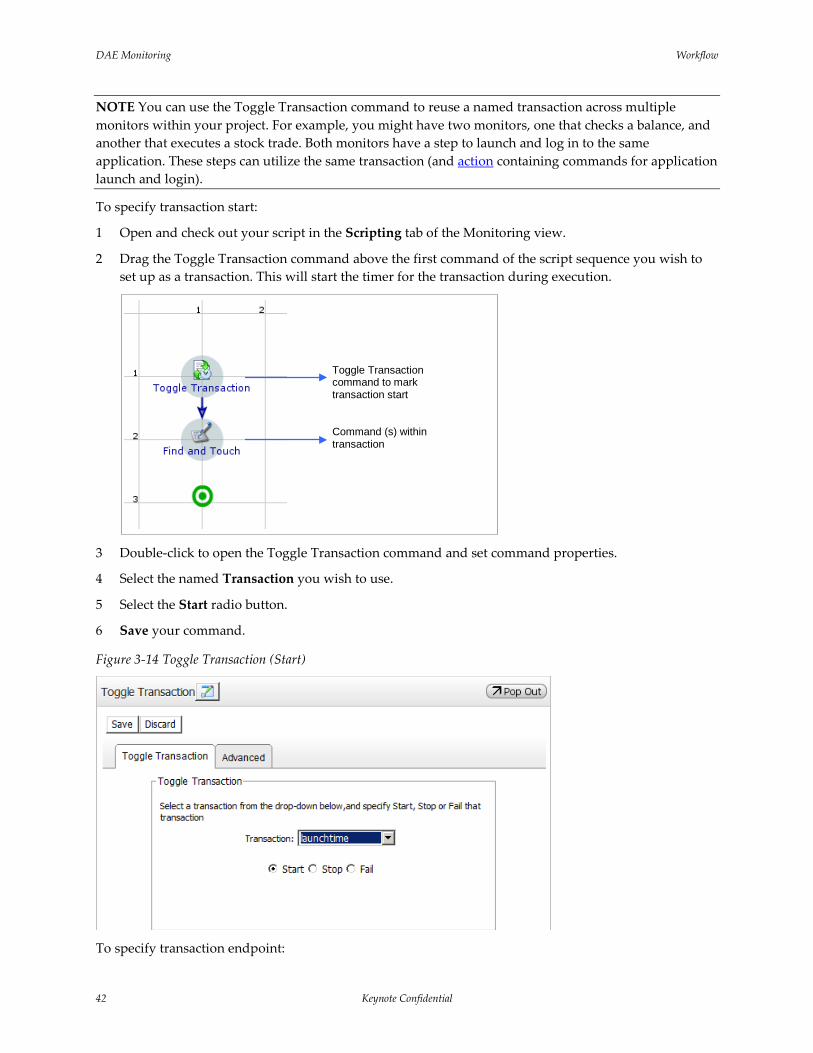
DAE Monitoring Workflow
42 Keynote Confidential
NOTE You can use the Toggle Transaction command to reuse a named transaction across multiple monitors within your project. For example, you might have two monitors, one that checks a balance, and another that executes a stock trade. Both monitors have a step to launch and log in to the same application. These steps can utilize the same transaction (and action containing commands for application launch and login).
To specify transaction start:
1 Open and check out your script in the Scripting tab of the Monitoring view.
2 Drag the Toggle Transaction command above the first command of the script sequence you wish to set up as a transaction. This will start the timer for the transaction during execution.
3 Double-click to open the Toggle Transaction command and set command properties.
4 Select the named Transaction you wish to use.
5 Select the Start radio button.
6 Save your command.
Figure 3-14 Toggle Transaction (Start)
To specify transaction endpoint:
Command (s) within transaction
Toggle Transaction command to mark transaction start
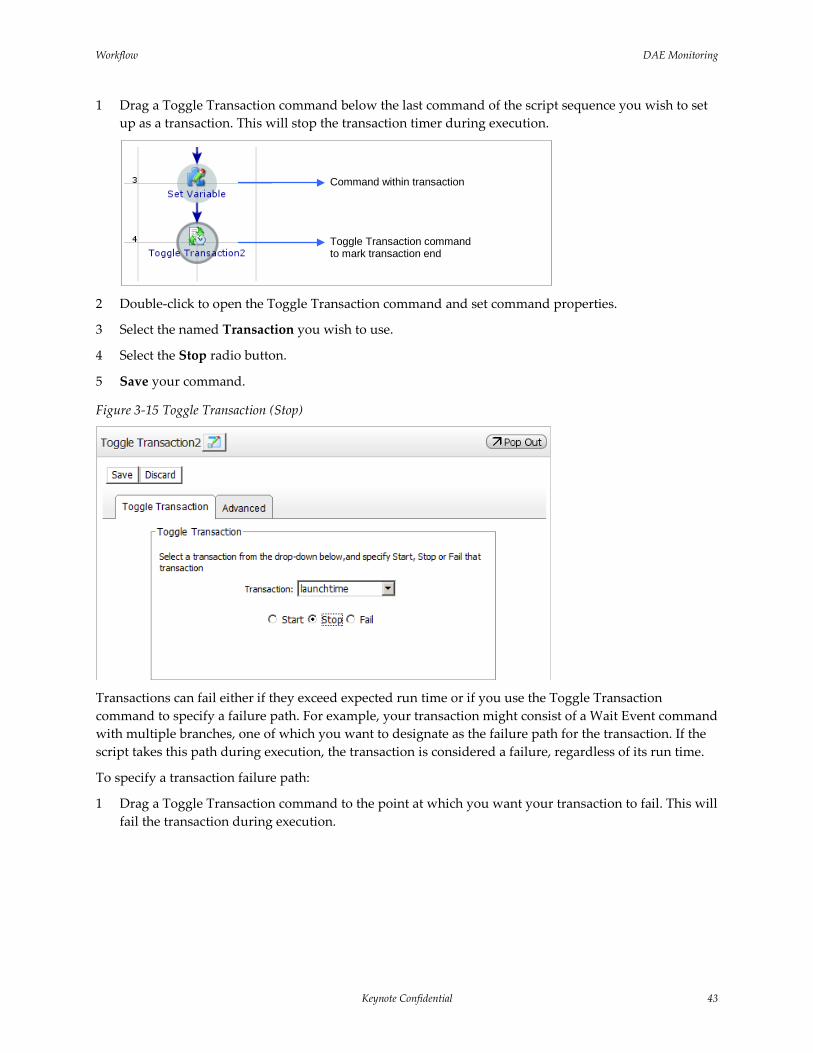
Workflow DAE Monitoring
Keynote Confidential 43
1 Drag a Toggle Transaction command below the last command of the script sequence you wish to set up as a transaction. This will stop the transaction timer during execution.
2 Double-click to open the Toggle Transaction command and set command properties.
3 Select the named Transaction you wish to use.
4 Select the Stop radio button.
5 Save your command.
Figure 3-15 Toggle Transaction (Stop)
Transactions can fail either if they exceed expected run time or if you use the Toggle Transaction command to specify a failure path. For example, your transaction might consist of a Wait Event command with multiple branches, one of which you want to designate as the failure path for the transaction. If the script takes this path during execution, the transaction is considered a failure, regardless of its run time.
To specify a transaction failure path:
1 Drag a Toggle Transaction command to the point at which you want your transaction to fail. This will fail the transaction during execution.
Command within transaction
Toggle Transaction command to mark transaction end
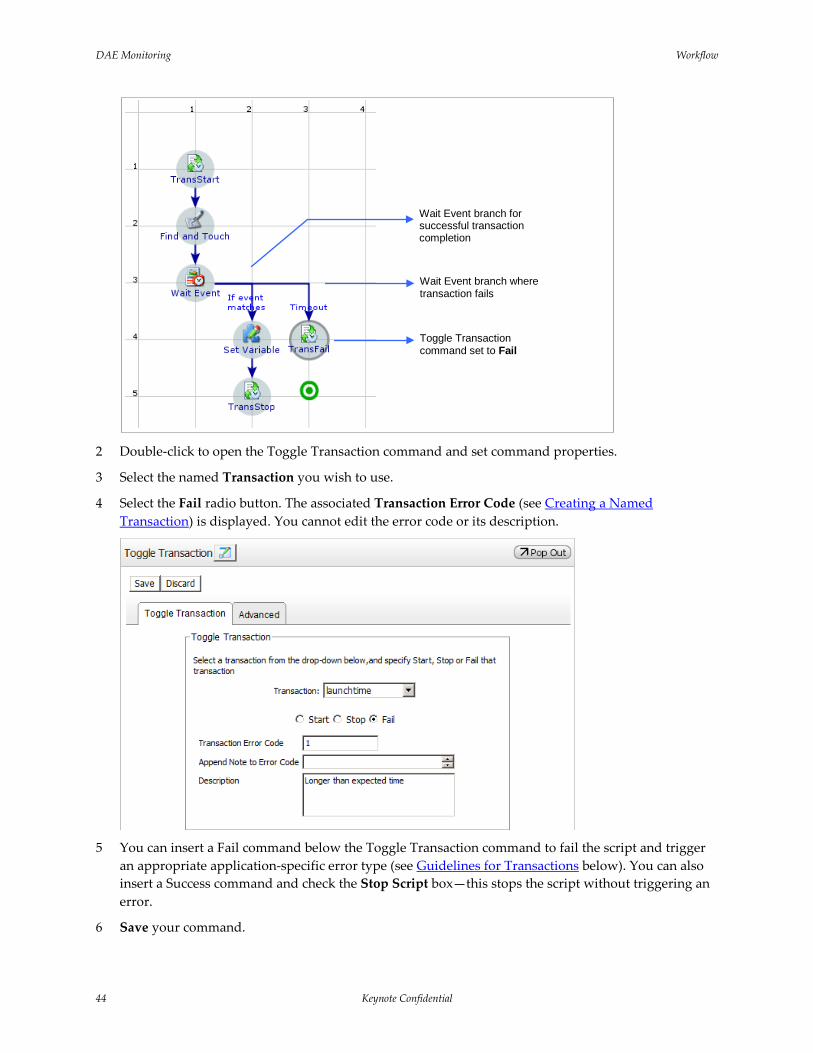
DAE Monitoring Workflow
44 Keynote Confidential
2 Double-click to open the Toggle Transaction command and set command properties.
3 Select the named Transaction you wish to use.
4 Select the Fail radio button. The associated Transaction Error Code (see Creating a Named Transaction) is displayed. You cannot edit the error code or its description.
5 You can insert a Fail command below the Toggle Transaction command to fail the script and trigger
an appropriate application-specific error type (see Guidelines for Transactions below). You can also insert a Success command and check the Stop Script box—this stops the script without triggering an error.
6 Save your command.
Toggle Transaction command set to Fail
Wait Event branch for successful transaction completion
Wait Event branch where transaction fails
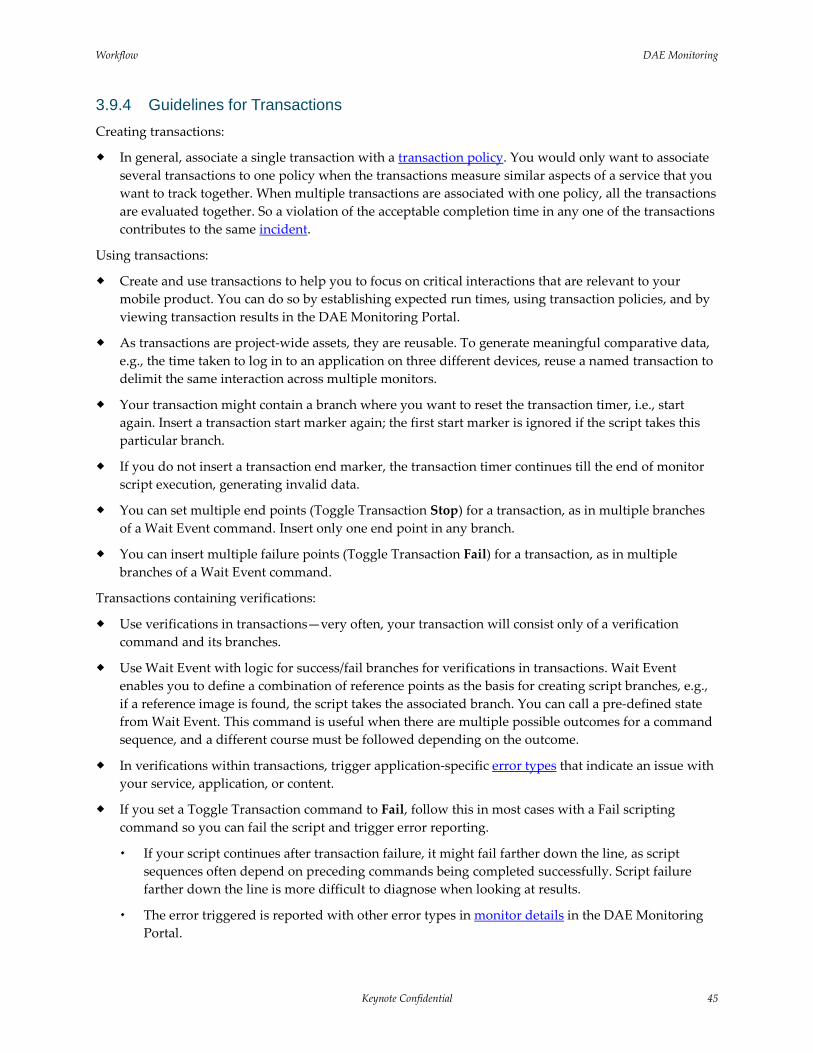
Workflow DAE Monitoring
Keynote Confidential 45
3.9.4 Guidelines for Transactions Creating transactions:
In general, associate a single transaction with a transaction policy. You would only want to associate several transactions to one policy when the transactions measure similar aspects of a service that you want to track together. When multiple transactions are associated with one policy, all the transactions are evaluated together. So a violation of the acceptable completion time in any one of the transactions contributes to the same incident.
Using transactions:
Create and use transactions to help you to focus on critical interactions that are relevant to your mobile product. You can do so by establishing expected run times, using transaction policies, and by viewing transaction results in the DAE Monitoring Portal.
As transactions are project-wide assets, they are reusable. To generate meaningful comparative data, e.g., the time taken to log in to an application on three different devices, reuse a named transaction to delimit the same interaction across multiple monitors.
Your transaction might contain a branch where you want to reset the transaction timer, i.e., start again. Insert a transaction start marker again; the first start marker is ignored if the script takes this particular branch.
If you do not insert a transaction end marker, the transaction timer continues till the end of monitor script execution, generating invalid data.
You can set multiple end points (Toggle Transaction Stop) for a transaction, as in multiple branches of a Wait Event command. Insert only one end point in any branch.
You can insert multiple failure points (Toggle Transaction Fail) for a transaction, as in multiple branches of a Wait Event command.
Transactions containing verifications:
Use verifications in transactions—very often, your transaction will consist only of a verification command and its branches.
Use Wait Event with logic for success/fail branches for verifications in transactions. Wait Event enables you to define a combination of reference points as the basis for creating script branches, e.g., if a reference image is found, the script takes the associated branch. You can call a pre-defined state from Wait Event. This command is useful when there are multiple possible outcomes for a command sequence, and a different course must be followed depending on the outcome.
In verifications within transactions, trigger application-specific error types that indicate an issue with your service, application, or content.
If you set a Toggle Transaction command to Fail, follow this in most cases with a Fail scripting command so you can fail the script and trigger error reporting.
If your script continues after transaction failure, it might fail farther down the line, as script sequences often depend on preceding commands being completed successfully. Script failure farther down the line is more difficult to diagnose when looking at results.
The error triggered is reported with other error types in monitor details in the DAE Monitoring Portal.
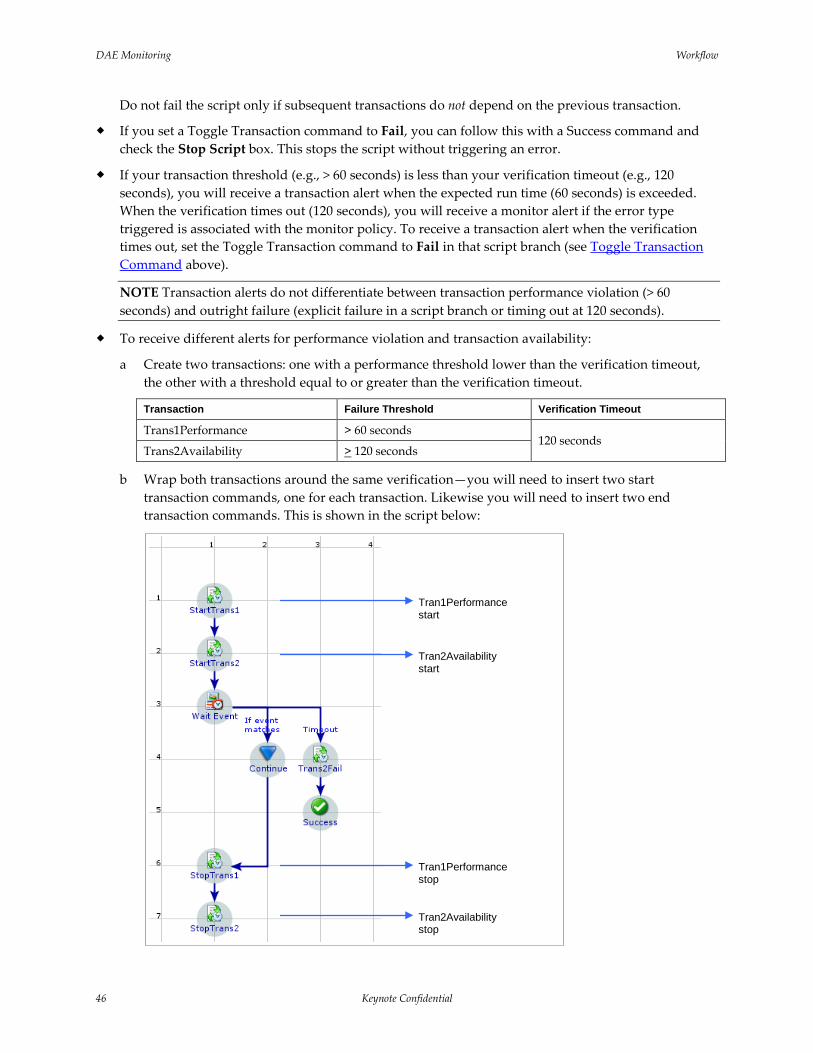
DAE Monitoring Workflow
46 Keynote Confidential
Do not fail the script only if subsequent transactions do not depend on the previous transaction.
If you set a Toggle Transaction command to Fail, you can follow this with a Success command and check the Stop Script box. This stops the script without triggering an error.
If your transaction threshold (e.g., > 60 seconds) is less than your verification timeout (e.g., 120 seconds), you will receive a transaction alert when the expected run time (60 seconds) is exceeded. When the verification times out (120 seconds), you will receive a monitor alert if the error type triggered is associated with the monitor policy. To receive a transaction alert when the verification times out, set the Toggle Transaction command to Fail in that script branch (see Toggle Transaction Command above).
NOTE Transaction alerts do not differentiate between transaction performance violation (> 60 seconds) and outright failure (explicit failure in a script branch or timing out at 120 seconds).
To receive different alerts for performance violation and transaction availability:
a Create two transactions: one with a performance threshold lower than the verification timeout, the other with a threshold equal to or greater than the verification timeout.
Transaction Failure Threshold Verification Timeout
Trans1Performance > 60 seconds 120 seconds
Trans2Availability > 120 seconds
b Wrap both transactions around the same verification—you will need to insert two start transaction commands, one for each transaction. Likewise you will need to insert two end transaction commands. This is shown in the script below:
Tran1Performance start
Tran2Availability start
Tran1Performance stop
Tran2Availability stop
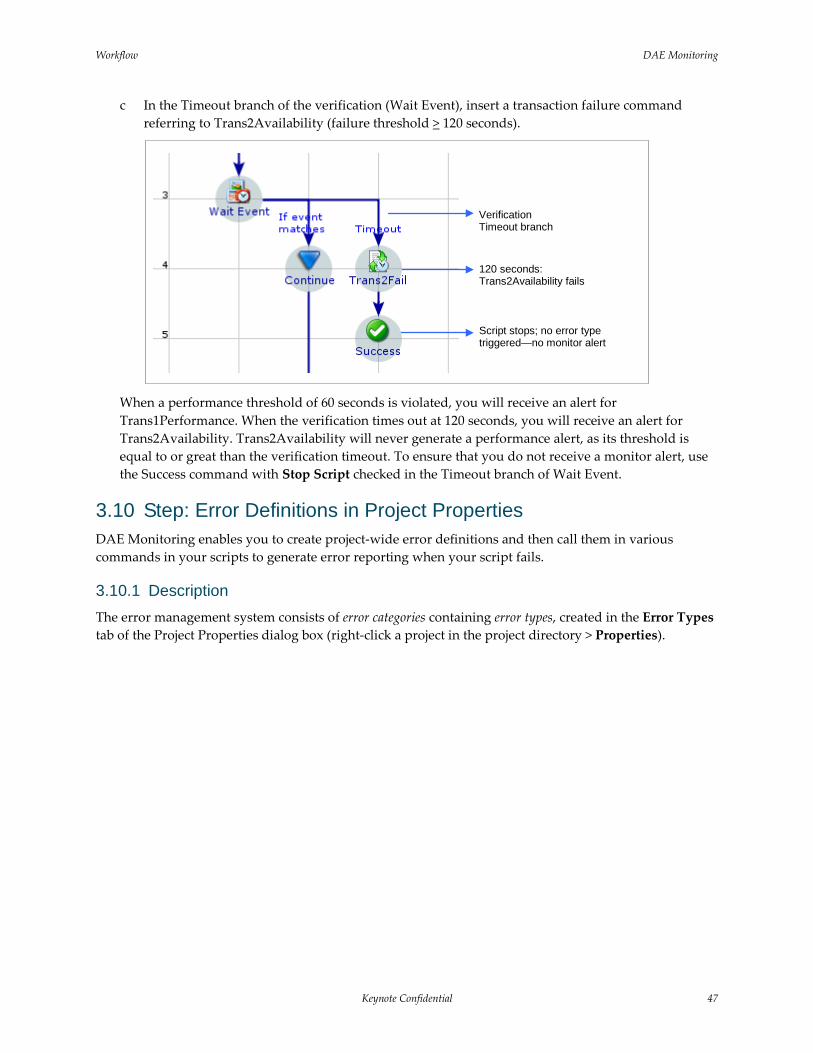
Workflow DAE Monitoring
Keynote Confidential 47
c In the Timeout branch of the verification (Wait Event), insert a transaction failure command referring to Trans2Availability (failure threshold > 120 seconds).
When a performance threshold of 60 seconds is violated, you will receive an alert for Trans1Performance. When the verification times out at 120 seconds, you will receive an alert for Trans2Availability. Trans2Availability will never generate a performance alert, as its threshold is equal to or great than the verification timeout. To ensure that you do not receive a monitor alert, use the Success command with Stop Script checked in the Timeout branch of Wait Event.
3.10 Step: Error Definitions in Project Properties DAE Monitoring enables you to create project-wide error definitions and then call them in various commands in your scripts to generate error reporting when your script fails.
3.10.1 Description The error management system consists of error categories containing error types, created in the Error Types tab of the Project Properties dialog box (right-click a project in the project directory > Properties).
Verification Timeout branch
120 seconds: Trans2Availability fails
Script stops; no error type triggered—no monitor alert
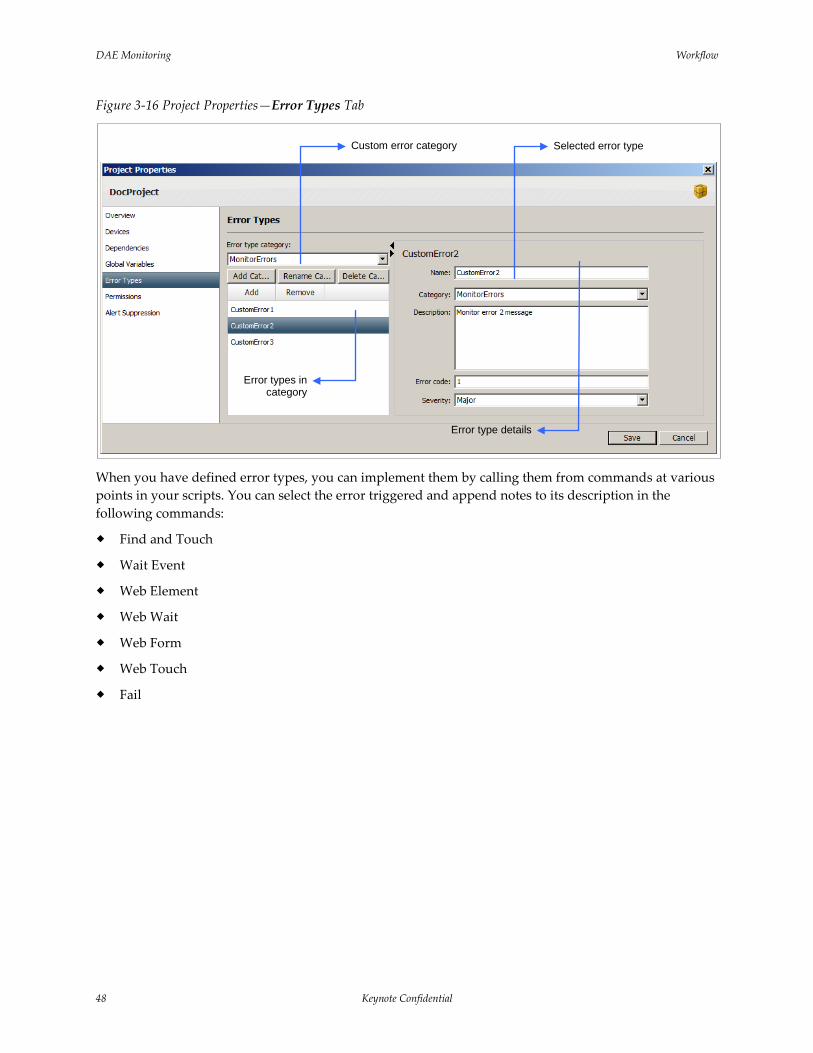
DAE Monitoring Workflow
48 Keynote Confidential
Figure 3-16 Project Properties—Error Types Tab
When you have defined error types, you can implement them by calling them from commands at various points in your scripts. You can select the error triggered and append notes to its description in the following commands:
Find and Touch
Wait Event
Web Element
Web Wait
Web Form
Web Touch
Fail
Error type details
Error types in category
Custom error category Selected error type
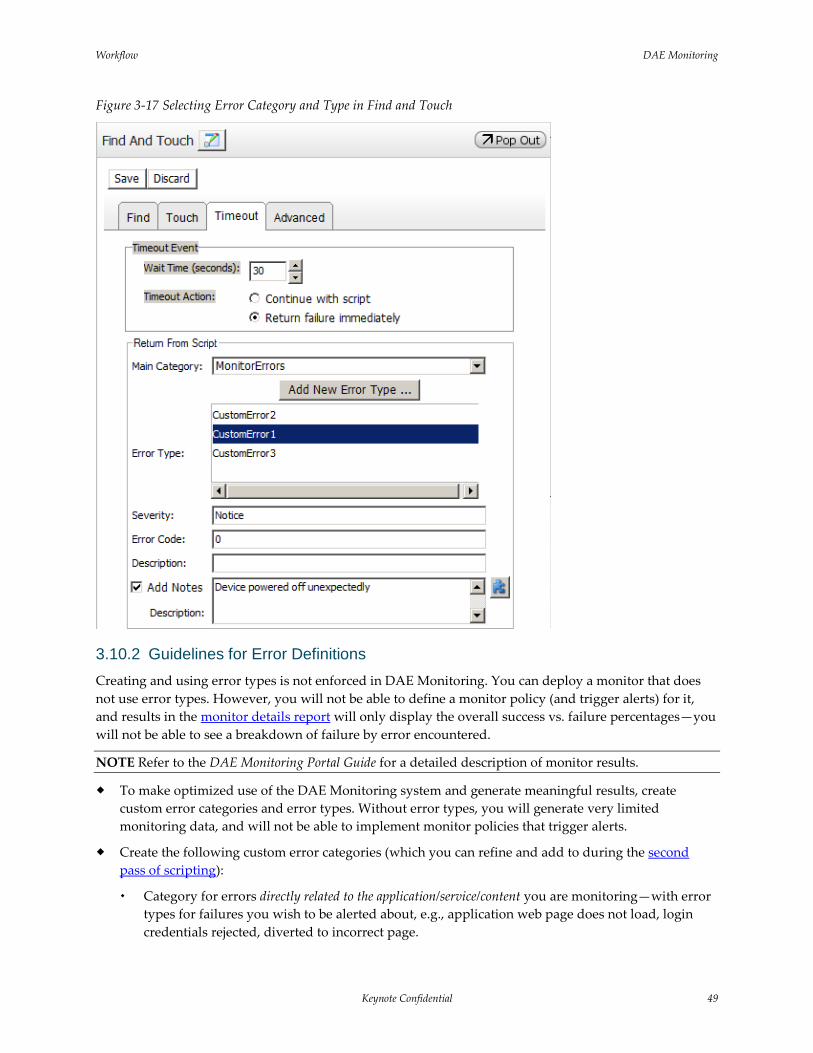
Workflow DAE Monitoring
Keynote Confidential 49
Figure 3-17 Selecting Error Category and Type in Find and Touch
3.10.2 Guidelines for Error Definitions Creating and using error types is not enforced in DAE Monitoring. You can deploy a monitor that does not use error types. However, you will not be able to define a monitor policy (and trigger alerts) for it, and results in the monitor details report will only display the overall success vs. failure percentages—you will not be able to see a breakdown of failure by error encountered.
NOTE Refer to the DAE Monitoring Portal Guide for a detailed description of monitor results.
To make optimized use of the DAE Monitoring system and generate meaningful results, create custom error categories and error types. Without error types, you will generate very limited monitoring data, and will not be able to implement monitor policies that trigger alerts.
Create the following custom error categories (which you can refine and add to during the second pass of scripting):
Category for errors directly related to the application/service/content you are monitoring—with error types for failures you wish to be alerted about, e.g., application web page does not load, login credentials rejected, diverted to incorrect page.
DAE Monitoring Workflow
50 Keynote Confidential
Category for errors in the general monitor scenario—this covers errors not directly related to your application or service and possibly contains error types for device issues (e.g., application is not installed, screen powered off) or network issues (e.g., unable to connect to Internet).
When implementing error types in your scripts:
Do not use error types in the default DeviceAnywhere error category—these are reserved for automatically generated system errors.
Use an error type at every point in your script where you can do so, e.g., in verifications.
Set your script to fail if an error is triggered, as subsequent interactions are generally dependent on the successful completion of preceding commands. If your script continues after triggering an error, it might fail farther down the line, which is more difficult to diagnose from results.
Use error types to correctly indicate the type of error, i.e., use application-related error types in transactions and at other points to indicate an application problem; use general error types in all other places.
When finalizing monitor policy settings in the second pass of this workflow, associate only those general (non-application) error types that you wish to be alerted on.
NOTES The monitor details report displays all errors encountered, not just those associated with the monitor policy.
You can also create transaction errors when creating a transaction. These errors can be used in transaction alerts.
3.11 Step: Variables Variables allow you to set/store values in your script to be used as the basis for script logic, to specify device input, or to define a string of reference text. Variables can be global or script specific:
Script variables are script specific, i.e., they are not available for use outside the test case or action in which they are created.
Global variables are defined at the project level and can be used in any project script. The value stored in a global variable in one script can be used in another project script that is part of the same run session.
You can create script or global variables that refer to entire data sets instead of a single value. The data set can either be created/entered in DeviceAnywhere Studio or imported in CSV format from an external source.
The Loop command can then be associated with the variable and used to loop iteratively through values from the data set.
NOTES Do not use action or test case parameters in your script, as you can only provide one default value for all scheduled monitor runs—you cannot dynamically update the parameter value for each run. If you need to cycle through a set of values, use a data set with a variable instead.
Refer to the DAE Automation User Guide for detailed information on creating and using variables.
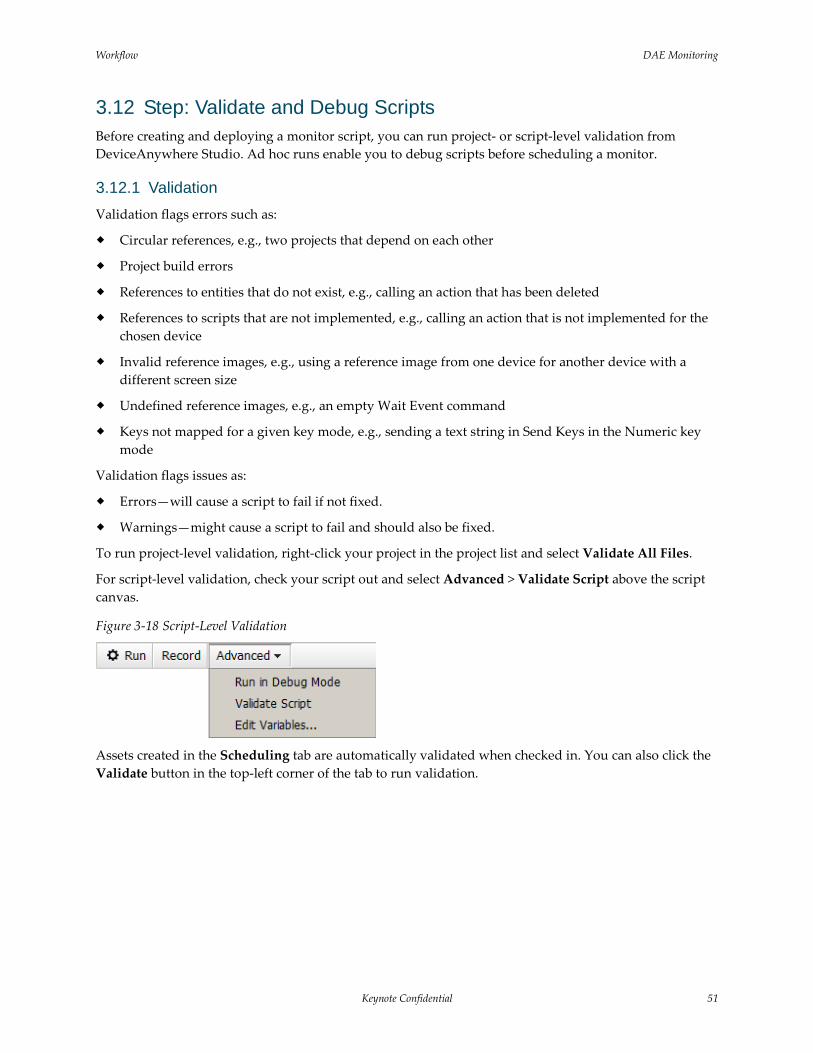
Workflow DAE Monitoring
Keynote Confidential 51
3.12 Step: Validate and Debug Scripts Before creating and deploying a monitor script, you can run project- or script-level validation from DeviceAnywhere Studio. Ad hoc runs enable you to debug scripts before scheduling a monitor.
3.12.1 Validation Validation flags errors such as:
Circular references, e.g., two projects that depend on each other
Project build errors
References to entities that do not exist, e.g., calling an action that has been deleted
References to scripts that are not implemented, e.g., calling an action that is not implemented for the chosen device
Invalid reference images, e.g., using a reference image from one device for another device with a different screen size
Undefined reference images, e.g., an empty Wait Event command
Keys not mapped for a given key mode, e.g., sending a text string in Send Keys in the Numeric key mode
Validation flags issues as:
Errors—will cause a script to fail if not fixed.
Warnings—might cause a script to fail and should also be fixed.
To run project-level validation, right-click your project in the project list and select Validate All Files.
For script-level validation, check your script out and select Advanced > Validate Script above the script canvas.
Figure 3-18 Script-Level Validation
Assets created in the Scheduling tab are automatically validated when checked in. You can also click the Validate button in the top-left corner of the tab to run validation.
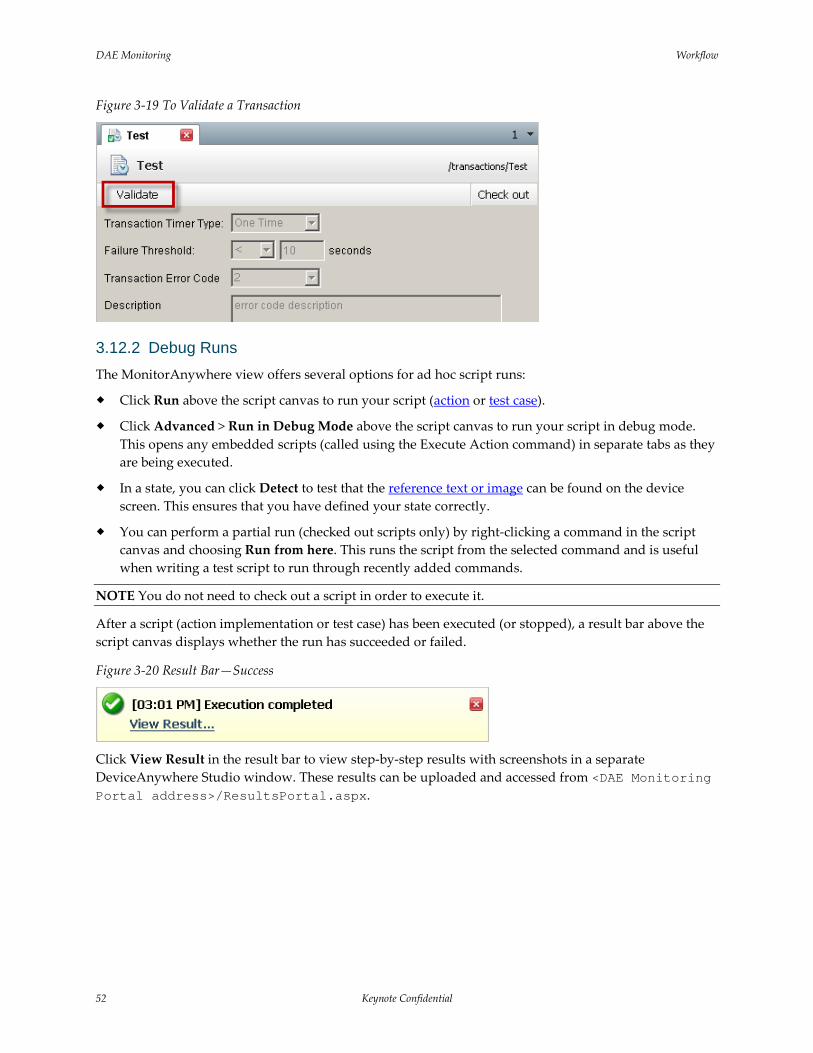
DAE Monitoring Workflow
52 Keynote Confidential
Figure 3-19 To Validate a Transaction
3.12.2 Debug Runs The MonitorAnywhere view offers several options for ad hoc script runs:
Click Run above the script canvas to run your script (action or test case).
Click Advanced > Run in Debug Mode above the script canvas to run your script in debug mode. This opens any embedded scripts (called using the Execute Action command) in separate tabs as they are being executed.
In a state, you can click Detect to test that the reference text or image can be found on the device screen. This ensures that you have defined your state correctly.
You can perform a partial run (checked out scripts only) by right-clicking a command in the script canvas and choosing Run from here. This runs the script from the selected command and is useful when writing a test script to run through recently added commands.
NOTE You do not need to check out a script in order to execute it.
After a script (action implementation or test case) has been executed (or stopped), a result bar above the script canvas displays whether the run has succeeded or failed.
Figure 3-20 Result Bar—Success
Click View Result in the result bar to view step-by-step results with screenshots in a separate DeviceAnywhere Studio window. These results can be uploaded and accessed from <DAE Monitoring Portal address>/ResultsPortal.aspx.
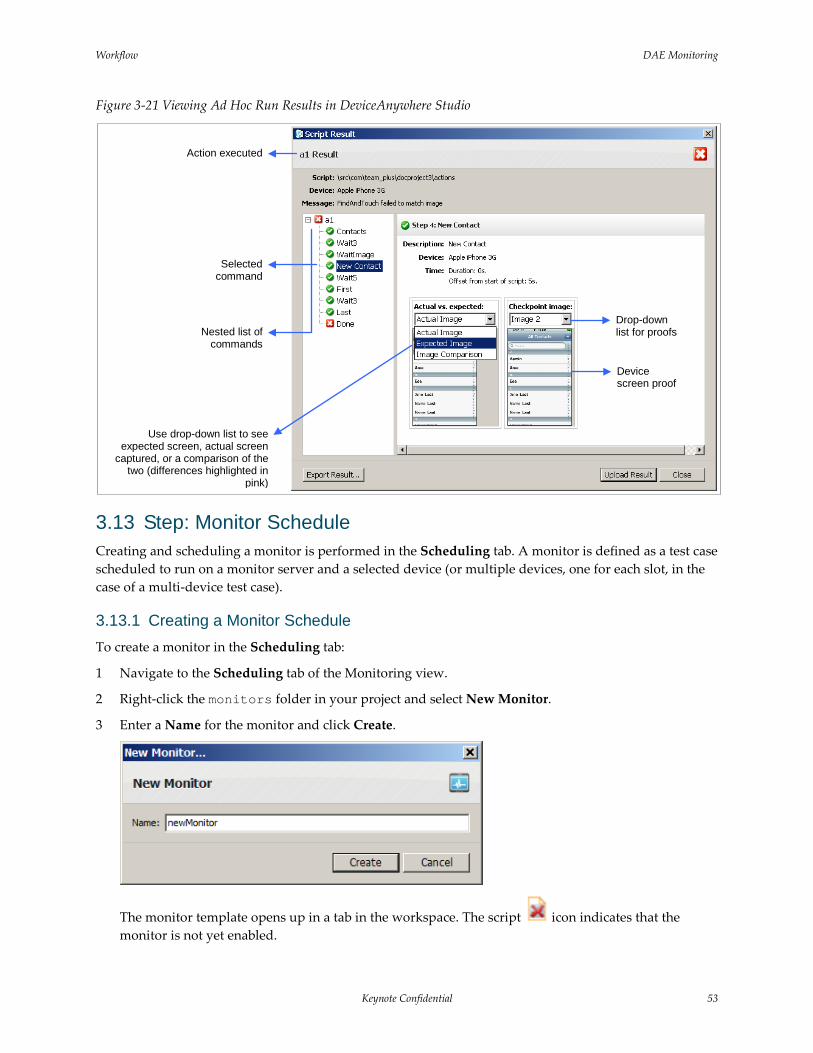
Workflow DAE Monitoring
Keynote Confidential 53
Figure 3-21 Viewing Ad Hoc Run Results in DeviceAnywhere Studio
3.13 Step: Monitor Schedule Creating and scheduling a monitor is performed in the Scheduling tab. A monitor is defined as a test case scheduled to run on a monitor server and a selected device (or multiple devices, one for each slot, in the case of a multi-device test case).
3.13.1 Creating a Monitor Schedule To create a monitor in the Scheduling tab:
1 Navigate to the Scheduling tab of the Monitoring view.
2 Right-click the monitors folder in your project and select New Monitor.
3 Enter a Name for the monitor and click Create.
The monitor template opens up in a tab in the workspace. The script icon indicates that the monitor is not yet enabled.
Selected command
Drop-down list for proofs
Device screen proof
Use drop-down list to see expected screen, actual screen
captured, or a comparison of the two (differences highlighted in
pink)
Action executed
Nested list of commands
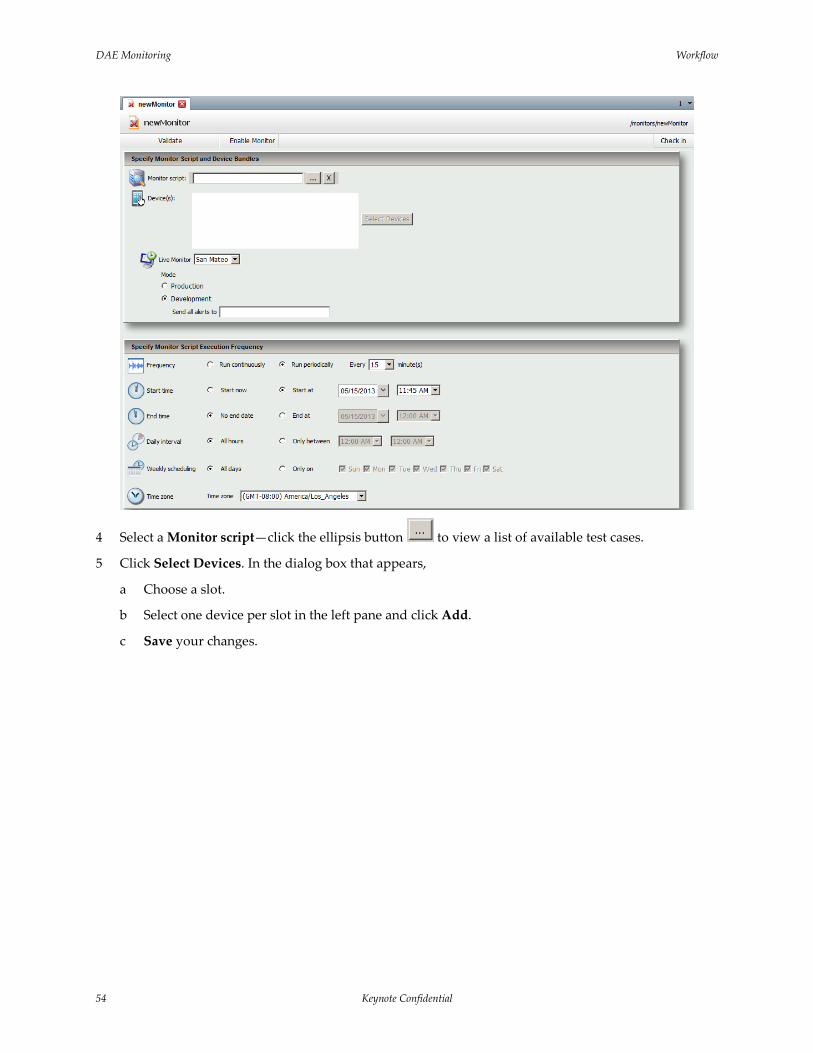
DAE Monitoring Workflow
54 Keynote Confidential
4 Select a Monitor script—click the ellipsis button to view a list of available test cases.
5 Click Select Devices. In the dialog box that appears,
a Choose a slot.
b Select one device per slot in the left pane and click Add.
c Save your changes.
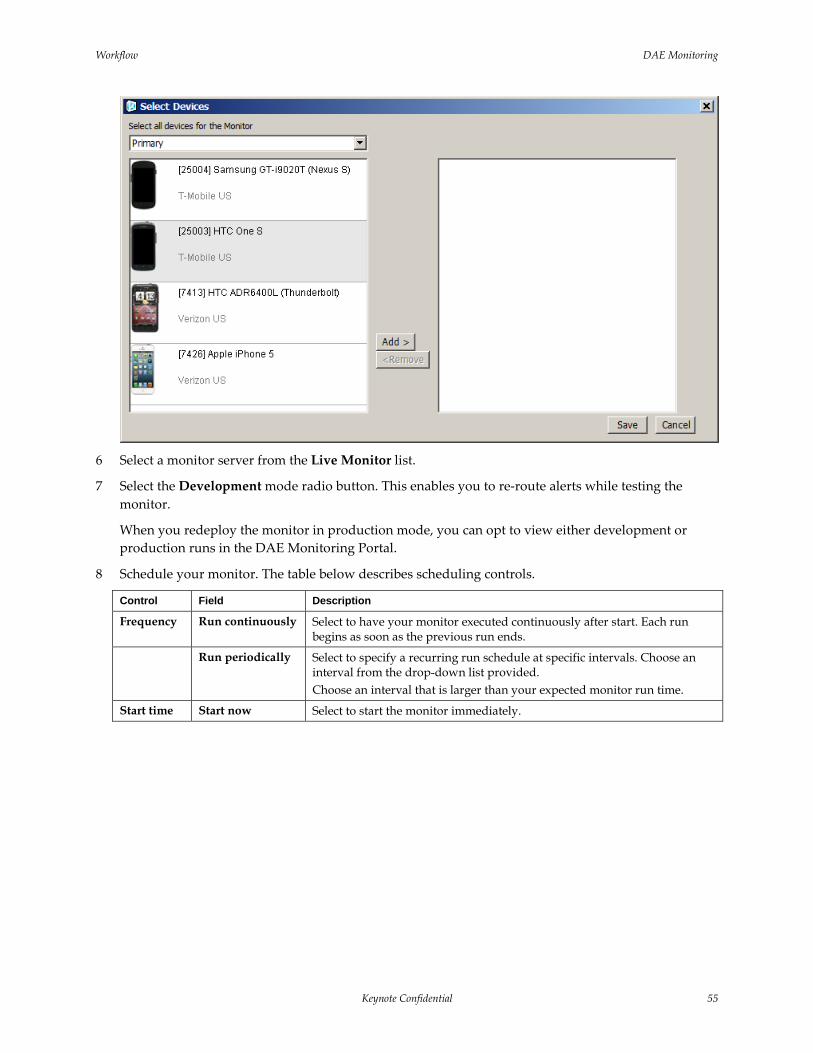
Workflow DAE Monitoring
Keynote Confidential 55
6 Select a monitor server from the Live Monitor list.
7 Select the Development mode radio button. This enables you to re-route alerts while testing the monitor.
When you redeploy the monitor in production mode, you can opt to view either development or production runs in the DAE Monitoring Portal.
8 Schedule your monitor. The table below describes scheduling controls.
Control Field Description
Frequency Run continuously Select to have your monitor executed continuously after start. Each run begins as soon as the previous run ends.
Run periodically Select to specify a recurring run schedule at specific intervals. Choose an interval from the drop-down list provided. Choose an interval that is larger than your expected monitor run time.
Start time Start now Select to start the monitor immediately.
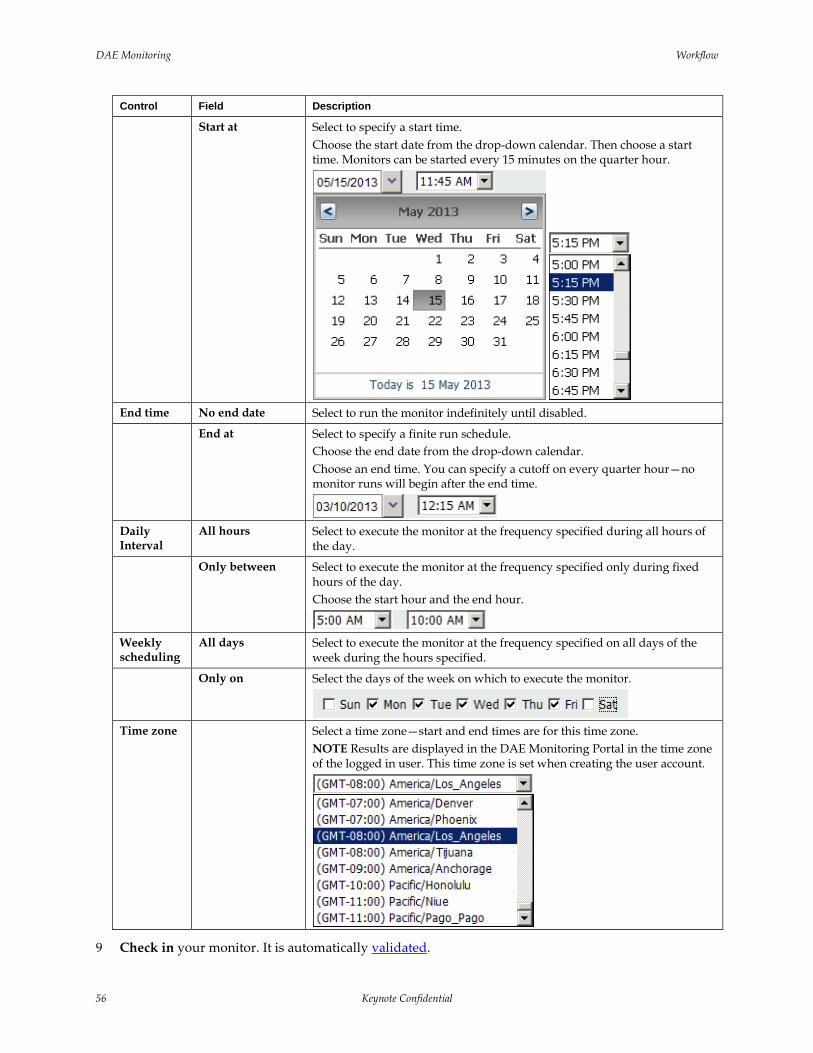
DAE Monitoring Workflow
56 Keynote Confidential
Control Field Description
Start at Select to specify a start time. Choose the start date from the drop-down calendar. Then choose a start time. Monitors can be started every 15 minutes on the quarter hour.
End time No end date Select to run the monitor indefinitely until disabled.
End at Select to specify a finite run schedule. Choose the end date from the drop-down calendar. Choose an end time. You can specify a cutoff on every quarter hour—no monitor runs will begin after the end time.
Daily Interval
All hours Select to execute the monitor at the frequency specified during all hours of the day.
Only between Select to execute the monitor at the frequency specified only during fixed hours of the day. Choose the start hour and the end hour.
Weekly scheduling
All days Select to execute the monitor at the frequency specified on all days of the week during the hours specified.
Only on Select the days of the week on which to execute the monitor.
Time zone Select a time zone—start and end times are for this time zone.
NOTE Results are displayed in the DAE Monitoring Portal in the time zone of the logged in user. This time zone is set when creating the user account.
9 Check in your monitor. It is automatically validated.
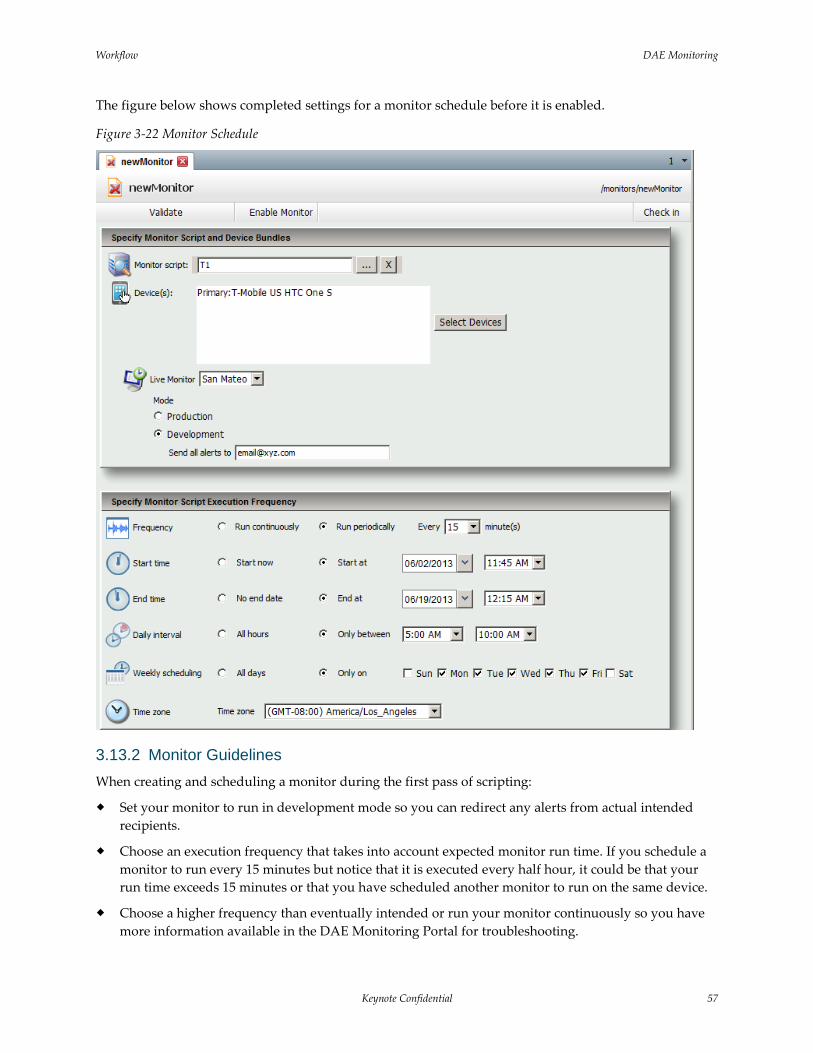
Workflow DAE Monitoring
Keynote Confidential 57
The figure below shows completed settings for a monitor schedule before it is enabled.
Figure 3-22 Monitor Schedule
3.13.2 Monitor Guidelines When creating and scheduling a monitor during the first pass of scripting:
Set your monitor to run in development mode so you can redirect any alerts from actual intended recipients.
Choose an execution frequency that takes into account expected monitor run time. If you schedule a monitor to run every 15 minutes but notice that it is executed every half hour, it could be that your run time exceeds 15 minutes or that you have scheduled another monitor to run on the same device.
Choose a higher frequency than eventually intended or run your monitor continuously so you have more information available in the DAE Monitoring Portal for troubleshooting.
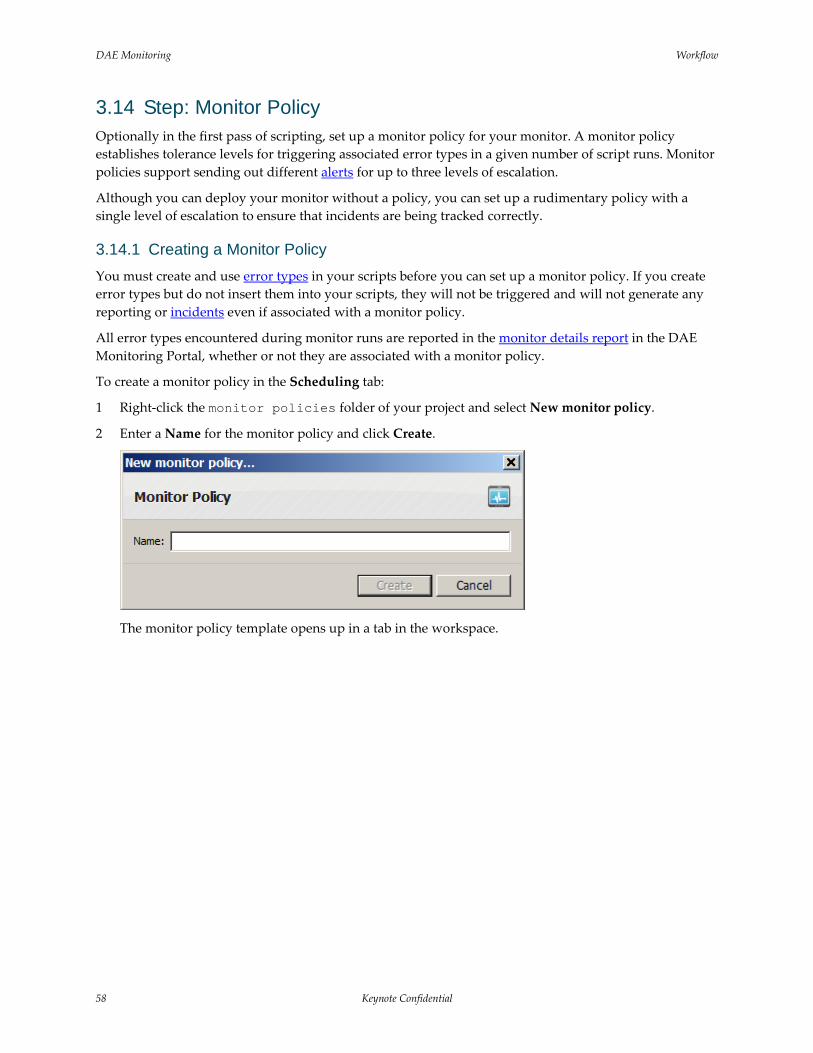
DAE Monitoring Workflow
58 Keynote Confidential
3.14 Step: Monitor Policy Optionally in the first pass of scripting, set up a monitor policy for your monitor. A monitor policy establishes tolerance levels for triggering associated error types in a given number of script runs. Monitor policies support sending out different alerts for up to three levels of escalation.
Although you can deploy your monitor without a policy, you can set up a rudimentary policy with a single level of escalation to ensure that incidents are being tracked correctly.
3.14.1 Creating a Monitor Policy You must create and use error types in your scripts before you can set up a monitor policy. If you create error types but do not insert them into your scripts, they will not be triggered and will not generate any reporting or incidents even if associated with a monitor policy.
All error types encountered during monitor runs are reported in the monitor details report in the DAE Monitoring Portal, whether or not they are associated with a monitor policy.
To create a monitor policy in the Scheduling tab:
1 Right-click the monitor policies folder of your project and select New monitor policy.
2 Enter a Name for the monitor policy and click Create.
The monitor policy template opens up in a tab in the workspace.
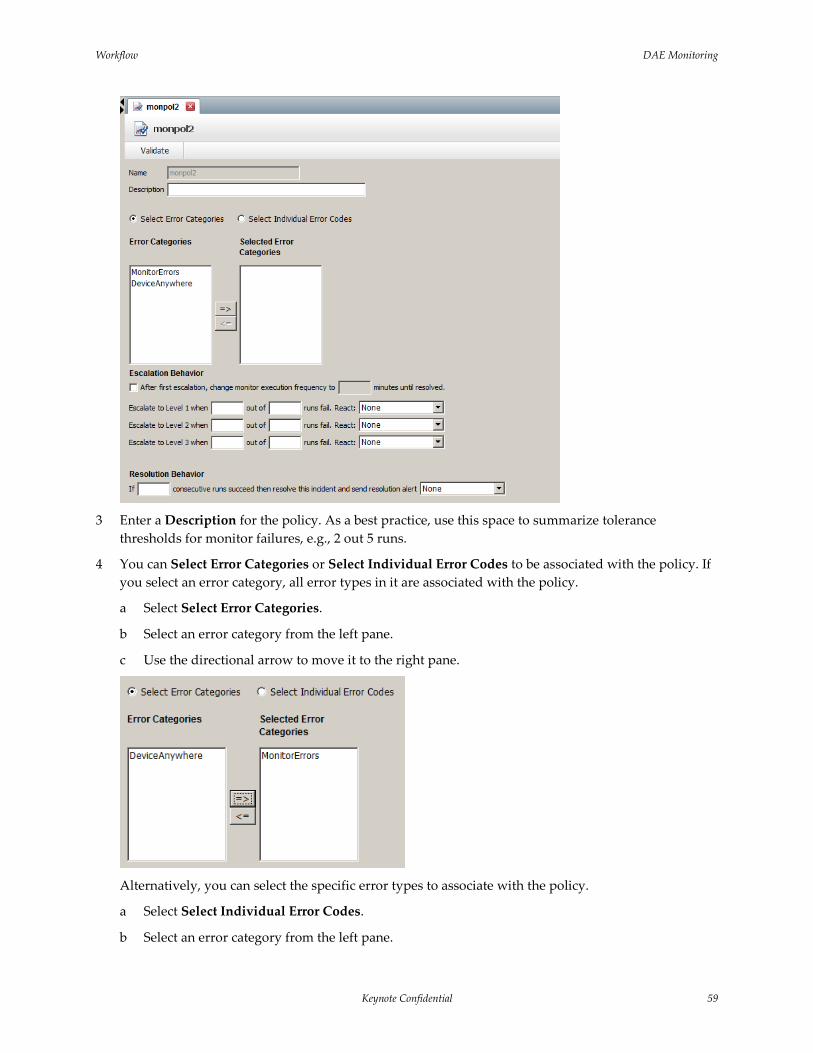
Workflow DAE Monitoring
Keynote Confidential 59
3 Enter a Description for the policy. As a best practice, use this space to summarize tolerance
thresholds for monitor failures, e.g., 2 out 5 runs.
4 You can Select Error Categories or Select Individual Error Codes to be associated with the policy. If you select an error category, all error types in it are associated with the policy.
a Select Select Error Categories.
b Select an error category from the left pane.
c Use the directional arrow to move it to the right pane.
Alternatively, you can select the specific error types to associate with the policy.
a Select Select Individual Error Codes.
b Select an error category from the left pane.
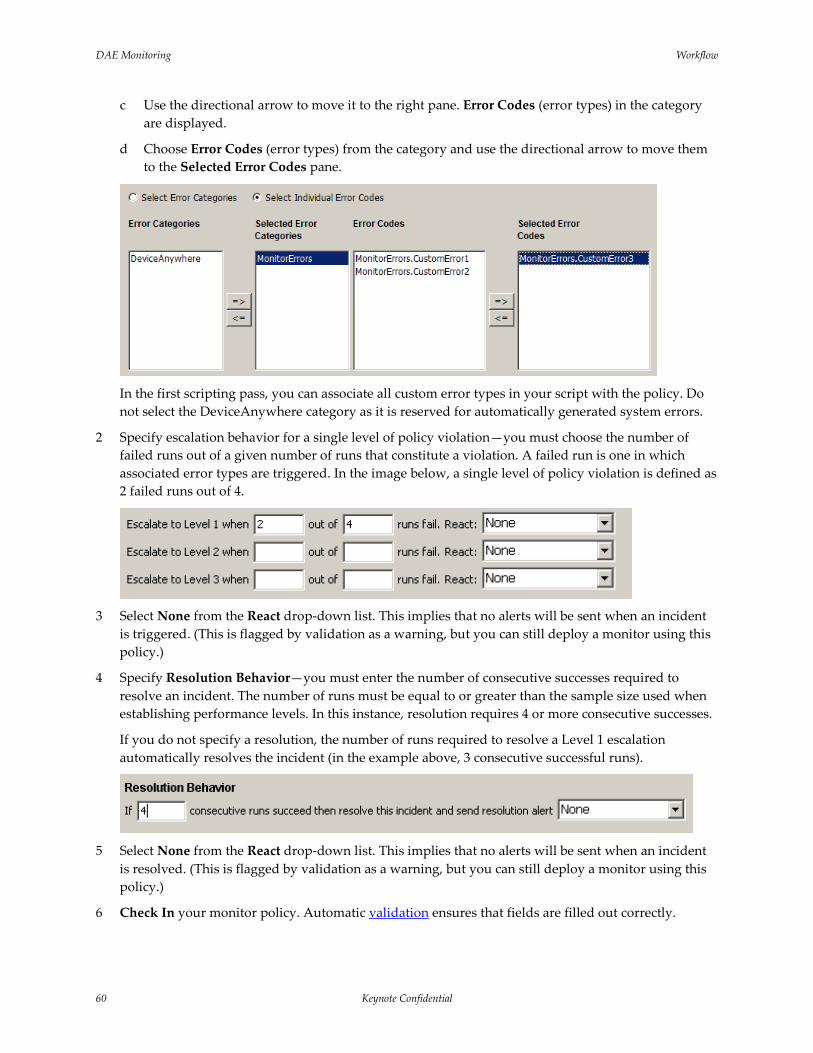
DAE Monitoring Workflow
60 Keynote Confidential
c Use the directional arrow to move it to the right pane. Error Codes (error types) in the category are displayed.
d Choose Error Codes (error types) from the category and use the directional arrow to move them to the Selected Error Codes pane.
In the first scripting pass, you can associate all custom error types in your script with the policy. Do not select the DeviceAnywhere category as it is reserved for automatically generated system errors.
2 Specify escalation behavior for a single level of policy violation—you must choose the number of failed runs out of a given number of runs that constitute a violation. A failed run is one in which associated error types are triggered. In the image below, a single level of policy violation is defined as 2 failed runs out of 4.
3 Select None from the React drop-down list. This implies that no alerts will be sent when an incident
is triggered. (This is flagged by validation as a warning, but you can still deploy a monitor using this policy.)
4 Specify Resolution Behavior—you must enter the number of consecutive successes required to resolve an incident. The number of runs must be equal to or greater than the sample size used when establishing performance levels. In this instance, resolution requires 4 or more consecutive successes.
If you do not specify a resolution, the number of runs required to resolve a Level 1 escalation automatically resolves the incident (in the example above, 3 consecutive successful runs).
5 Select None from the React drop-down list. This implies that no alerts will be sent when an incident
is resolved. (This is flagged by validation as a warning, but you can still deploy a monitor using this policy.)
6 Check In your monitor policy. Automatic validation ensures that fields are filled out correctly.
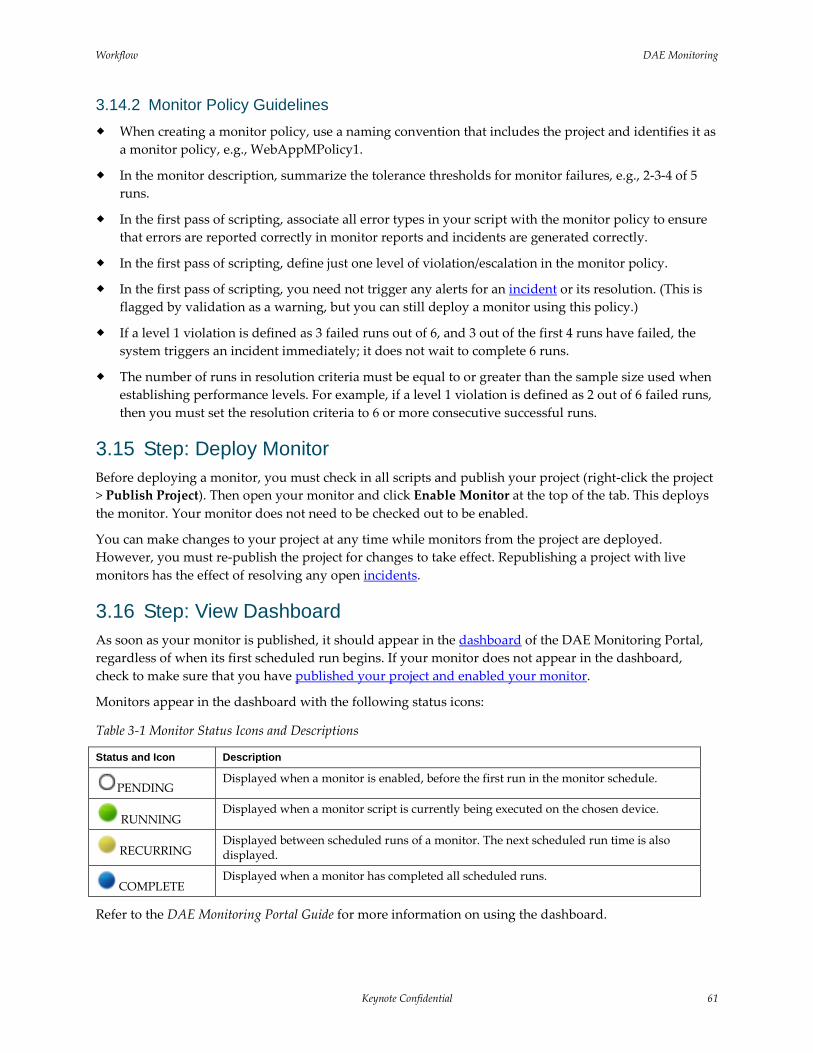
Workflow DAE Monitoring
Keynote Confidential 61
3.14.2 Monitor Policy Guidelines When creating a monitor policy, use a naming convention that includes the project and identifies it as
a monitor policy, e.g., WebAppMPolicy1.
In the monitor description, summarize the tolerance thresholds for monitor failures, e.g., 2-3-4 of 5 runs.
In the first pass of scripting, associate all error types in your script with the monitor policy to ensure that errors are reported correctly in monitor reports and incidents are generated correctly.
In the first pass of scripting, define just one level of violation/escalation in the monitor policy.
In the first pass of scripting, you need not trigger any alerts for an incident or its resolution. (This is flagged by validation as a warning, but you can still deploy a monitor using this policy.)
If a level 1 violation is defined as 3 failed runs out of 6, and 3 out of the first 4 runs have failed, the system triggers an incident immediately; it does not wait to complete 6 runs.
The number of runs in resolution criteria must be equal to or greater than the sample size used when establishing performance levels. For example, if a level 1 violation is defined as 2 out of 6 failed runs, then you must set the resolution criteria to 6 or more consecutive successful runs.
3.15 Step: Deploy Monitor Before deploying a monitor, you must check in all scripts and publish your project (right-click the project > Publish Project). Then open your monitor and click Enable Monitor at the top of the tab. This deploys the monitor. Your monitor does not need to be checked out to be enabled.
You can make changes to your project at any time while monitors from the project are deployed. However, you must re-publish the project for changes to take effect. Republishing a project with live monitors has the effect of resolving any open incidents.
3.16 Step: View Dashboard As soon as your monitor is published, it should appear in the dashboard of the DAE Monitoring Portal, regardless of when its first scheduled run begins. If your monitor does not appear in the dashboard, check to make sure that you have published your project and enabled your monitor.
Monitors appear in the dashboard with the following status icons:
Table 3-1 Monitor Status Icons and Descriptions
Status and Icon Description
PENDING Displayed when a monitor is enabled, before the first run in the monitor schedule.
RUNNING Displayed when a monitor script is currently being executed on the chosen device.
RECURRING Displayed between scheduled runs of a monitor. The next scheduled run time is also displayed.
COMPLETE Displayed when a monitor has completed all scheduled runs.
Refer to the DAE Monitoring Portal Guide for more information on using the dashboard.
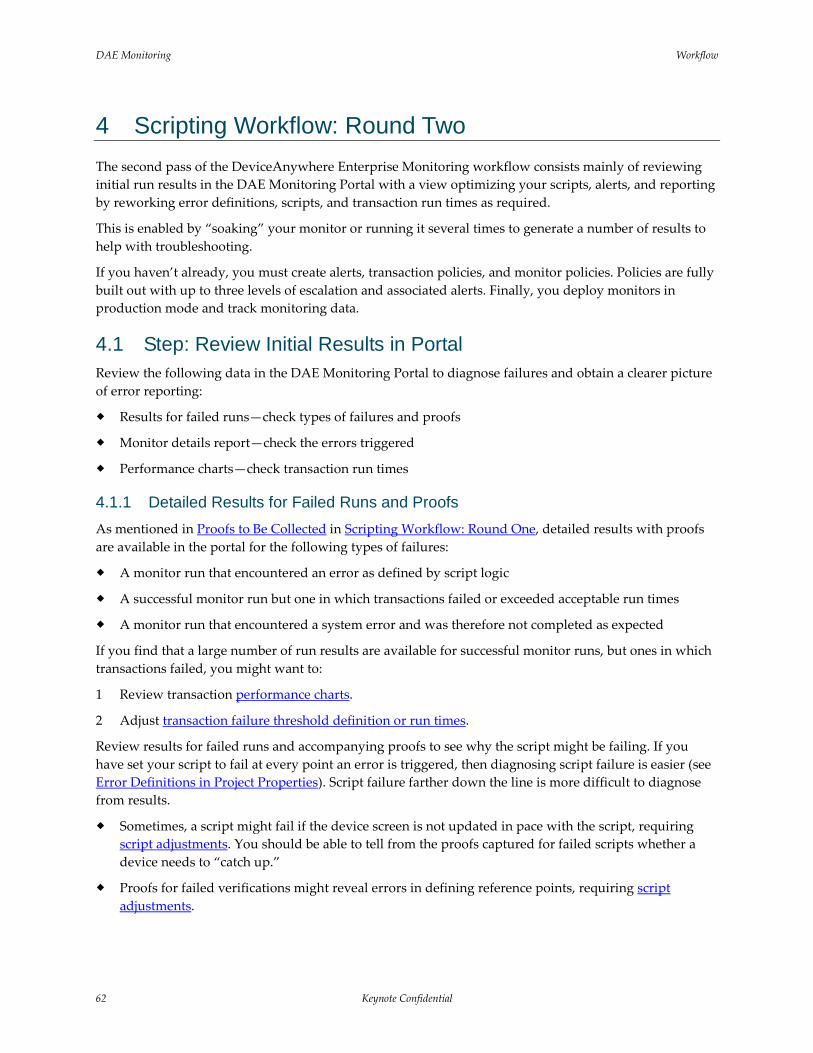
DAE Monitoring Workflow
62 Keynote Confidential
4 Scripting Workflow: Round Two The second pass of the DeviceAnywhere Enterprise Monitoring workflow consists mainly of reviewing initial run results in the DAE Monitoring Portal with a view optimizing your scripts, alerts, and reporting by reworking error definitions, scripts, and transaction run times as required.
This is enabled by “soaking” your monitor or running it several times to generate a number of results to help with troubleshooting.
If you haven’t already, you must create alerts, transaction policies, and monitor policies. Policies are fully built out with up to three levels of escalation and associated alerts. Finally, you deploy monitors in production mode and track monitoring data.
4.1 Step: Review Initial Results in Portal Review the following data in the DAE Monitoring Portal to diagnose failures and obtain a clearer picture of error reporting:
Results for failed runs—check types of failures and proofs
Monitor details report—check the errors triggered
Performance charts—check transaction run times
4.1.1 Detailed Results for Failed Runs and Proofs As mentioned in Proofs to Be Collected in Scripting Workflow: Round One, detailed results with proofs are available in the portal for the following types of failures:
A monitor run that encountered an error as defined by script logic
A successful monitor run but one in which transactions failed or exceeded acceptable run times
A monitor run that encountered a system error and was therefore not completed as expected
If you find that a large number of run results are available for successful monitor runs, but ones in which transactions failed, you might want to:
1 Review transaction performance charts.
2 Adjust transaction failure threshold definition or run times.
Review results for failed runs and accompanying proofs to see why the script might be failing. If you have set your script to fail at every point an error is triggered, then diagnosing script failure is easier (see Error Definitions in Project Properties). Script failure farther down the line is more difficult to diagnose from results.
Sometimes, a script might fail if the device screen is not updated in pace with the script, requiring script adjustments. You should be able to tell from the proofs captured for failed scripts whether a device needs to “catch up.”
Proofs for failed verifications might reveal errors in defining reference points, requiring script adjustments.
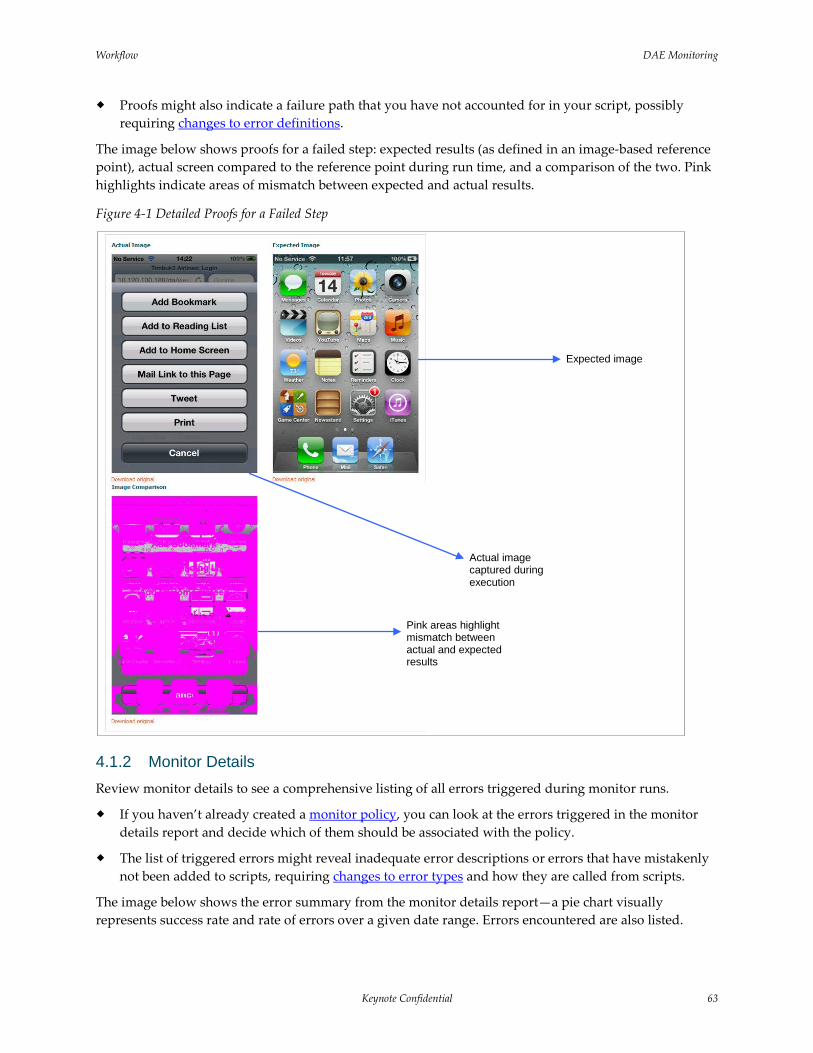
Workflow DAE Monitoring
Keynote Confidential 63
Proofs might also indicate a failure path that you have not accounted for in your script, possibly requiring changes to error definitions.
The image below shows proofs for a failed step: expected results (as defined in an image-based reference point), actual screen compared to the reference point during run time, and a comparison of the two. Pink highlights indicate areas of mismatch between expected and actual results.
Figure 4-1 Detailed Proofs for a Failed Step
4.1.2 Monitor Details Review monitor details to see a comprehensive listing of all errors triggered during monitor runs.
If you haven’t already created a monitor policy, you can look at the errors triggered in the monitor details report and decide which of them should be associated with the policy.
The list of triggered errors might reveal inadequate error descriptions or errors that have mistakenly not been added to scripts, requiring changes to error types and how they are called from scripts.
The image below shows the error summary from the monitor details report—a pie chart visually represents success rate and rate of errors over a given date range. Errors encountered are also listed.
Actual image captured during execution
Expected image
Pink areas highlight mismatch between actual and expected results
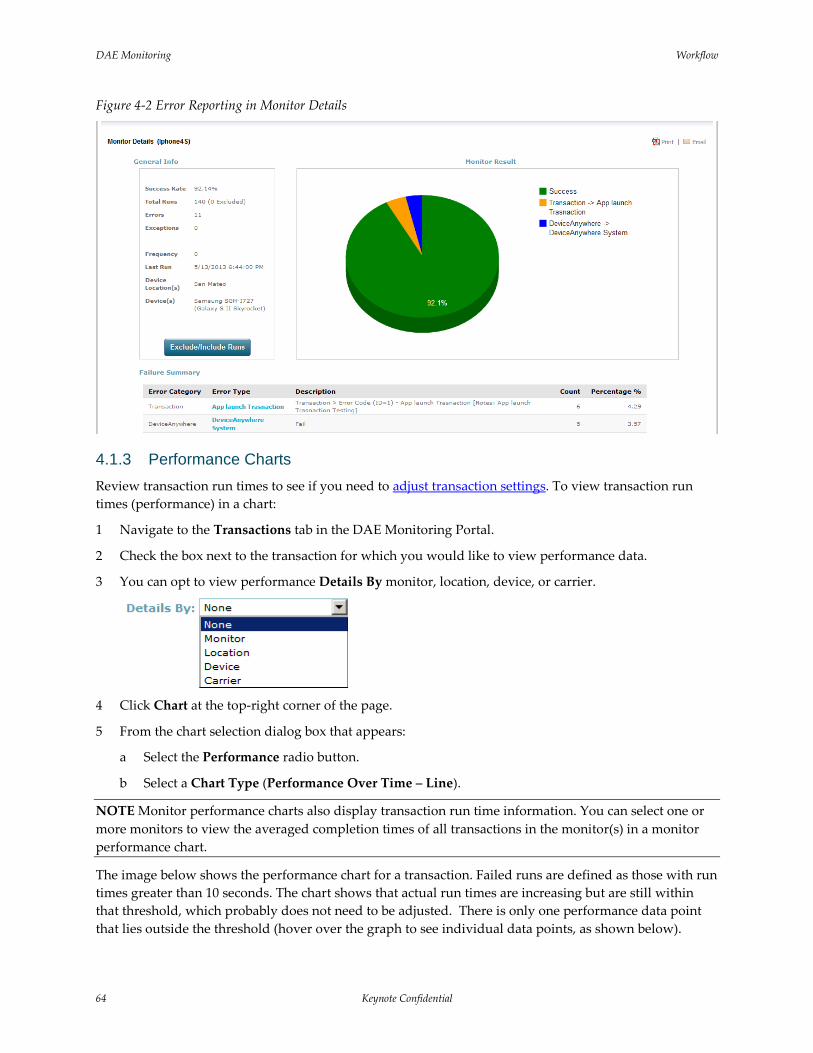
DAE Monitoring Workflow
64 Keynote Confidential
Figure 4-2 Error Reporting in Monitor Details
4.1.3 Performance Charts Review transaction run times to see if you need to adjust transaction settings. To view transaction run times (performance) in a chart:
1 Navigate to the Transactions tab in the DAE Monitoring Portal.
2 Check the box next to the transaction for which you would like to view performance data.
3 You can opt to view performance Details By monitor, location, device, or carrier.
4 Click Chart at the top-right corner of the page.
5 From the chart selection dialog box that appears:
a Select the Performance radio button.
b Select a Chart Type (Performance Over Time – Line).
NOTE Monitor performance charts also display transaction run time information. You can select one or more monitors to view the averaged completion times of all transactions in the monitor(s) in a monitor performance chart.
The image below shows the performance chart for a transaction. Failed runs are defined as those with run times greater than 10 seconds. The chart shows that actual run times are increasing but are still within that threshold, which probably does not need to be adjusted. There is only one performance data point that lies outside the threshold (hover over the graph to see individual data points, as shown below).
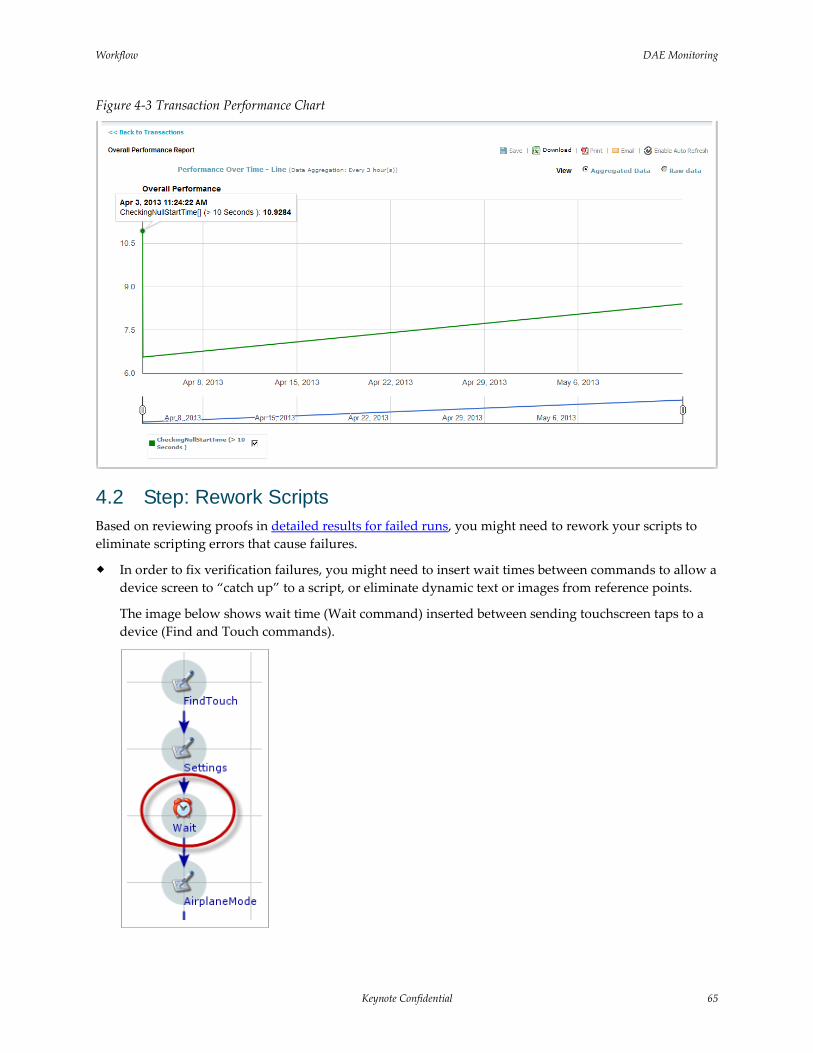
Workflow DAE Monitoring
Keynote Confidential 65
Figure 4-3 Transaction Performance Chart
4.2 Step: Rework Scripts Based on reviewing proofs in detailed results for failed runs, you might need to rework your scripts to eliminate scripting errors that cause failures.
In order to fix verification failures, you might need to insert wait times between commands to allow a device screen to “catch up” to a script, or eliminate dynamic text or images from reference points.
The image below shows wait time (Wait command) inserted between sending touchscreen taps to a device (Find and Touch commands).

DAE Monitoring Workflow
66 Keynote Confidential
The image below highlights areas on an iPhone home screen that are likely to change. These areas, such as dynamic status information on an application icon, should not be included in reference images. (Refer to the DAE Guide to Text Matching and DAE Guide to Image Matching for information on creating reliable reference points.)
You will also want to edit your scripts and error types triggered after adjusting error types.
4.3 Step: Adjust Error Types After examining command-by-command results for failed runs:
Proofs might reveal an additional failure path that you have not accounted for. You might need to rework scripts to create additional branches (e.g., in Wait Event) to account for this possibility. You might also have to create and insert a new error type to be triggered at this point.
After examining the monitor details report:
You might discover that certain error types are not being triggered because they have not been inserted in a script—create and insert error types for all points where a script is likely to fail.
Adjust error definitions to include better reporting on the cause of failure, e.g., you can add a note to indicate exactly where/why an error is triggered.
You can further refine error categories for more granular reporting, e.g., you can divide the category for general monitor errors into sub-categories for device issues (e.g., application is not installed) and network issues (e.g., unable to connect to Internet).
NOTE In your monitor policy, associate only those general (non-application) error types that you wish to be alerted on; transaction alerts are sent out separately each time a transaction violates expected run time or a Toggle Transaction Fail command is encountered.
4.4 Step: Adjust Transaction Settings Adjust transaction settings, if required, after reviewing results available for failed runs and transaction performance data.
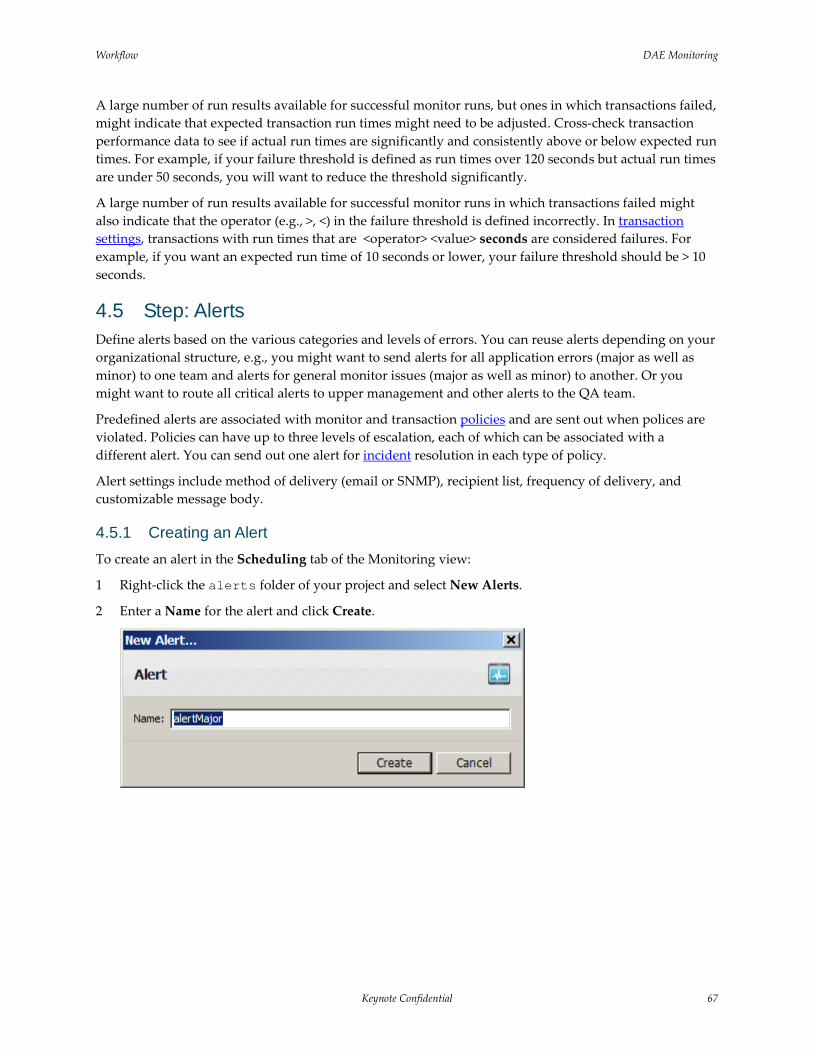
Workflow DAE Monitoring
Keynote Confidential 67
A large number of run results available for successful monitor runs, but ones in which transactions failed, might indicate that expected transaction run times might need to be adjusted. Cross-check transaction performance data to see if actual run times are significantly and consistently above or below expected run times. For example, if your failure threshold is defined as run times over 120 seconds but actual run times are under 50 seconds, you will want to reduce the threshold significantly.
A large number of run results available for successful monitor runs in which transactions failed might also indicate that the operator (e.g., >, <) in the failure threshold is defined incorrectly. In transaction settings, transactions with run times that are <operator> <value> seconds are considered failures. For example, if you want an expected run time of 10 seconds or lower, your failure threshold should be > 10 seconds.
4.5 Step: Alerts Define alerts based on the various categories and levels of errors. You can reuse alerts depending on your organizational structure, e.g., you might want to send alerts for all application errors (major as well as minor) to one team and alerts for general monitor issues (major as well as minor) to another. Or you might want to route all critical alerts to upper management and other alerts to the QA team.
Predefined alerts are associated with monitor and transaction policies and are sent out when polices are violated. Policies can have up to three levels of escalation, each of which can be associated with a different alert. You can send out one alert for incident resolution in each type of policy.
Alert settings include method of delivery (email or SNMP), recipient list, frequency of delivery, and customizable message body.
4.5.1 Creating an Alert To create an alert in the Scheduling tab of the Monitoring view:
1 Right-click the alerts folder of your project and select New Alerts.
2 Enter a Name for the alert and click Create.
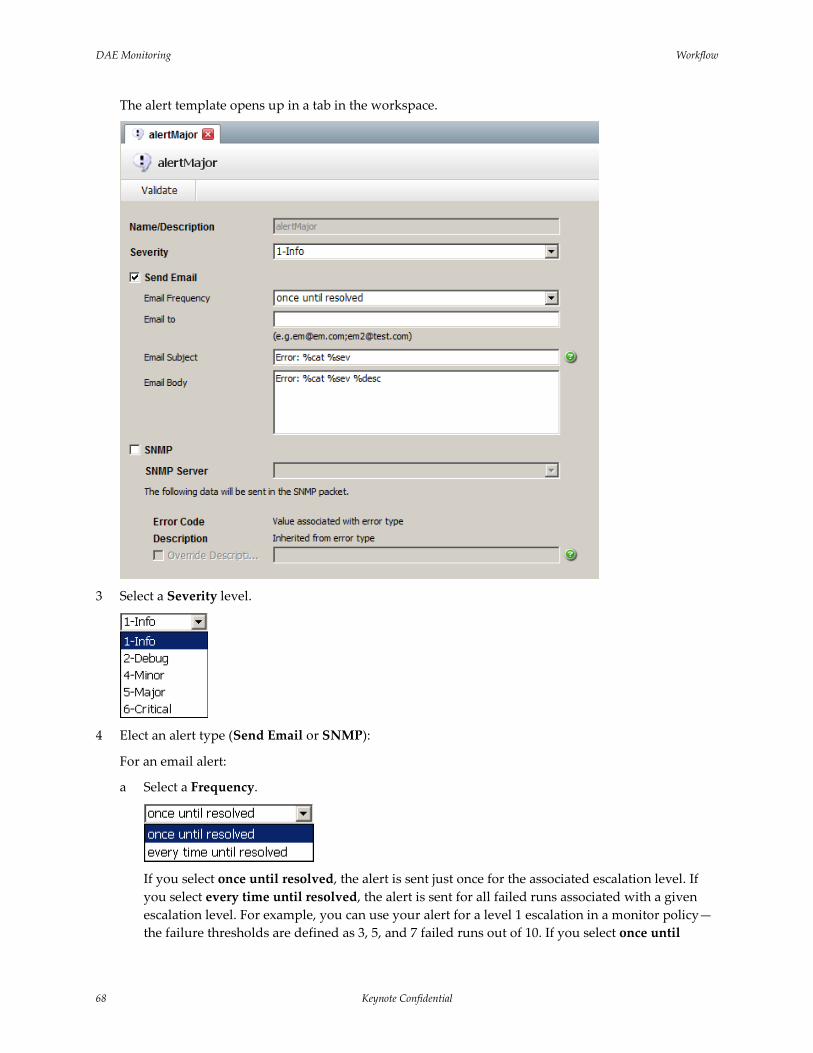
DAE Monitoring Workflow
68 Keynote Confidential
The alert template opens up in a tab in the workspace.
3 Select a Severity level.
4 Elect an alert type (Send Email or SNMP):
For an email alert:
a Select a Frequency.
If you select once until resolved, the alert is sent just once for the associated escalation level. If you select every time until resolved, the alert is sent for all failed runs associated with a given escalation level. For example, you can use your alert for a level 1 escalation in a monitor policy—the failure thresholds are defined as 3, 5, and 7 failed runs out of 10. If you select once until
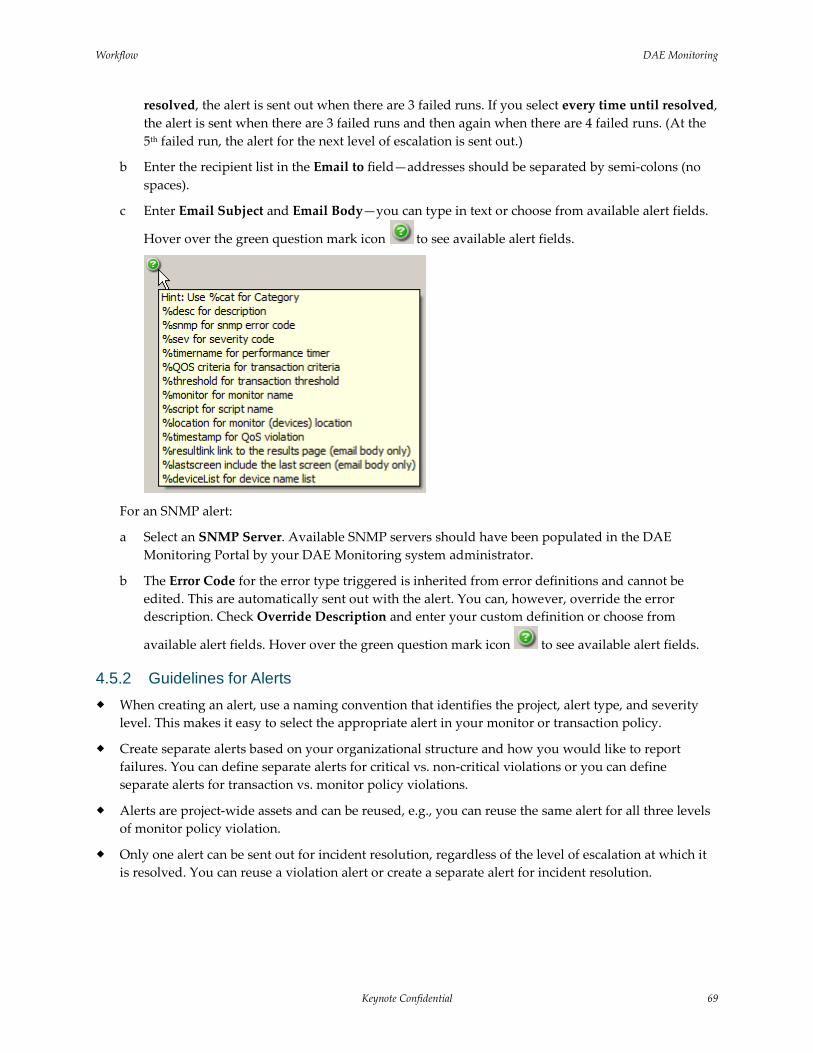
Workflow DAE Monitoring
Keynote Confidential 69
resolved, the alert is sent out when there are 3 failed runs. If you select every time until resolved, the alert is sent when there are 3 failed runs and then again when there are 4 failed runs. (At the 5th failed run, the alert for the next level of escalation is sent out.)
b Enter the recipient list in the Email to field—addresses should be separated by semi-colons (no spaces).
c Enter Email Subject and Email Body—you can type in text or choose from available alert fields.
Hover over the green question mark icon to see available alert fields.
For an SNMP alert:
a Select an SNMP Server. Available SNMP servers should have been populated in the DAE Monitoring Portal by your DAE Monitoring system administrator.
b The Error Code for the error type triggered is inherited from error definitions and cannot be edited. This are automatically sent out with the alert. You can, however, override the error description. Check Override Description and enter your custom definition or choose from
available alert fields. Hover over the green question mark icon to see available alert fields.
4.5.2 Guidelines for Alerts When creating an alert, use a naming convention that identifies the project, alert type, and severity
level. This makes it easy to select the appropriate alert in your monitor or transaction policy.
Create separate alerts based on your organizational structure and how you would like to report failures. You can define separate alerts for critical vs. non-critical violations or you can define separate alerts for transaction vs. monitor policy violations.
Alerts are project-wide assets and can be reused, e.g., you can reuse the same alert for all three levels of monitor policy violation.
Only one alert can be sent out for incident resolution, regardless of the level of escalation at which it is resolved. You can reuse a violation alert or create a separate alert for incident resolution.
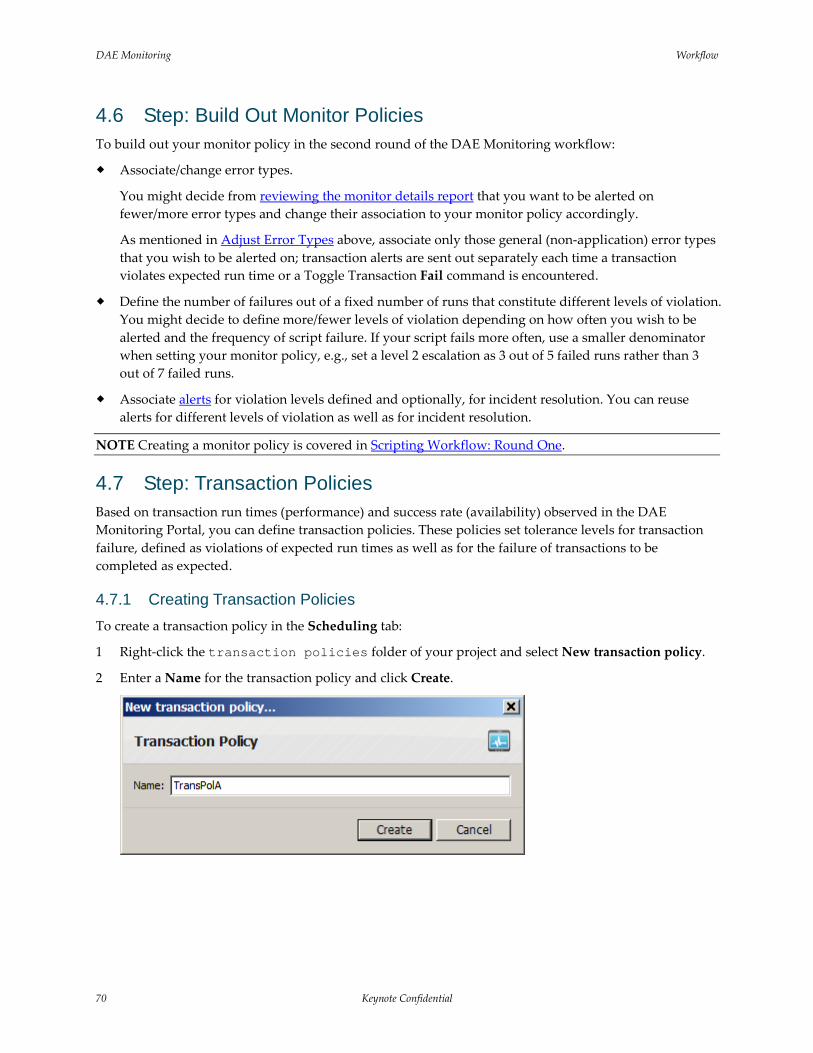
DAE Monitoring Workflow
70 Keynote Confidential
4.6 Step: Build Out Monitor Policies To build out your monitor policy in the second round of the DAE Monitoring workflow:
Associate/change error types.
You might decide from reviewing the monitor details report that you want to be alerted on fewer/more error types and change their association to your monitor policy accordingly.
As mentioned in Adjust Error Types above, associate only those general (non-application) error types that you wish to be alerted on; transaction alerts are sent out separately each time a transaction violates expected run time or a Toggle Transaction Fail command is encountered.
Define the number of failures out of a fixed number of runs that constitute different levels of violation. You might decide to define more/fewer levels of violation depending on how often you wish to be alerted and the frequency of script failure. If your script fails more often, use a smaller denominator when setting your monitor policy, e.g., set a level 2 escalation as 3 out of 5 failed runs rather than 3 out of 7 failed runs.
Associate alerts for violation levels defined and optionally, for incident resolution. You can reuse alerts for different levels of violation as well as for incident resolution.
NOTE Creating a monitor policy is covered in Scripting Workflow: Round One.
4.7 Step: Transaction Policies Based on transaction run times (performance) and success rate (availability) observed in the DAE Monitoring Portal, you can define transaction policies. These policies set tolerance levels for transaction failure, defined as violations of expected run times as well as for the failure of transactions to be completed as expected.
4.7.1 Creating Transaction Policies To create a transaction policy in the Scheduling tab:
1 Right-click the transaction policies folder of your project and select New transaction policy.
2 Enter a Name for the transaction policy and click Create.
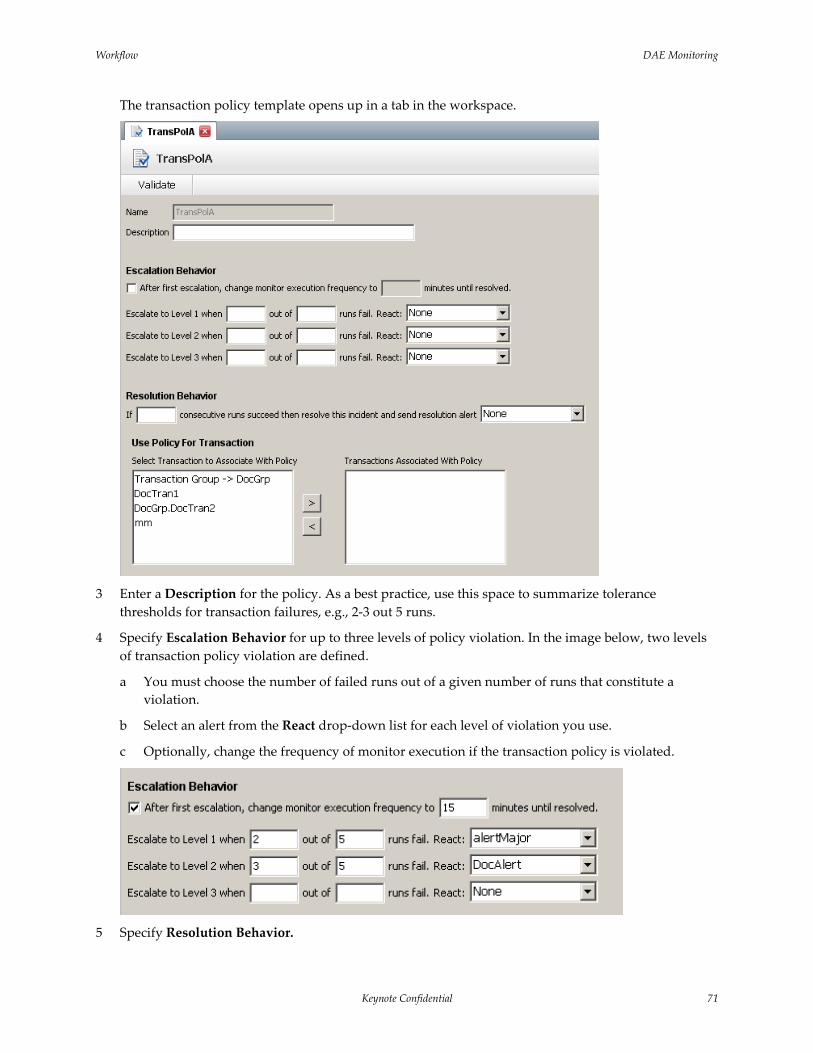
Workflow DAE Monitoring
Keynote Confidential 71
The transaction policy template opens up in a tab in the workspace.
3 Enter a Description for the policy. As a best practice, use this space to summarize tolerance
thresholds for transaction failures, e.g., 2-3 out 5 runs.
4 Specify Escalation Behavior for up to three levels of policy violation. In the image below, two levels of transaction policy violation are defined.
a You must choose the number of failed runs out of a given number of runs that constitute a violation.
b Select an alert from the React drop-down list for each level of violation you use.
c Optionally, change the frequency of monitor execution if the transaction policy is violated.
5 Specify Resolution Behavior.
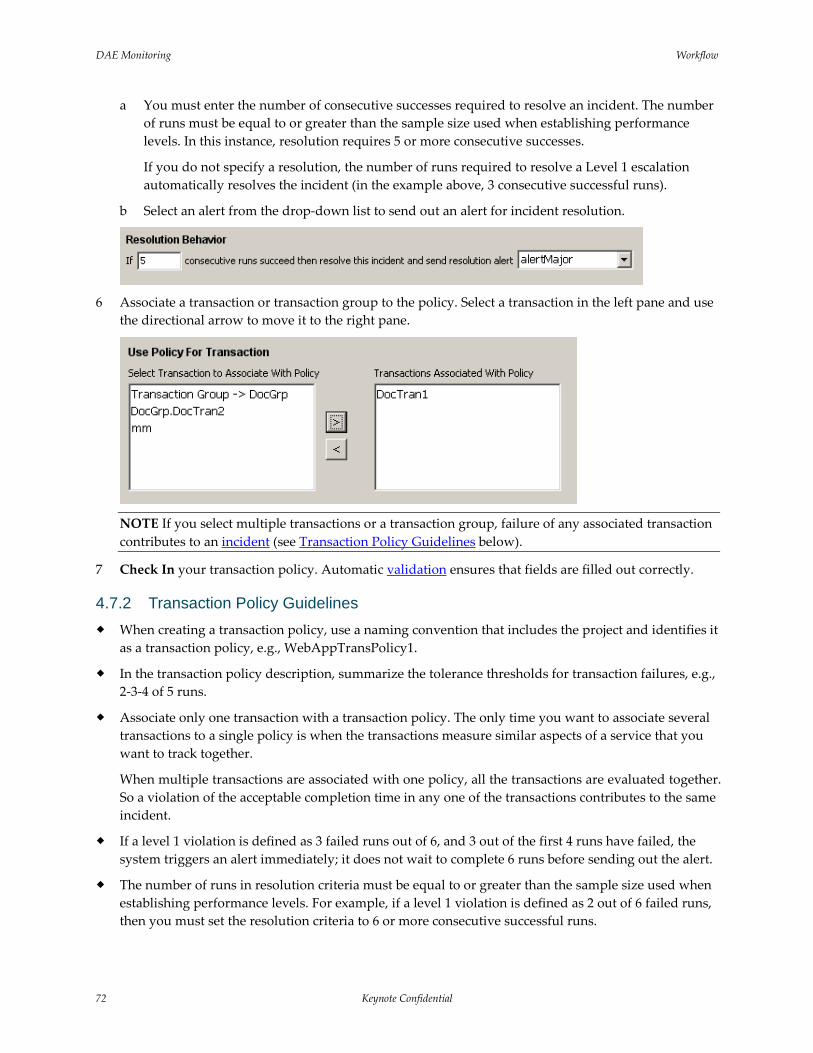
DAE Monitoring Workflow
72 Keynote Confidential
a You must enter the number of consecutive successes required to resolve an incident. The number of runs must be equal to or greater than the sample size used when establishing performance levels. In this instance, resolution requires 5 or more consecutive successes.
If you do not specify a resolution, the number of runs required to resolve a Level 1 escalation automatically resolves the incident (in the example above, 3 consecutive successful runs).
b Select an alert from the drop-down list to send out an alert for incident resolution.
6 Associate a transaction or transaction group to the policy. Select a transaction in the left pane and use
the directional arrow to move it to the right pane.
NOTE If you select multiple transactions or a transaction group, failure of any associated transaction contributes to an incident (see Transaction Policy Guidelines below).
7 Check In your transaction policy. Automatic validation ensures that fields are filled out correctly.
4.7.2 Transaction Policy Guidelines When creating a transaction policy, use a naming convention that includes the project and identifies it
as a transaction policy, e.g., WebAppTransPolicy1.
In the transaction policy description, summarize the tolerance thresholds for transaction failures, e.g., 2-3-4 of 5 runs.
Associate only one transaction with a transaction policy. The only time you want to associate several transactions to a single policy is when the transactions measure similar aspects of a service that you want to track together.
When multiple transactions are associated with one policy, all the transactions are evaluated together. So a violation of the acceptable completion time in any one of the transactions contributes to the same incident.
If a level 1 violation is defined as 3 failed runs out of 6, and 3 out of the first 4 runs have failed, the system triggers an alert immediately; it does not wait to complete 6 runs before sending out the alert.
The number of runs in resolution criteria must be equal to or greater than the sample size used when establishing performance levels. For example, if a level 1 violation is defined as 2 out of 6 failed runs, then you must set the resolution criteria to 6 or more consecutive successful runs.
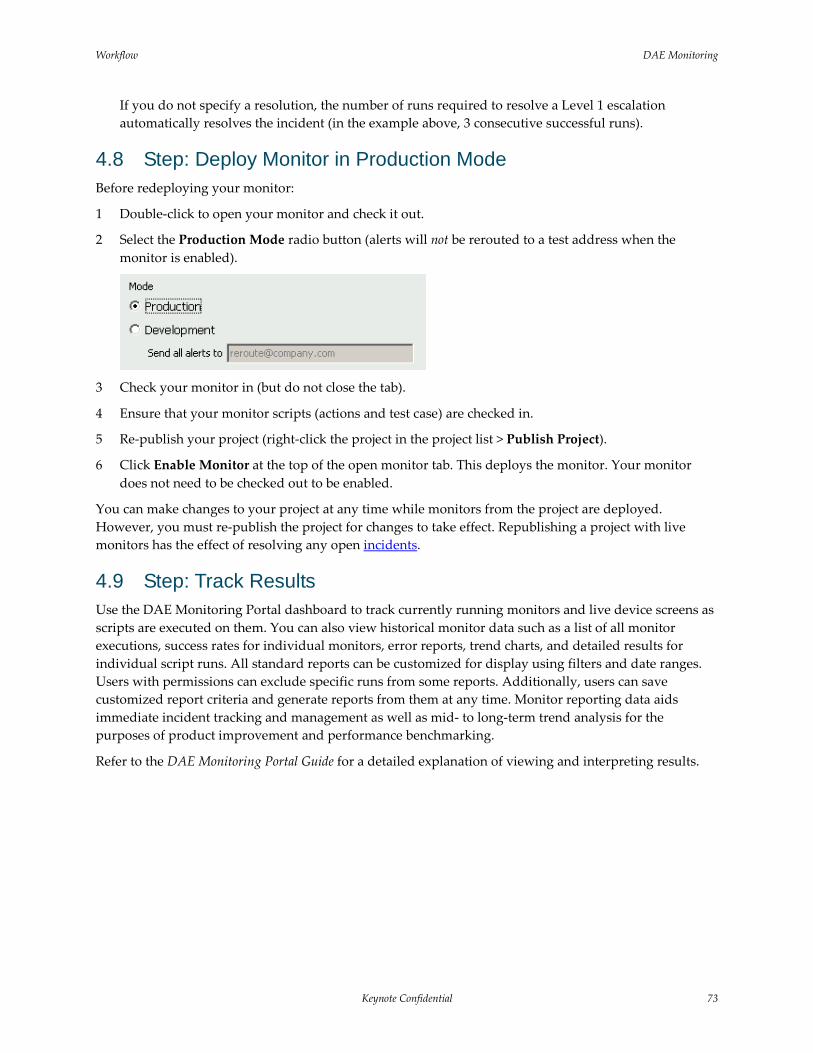
Workflow DAE Monitoring
Keynote Confidential 73
If you do not specify a resolution, the number of runs required to resolve a Level 1 escalation automatically resolves the incident (in the example above, 3 consecutive successful runs).
4.8 Step: Deploy Monitor in Production Mode Before redeploying your monitor:
1 Double-click to open your monitor and check it out.
2 Select the Production Mode radio button (alerts will not be rerouted to a test address when the monitor is enabled).
3 Check your monitor in (but do not close the tab).
4 Ensure that your monitor scripts (actions and test case) are checked in.
5 Re-publish your project (right-click the project in the project list > Publish Project).
6 Click Enable Monitor at the top of the open monitor tab. This deploys the monitor. Your monitor does not need to be checked out to be enabled.
You can make changes to your project at any time while monitors from the project are deployed. However, you must re-publish the project for changes to take effect. Republishing a project with live monitors has the effect of resolving any open incidents.
4.9 Step: Track Results Use the DAE Monitoring Portal dashboard to track currently running monitors and live device screens as scripts are executed on them. You can also view historical monitor data such as a list of all monitor executions, success rates for individual monitors, error reports, trend charts, and detailed results for individual script runs. All standard reports can be customized for display using filters and date ranges. Users with permissions can exclude specific runs from some reports. Additionally, users can save customized report criteria and generate reports from them at any time. Monitor reporting data aids immediate incident tracking and management as well as mid- to long-term trend analysis for the purposes of product improvement and performance benchmarking.
Refer to the DAE Monitoring Portal Guide for a detailed explanation of viewing and interpreting results.