Embed Size (px)
Citation preview
remuneration deviation reportcompany aBcprepared By:
peer-review By:
1 MArCH 2014
SAMPLE
January 2013 Remuneration Deviation Report
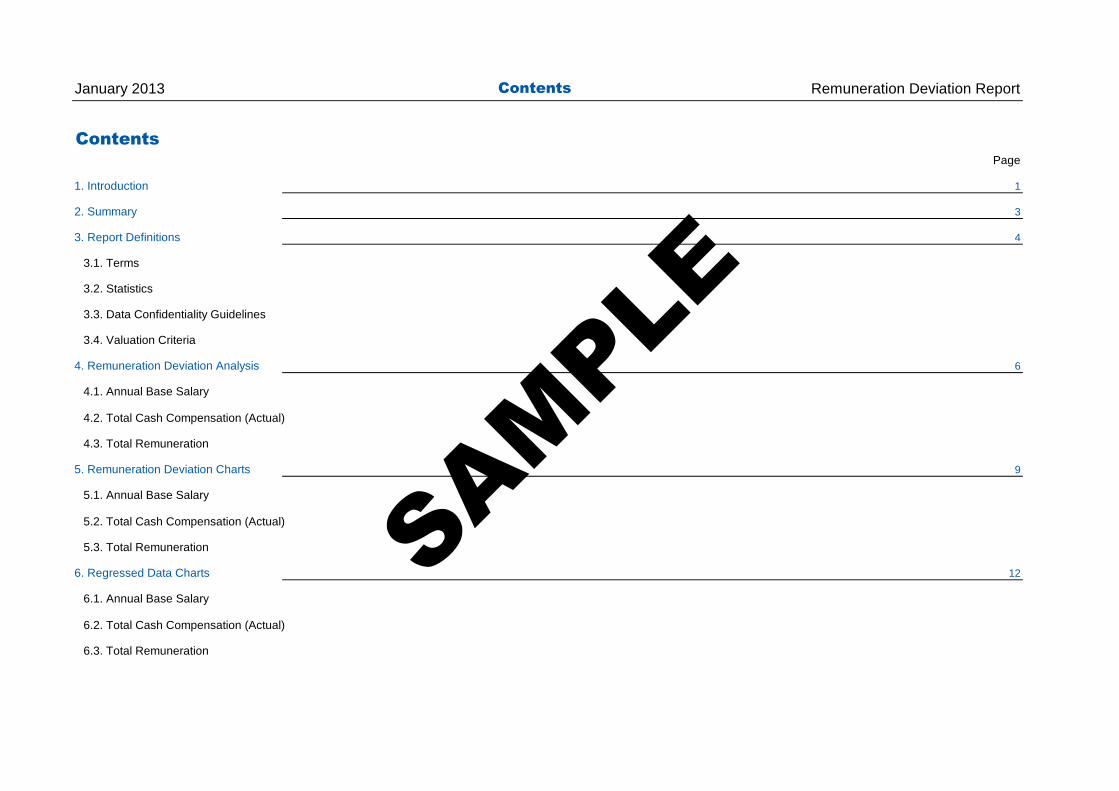
ContentsPage
1. Introduction 1
2. Summary 3
3. Report Definitions 4
3.1. Terms
3.2. Statistics
3.3. Data Confidentiality Guidelines
3.4. Valuation Criteria
4. Remuneration Deviation Analysis 6
4.1. Annual Base Salary
4.2. Total Cash Compensation (Actual)
4.3. Total Remuneration
5. Remuneration Deviation Charts 9
5.1. Annual Base Salary
5.2. Total Cash Compensation (Actual)
5.3. Total Remuneration
6. Regressed Data Charts 12
6.1. Annual Base Salary
6.2. Total Cash Compensation (Actual)
6.3. Total Remuneration
Contents
SAMPLE
January 2013 Remuneration Deviation Report
1. Introduction
1.1. About Mercer
1.2. About the Report
Introduction
This report is prepared for Company ABC and contains remuneration deviation analysis for 10 positions in Germany. The deviation analysis covers comparison of the following compensation elements to the market values:
Annual Base SalaryAnnual Total Cash ActualAnnual Total Remuneration
The remuneration deviation analysis of the positions is represented through the Deviation Analysis Tables and Charts, containing the different statistical measures for each of the elements that compose the Remuneration Package generally offered to the above positions. The reference market is All industries regression line, based on TRS 2012.
Mercer is a global consulting leader in talent, health, retirement and investments. Mercer helps clients around the world advance the health, wealth and performance of their most vital asset – their people. Mercer's 20,000 employees are based in more than 40 countries. Mercer is a wholly owned subsidiary of Marsh & McLennan Companies (NYSE: MMC), a global team of professional services companies offering clients advice and solutions in the areas of risk, strategy and human capital.
© 2013 Mercer LLC January
1
SAMPLE

January 2013 Remuneration Deviation ReportIntroduction
1.3. Confidentiality
Human Resource professionals who deal regularly with data are aware of the variance that may exist in databases. Data may fluctuate slightly from year to year due to changes in the participant base. It is also important to note that within a sample, a significant amount of data may be reported by one organization. It is also possible for data to change drastically from year to year due to industry-related factors and economic conditions.
Mercer is providing this information to its clients to help them to make independent decisions regarding salaries and benefits. Because the exchange of salary and benefit information among competitors may be construed in certain circumstances as a means to facilitate an antitrust violation, Mercer has taken appropriate steps in collecting and disseminating this information in order to avoid such perceptions.
The information and data contained in this report are for information purposes only and are not intended nor implied to be a substitute for professional advice. In no event will Mercer be liable to you or to any third party for any decision made or action taken in reliance of the results obtained through the use of the information and/or data contained or provided herein.
To ensure the confidentiality of all data, a minimum number of observations is required in order for statistics to be displayed. Three organizations must report at least three observations for a variable in order for the mean to be displayed. Four organizations and four observations are required for display of the median. Five organizations reporting at least five observations are required to display 25th and 75th Percentiles. Where there has been insufficient data for analysis, this has been indicated with “--“.
© 2013 Mercer LLC January
2
SAMPLE

January 2013 Remuneration Deviation Report
2. Summary
PIC Position Title Benchmark Title Country Currency PC Annual Base Salary Total Cash Compensation (Actual) Total Remuneration
1 CEO CEO Germany EUR 65 = = =
2 CFO CFO Germany EUR 63 ▲ ▲ ▲
3 COO COO Germany EUR 63 ▲ = ▲
4 Head of IT Head of IT Germany EUR 62 ▲ = ▲
5 Head of HR Head of HR Germany EUR 62 = = =
6 Head of Sales Head of Sales Germany EUR 61 = = =
7 Head of Marketing Head of Marketing Germany EUR 61 ▼ ▼ ▼
8 Head of Manufacturing Head of Manufacturing Germany EUR 60 ▼ ▼ =
9 Head of Supply & Logistics Head of Supply & Logistics Germany EUR 60 ▼ ▼ ▼
10 Head of Corporate Affairs Head of Corporate Affairs Germany EUR 59 ▼ ▼ ▼
= position is within lower and upper quartiles
▲ position is above upper quartile
▼ position is below lower quartile
-- no position or market data for comparison
Summary
© 2013 Mercer LLC January
3
SAMPLE

January 2013 Remuneration Deviation Report
3. Report Definitions
3.1. Terms
Annual Base Salary
Total Cash Compensation (Actual)
Total Direct Compensation
Total Remuneration
3.2. Statistics
25th Percentile (25th %ile)
Median
75th Percentile (75th %ile)
The data point that is higher than 50% of all other data in the sample when ranked from low to high. Also known as the 50th percentile.
The data point that is higher than 25% of all other data in the sample when ranked from low to high. Also known as the first quartile.
Includes Total Guaranteed Cash Compensation plus the annualized value of any actual Short-term Incentive, Sales Incentive, Profit Sharing, or Other Incentive awards paid out on performance over a period of 12 months or less. The figures reported reflect the actual amounts of the awards received over the last 12 months.
Includes Total Cash Compensation (Actual) plus the annualized value of any Long-term Incentive (LTI) awards, valued using Black-Scholes methodology for appreciation-based awards.
Includes Total Direct Compensation plus the annualized value of the benefits: retirement plan, life and medical insurance, motor vehicle, etc.
We provide below an explanation of the Compensation Item terms used in the Remuneration Tables:
Report Definitions
Includes only annualized base salary (Monthly Base Salary x Number of Months Paid).
The data point that is higher than 75% of all other data in the sample when ranked from low to high. Also known as the third quartile.
© 2013 Mercer LLC January
4
SAMPLE
January 2013 Remuneration Deviation ReportReport Definitions
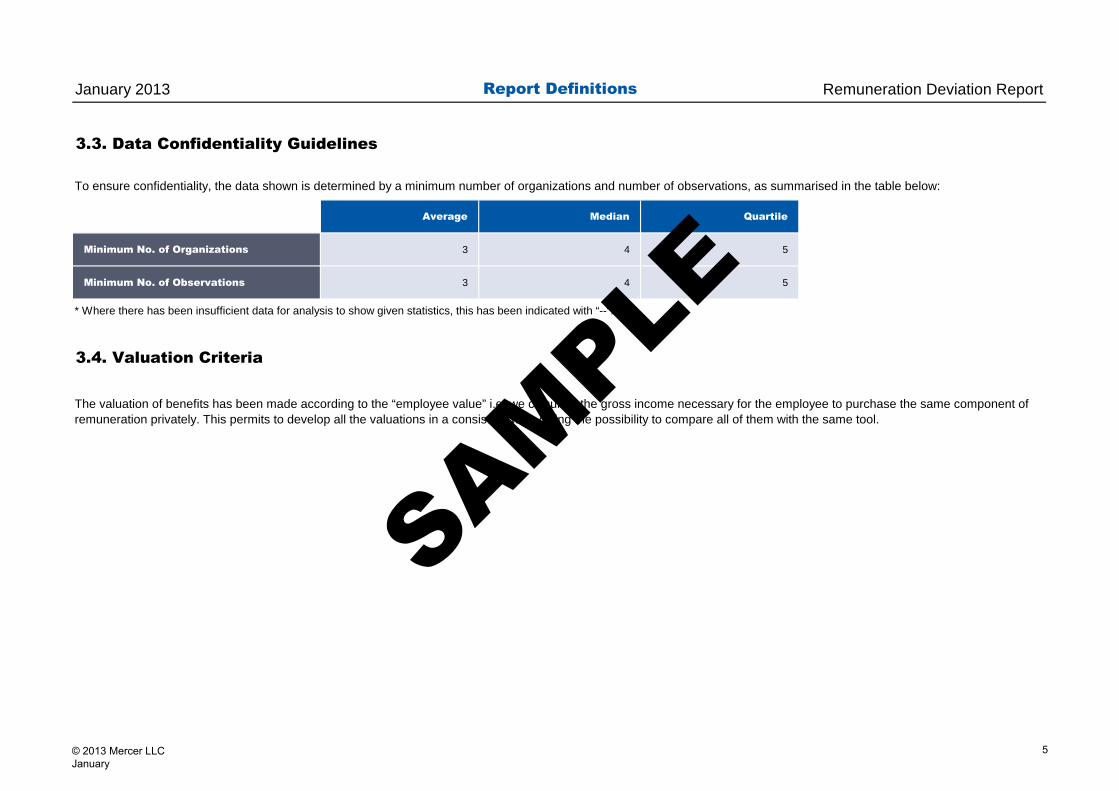
3.3. Data Confidentiality Guidelines
Average Median Quartile
Minimum No. of Organizations 3 4 5
Minimum No. of Observations 3 4 5
* Where there has been insufficient data for analysis to show given statistics, this has been indicated with “--“.
3.4. Valuation Criteria
To ensure confidentiality, the data shown is determined by a minimum number of organizations and number of observations, as summarised in the table below:
The valuation of benefits has been made according to the “employee value” i.e. we calculate the gross income necessary for the employee to purchase the same component of remuneration privately. This permits to develop all the valuations in a consistent way, giving the possibility to compare all of them with the same tool.
© 2013 Mercer LLC January
5
SAMPLE
January 2013 Remuneration Deviation Report
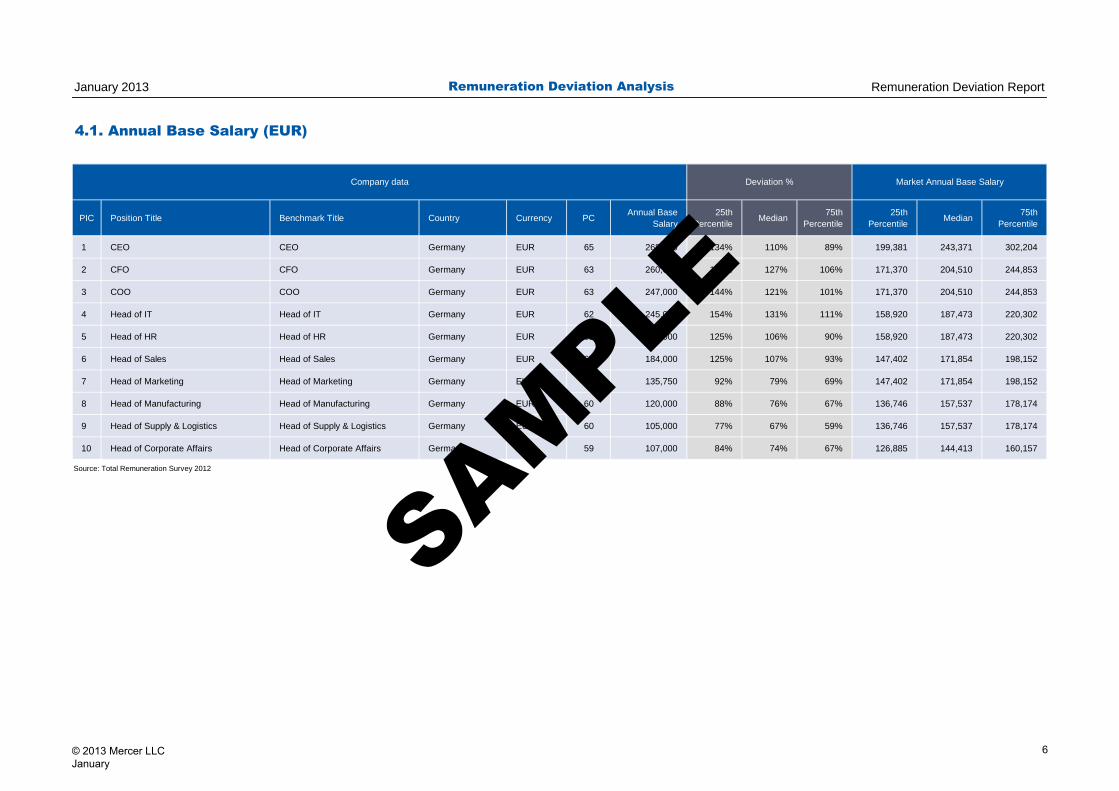
4.1. Annual Base Salary (EUR)
PIC Position Title Benchmark Title Country Currency PC Annual Base Salary
25th Percentile Median 75th
Percentile25th
Percentile Median 75th Percentile
1 CEO CEO Germany EUR 65 268,000 134% 110% 89% 199,381 243,371 302,204
2 CFO CFO Germany EUR 63 260,000 152% 127% 106% 171,370 204,510 244,853
3 COO COO Germany EUR 63 247,000 144% 121% 101% 171,370 204,510 244,853
4 Head of IT Head of IT Germany EUR 62 245,000 154% 131% 111% 158,920 187,473 220,302
5 Head of HR Head of HR Germany EUR 62 198,000 125% 106% 90% 158,920 187,473 220,302
6 Head of Sales Head of Sales Germany EUR 61 184,000 125% 107% 93% 147,402 171,854 198,152
7 Head of Marketing Head of Marketing Germany EUR 61 135,750 92% 79% 69% 147,402 171,854 198,152
8 Head of Manufacturing Head of Manufacturing Germany EUR 60 120,000 88% 76% 67% 136,746 157,537 178,174
9 Head of Supply & Logistics Head of Supply & Logistics Germany EUR 60 105,000 77% 67% 59% 136,746 157,537 178,174
10 Head of Corporate Affairs Head of Corporate Affairs Germany EUR 59 107,000 84% 74% 67% 126,885 144,413 160,157
Source: Total Remuneration Survey 2012
Remuneration Deviation Analysis
Company data Market Annual Base SalaryDeviation %
© 2013 Mercer LLC January
6
SAMPLE

January 2013 Remuneration Deviation Report
4.2. Total Cash Compensation (Actual) (EUR)
PIC Position Title Benchmark Title Country Currency PCTotal Cash
Compensation (Actual)
25th Percentile Median 75th
Percentile25th
Percentile Median 75th Percentile
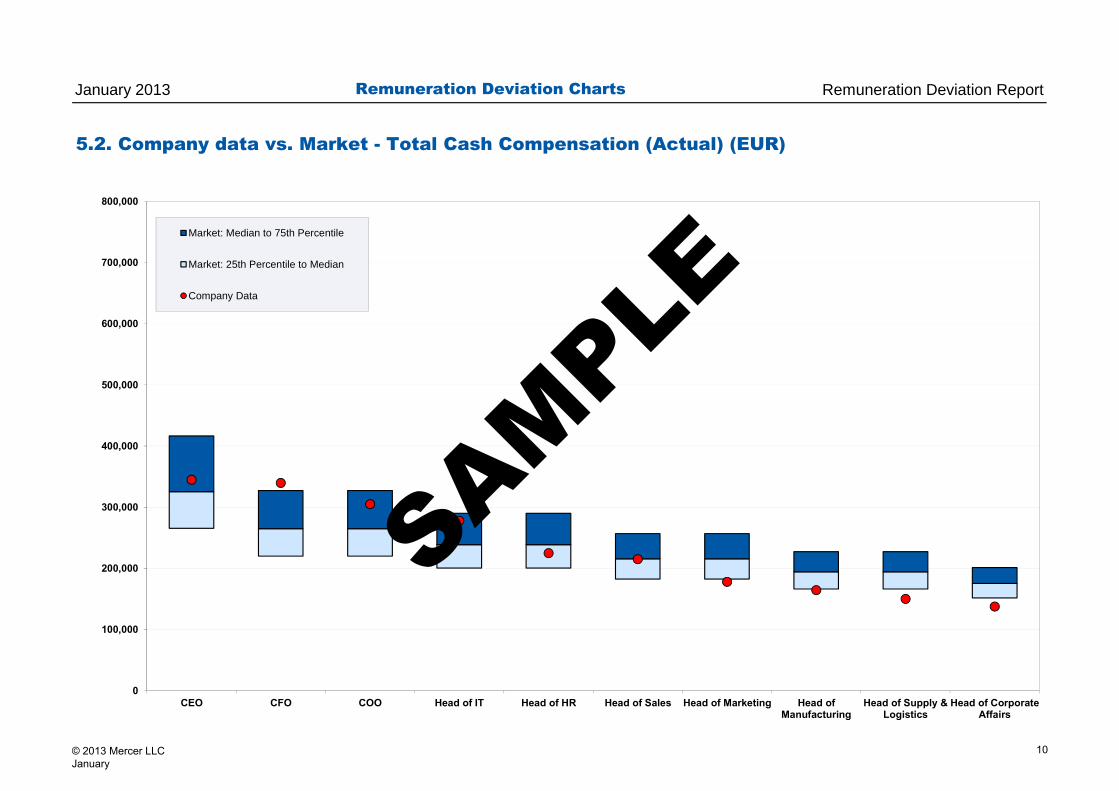
1 CEO CEO Germany EUR 65 345,000 130% 106% 83% 265,253 325,257 416,405
2 CFO CFO Germany EUR 63 339,800 155% 128% 104% 219,870 264,674 327,028
3 COO COO Germany EUR 63 305,000 139% 115% 93% 219,870 264,674 327,028
4 Head of IT Head of IT Germany EUR 62 278,000 139% 116% 96% 200,224 238,756 289,691
5 Head of HR Head of HR Germany EUR 62 225,000 112% 94% 78% 200,224 238,756 289,691
6 Head of Sales Head of Sales Germany EUR 61 215,000 118% 100% 84% 182,361 215,376 256,542
7 Head of Marketing Head of Marketing Germany EUR 61 178,000 98% 83% 69% 182,361 215,376 256,542
8 Head of Manufacturing Head of Manufacturing Germany EUR 60 164,500 99% 85% 72% 166,118 194,286 227,116
9 Head of Supply & Logistics Head of Supply & Logistics Germany EUR 60 150,000 90% 77% 66% 166,118 194,286 227,116
10 Head of Corporate Affairs Head of Corporate Affairs Germany EUR 59 137,500 91% 78% 68% 151,346 175,260 201,002
Source: Total Remuneration Survey 2012
Company data Market Total Cash Compensation (Actual)Deviation %
Remuneration Deviation Analysis
© 2013 Mercer LLC January
7
SAMPLE

January 2013 Remuneration Deviation Report
4.3. Total Remuneration (EUR)
PIC Position Title Benchmark Title Country Currency PC Total Remuneration
25th Percentile Median 75th
Percentile25th
Percentile Median 75th Percentile
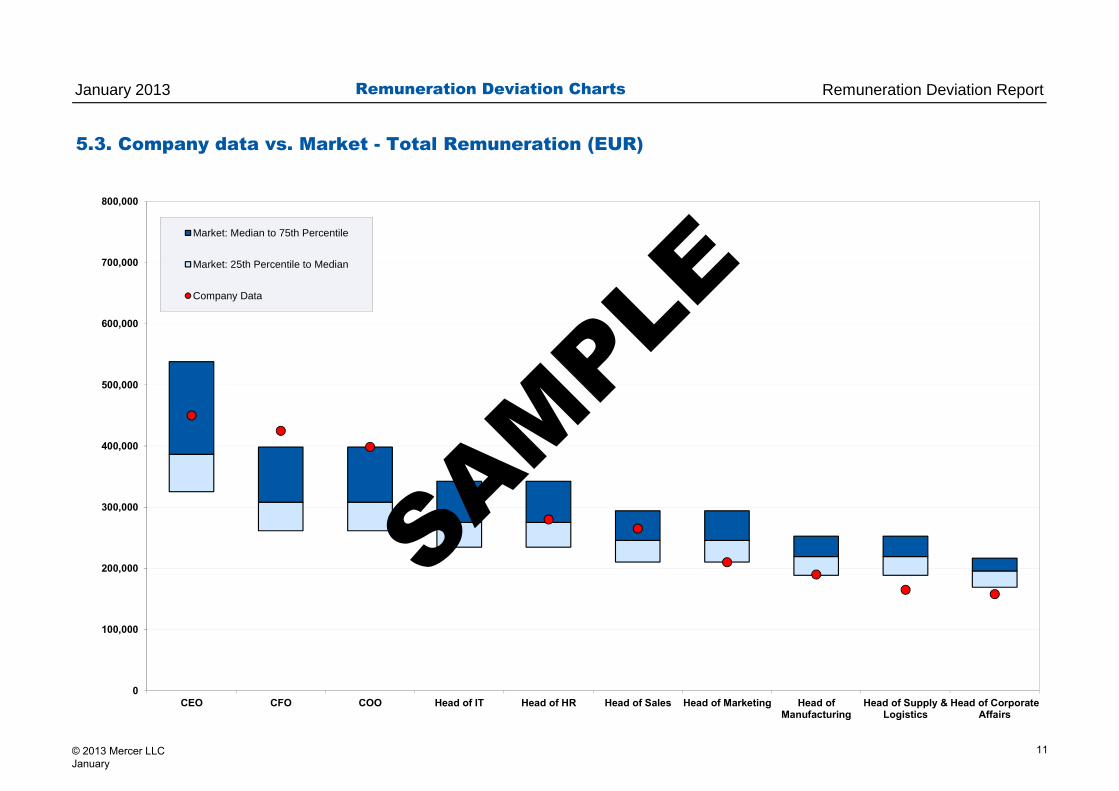
1 CEO CEO Germany EUR 65 450,000 138% 116% 84% 325,257 386,423 537,678
2 CFO CFO Germany EUR 63 425,000 163% 138% 107% 261,415 307,977 398,042
3 COO COO Germany EUR 63 398,700 153% 129% 100% 261,415 307,977 398,042
4 Head of IT Head of IT Germany EUR 62 345,800 148% 126% 101% 234,383 274,946 342,176
5 Head of HR Head of HR Germany EUR 62 280,000 119% 102% 82% 234,383 274,946 342,176
6 Head of Sales Head of Sales Germany EUR 61 265,000 126% 108% 90% 210,161 245,457 293,969
7 Head of Marketing Head of Marketing Germany EUR 61 210,000 100% 86% 71% 210,161 245,457 293,969
8 Head of Manufacturing Head of Manufacturing Germany EUR 60 190,000 101% 87% 75% 188,456 219,131 252,394
9 Head of Supply & Logistics Head of Supply & Logistics Germany EUR 60 165,000 88% 75% 65% 188,456 219,131 252,394
10 Head of Corporate Affairs Head of Corporate Affairs Germany EUR 59 158,000 93% 81% 73% 169,005 195,628 216,557
Source: Total Remuneration Survey 2012
Company data Market Total RemunerationDeviation %
Remuneration Deviation Analysis
© 2013 Mercer LLC January
8
SAMPLE

January 2013 Remuneration Deviation Report
5.1. Company data vs. Market - Annual Base Salary (EUR)
Remuneration Deviation Charts
0
100,000
200,000
300,000
400,000
500,000
600,000
700,000
800,000
CEO CFO COO Head of IT Head of HR Head of Sales Head of Marketing Head ofManufacturing
Head of Supply &Logistics
Head of CorporateAffairs
Market: Median to 75th Percentile
Market: 25th Percentile to Median
Company Data
© 2013 Mercer LLC January
9
SAMPLE
January 2013 Remuneration Deviation Report
5.2. Company data vs. Market - Total Cash Compensation (Actual) (EUR)
Remuneration Deviation Charts
0
100,000
200,000
300,000
400,000
500,000
600,000
700,000
800,000
CEO CFO COO Head of IT Head of HR Head of Sales Head of Marketing Head ofManufacturing
Head of Supply &Logistics
Head of CorporateAffairs
Market: Median to 75th Percentile
Market: 25th Percentile to Median
Company Data
© 2013 Mercer LLC January
10
SAMPLE
January 2013 Remuneration Deviation Report
5.3. Company data vs. Market - Total Remuneration (EUR)
Remuneration Deviation Charts
0
100,000
200,000
300,000
400,000
500,000
600,000
700,000
800,000
CEO CFO COO Head of IT Head of HR Head of Sales Head of Marketing Head ofManufacturing
Head of Supply &Logistics
Head of CorporateAffairs
Market: Median to 75th Percentile
Market: 25th Percentile to Median
Company Data
© 2013 Mercer LLC January
11
SAMPLE

January 2013 Remuneration Deviation Report
6.1. Company data vs. Market Regression - Annual Base Salary (EUR)
Regressed Data Charts
0
50,000
100,000
150,000
200,000
250,000
300,000
350,000
400,000
450,000
500,000
550,000
600,000
650,000
700,000
750,000
40 41 42 43 44 45 46 47 48 49 50 51 52 53 54 55 56 57 58 59 60 61 62 63 64 65 66 67 68 69 70
75th Percentile
Median
25th Percentile
Company data
© 2013 Mercer LLC January
12
SAMPLE
January 2013 Remuneration Deviation Report
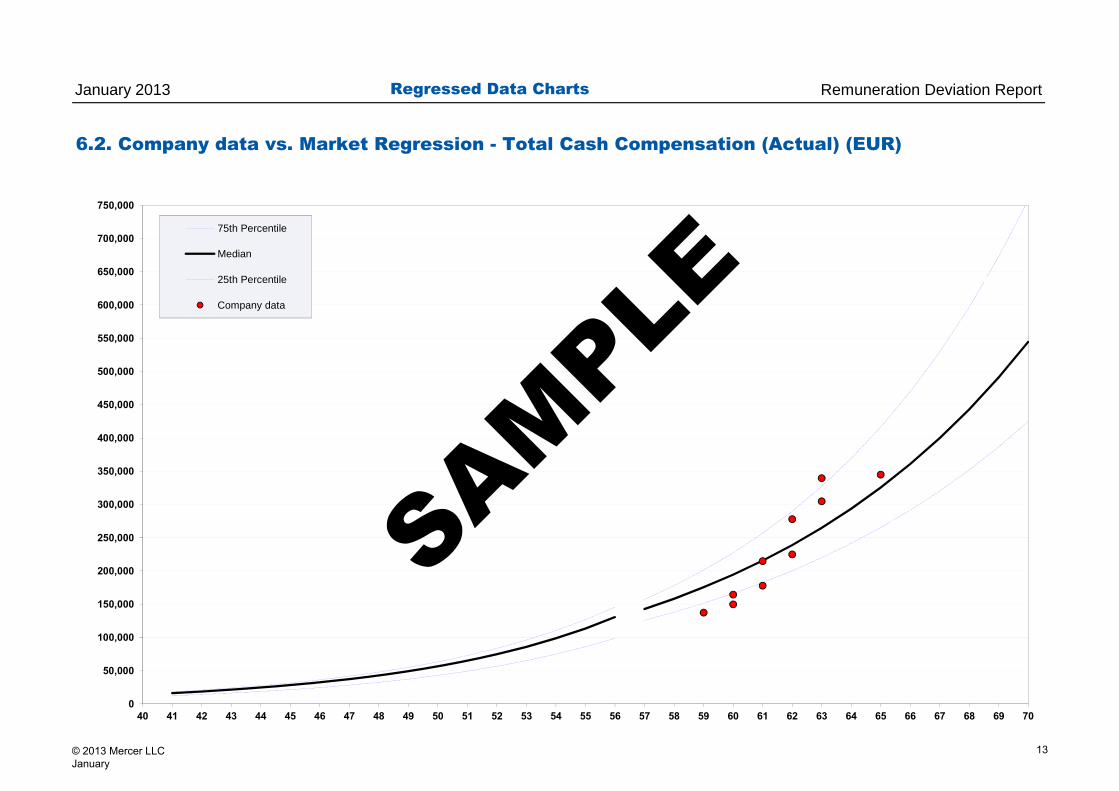
6.2. Company data vs. Market Regression - Total Cash Compensation (Actual) (EUR)
Regressed Data Charts
0
50,000
100,000
150,000
200,000
250,000
300,000
350,000
400,000
450,000
500,000
550,000
600,000
650,000
700,000
750,000
40 41 42 43 44 45 46 47 48 49 50 51 52 53 54 55 56 57 58 59 60 61 62 63 64 65 66 67 68 69 70
75th Percentile
Median
25th Percentile
Company data
© 2013 Mercer LLC January
13
SAMPLE

January 2013 Remuneration Deviation Report
6.3. Company data vs. Market Regression - Total Remuneration (EUR)
Regressed Data Charts
0
50,000
100,000
150,000
200,000
250,000
300,000
350,000
400,000
450,000
500,000
550,000
600,000
650,000
700,000
750,000
40 41 42 43 44 45 46 47 48 49 50 51 52 53 54 55 56 57 58 59 60 61 62 63 64 65 66 67 68 69 70
75th Percentile
Median
25th Percentile
Company data
© 2013 Mercer LLC January
14
SAMPLE
Copyright 2014 Mercer LLC. All rights reserved.
Argentina
Australia
Austria
Belgium
Brazil
Canada
Chile
China
Colombia
Denmark
Finland
France
Germany
Hong Kong
Hungary
India
Indonesia
Ireland
Italy
Japan
Malaysia
Mexico
Netherlands
New Zealand
Norway
Philippines
Poland
Portugal
Saudi Arabia
Singapore
South Africa
South Korea
Spain
Sweden
Switzerland
Taiwan
Thailand
Turkey
United Arab Emirates
United Kingdom
United States
Venezuela
For further information, please contact your local Mercer office or visit our web site at:
www.Imercer.com