Embed Size (px)
Citation preview
Copyright © Rallis India Limited. All rights reserved.1
Developments & Opportunities in Indian
Agri-Inputs Industry
KR VenkatadriChief Operating Officer
Copyright © Rallis India Limited. All rights reserved.2
Copyright © Rallis India Limited. All rights reserved.3
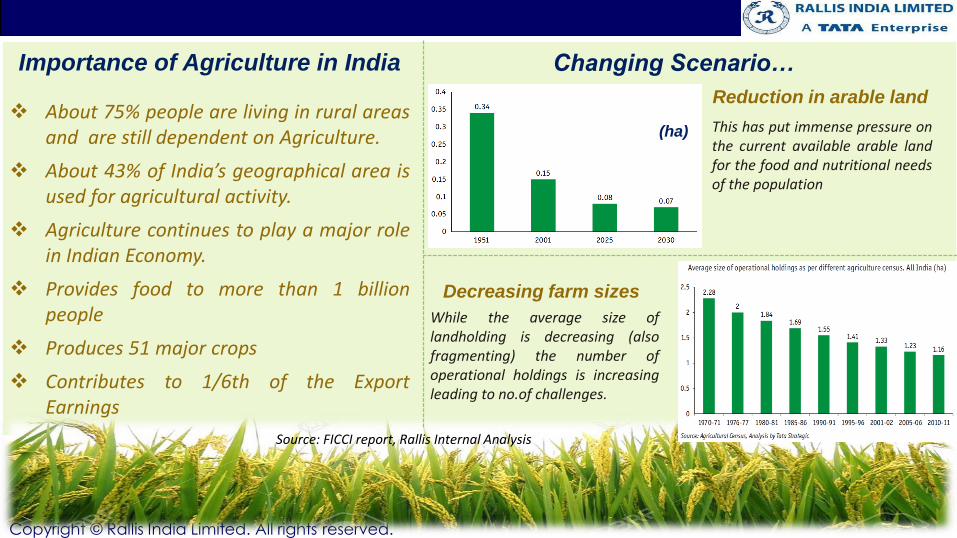
Importance of Agriculture in India
About 75% people are living in rural areasand are still dependent on Agriculture.
About 43% of India’s geographical area isused for agricultural activity.
Agriculture continues to play a major rolein Indian Economy.
Provides food to more than 1 billionpeople
Produces 51 major crops
Contributes to 1/6th of the ExportEarnings
Reduction in arable land
This has put immense pressure onthe current available arable landfor the food and nutritional needsof the population
Decreasing farm sizes
While the average size oflandholding is decreasing (alsofragmenting) the number ofoperational holdings is increasingleading to no.of challenges.
(ha)
Changing Scenario…
Source: FICCI report, Rallis Internal Analysis
Copyright © Rallis India Limited. All rights reserved.4
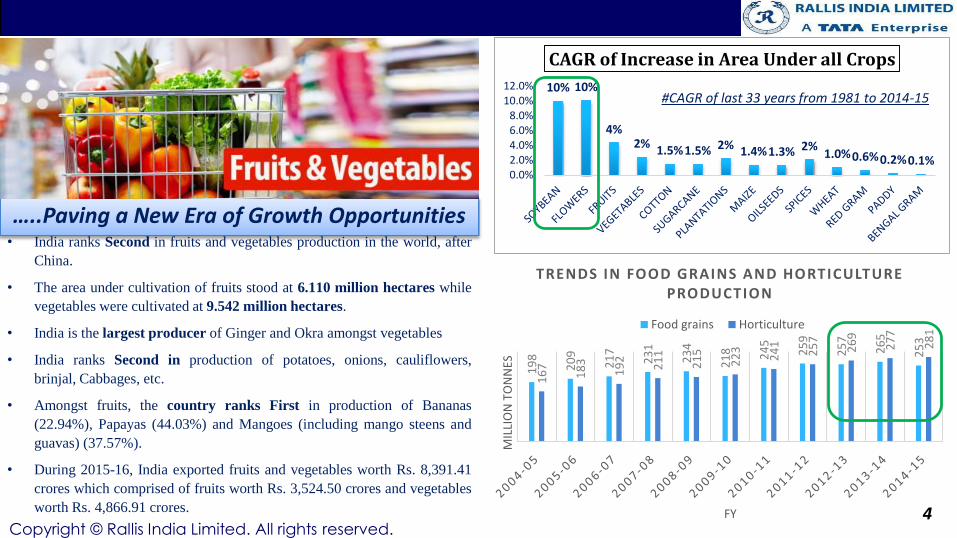
…..Paving a New Era of Growth Opportunities• India ranks Second in fruits and vegetables production in the world, after
China.
• The area under cultivation of fruits stood at 6.110 million hectares while
vegetables were cultivated at 9.542 million hectares.
• India is the largest producer of Ginger and Okra amongst vegetables
• India ranks Second in production of potatoes, onions, cauliflowers,
brinjal, Cabbages, etc.
• Amongst fruits, the country ranks First in production of Bananas
(22.94%), Papayas (44.03%) and Mangoes (including mango steens and
guavas) (37.57%).
• During 2015-16, India exported fruits and vegetables worth Rs. 8,391.41
crores which comprised of fruits worth Rs. 3,524.50 crores and vegetables
worth Rs. 4,866.91 crores.
10% 10%
4%2%
1.5%1.5% 2% 1.4%1.3% 2%1.0%0.6%0.2%0.1%
0.0%2.0%4.0%6.0%8.0%
10.0%12.0%
CAGR of Increase in Area Under all Crops
#CAGR of last 33 years from 1981 to 2014-15
19
8
20
9
21
7
23
1
23
4
21
8 24
5
25
9
25
7
26
5
25
3
16
7
18
3
19
2
21
1
21
5
22
3
24
1
25
7
26
9
27
7
28
1
MIL
LIO
N T
ON
NES
FY
TRENDS IN FOOD GRAINS AND HORTICULTURE PRODUCTION
Food grains Horticulture
Copyright © Rallis India Limited. All rights reserved.5
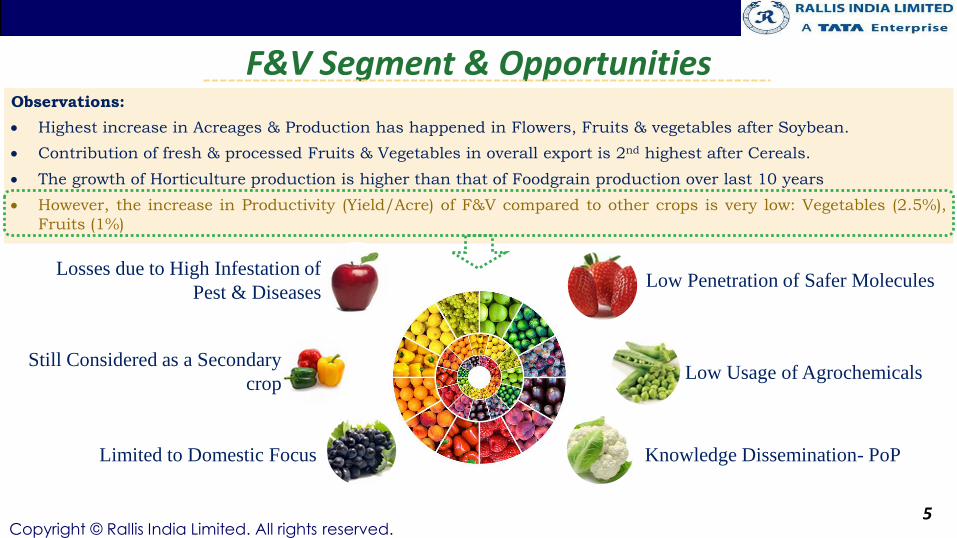
F&V Segment & OpportunitiesObservations:
Highest increase in Acreages & Production has happened in Flowers, Fruits & vegetables after Soybean.
Contribution of fresh & processed Fruits & Vegetables in overall export is 2nd highest after Cereals.
The growth of Horticulture production is higher than that of Foodgrain production over last 10 years
However, the increase in Productivity (Yield/Acre) of F&V compared to other crops is very low: Vegetables (2.5%),
Fruits (1%)
Losses due to High Infestation of
Pest & Diseases
Still Considered as a Secondary
crop
Limited to Domestic Focus
Low Penetration of Safer Molecules
Low Usage of Agrochemicals
Knowledge Dissemination- PoP
Copyright © Rallis India Limited. All rights reserved. 6
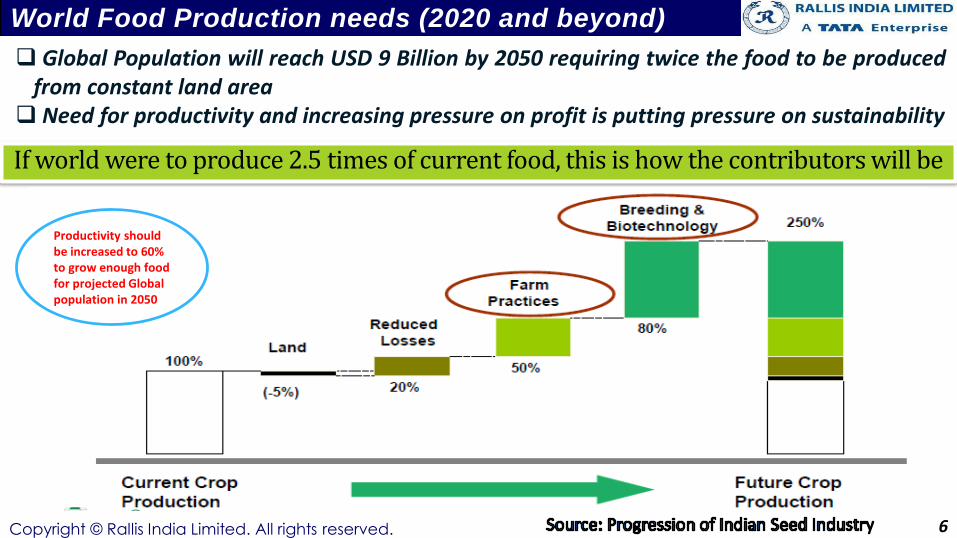
World Food Production needs (2020 and beyond)
Global Population will reach USD 9 Billion by 2050 requiring twice the food to be producedfrom constant land area
Need for productivity and increasing pressure on profit is putting pressure on sustainability
If world were to produce 2.5 times of current food, this is how the contributors will be
Productivity should be increased to 60% to grow enough food for projected Global population in 2050
Copyright © Rallis India Limited. All rights reserved. 7
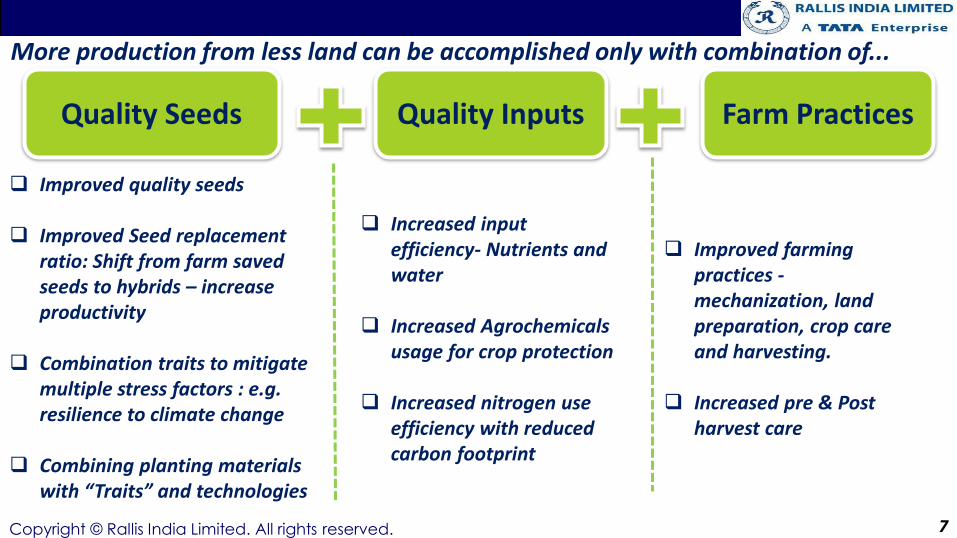
More production from less land can be accomplished only with combination of...
Improved quality seeds
Improved Seed replacement ratio: Shift from farm saved seeds to hybrids – increase productivity
Combination traits to mitigate multiple stress factors : e.g. resilience to climate change
Combining planting materials with “Traits” and technologies
Quality Seeds Quality Inputs Farm Practices
Increased input efficiency- Nutrients and water
Increased Agrochemicals usage for crop protection
Increased nitrogen use efficiency with reduced carbon footprint
Improved farming practices -mechanization, land preparation, crop care and harvesting.
Increased pre & Post harvest care
Copyright © Rallis India Limited. All rights reserved. 8
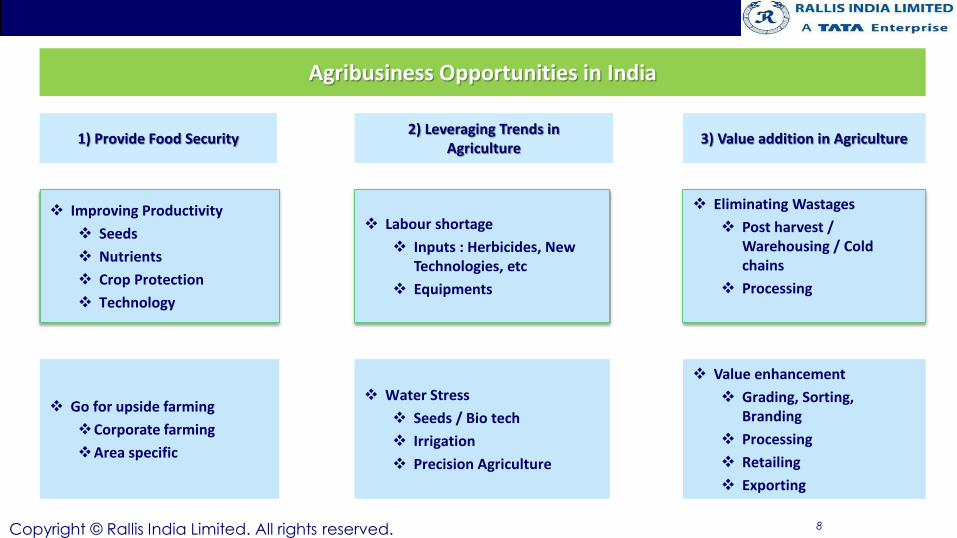
Go for upside farming
Corporate farming
Area specific
1) Provide Food Security
Improving Productivity
Seeds
Nutrients
Crop Protection
Technology
2) Leveraging Trends inAgriculture
Water Stress
Seeds / Bio tech
Irrigation
Precision Agriculture
Labour shortage
Inputs : Herbicides, New Technologies, etc
Equipments
3) Value addition in Agriculture
Value enhancement
Grading, Sorting, Branding
Processing
Retailing
Exporting
Eliminating Wastages
Post harvest / Warehousing / Cold chains
Processing
Agribusiness Opportunities in India
Improving Productivity
Seeds
Nutrients
Crop Protection
Technology
Labour shortage
Inputs : Herbicides, New Technologies, etc
Equipments
Copyright © Rallis India Limited. All rights reserved.9
Copyright © Rallis India Limited. All rights reserved.10
Copyright © Rallis India Limited. All rights reserved.11
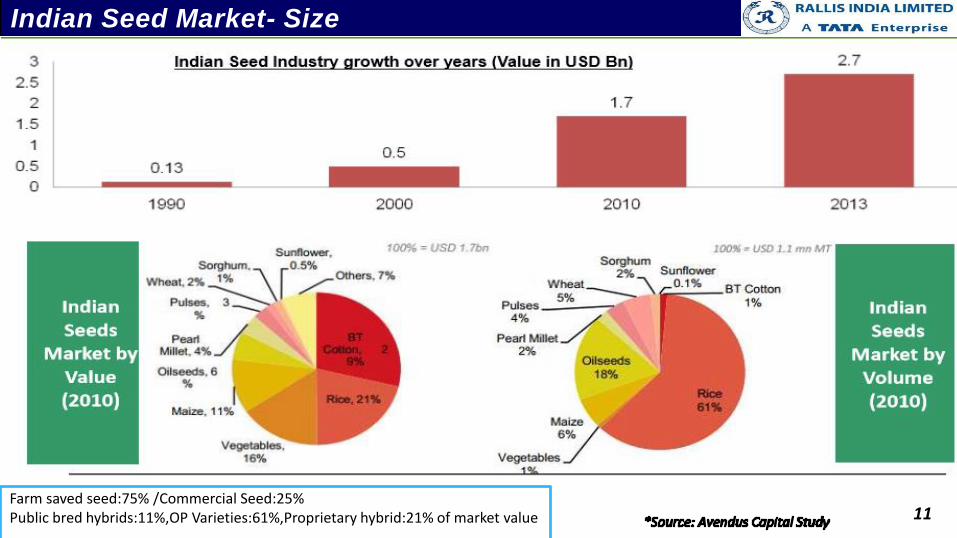
Indian Seed Market- Size
Farm saved seed:75% /Commercial Seed:25%Public bred hybrids:11%,OP Varieties:61%,Proprietary hybrid:21% of market value
Copyright © Rallis India Limited. All rights reserved.12
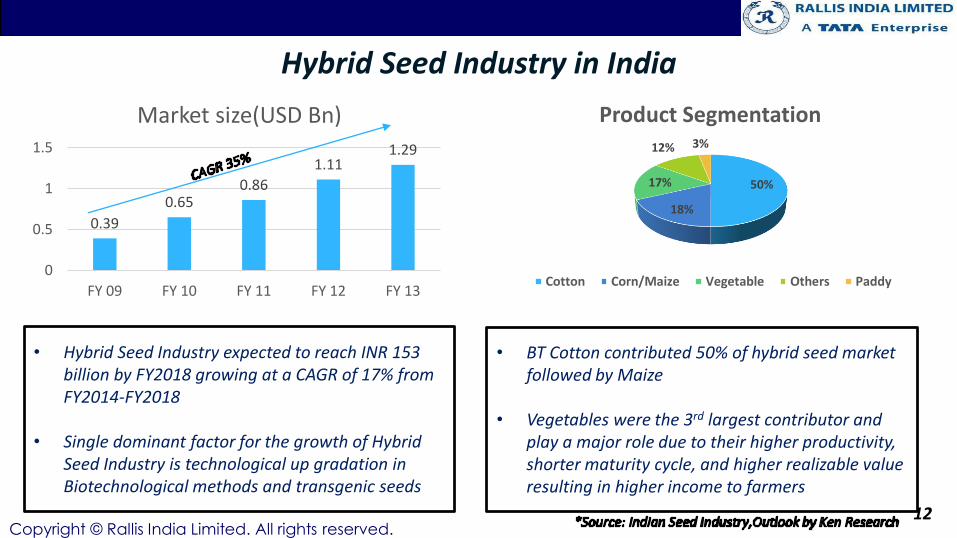
Hybrid Seed Industry in India
• Hybrid Seed Industry expected to reach INR 153 billion by FY2018 growing at a CAGR of 17% from FY2014-FY2018
• Single dominant factor for the growth of Hybrid Seed Industry is technological up gradation in Biotechnological methods and transgenic seeds
• BT Cotton contributed 50% of hybrid seed market followed by Maize
• Vegetables were the 3rd largest contributor and play a major role due to their higher productivity, shorter maturity cycle, and higher realizable value resulting in higher income to farmers
50%
18%
17%
12% 3%
Product Segmentation
Cotton Corn/Maize Vegetable Others Paddy
0.39
0.650.86
1.111.29
0
0.5
1
1.5
FY 09 FY 10 FY 11 FY 12 FY 13
Market size(USD Bn)
Copyright © Rallis India Limited. All rights reserved.
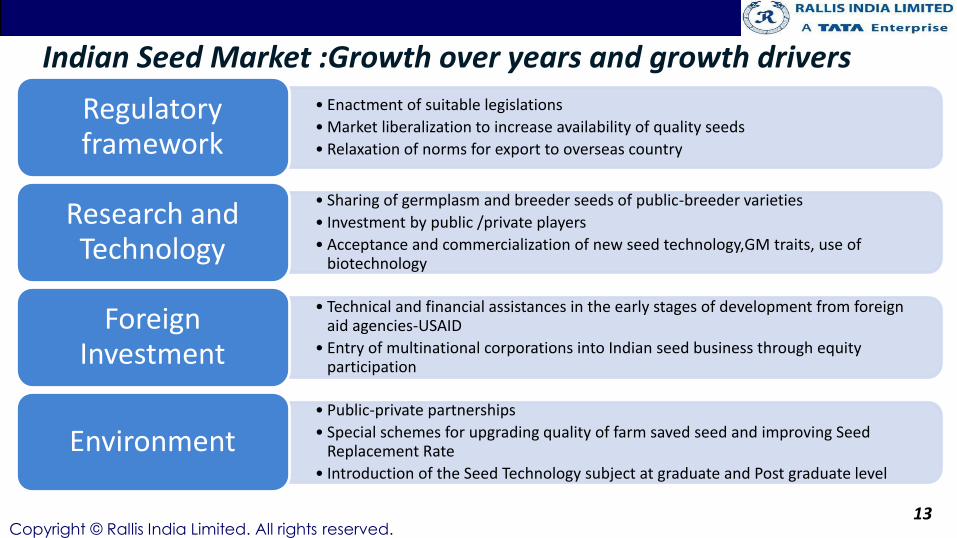
• Enactment of suitable legislations
• Market liberalization to increase availability of quality seeds
• Relaxation of norms for export to overseas country
Regulatory framework
• Sharing of germplasm and breeder seeds of public-breeder varieties
• Investment by public /private players
• Acceptance and commercialization of new seed technology,GM traits, use of biotechnology
Research and Technology
• Technical and financial assistances in the early stages of development from foreign aid agencies-USAID
• Entry of multinational corporations into Indian seed business through equity participation
Foreign Investment
• Public-private partnerships
• Special schemes for upgrading quality of farm saved seed and improving Seed Replacement Rate
• Introduction of the Seed Technology subject at graduate and Post graduate level
Environment
13
Indian Seed Market :Growth over years and growth drivers
Copyright © Rallis India Limited. All rights reserved.14
Copyright © Rallis India Limited. All rights reserved.15
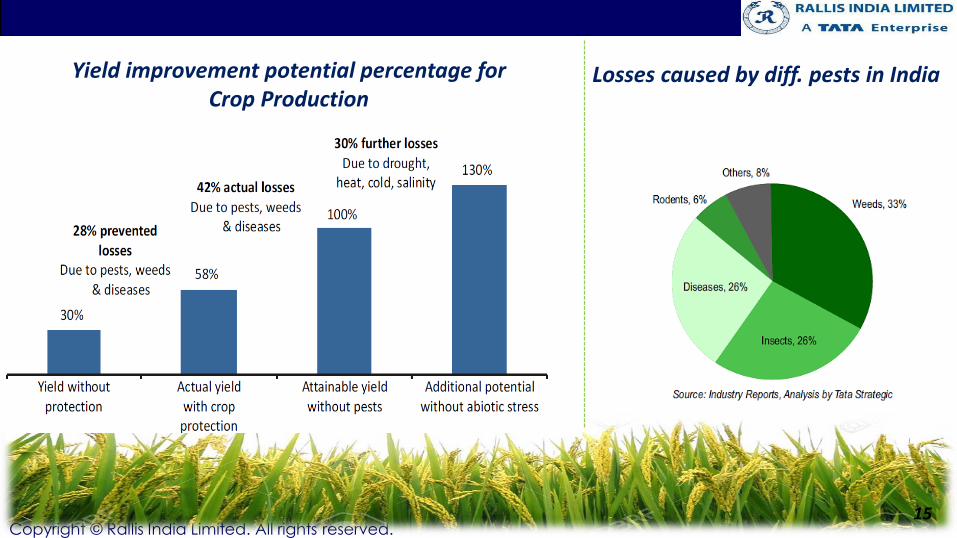
Yield improvement potential percentage for Crop Production
Losses caused by diff. pests in India
Copyright © Rallis India Limited. All rights reserved.
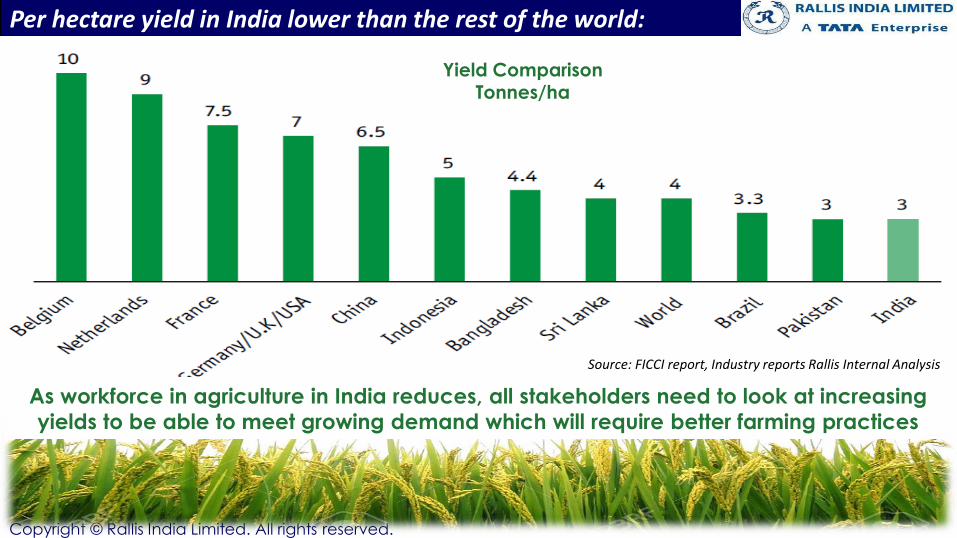
Per hectare yield in India lower than the rest of the world:
Yield ComparisonTonnes/ha
As workforce in agriculture in India reduces, all stakeholders need to look at increasing
yields to be able to meet growing demand which will require better farming practices
Source: FICCI report, Industry reports Rallis Internal Analysis
Copyright © Rallis India Limited. All rights reserved.17
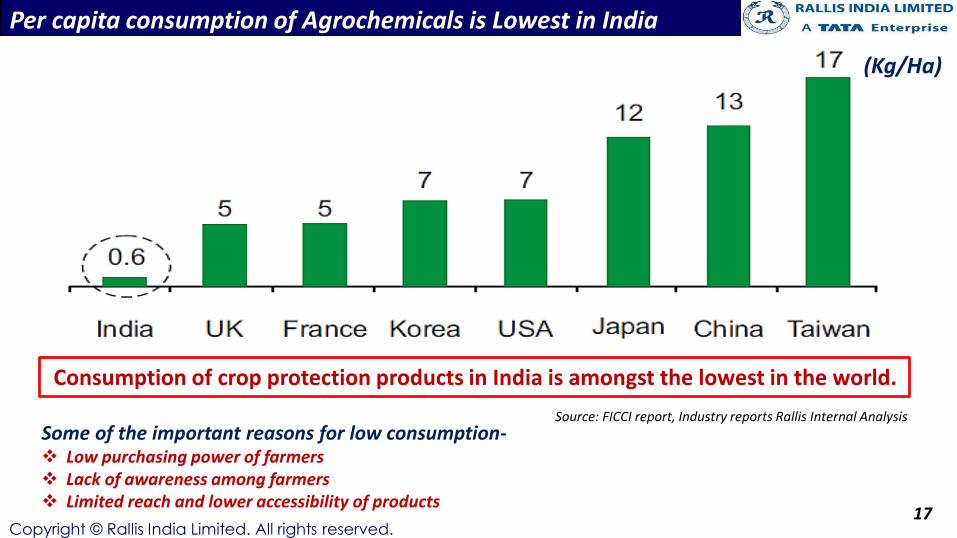
Some of the important reasons for low consumption- Low purchasing power of farmers Lack of awareness among farmers Limited reach and lower accessibility of products
Consumption of crop protection products in India is amongst the lowest in the world.
Per capita consumption of Agrochemicals is Lowest in India
(Kg/Ha)
Source: FICCI report, Industry reports Rallis Internal Analysis
Copyright © Rallis India Limited. All rights reserved. 18
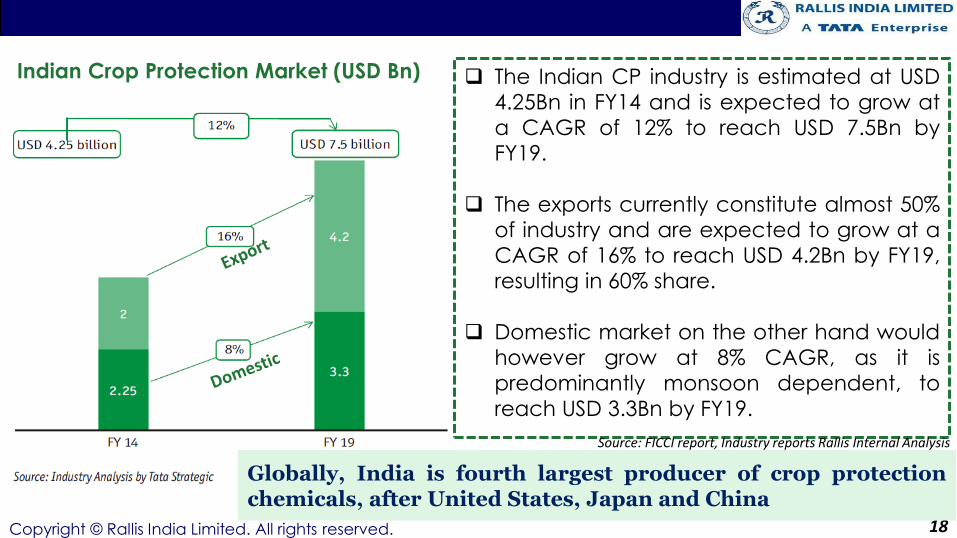
Indian Crop Protection Market (USD Bn) The Indian CP industry is estimated at USD
4.25Bn in FY14 and is expected to grow at
a CAGR of 12% to reach USD 7.5Bn by
FY19.
The exports currently constitute almost 50%
of industry and are expected to grow at a
CAGR of 16% to reach USD 4.2Bn by FY19,
resulting in 60% share.
Domestic market on the other hand would
however grow at 8% CAGR, as it is
predominantly monsoon dependent, to
reach USD 3.3Bn by FY19.
Globally, India is fourth largest producer of crop protectionchemicals, after United States, Japan and China
Source: FICCI report, Industry reports Rallis Internal Analysis
Copyright © Rallis India Limited. All rights reserved.19
Asia share in the global chemical industry is at 45% share.
With Asia’s growing contribution to the global chemical industry, China and India emerge as one of the focus destination.
Make in India concept mooted by Government of India along with initiatives by Indian industry bodies would result in Indian chemical industry to grow at 11% p.a.
High end use demand, improved export competitiveness could lead to a growth rate of 15% and size of USD 290 billion by 2017. (Global industry is 6%)
India has tremendous potential yet to be leveraged.
India in Contract Manufacturing
Opportunity for Manufacturers

Copyright © Rallis India Limited. All rights reserved.20
Copyright © Rallis India Limited. All rights reserved.
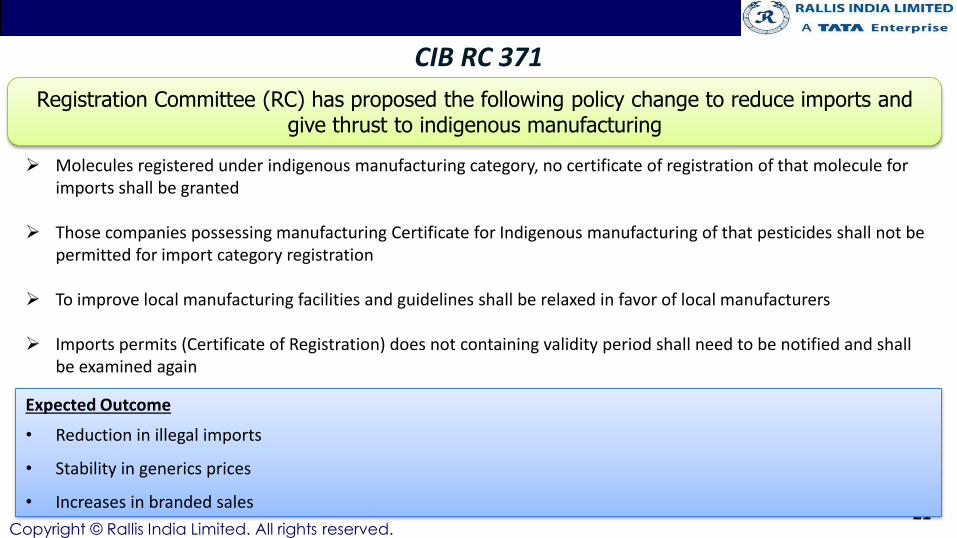
CIB RC 371
21
Registration Committee (RC) has proposed the following policy change to reduce imports and give thrust to indigenous manufacturing
Molecules registered under indigenous manufacturing category, no certificate of registration of that molecule for imports shall be granted
Those companies possessing manufacturing Certificate for Indigenous manufacturing of that pesticides shall not be permitted for import category registration
To improve local manufacturing facilities and guidelines shall be relaxed in favor of local manufacturers
Imports permits (Certificate of Registration) does not containing validity period shall need to be notified and shall be examined again
Expected Outcome
• Reduction in illegal imports
• Stability in generics prices
• Increases in branded sales
Copyright © Rallis India Limited. All rights reserved.22
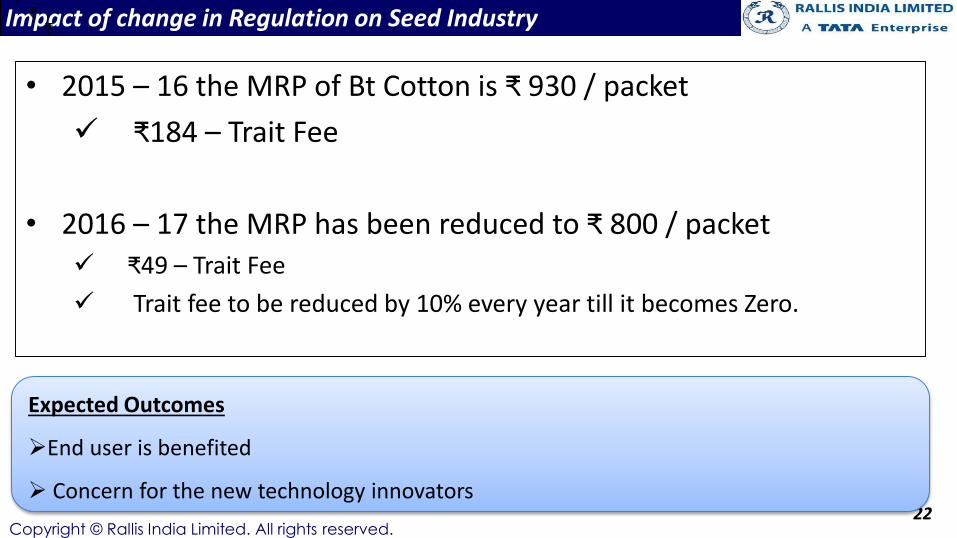
Impact of change in Regulation on Seed Industry
• 2015 – 16 the MRP of Bt Cotton is ₹ 930 / packet
₹184 – Trait Fee
• 2016 – 17 the MRP has been reduced to ₹ 800 / packet ₹49 – Trait Fee
Trait fee to be reduced by 10% every year till it becomes Zero.
Expected Outcomes
End user is benefited
Concern for the new technology innovators
Copyright © Rallis India Limited. All rights reserved.23
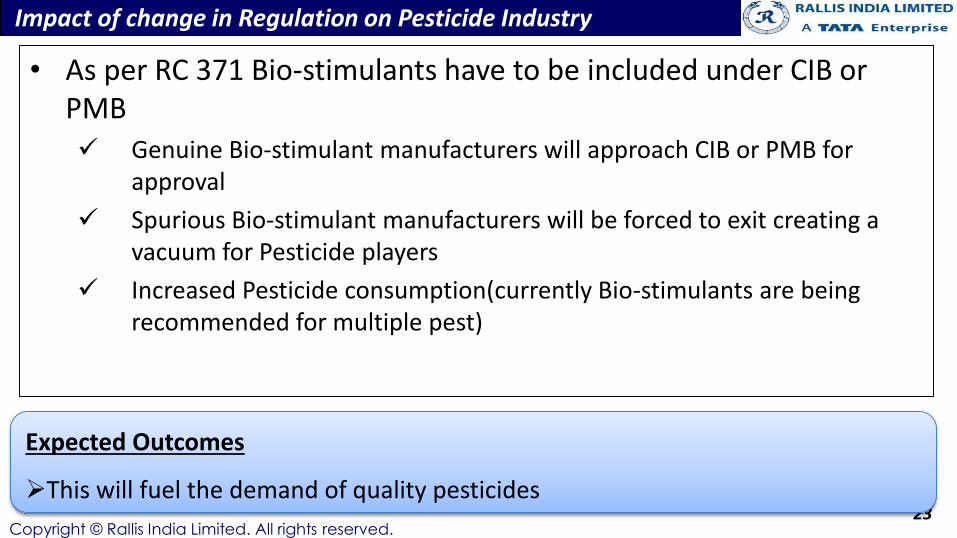
Impact of change in Regulation on Pesticide Industry
• As per RC 371 Bio-stimulants have to be included under CIB or PMB Genuine Bio-stimulant manufacturers will approach CIB or PMB for
approval
Spurious Bio-stimulant manufacturers will be forced to exit creating a vacuum for Pesticide players
Increased Pesticide consumption(currently Bio-stimulants are being recommended for multiple pest)
Expected Outcomes
This will fuel the demand of quality pesticides
Copyright © Rallis India Limited. All rights reserved.24
Copyright © Rallis India Limited. All rights reserved.25
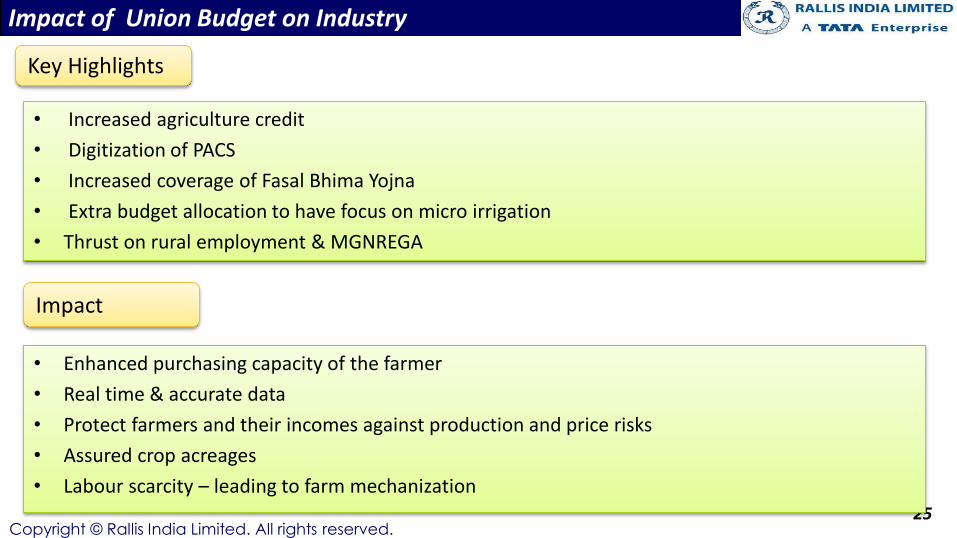
Impact of Union Budget on Industry
• Increased agriculture credit
• Digitization of PACS
• Increased coverage of Fasal Bhima Yojna
• Extra budget allocation to have focus on micro irrigation
• Thrust on rural employment & MGNREGA
Key Highlights
Impact
• Enhanced purchasing capacity of the farmer
• Real time & accurate data
• Protect farmers and their incomes against production and price risks
• Assured crop acreages
• Labour scarcity – leading to farm mechanization
Copyright © Rallis India Limited. All rights reserved.26
Shift from Agriculture to Agribusiness
Copyright © Rallis India Limited. All rights reserved.
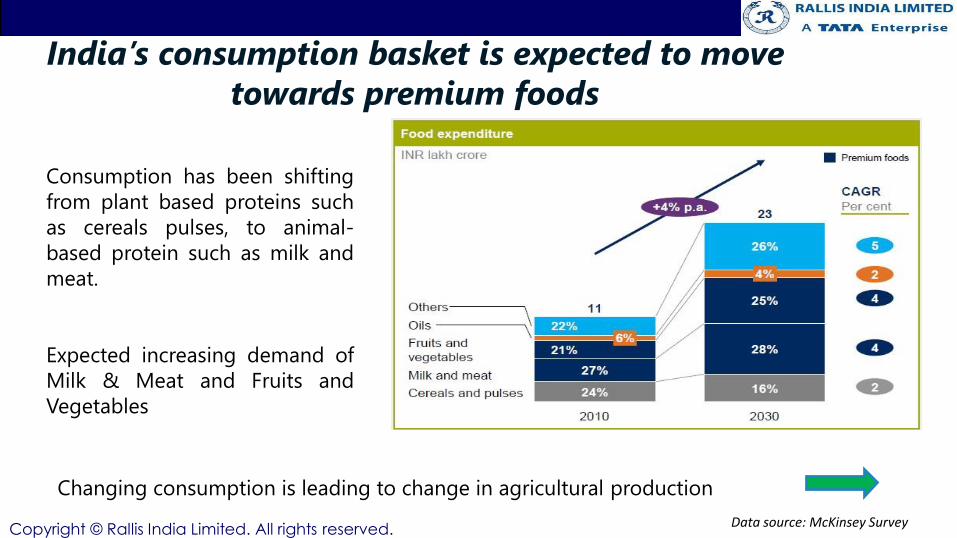
India’s consumption basket is expected to move
towards premium foods
Data source: McKinsey Survey
Consumption has been shifting
from plant based proteins such
as cereals pulses, to animal-
based protein such as milk and
meat.
Expected increasing demand of
Milk & Meat and Fruits and
Vegetables
Changing consumption is leading to change in agricultural production
Copyright © Rallis India Limited. All rights reserved.
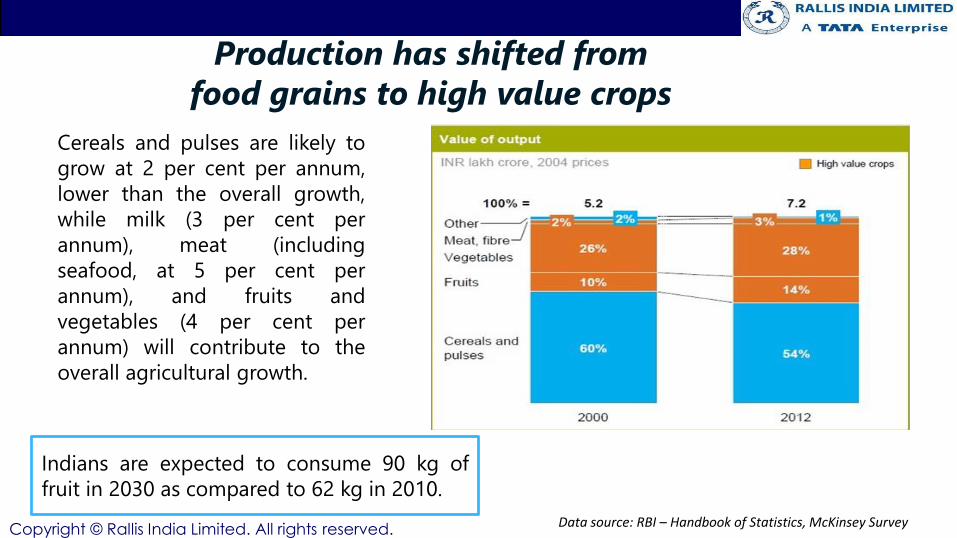
Production has shifted from
food grains to high value crops
Cereals and pulses are likely to
grow at 2 per cent per annum,
lower than the overall growth,
while milk (3 per cent per
annum), meat (including
seafood, at 5 per cent per
annum), and fruits and
vegetables (4 per cent per
annum) will contribute to the
overall agricultural growth.
Data source: RBI – Handbook of Statistics, McKinsey Survey
Indians are expected to consume 90 kg of
fruit in 2030 as compared to 62 kg in 2010.
Copyright © Rallis India Limited. All rights reserved.
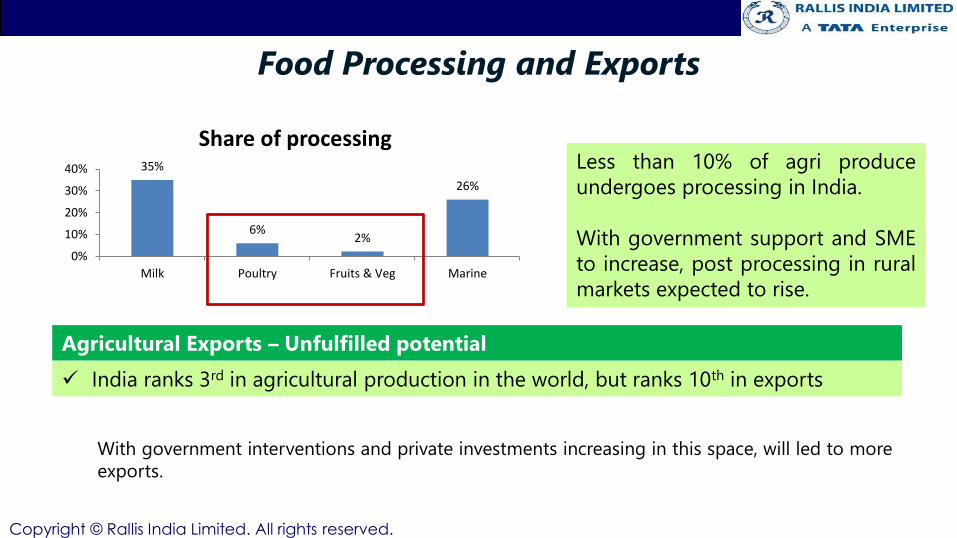
Food Processing and Exports
35%
6%2%
26%
0%
10%
20%
30%
40%
Milk Poultry Fruits & Veg Marine
Share of processingLess than 10% of agri produce
undergoes processing in India.
With government support and SME
to increase, post processing in rural
markets expected to rise.
India ranks 3rd in agricultural production in the world, but ranks 10th in exports
With government interventions and private investments increasing in this space, will led to more
exports.
Agricultural Exports – Unfulfilled potential
Copyright © Rallis India Limited. All rights reserved.30
Changing Needs and Trends in Agriculture
Copyright © Rallis India Limited. All rights reserved.
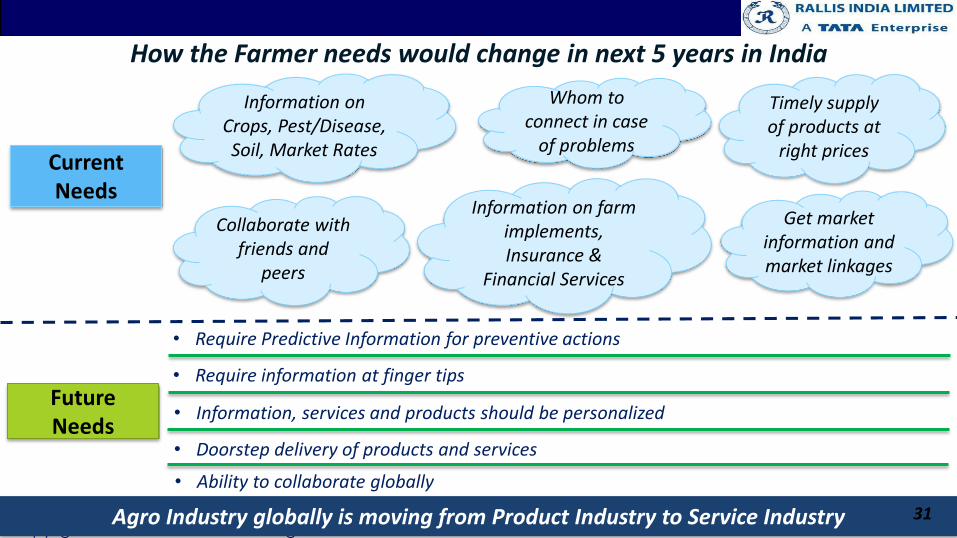
How the Farmer needs would change in next 5 years in India
Current Needs
Information on Crops, Pest/Disease, Soil, Market Rates
Whom to connect in case
of problems
Timely supply of products at
right prices
Collaborate with friends and
peers
Information on farm implements, Insurance &
Financial Services
Get market information and market linkages
Future Needs
• Require Predictive Information for preventive actions
Agro Industry globally is moving from Product Industry to Service Industry
• Require information at finger tips
• Information, services and products should be personalized
• Doorstep delivery of products and services
• Ability to collaborate globally
31
Copyright © Rallis India Limited. All rights reserved.
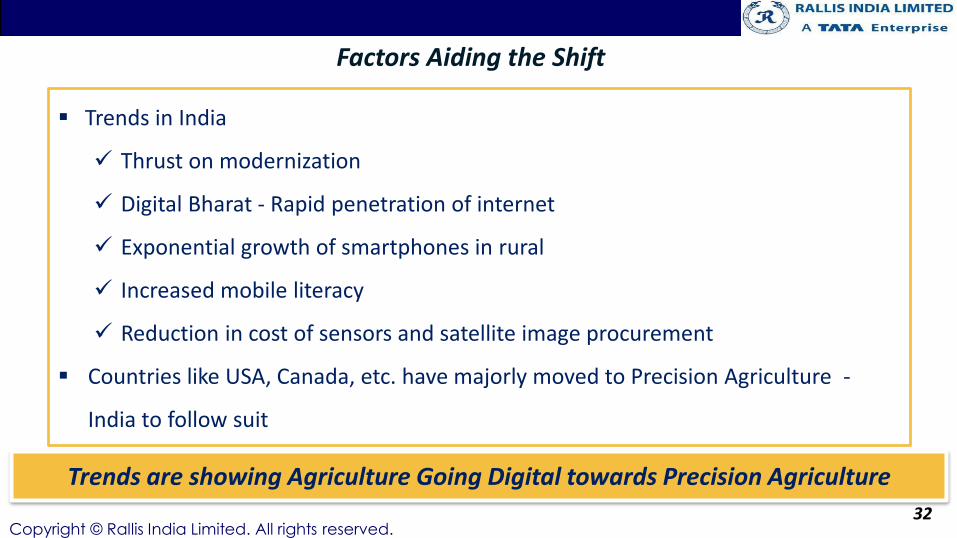
Trends in India
Thrust on modernization
Digital Bharat - Rapid penetration of internet
Exponential growth of smartphones in rural
Increased mobile literacy
Reduction in cost of sensors and satellite image procurement
Countries like USA, Canada, etc. have majorly moved to Precision Agriculture -
India to follow suit
Trends are showing Agriculture Going Digital towards Precision Agriculture
Factors Aiding the Shift
32
Copyright © Rallis India Limited. All rights reserved.33
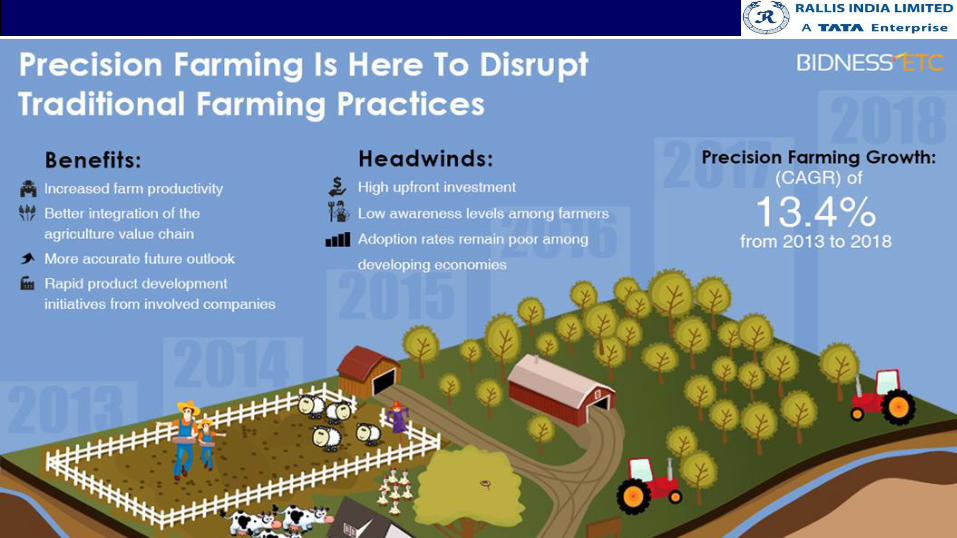
Precision Farming
Copyright © Rallis India Limited. All rights reserved.34
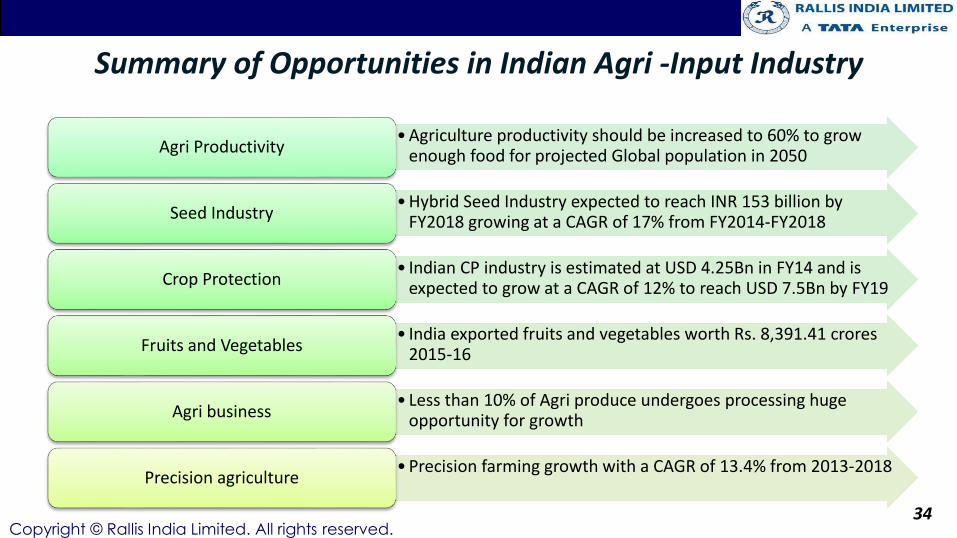
Summary of Opportunities in Indian Agri -Input Industry
• Agriculture productivity should be increased to 60% to grow enough food for projected Global population in 2050Agri Productivity
• Hybrid Seed Industry expected to reach INR 153 billion by FY2018 growing at a CAGR of 17% from FY2014-FY2018Seed Industry
• Indian CP industry is estimated at USD 4.25Bn in FY14 and is expected to grow at a CAGR of 12% to reach USD 7.5Bn by FY19Crop Protection
• India exported fruits and vegetables worth Rs. 8,391.41 crores 2015-16Fruits and Vegetables
• Less than 10% of Agri produce undergoes processing huge opportunity for growthAgri business
• Precision farming growth with a CAGR of 13.4% from 2013-2018Precision agriculture

Copyright © Rallis India Limited. All rights reserved.35