Embed Size (px)
Citation preview
Development towards an efficient and sustainable biofuel drying


Acta Wexionensia No 175/2009 School of Technology and Design
Development towards an efficientand sustainable biofuel drying
Peter Bengtsson
Växjö University Press

Development towards an efficient and sustainable biofuel drying. Thesis for the degree of Doctor of Philosophy, Växjö University, Sweden 2009.
Series editor: Kerstin Brodén ISSN: 1404-4307 ISBN: 978-91-7636-659-2Printed by: Intellecta Infolog, Göteborg 2009

AbstractBengtsson, Peter, (2009). Development towards an efficient and sustainable bio-fuel drying. Acta Wexionensia No 175/2009. ISSN: 1404-4307, ISBN: 978-91-7636-659-2. Written in English.
The usage of biofuel as well as wood fuel has increased in Sweden and all of Europe dur-ing recent decades, and there are several reasons to believe that this increase will con-tinue. An important reason for this increase is that the environmental and climate prob-lems caused by fossil fuels are becoming even more evident. By replacing fossil fuel with biofuel, the problem of emissions from, among others carbon dioxide and sulphur com-pounds can be alleviated. However, substitution requires in many cases high quality proc-essed biofuel. An early stage in the processing of biofuel is drying. Previous work treats the possibility of drying wood fuel in an efficient and environmentally sustainable man-ner.
This thesis studies the bed drying technique, conducted both experimentally and through modeling of the drying process. The experimental work is based on continuous temperature measurements in the fuel bed and provides characteristics of the drying zone that develops in the bed during drying. The character of the drying zone is affected by both the qualities of the fuel and the operating parameters, and is decisive regarding the possibility of making the drying more efficient, i.e. optimize the usage of energy and pro-duce a fuel with low and homogeneous moisture content.
A mathematical simulation model has been developed to increase the understanding of bed drying. The model is based on fundamental physical principles and is made up of five differential equations that describe vapor flow, air flow, the fuel’s moisture content, and the bed’s pressure and temperature. The modeling work complements the experimental work and a simulation of the temperature distribution, pressure and the drying zone’s dis-persion is in agreement with the experimental result.
The drying of wood can signify an environmental and human health risk, since volatile organic compounds (VOC) are emitted during drying. The thesis studies these emissions with regards to type and quantity. The measurements show that the majority of the emit-ted compounds from Norway spruce and Scots pine are volatile monoterpenes, but also that other compounds are emitted, especially higher terpenes. Further, major differences between how the compounds are emitted and the quantities of the emitted compounds from heartwood and sapwood are shown. There are also large differences between types of wood, i.e. spruce and pine. It can be stated that both emission rate and total amount of emitted compounds increase with an increase in temperature.
To reduce VOC emissions, the drying temperature should be maintained low. To de-velop an efficient bed drying process for wood biofuels, additional parameters must be analyzed further and weighed against each other. Based on the experimental method and the simulation model presented here, the drying can be optimized towards a more efficient use of thermal energy and a low and even moisture content in the dried biofuel.
Keywords: biomass, bioenergy, drying, bed drying, drying zone, modeling, VOC, ter-penes, wood fuels, wood chips, sawdust, Norway spruce, Scots pine


To the two greatest researchers in the family,
Livia and Ludvig, and their mother.

Preface The present thesis concerns the work and results from two research projects
conducted between 2001 to 2004 and 2005 to 2008.
The first project Environmentally-friendly wood drying was initiated by the Swedish Wood Association after the release of hydrocarbon was observed during the 1990s. What level the wood industry actually affects the environment came into question. The aim of the project was to investigate the composition and elucidate the extensiveness of the hydrocarbon release, partly regarding the qualities of the dried materials, partly regarding the drying conditions. This project resulted in two scientific works (papers I and II).
The second project is part of the CHRISGAS project, financed by the Swedish Energy Agency and the European Commissions Seventh Framework Programme. The aim of the CHRISGAS project is to demonstrate the production of synthesis gas through the gasification of biomass. The process requires a dry raw material. The aim of the second project was thus to develop the bed drying technique towards efficient drying for biofuel which prepares the fuel for gasification. This project resulted in four scientific works (papers III, IV, V and VI).
I would like to express my gratitude to my supervisor, Professor Thomas
Thörnqvist for believing in my work all these years, and for giving me the opportunity to finally complete my thesis. I am most grateful to Professor Johan Claesson who acted as my supervisor during the second project. I thank you for your engagement, patience and all our fruitful discussions. Olle Wennberg from S.E.P. Scandinavian Energy Project AB is acknowledged for sharing his experience and for putting the work into both a scientific and industrial context.
I would like to thank all my colleagues and friends of the school of
Technology and Design for these inspiring years and my new colleagues at Andritz Fiber Drying AB for their patience and for overlooking my sometimes confused and absent state. I would also thank Professor Mehri Sanati, my former supervisor, for introducing me into the field of science and Professor Dick Sandberg for his scientific input and support during the last long months.
Finally, and most of all, I thank my parents and the loves of my life, Karolina, Livia and Ludvig. Without You Karolina, none of this would have been possible. Without You, Livia and Ludvig, life would be less noisy but extremely empty!

Appended papers This thesis is based on the following publications and refers to their roman
numerals.
Paper I. Bengtsson P., Sanati M. (2004). Evaluation of hydrocarbon emissions from heart- and sapwood of Scots pine using a laboratory-scale wood drier. Holzforschung, vol 58, 660-665.
Paper II. Bengtsson, P. (2004). The release of hydrocarbons from
softwood drying: Measurement and modeling. Maderas: Ciencia y Tecnologia, 6, 109–122.
Paper III. Bengtsson, P. (2008). Experimental analysis of low-temperature
bed drying of wooden biomass particles. Drying Technology, 26(5): 602-610.
Paper IV. Bengtsson P., Claesson J. (2008). Measurement and modeling of
drying for pellet production. Conference proceeding of the 8th Nordic Symposium on building physics (NSB 2008). Copenhagen, Denmark, 16-18 June 2008. Vol. 2, 999-1006.
Paper V. Bengtsson P., Claesson J. (2009). Modeling the drying of porous
material Detailed report. Växjö University, School of Technology and Design, Report no. 50, ISBN 978-91-7636-654-7.
Paper VI. Bengtsson P., Wennberg O. Experimental approach towards
optimization of a biomass bed dryer. Submitted for publication in Biomass & Bioenergy.
Papers I-IV are referee-reviewed articles and conference submissions. Paper
V is a detailed study and mostly likely too comprehensive to publish as a normal scientific article. Paper VI is submitted to a scientific journal as this thesis is being printed.

Author’s contribution to appended papers
Paper I. Bengtsson planned and performed the experimental work, evaluated and analyzed the data and wrote the article.
Paper II. The paper is a revision of a conference proceeding presented at
the 14th International Drying Symposium (Bengtsson and Sanati, 2004). Bengtsson planned and performed the experimental and theoretical work, and wrote the contribution to the conference. Bengtsson presented the contribution as an oral presentation. The Paper was pre-selected for Maderas: Ciencia y Tecnologia journal. Bengtsson developed the work and rewrote the conference proceeding to an article.
Paper III. Authors work.
Paper IV. Bengtsson initiated the work, contributed to the development of
the model. The authors performed the analysis and wrote the paper together. Bengtsson presented the contribution as an oral presentation
Paper V. Bengtsson initiated the work, contributed to the development of
the model. The authors performed the analysis and wrote the paper together.
Paper VI. Wennberg initiated the work. Bengtsson performed the
experimental work. The authors performed the analysis and wrote the paper together.


5
Contents Introduction........................................................................................................... 7
Biomass and biofuels................................................................................ 7 The use of biofuel in Sweden ................................................................... 8 Why dry biofuel? .................................................................................... 10 VOC emissions from wood drying ......................................................... 11 Purpose and Research questions ............................................................. 13 Limitations.............................................................................................. 13 Short presentation of appended papers ................................................... 13
Bed drying of biofuel (RQ 1 and RQ 2)............................................................. 17 The bed drying process........................................................................... 18 Experimental........................................................................................... 22 Modelling the bed drying process........................................................... 23
Moisture in wood fuel ................................................................ 24 Intrinsic moisture transfer .......................................................... 26 Mass and energy flow ................................................................ 26 Balance equations....................................................................... 27
Results and discussion of RQ 1 and RQ 2 .............................................. 28 Emissions of VOC from wood drying (RQ 3) .................................................... 33
Extractives in softwood .......................................................................... 33 Water transport in softwood ................................................................... 34 VOC emitted from softwood during drying............................................ 35 Experimental........................................................................................... 38
Drying equipment....................................................................... 38 SPME ......................................................................................... 38 GC/MS ....................................................................................... 40 FID ............................................................................................. 41
Results and discussion of RQ 3 .............................................................. 41 Final discussion................................................................................................... 47 Conclusions......................................................................................................... 49 Further work........................................................................................................ 51 References........................................................................................................... 53

6
7
Introduction
Biomass and biofuels Material that originates from organic material, i.e. included or has been
included in living organisms is called biomass (according to Swedish Standard SS 187106). Organic material stored for a long time or converted to fossil is not included in this group. Biomass is formed during plant photosynthesis, where carbon dioxide, water and the sun’s energy make the carbohydrates that build up the material. The sun’s energy, which is bound chemically in the biomass, is released again when the biomass breaks down. If the purpose of the biomass is to release and use the chemically bound energy, the biomass is then called biofuel.
For Sweden, residuals from the forest, wood and pulp industries are the
largest source of biofuel production. Of these, the majority is so-called wood fuel, i.e. fuel whose origins come from primary wood materials, but have not undergone any chemical processing. Recycled paper and pulp industry energy-rich black liquor are not included. Wood fuel is divided into primary forest fuel, such as smaller trees, branches, tops and stumps, industrial bi-products, such as bark, sawdust, planing shavings and chips, recycled wood fuel, i.e. demolition wood, formwork and packaging, and energy forest that is a fast growing forest specially cultivated for the extraction of energy.
With their various origins, the different fuels understandably have different
characteristics and qualities. A very important characteristic is the moisture content. During logging, logging residuals have the moisture content of the standing tree, which is normally between 45 and 55% based on wet weight (wb). In bark, the average moisture content is between 55 and 60% (wb). Sawdust and wood chips often have moisture contents slightly under 50% (wb). This means that approximately half of the fuel’s weight is made of (from an energy standpoint) useless water. Planer shavings from planing and recycled wood fuel have already undergone drying and are therefore much drier (5-15% wb). Depending on the type of wood, weather, season and storage, the moisture content of non-dried fuel can at the least vary substantially.
Both average moisture content and variation in moisture content of the material are qualities significant in determining the fuel’s quality and its continued usage.

8
The present thesis discusses the drying of wood fuel sawdust and wood chips, for which a part is on the quality of the dried fuel. A particular focus is placed on the most common Swedish wood species, Norway spruce.
The use of biofuel in Sweden From Sweden’s total energy supply of 624 TWh in 2007, oil and nuclear
energy represented the largest shares (STEM, 2008a). The usage of bioenergy is today approximately 124 TWh (ca. 20%) and has more than doubled since the 1970s. That the usage of biofuel has successively increased during the last 30 years depends on, among others, the introduction of an active energy policy for a shift to a sustainable energy system.
Biofuel is included in the natural cycle and is therefore neutral from carbon
dioxide, i.e. the amount of carbon dioxide that forms during combustion of the fuel will eventually balance through nature’s own growth.
There are reasons to believe that biofuel usage will continue to increase, partly
because questions about the environment and climate are more current today (according to EEA (2004) the emissions of CO2 is expected to increase), partly because there is a definite potential for an increased withdrawal of bioenergy (Parikka, 2004).
As an overall aim, Europe wants to attain a 20% usage of renewable energy
by the years 2020. To reach this goal, Sweden should, according to proposals from the European Commission, increase its usage from today’s approximately 40% to 49% by 2020. For this to be successful, we have to make use of renewable energy sources in the best possible manner. For biofuel, this means processing it in a manner that yields a greater positive environmental effect than unprocessed.
The most reasonable is try and change it or those sectors where the
environmental and climate affects and the usage of fossil fuel is greatest, e.g. the transport sector (STEM, 2008a). In this sector, the share of fossil fuel is 98%, with a marginal share of renewable fuel (Figure 1) and carbon dioxide release very high (Figure 2).
9
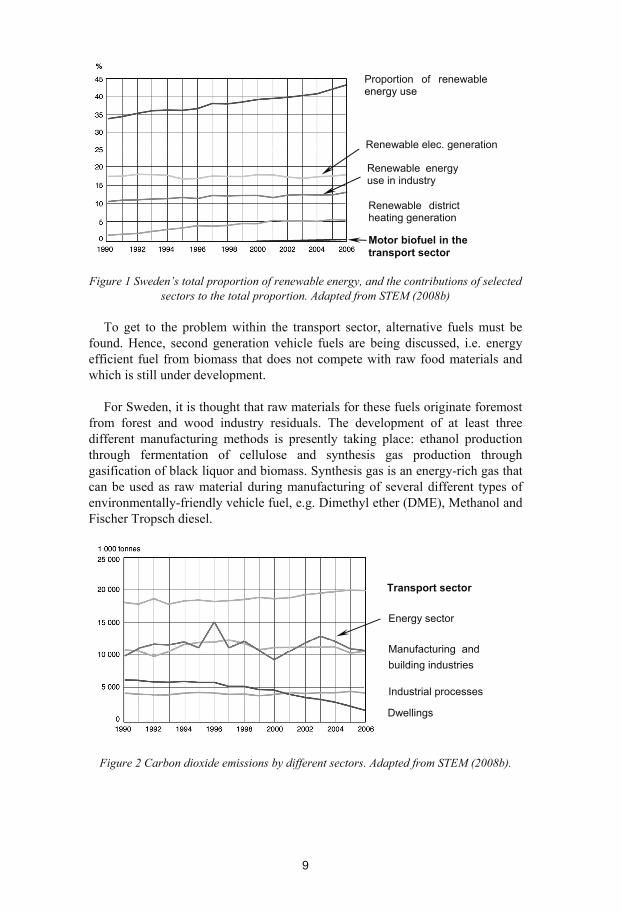
Figure 1 Sweden’s total proportion of renewable energy, and the contributions of selected
sectors to the total proportion. Adapted from STEM (2008b)
To get to the problem within the transport sector, alternative fuels must be found. Hence, second generation vehicle fuels are being discussed, i.e. energy efficient fuel from biomass that does not compete with raw food materials and which is still under development.
For Sweden, it is thought that raw materials for these fuels originate foremost
from forest and wood industry residuals. The development of at least three different manufacturing methods is presently taking place: ethanol production through fermentation of cellulose and synthesis gas production through gasification of black liquor and biomass. Synthesis gas is an energy-rich gas that can be used as raw material during manufacturing of several different types of environmentally-friendly vehicle fuel, e.g. Dimethyl ether (DME), Methanol and Fischer Tropsch diesel.
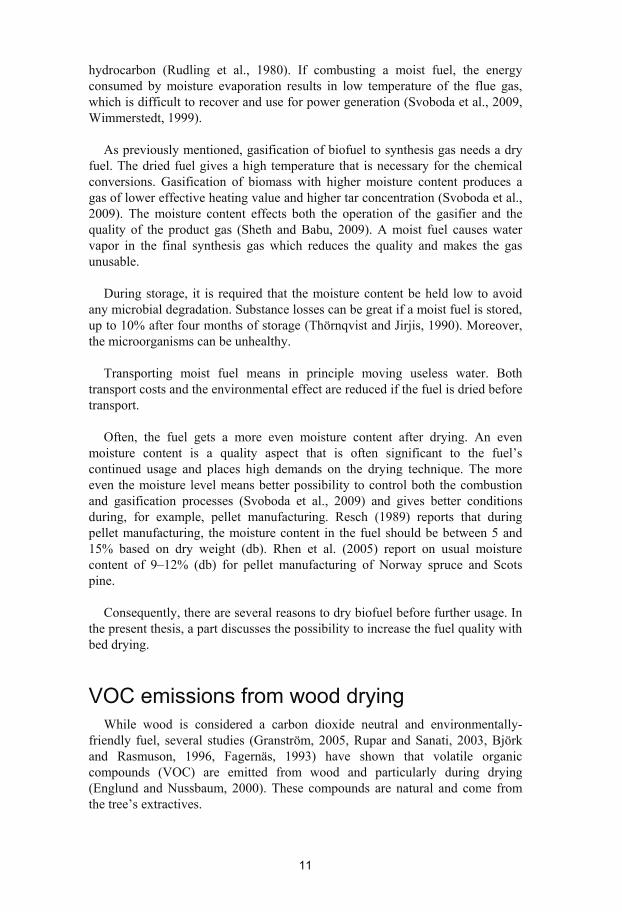
Figure 2 Carbon dioxide emissions by different sectors. Adapted from STEM (2008b).
Transport sector
Energy sector
Manufacturing and building industries
Dwellings
Industrial processes
Proportion of renewable energy use
Renewable elec. generation
Renewable energy use in industry
Motor biofuel in the transport sector
Renewable district heating generation

10
Which manufacturing method and which fuel will be used in the future is not really the most important issue and this is something that can only be speculated upon today. Development is continuing and eventually, there will not be only one manufacturing method and fuel, but several. Here, it is important to realize that raw biofuel cannot only be used to produce heat and electricity, but can be refined further and used for greater purposes, e.g. as motor fuel for vehicles.
A large part of the work in the present thesis has been done within the framework for the CHRISGAS project (Clean Hydrogen Rich Synthesis Gas). The CHRISGAS project is concerned with gasifying biofuel to synthesis gas. The manufacturing requires a dry raw material; hence, drying of the biofuel is initially necessary.
Since the gasification process itself is very energy intensive, all steps in the process must be optimized for energy consumption. For the drying, a technique efficiently using low-grade energy in the form of waste heat has been suggested. Waste heat at low temperatures is often available in industries where the manufacturing of raw biofuel occurs (Ingman et al., 2007, Olsson et al., 2003). Furthermore, it is considered that low-grade energy will also be available from the gasification centre itself (Thorsson and Wennberg, 2006). The drying technique referred to is bed drying. The technique is suitable at low temperatures from both a technical and commercial point of view (Johansson et al., 2004) and is the technique under study and development in this thesis.
Why dry biofuel? One of the first steps towards manufacturing a biofuel into something more
usable is through drying, i.e. reducing the amount of moisture in the fuel. Drying is an energy intensive process, but is often necessary to optimally use the fuel’s energy for its intended purpose.
However, it can in certain circumstances, e.g. combustion for heat production, seen unnecessary to allow a moist fuel to undergo a drying stage before combustion. In this instance, the effective thermal value increases when it dries, but only with as high an amount of energy used to evaporate the moisture. The energy for evaporation is as large regardless if it used up during drying or a later process. This means that the net effect of drying in this context will be zero or even negative.
A reason for drying the fuel before combustion is that the thermal effect can
increase in the oven. In an oven with a certain fuel capacity, an increase of the thermal effect can be obtained if a dry fuel is burned instead of a moist fuel. Further, the effect of a dry fuel instead of a moist fuel undergoing combustion is that the combustion temperature will be higher. The increased temperature can lead to a more complete combustion, which in turn leads to more heat being released, less ash is formed, and a lower release level of incompletely burned
11
hydrocarbon (Rudling et al., 1980). If combusting a moist fuel, the energy consumed by moisture evaporation results in low temperature of the flue gas, which is difficult to recover and use for power generation (Svoboda et al., 2009, Wimmerstedt, 1999).
As previously mentioned, gasification of biofuel to synthesis gas needs a dry
fuel. The dried fuel gives a high temperature that is necessary for the chemical conversions. Gasification of biomass with higher moisture content produces a gas of lower effective heating value and higher tar concentration (Svoboda et al., 2009). The moisture content effects both the operation of the gasifier and the quality of the product gas (Sheth and Babu, 2009). A moist fuel causes water vapor in the final synthesis gas which reduces the quality and makes the gas unusable.
During storage, it is required that the moisture content be held low to avoid
any microbial degradation. Substance losses can be great if a moist fuel is stored, up to 10% after four months of storage (Thörnqvist and Jirjis, 1990). Moreover, the microorganisms can be unhealthy.
Transporting moist fuel means in principle moving useless water. Both
transport costs and the environmental effect are reduced if the fuel is dried before transport.
Often, the fuel gets a more even moisture content after drying. An even moisture content is a quality aspect that is often significant to the fuel’s continued usage and places high demands on the drying technique. The more even the moisture level means better possibility to control both the combustion and gasification processes (Svoboda et al., 2009) and gives better conditions during, for example, pellet manufacturing. Resch (1989) reports that during pellet manufacturing, the moisture content in the fuel should be between 5 and 15% based on dry weight (db). Rhen et al. (2005) report on usual moisture content of 9–12% (db) for pellet manufacturing of Norway spruce and Scots pine.
Consequently, there are several reasons to dry biofuel before further usage. In the present thesis, a part discusses the possibility to increase the fuel quality with bed drying.
VOC emissions from wood drying While wood is considered a carbon dioxide neutral and environmentally-
friendly fuel, several studies (Granström, 2005, Rupar and Sanati, 2003, Björk and Rasmuson, 1996, Fagernäs, 1993) have shown that volatile organic compounds (VOC) are emitted from wood and particularly during drying (Englund and Nussbaum, 2000). These compounds are natural and come from the tree’s extractives.
12
Although these compounds are natural, they can affect the environment and
the human health. The growing forest and wood industry during the last century has given rise to very high local concentrations of VOC in the air than what is otherwise normal (Strömvall and Petersson, 1991).
What makes these volatile compounds a health problem? Certain compounds (terpenes) have shown themselves to irritate respiration organs (Fransman et al., 2003, Demers et al., 1997) which may result in chronic lung function impairment. Others may irritate the skin and mucous membranes (Falk Filipsson, 1995, Falk et al., 1991) and may cause allergic reactions (Birgersson et al., 1995, Karlberg and Lindell, 1993).
Another large environmental effect is that VOC together with nitrogen oxides affect the formation of ground-level ozone. The difference from ozone higher up in the atmosphere, which is beneficial and protects us from the sun’s ultraviolet rays, ground-level ozone can be directly harmful to humans and nature. The ozone affects, among others, trees and crops by disturbing the metabolism and negatively affecting photosynthesis so that growth diminishes. Further, ozone is a potential greenhouse gas (Akimoto, 2003).
Today, there are various commercial solutions that deal with VOC emissions from drying. boiler incinerators, regenerative thermal oxidizers (RTO) and regenerative catalytic oxidizers (RCO) are examples of methods that reduce VOCs (Rafson, 1998). The methods are effective but are considered as rather expensive and energy consuming processes.
A new and innovative system for VOC abatement is biofiltration. This system
uses microbial degradation of contaminants and ambient temperatures, and is thus much less expensive than current incineration technologies (van Groenestijn and Liu, 2002, Diehl et al., 2000).
However, the most beneficial and economical method to reduce VOC
emissions from drying of wood could be to directly control the drying parameters (drying temperature, air flow, final moisture content and drying time). If these parameters somehow affect the release of VOC, then low-emitting drying could be developed. These aspects are highlighted in the present thesis.
It is important that if we increase the usage of bioenergy for our sake and that
of the environment, we develop and process the biofuel in a manner that no new environmental and health problems arise. These aspects form the foundation of the thesis.

13
Purpose and Research questions The overall purpose of this thesis is to show how the bed drying concept can
be developed to dry wood biofuel in an energy-efficient and environmentally sustainable manner, while obtaining high quality fuel.
From the above purpose, the following three research questions (RQ:s) are
defined:
RQ 1: How can the bed drying of wood biofuel be developed towards efficient utilization of available energy? RQ 2: How can a high quality wood biofuel be ensured by bed drying? RQ 3: How can wood biofuel be dried with low release levels of VOC?
In this thesis, the term ‘high quality fuel’ refers to a fuel with low and
homogeneous moisture content.
Limitations This work studies the drying of the wood fuels sawdust and wood chips from
Norway spruce (Picea abies) and Scots pine (Pinus sylvestris) at temperatures less than 100 C and air velocities lower than 1 m/s. The fuel’s former and latter processing steps have not been studied. Gasification of biomass has been a reason for the drying, though it has been omitted from the thesis. How drying facilities are technically designed and constructed is omitted from this thesis. Comparisons with other drying techniques have not been made. Other aspects of fuel quality such as heat value and ash content has been omitted from the thesis. Environmental aspects other than VOC release have not been examined.
Short presentation of appended papers Paper I: Evaluation of hydrocarbon emissions from heart- and sapwood of
Scots pine using a laboratory-scale wood dryer
There is a lack of knowledge regarding hydrocarbon emissions during wood drying. The article studies hydrocarbon emissions during the drying of Scots pine. The experiments are conducted in an experimental rig where heartwood and sapwood are dried separately. Gas chromatograph with mass spectrometer (GC/MS) and flame ionization detector (FID) are used to partly qualitatively investigate different compounds that are emitted and partly quantitatively determine the size of the release. The principle compounds recovered are monoterpenes. A number of higher terpenes are also emitted. The distribution of heartwood and sapwood samples shows large differences that occur in both

14
release rate and total amount of release hydrocarbons during drying. Approximately three times more hydrocarbons is emitted from heartwood than sapwood. The experiments show that the drying temperature has a great influence on both the release rate and the total quantity of emitted hydrocarbons. An increase in drying temperature increases the amount of emitted hydrocarbons.
Paper II: The release of hydrocarbons from softwood drying: Measurement
and modeling
The paper is a direct continuation of the work conducted in Paper I. The same drying rig is used here to study VOC emissions from Norway spruce and Scots pine during drying. Samples of heartwood and sapwood are dried separately. The emissions are continuously measured during the drying with a flame ionization detector (FID). Significantly larger amounts of hydrocarbon are emitted from pine than spruce. This is in agreement with Scots pine comprising a greater amount of extractive compounds than Norway spruce. The article supports the large differences in release rate reported in article I, for both spruce and pine. The release rate for sapwood is significantly more complex than those from heartwood. A diffusion model describing the release of hydrocarbons during drying is presented and applies to heartwood and sapwood of spruce. The model gives reasonable agreement with experimental data and partly explains the characteristic release rates observed for sapwood.
Paper III: Experimental analysis of low-temperature bed drying of wooden biomass particles
Bed drying of biofuel has previously been emphasized as a suitable technique for the drying of biofuel with waste heat. This paper studies the drying of sawdust and wood chips experimentally in a bed dryer. The pilot dryer and measuring methods used are partly constructed and developed by the author and described thoroughly. A typical bed drying scenario and the drying zone term are presented and a method to evaluate energy-efficient drying is introduced. The two materials are studied with reference to moisture content before and after drying, the pressure throughout the bed and drying rate for various drying temperatures and air velocities. The measurements indicate that the drying zone progresses irregularly through the material, which can result in a varying moisture content and thus lower fuel quality. The moisture content in the already dried material is, however, low and even and unaffected by the drying parameters and initial moisture content. The pressure drop curves show that the pressure over the fuel bed decreases when the material dries.
Paper IV: Measurement and modeling of drying for pellet production
Transport of mass and energy during drying is complex. To gain a physical understanding of bed drying, a simulation model is developed and presented. The model is based on coupled mass and energy balance equations solved with the finite difference method. Balance equations for water vapor, air, heat, moisture
15
in the material and flow of moist air (Darcy’s Law) are treated. The model simulates drying time, moisture content and temperature in the material and pressure through the bed. The model agrees fairly well with experiments of sawdust drying. The characteristic drying zone, described in Paper III, is predicted by the model, indicating that the model is usable for analysis and evaluation of bed drying of biofuel.
Paper V: Modeling the drying of porous material. Detailed report The simulation model described in Paper IV is developed further and
presented in detail. The model is fundamental in the sense that it is applicable for all porous material dried in a bed. Complete solution of the equation system and programming code are presented. Simulation of a reference case and comparison with experimental data are discussed in detail. The effect of various parameters and their influence on the drying and drying zone are discussed. The model predicts that an initial and short heating phase is followed by a more pronounced drying phase. The model further shows that the character of the drying zone is determined by the particle size of the drying material and the operation parameters of the dryer. In its present design, the model agrees well with the experiment, even though several parameters can be optimized further.
Paper VI: Experimental approach towards optimization of a biomass bed dryer
The aim of article VI is to show how an experimental batch dryer can be used
as a tool during optimization of a continuous bed dryer. The method, presented briefly in article III, is developed here and based on continuous temperature measurements in the fuel bed during drying. Several interesting observations of the drying zone are made and discussed in detail. Among others, it is stated that both the drying zone velocity and width vary greatly during drying. This shows that a good knowledge of fuel characteristics is vital, since the aim is to achieve energy-efficient drying and maintain a high quality fuel.

16
17
Bed drying of biofuel (RQ 1 and RQ 2)
There are different techniques for drying a porous material in a bed, and these techniques differ primarily in the way in which the drying material is handled.
The bed material can be either stationary or continuously-flowing (Figure 3), depending on whether the material is charged in a batch or whether it continuously enters, moves through and leaves the drying equipment (Brooker et al., 1974). The bed material can also be either fixed or fluidized, i.e. the material can be fixed in a bed due to gravity or suspended in the air due to a high gas velocity which counter-balances the weight of the particles (Hovmand, 1995).
The batch-drying concept is favorable for small quantities of drying material.
Large quantities of material require large and expensive batches that are difficult to handle. Large quantities of material are also disadvantageous due to their large resistance to airflow, and the consequent increase in fan power consumption. In addition, the method requires a time-consuming loading and unloading procedure for each batch of material being dried.
When large quantities of material are to be dried, continuous drying on a belt
is a preferable procedure. Continuous drying involves lower operating costs and offers a higher drying capacity than batch drying (Figure 3).
The bed-drying concept can be further sub-classified. For example, depending
on the direction of the drying air and the drying material, continuous-flow dryers may be classified as cross-flow, counter-flow and co-current flow dryers (Aregba et al., 2006). Depending on the velocity of the drying air, the fluidization may be classified as incipient, bubbling or pneumatic (Hovmand, 1995).
The present thesis concentrates on fixed-bed drying, but both batch and
continuous fixed-bed drying are involved. The experimental equipment used in Papers III and VI was of the batch type but the results of these studies are applicable to continuous drying systems (Paper VI).

18
The fixed-bed drying concept has frequently been utilized in the agricultural
industry due to its low capital cost and low maintenance cost (Wang and Chen, 1999). This industry's demands for an accurate drying process, a low final moisture content and an overall good product quality are generally very high (Nicoleti et al., 2001). Consequently, numerous scientific publications have considered the drying of grain and vegetables, etc. over the years (Herman et al., 2001, Nicoleti et al., 2001, Dutta et al., 1988).
Common commercial systems for drying biofuel at the present time are drum
dryers, fluidized bed dryers, pneumatic dryers (Wimmerstedt, 1999) and continuous bed dryers (Johansson et al., 2004). From the author’s literature research, the fixed-bed drying technique applied to wood biofuels is rarely presented in the literature, motivating further research in the area. Some valuable work was, however, done by Saastamoinen and Impola (1997), Saastamoinen and Impola (1995) and Sheikholeslami and Watkinson (1991).
The bed drying process Typical bed drying can be describes as follows. The moist material is placed
in a drying chamber or passes continuously through the drying chamber. Fans force a drying medium, usually air, through the heaters so that the temperature is raised and the relative humidity of the air is lowered. The drying air then passes
Stationary, fixed-bed drying Continuous, fixed-bed drying
Continuous, fluidized bed drying Stationary, fluidized bed drying
Figure 3 Different bed drying techniques.

19
through the moist material either from below or from above. Here, we assume that the air goes from below and up through the bed (Figure 4). In the bed, there is a simultaneous exchange of heat and moisture between the air and the material. The air is cooled and its moisture content increases. At the same time, the material and moisture are heated and the moisture is evaporated. The moist air moves through the bed, becomes progressively increasingly moist and finally leaves the bed and the dryer.
Figure 4 Bed drying with a distinct drying zone.
The region within the material where the exchange of heat and moisture
primarily takes place is called the drying zone and is characterized by a temperature and moisture gradient. In a low bed, the drying zone stretches over the whole bed. In a high bed, the drying zone is delimited by completely dried material on the one hand and still completely wet material on the other (Figure 4). In the gas phase, the drying zone begins where the moisture content of the air is no longer in equilibrium with the dry material and ends where the moisture content is in equilibrium with the still completely moist material (Brooker et al., 1974).
During the drying, a critical question is regarding how well the thermal energy of the air is utilized, i.e. its capacity to carry water vapor. This question is central for RQ 1 and is: Will the air become saturated with water vapor before it has passed through the bed?
The answer to the question depends primarily on the width of the drying zone,
the height of the bed and the duration of the drying.
If the width of the drying zone is greater than the height of the bed, the air which passes the bed does not reach saturation, i.e. the thermal energy of the drying air is not used in an optimal manner.
20
If the width of the drying zone is less than the height of the bed, the drying air will at least initially become saturated with water vapor and the drying capacity of the air is therefore used to the maximum.
Of the three parameters mentioned above (the height of the bed, the width of the drying zone and the drying time), the bed height and the drying time are relatively easy to adjust. In contrast, the width of the drying zone is dependent on both the material and the operating conditions, and this makes it difficult to correct.
The particle size of the biofuel influence the width of the drying zone, since
larger particles generally have a smaller specific surface (particle surface/particle volume) from which evaporation can take place than small particles. This means that the evaporation potential is smaller for large particles. The particle size and size distribution therefore have a decisive influence on the width of the drying zone and energy optimization of the drying process.
The air velocity and air temperature could affect the width of the drying zone,
since both these parameters influence the heat effect available for the evaporation.
The width of the drying zone is therefore a very critical parameter for the use of the thermal energy and an important parameter for RQ 1 (page 13). The initial tests and a thorough analysis of the different operating conditions and their influence on the drying zone are described in Papers III and VI.
The width of the drying zone is also of decisive importance for RQ 2 (page 13), i.e. for the quality of the fuel. Since the material in the drying zone is characterized by a distinct moisture gradient, the width of the drying zone is a measure of the distribution of moisture in the material. An important ancillary question to Research question 2 is: Is the average value of the moisture content of the fuel a sufficient quality measure, or does its extended use require a fixed and low moisture distribution?
If only the average value of the moisture content of the fuel is decisive for its further use, the whole drying can be carried out under saturated conditions and it can be discontinued before the drying zone reaches the top of the bed. The result is then a fuel which can be divided into three parts (Figure 4). The fuel in the lowermost part of the bed should be completely dried and have reached an equilibrium with the humidity of the drying air (see Paper III). The fuel in the drying zone has an increasing moisture content. The fuel in the uppermost part should be completely undried (see Paper VI for a deeper discussion). If the extension of the drying zone (position and width) is known, the moisture distribution can then be determined.
A low and uniform moisture content can be achieved in the material by allowing the drying to continue until the drying zone has had time to completely
21
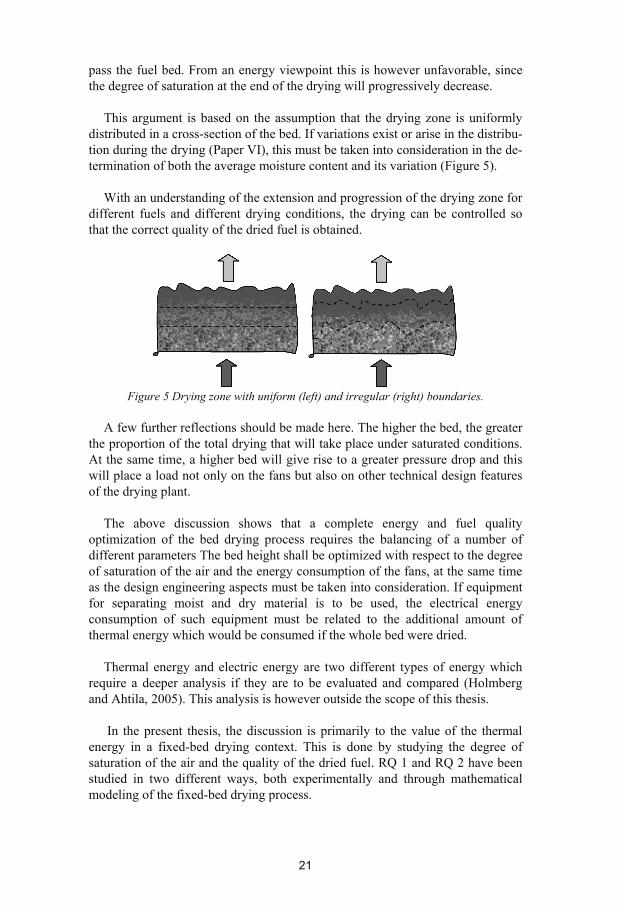
pass the fuel bed. From an energy viewpoint this is however unfavorable, since the degree of saturation at the end of the drying will progressively decrease.
This argument is based on the assumption that the drying zone is uniformly distributed in a cross-section of the bed. If variations exist or arise in the distribu-tion during the drying (Paper VI), this must be taken into consideration in the de-termination of both the average moisture content and its variation (Figure 5).
With an understanding of the extension and progression of the drying zone for
different fuels and different drying conditions, the drying can be controlled so that the correct quality of the dried fuel is obtained.
Figure 5 Drying zone with uniform (left) and irregular (right) boundaries.
A few further reflections should be made here. The higher the bed, the greater
the proportion of the total drying that will take place under saturated conditions. At the same time, a higher bed will give rise to a greater pressure drop and this will place a load not only on the fans but also on other technical design features of the drying plant.
The above discussion shows that a complete energy and fuel quality
optimization of the bed drying process requires the balancing of a number of different parameters The bed height shall be optimized with respect to the degree of saturation of the air and the energy consumption of the fans, at the same time as the design engineering aspects must be taken into consideration. If equipment for separating moist and dry material is to be used, the electrical energy consumption of such equipment must be related to the additional amount of thermal energy which would be consumed if the whole bed were dried.
Thermal energy and electric energy are two different types of energy which
require a deeper analysis if they are to be evaluated and compared (Holmberg and Ahtila, 2005). This analysis is however outside the scope of this thesis.
In the present thesis, the discussion is primarily to the value of the thermal energy in a fixed-bed drying context. This is done by studying the degree of saturation of the air and the quality of the dried fuel. RQ 1 and RQ 2 have been studied in two different ways, both experimentally and through mathematical modeling of the fixed-bed drying process.

22
Experimental The experimental method used to answer RQ 1 and RQ 2 has been briefly
described in Papers III and VI. Here follows a summary of the equipment and material.
The drying equipment is a stationary bed drier in which the main components are a centrifugal fan, an electrical heater and a drying chamber, as shown in Figure 6.
Figure 6 Experimental drying equipment.
The drying chamber (0.25 m3) can be detached and then connected to the
other equipment. The material to be dried is placed on a perforated plate in the drying chamber.
When the drying is in progress, outdoor air is driven in via the inlet pipe, and
further through the fan and the heater, and it then passes the biofuel bed in the drying chamber. The air then either continues out or is allowed to circulate with the inlet air. The arrows in Figure 6 indicate the direction of the air flow.
The drying chamber has a number of connection points for temperature sen-sors and connection points above and below the bed for a differential pressure sensor. Up to ten sensors are used for temperature measurement in the bed mate-rial. Their primary function is to detect the progression of the drying zone during drying. In some trials they were placed in a row above each other. In others, they were spread out in the bed (Figure 7).
Electrical heater
Electrical fan
Drying chamber
Outlet pipe Inlet pipe
Humidity con-trolled valve
Filter screen
Temp. Hum.
Flow
Temp. Hum. Temp. Hum.
Flow
Temp.
Pressure

23
The air flows are measured with Pitot-tubes with integrated temperature sensors in the inlet pipe and in the circulation pipe. Capacitance moisture meters with integrated temperature sensors are connected to the inlet pipe, just before the drying chamber and after the drying chamber.
A control system ensures that the pre-set air flow, air temperature and the
relative humidity of the air are kept constant during the drying. The air flow is controlled through a frequency-controlled fan. The air temperature is determined by regulating the effect of the heater. The relative humidity of the air is controlled through the automatic regulation of the circulation air. All the measurement equipment is connected to a computer, where a software was designed to supervise and control the drying and collect measurement data.
The particle size distribution of the wood fuel was evaluated through screen analysis of the dried material. Sawdust particles totaling 75% passed through the 2.0-mm screen and were caught in the 0.5-mm screen. For the wood chip particles, 75% passed through the 11.2-mm screen and were caught in the 5.6-mm screen.
The experimental work and analyzing of the bed drying process is described in detail in Paper III and VI. The method is based on continuous measurement of the temperature in the bed material during the drying (Figure 7).
Figure 7 The drying chamber loaded with sawdust. Note the temperature sensors inserted
into the bed.
Modelling the bed drying process The drying model which is briefly presented here is described in its entirety in
Paper V. Here, a few assumptions and simplifications are made which are well described in Paper V.
It could be reason to motivate the rather different and almost monographic design of Paper V. The report permits an explicit description of the simulation

24
model and a physical understanding of the drying process. Paper V also includes the numerical solution complete with programming code and solution of a reference case, as well as comparison with experimental data. These parts are often not included in normal scientific articles and the author considers them of a great value.
The conditions for the model can briefly be described as follows. The moist material has the moisture content u(x,t) (kgw/kgs) and the temperature T(x,t) ( C), where t is the time (s). The material together with moist air forms a porous mixture with height L (m) in the x-direction (Figure 8).
Figure 8 An illustration of the drying problem. Left: The total batch is depicted. Right: A
small volume of the porous material is shown.
An air stream has the inlet volumetric gas flux qg0 (m3/m2 s), inlet temperature T0 ( C) and the relative humidity 0. The air stream passes through the bed, where heat and moisture are exchanged between the air and the material. This exchange is described in the simplified model by balance equations for water vapor, liquid water and enthalpy (pressure variations are neglected).
Moisture in wood fuel Moisture can be held in wood in both bound and unbound forms. Up to the
fiber saturation point (u~0.3), the moisture is bound by strong hydrogen bonds in the walls of the wood cells. Above the fiber saturation point, free water (and water vapor) fills up the cavities of the wood and is then bound relatively weakly by capillary forces.
The fact that wood is hygroscopic means that, up to the fiber saturation point, its moisture content reacts to the moisture content of the surrounding air by re-leasing or absorbing water vapor. The relationship between the moisture content of the wood, u, and the relative humidity of the surroundings, , is usually represented graphically by sorption isotherms (Figure 9). Normally, the moisture content is described as a function of the relative humidity. Here the contrary relationship is illustrated and motivated below.
0gq 0
x L
0T
T(x,t)u(x,t)

25
0,0
0,2
0,4
0,6
0,8
1,0
0 0,05 0,1 0,15 0,2 0,25 0,3u (kgw/kgs)
sorp
Figure 9 Sorption isotherm for wood. Adapted from Krischer(1956).
It is usually said that the moisture content of the wood adapts to the moisture
content of the surroundings, but for a hygroscopic material in a small isolated air volume, it can be said that the opposite applies, i.e. for a certain moisture content u in the wood, the sorption relationship gives a certain relative humidity in the pores of the wood and the immediately surrounding air. This assumption is made in the model.
The sorption isotherms are characteristic for each material. They also depend
somewhat on the temperature of the ambient air (Krischer, 1956). The temperature dependence is however not considered in the model.
The absolute humidity c (kg/m3) is a function of the relative humidity and
the saturated vapor concentration csat. For the absolute humidity cs in the pores of the wood and the relative humidity of the adjacent air, the following applies:
sat sorp( , ) ( ) ( )sc u T c T u . (1)
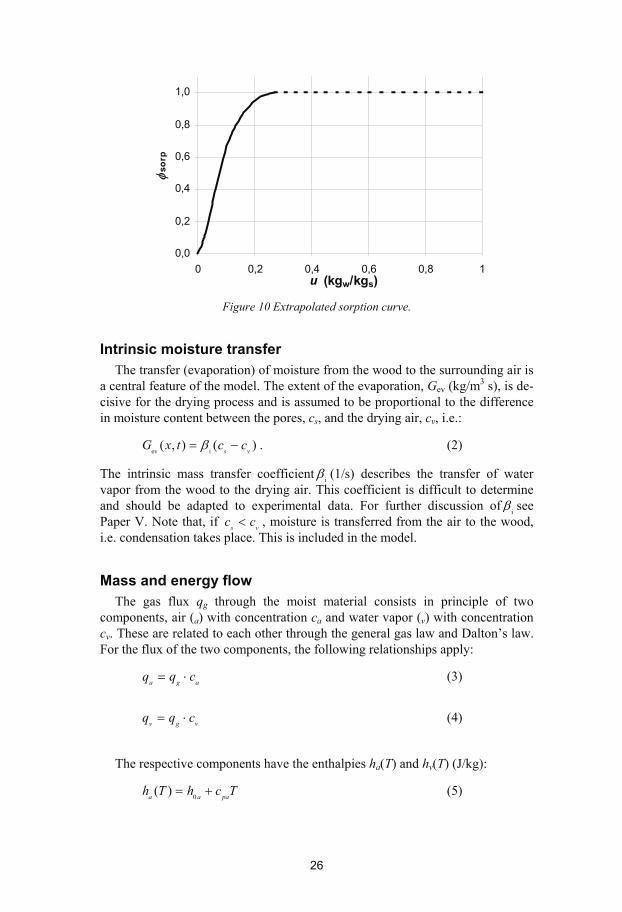
The relationship for the moisture content (and the sorption relationship) applies only up to the fiber saturation point. Therefore, for fresh wood which often contains considerably more moisture, a correction must be applied to the relationship. In Papers IV and V, the assumption is made that, since the air is already saturated at the fiber saturation point, a further increase in the moisture content will not influence the moisture content in the pores. This can be illustrated by extrapolating the sorption curve to apply at all moisture contents (Figure 10).
26
0,0
0,2
0,4
0,6
0,8
1,0
0 0,2 0,4 0,6 0,8 1u (kgw/kgs)
sorp
Figure 10 Extrapolated sorption curve.
Intrinsic moisture transfer The transfer (evaporation) of moisture from the wood to the surrounding air is
a central feature of the model. The extent of the evaporation, Gev (kg/m3 s), is de-cisive for the drying process and is assumed to be proportional to the difference in moisture content between the pores, cs, and the drying air, cv, i.e.:
ev i( , ) ( )s vG x t c c . (2)
The intrinsic mass transfer coefficient i (1/s) describes the transfer of water vapor from the wood to the drying air. This coefficient is difficult to determine and should be adapted to experimental data. For further discussion of i see Paper V. Note that, if s vc c , moisture is transferred from the air to the wood, i.e. condensation takes place. This is included in the model.
Mass and energy flow The gas flux qg through the moist material consists in principle of two
components, air (a) with concentration ca and water vapor (v) with concentration cv. These are related to each other through the general gas law and Dalton’s law. For the flux of the two components, the following relationships apply:
a g aq q c (3)
v g vq q c (4)
The respective components have the enthalpies ha(T) and hv(T) (J/kg):
0( )a a pah T h c T (5)

27
0( )v v pvh T h c T (6)
where h0a and h0v are the enthalpies at 0°C and cpa and cpv the specific heat capacities of each component (J/kg K).
The heat flux is determined by the temperature difference and the heat conductivity (J/m2 s) of the bed, so that the total heat flow through the bed can be expressed as:
( ) ( )e a a v v
Tq h T q h T q
x (7)
Balance equations For the water vapor, the following relationship applies, which says that the
change in the vapor flow with respect to the flow direction is equal to the evaporation:
evvq
Gx
(8)
The balance equation for the water in the wood states that the change in
moisture content u of the wood in the time t is equal to the amount of evaporated moisture. When t goes to zero following relation applies:
evs
uG
t (9)
where s is the density of the material (kg/m3).
The enthalpy of the air is used to heat the bed and vaporize the moisture. The energy balance is expressed as:
tot ev ev( )p
pa a pv v
Tc h T G
tT T T
c q c qx x x x
(10)
where cptot is the total heat capacity (J/m3 K) of the bed material (including the wood, moisture, water vapor and air) and hev(T) is the heat of vaporization (J/kg).
Together with the general gas law
K
a v
a v
c cP
R T M M (11)

28
where P, R, T and M are conventional notations, and a few additional relation-ships which relate the various parameters, these equations provide the basis for the simulation model for the drying of a porous material.
The total description of the model and the numerical solution of the system of equations using the finite difference method are presented in Paper V.
Results and discussion of RQ 1 and RQ 2 An experimental method for analyzing the bed drying process is presented in
Papers III and VI. These papers are based mainly on experimental work. Sawdust and wood chips are the materials which are discussed. In Papers IV and V, the bed drying technique is approached from a theoretical point of view. A simulation model which aims at increasing the understanding of the drying process is developed. The most important observations in these papers and their importance for the Research questions 1 and 2 of the thesis are presented below.
The experimental method to analyze the bed drying process shows a good potential for being of use in optimizing the bed drying of biofuels. Some of the parameters which in the present thesis are judged to be essential for optimization (the drying zone velocity, the drying zone width and cross-sectional variation) can be evaluated.
The average velocity of the drying zone shows a fairly proportional relationship with the air velocity and increases with increasing air temperature. It has however been found that in a cross-section of the bed the velocity of the drying zone may vary considerably (by a factor of up to 2). This is illustrated in Figure 11, where the temperature has been measured at three positions at three different heights in the bed. The cross-sectional variations involve that different parts of the bed dry at different rates, and this can in turn have a great influence on the quality of the completely dried material.
29
20
25
30
35
40
0 50 100 150 200
Time (min)
Tem
pera
ture
(°C
)
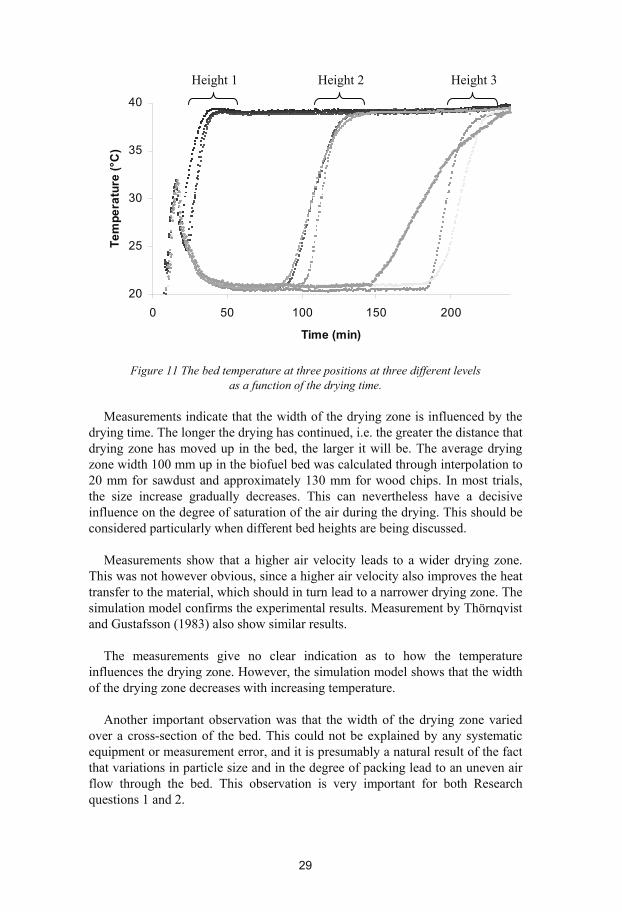
Figure 11 The bed temperature at three positions at three different levels
as a function of the drying time.
Measurements indicate that the width of the drying zone is influenced by the drying time. The longer the drying has continued, i.e. the greater the distance that drying zone has moved up in the bed, the larger it will be. The average drying zone width 100 mm up in the biofuel bed was calculated through interpolation to 20 mm for sawdust and approximately 130 mm for wood chips. In most trials, the size increase gradually decreases. This can nevertheless have a decisive influence on the degree of saturation of the air during the drying. This should be considered particularly when different bed heights are being discussed.
Measurements show that a higher air velocity leads to a wider drying zone. This was not however obvious, since a higher air velocity also improves the heat transfer to the material, which should in turn lead to a narrower drying zone. The simulation model confirms the experimental results. Measurement by Thörnqvist and Gustafsson (1983) also show similar results.
The measurements give no clear indication as to how the temperature influences the drying zone. However, the simulation model shows that the width of the drying zone decreases with increasing temperature.
Another important observation was that the width of the drying zone varied
over a cross-section of the bed. This could not be explained by any systematic equipment or measurement error, and it is presumably a natural result of the fact that variations in particle size and in the degree of packing lead to an uneven air flow through the bed. This observation is very important for both Research questions 1 and 2.
Height 1 Height 2 Height 3

30
An observation made after all the trials had been completed was that the fuel
bed collapsed by ca. 10% during the drying. Thörnqvist och Gustafsson (1983) made a similar observation. From this observation, an increase in the pressure drop across the bed during drying was expected, since the compression was assumed to be due to loose material successively falling down and blocking the air passages and thus reducing the permeability. This hypothesis was however contradicted by the pressure measurements across the bed.
In the experiments, a successive decrease in the pressure drop by between 15 and 20% of the original pressure drop was recorded (Paper III). This result can be explained by when moisture leaves the particles the volume of the particles decreases, with a consequent increase in the permeability.
In the present form of the simulation model, variations in the permeability of the material have been excluded. A small increase in the pressure drop over the bed is nevertheless predicted due to the increase in density of the air and conse-quently an increase in volume flow in the bed as the drying proceeds (Paper IV).
The fact that the measurements indicate that the total pressure drop over the bed decreases during the drying is a positive effect from an energy viewpoint, since a gradual decrease in the air resistance reduces the energy consumption by the fans. The importance of this effect has not however been clarified.
In the trials (Paper III), the moisture content of the fuel was measured before and after the drying. Before the drying, the moisture content of the material varied between 100 and 150% db, depending primarily on the storage time. After the drying, the dry material (where the drying zone had passed completely) had reached a moisture content in equilibrium with the moisture content of the drying air. Neither the type of material, not the air temperature, air velocity or initial temperature had any influence on this result. The moisture content (db) was 5.9±1.2% for sawdust and 6.5±1.9% for wood chips. This indicates that the bed drying technique has the potential to give a dried fuel with good moisture properties.
As mentioned previous, the equilibrium moisture content is slightly influenced by the temperature. When the temperature increases, the equilibrium moisture content increases (Krischer, 1956). This was not observed in the measurements, partly because the humidity of the air in the different trials was allowed to vary between 18 and 22%, which corresponds to an equilibrium moisture content for spruce of between 5 and 7%. According to the sorption isotherm used, the simulation model gives an exact agreement between the humidity in the air and the final moisture content of the fuel. In its present form, a temperature-independent sorption isotherm is used.
31
The model predicts an initial heating phase. During the heating phase a redistribution of moisture from the bed bottom to the rest of the bed is predicted (Paper V). This has not been investigated and confirmed experimentally.
The simulation results obtained from a mathematical model could be
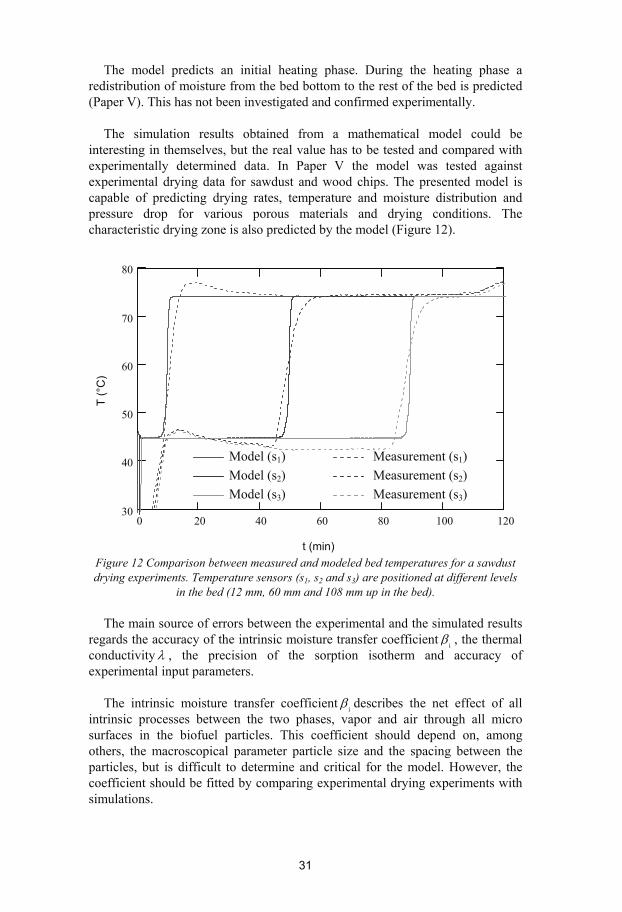
interesting in themselves, but the real value has to be tested and compared with experimentally determined data. In Paper V the model was tested against experimental drying data for sawdust and wood chips. The presented model is capable of predicting drying rates, temperature and moisture distribution and pressure drop for various porous materials and drying conditions. The characteristic drying zone is also predicted by the model (Figure 12).
0 20 40 60 80 100 12030
40
50
60
70
80
t (min)
T (°
C)
Figure 12 Comparison between measured and modeled bed temperatures for a sawdust drying experiments. Temperature sensors (s1, s2 and s3) are positioned at different levels
in the bed (12 mm, 60 mm and 108 mm up in the bed). The main source of errors between the experimental and the simulated results
regards the accuracy of the intrinsic moisture transfer coefficient i , the thermal conductivity , the precision of the sorption isotherm and accuracy of experimental input parameters.
The intrinsic moisture transfer coefficient i describes the net effect of all
intrinsic processes between the two phases, vapor and air through all micro surfaces in the biofuel particles. This coefficient should depend on, among others, the macroscopical parameter particle size and the spacing between the particles, but is difficult to determine and critical for the model. However, the coefficient should be fitted by comparing experimental drying experiments with simulations.
Measurement (s1) Measurement (s2) Measurement (s3)
Model (s1) Model (s2) Model (s3)

32
The thermal conductivity is a material parameter that could be
experimentally determined for various biofuels with some sort of thermal conductivity meter. However, in Paper V it is shown that the thermal conductivity affects the width of the drying zone but is not critical for the overall simulation result.
Accurate sorption isotherms is difficult to determine since sorption
measurements must be evaluated with great care (Wadsö, 1993). The sorption isotherm used in Paper V was adapted from Krischer (1956). The temperature dependence and desorption were not considered.
Uncertainties associated with experimental input parameters are inevitable.
The amount of evaporated water was calculated with heat and mass balances over the drying system. The amount of water released during drying was also determined by weighing the biomass before and after each experiment. The difference between measured and weighed water losses was used as a measure of the unreliability of the drying system. The difference varied between 5 and 20% and the mean value was 11%. The calculated amount of water was consistently larger than the weighed. The largest differences were found for low air flows, indicating a systematic error in the flow measurement. Low air flows are usually difficult to measure and similar problems have been reported for other experimental drying systems (Berghel, 2004).
Although an exact prediction of the bed drying process is difficult to obtain,
the model can be used to compare the drying course for different biofuels and different dryer operation conditions. Moreover, the drying zone is distinguished with the model as well as with the temperature measurements presented in Paper III and VI. These two methods together, can be an efficient tool towards development of energy efficient bed drying of biofuel that can produce a high quality fuel.
33
Emissions of VOC from wood drying (RQ 3)
RQ 3 (page 13) was studied by the author mainly between 2001 and 2004 (Paper I and Paper II). Since then valuable work has been done in the research field. In the present chapter, results from some of these more important works are discussed.
To be able to answer RQ 3, some additional questions were raised, for
example: Which volatile compounds are released during the drying of wood? How does the release rate look like? Are there differences between the release rate of volatile compounds between the main parts of the wood, i.e. the heartwood and sapwood?
Extractives in softwood Softwood can be divided into four principal components; cellulose,
hemicellulose, lignin and extractives. Cellulose is the main building material, and is composed of glucose molecules and comprises 40% of the softwood material. Hemicellulose consists of a number of closely related polysaccharides and constitutes approximately 25% of the softwood. The cellulose and hemicellulose together form strong molecular chains. Approximately 30% of the softwood material is lignin, which generally speaking acts as glue (Sjöström, 1993). The smallest group of compounds is the extractives. It could vary from less than 1% to more than 10% of the wood (Stamm, 1964). Though the group is small, it is of a great variety. The wood extractives can be divided in some large categories including volatile oils, terpenes, fatty acids and their esters, waxes, alcohols and aromatic compounds.
The terpenes consist of two or more isoprene molecules with the elementary
formula (C5H8). The monoterpenes consist of only two isoprene molecules (C10H16) and have a boiling point between 150 and 180 C. The sesquiterpenes contain three isoprene molecules (C15H24) and diterpenes contain four isoprene molecules (C20H32). Sesquiterpenes and diterpenes have boiling points above 200 C.
The terpenes in the softwood material consist mostly of mono-, sesqui-, and diterpenes (Fengel and Wegener, 1984). However, due to the monoterpenes’ low
34
boiling point, these are the most volatile compounds found in the wood (Granström, 2005) and therefore of particular interest in this study.
About 0.02-0.08% of the dry weight of Norway spruce, and 0.2-0.6% dry weight of Scots pine, consists of monoterpenes. -pinene is the main compound in both spruce and pine. In Norway spruce the second most common compound is -pinene, and in Scots pine the second most common one is 3-carene (Englund and Nussbaum, 2000).
According to Englund and Nussbaum (2000) the natural amount of terpenes is about 0.5% of the dry weight of pine sapwood and 1% of the dry weight of pine heartwood. The terpenes in the sapwood of softwoods are mainly found in the resin canals which are randomly interspersed between the water transporting tracheids (Stamm, 1964). In the heartwood of softwood the terpenes are distributed throughout the wood (Back, 2002).
Water transport in softwood The water transport in hygroscopic materials such as wood may be described
taking place during three different periods (Mujumdar, 1995). As long as the moisture content of the material surface layer is above the critical moisture content of the wood in question, the surface will remain wet due to capillary transport of moisture from the inside of the wood. At this initial stage of drying, properties of the drying air (temperature, humidity and velocity) totally control the drying rate. If the ambient (air) conditions are constant during this first stage of drying, the drying rate will also be constant. This first period of drying is called the constant-rate drying period. As the moisture content of the wood surface layer drops below the critical moisture content Xcr, the capillary moisture transport is insufficient to supply the wood surface with a layer of liquid water the drying rate successively decreases (Note that in this chapter and Paper II moisture content is denoted X and is based on the dry weight.). This second period of drying is called the falling-rate. A third period begins at the fiber saturation point, XFSP when all moisture on the wood surface has evaporated. Moisture transport at the end of the drying process occurs only by the diffusion in the voids. These three periods are illustrated for sapwood of Scots pine in Figure 13.
In the sapwood of softwood the tracheids and parenchyma cells have pits for
the transportation of water and other nutrients. During the drying process the pits in sapwood aspirates successively and at the fiber saturation point most of the pits are sealed. As heartwood is formed a large amount of adhesive extractives seal the apertures (aspirates) which break off the water transportation. Thus, below the fiber saturation point, sapwood drying and heartwood drying can be treated almost the same, due to the aspirated pits. Above the fiber saturation point the water transportation in sapwood is very different compared to the water
35
transportation in heartwood. These properties are treated in the model describing the VOC emissions.
VOC emitted from softwood during drying Depending on whether or not there are connections between the resin canals
and the water transporting tracheids, the emission of volatile hydrocarbons should be described either together with, or separately from, the water transportation. Johansson och Rasmuson (1998) drew this important conclusion and developed two different models for terpene emission; one model being based on connections between the two systems, and the other being based on two completely separate systems for water and terpenes. In their model assuming that the different transportation canals are connected, it is assumed that the terpene transportation can occur both by convection and by diffusion in both the gas and liquid phases.
The explanation model presented here has been inspired and is based on Johansson’s and Rasmuson’s (1998) work. The following assumptions and simplifications have however been made in the present work:
- The resin canals and tracheids are connected to each other. - Due to the low solubility of terpenes in water, the transportation of
terpenes in the liquid phase is neglected. - Due to low drying temperatures, only small convective flows are
present, and the convection of terpenes in the gas phase is therefore neglected.
- The simulation model is one-dimensional and treats only flow in the longitudinal (L) direction, since the permeability in this direction is much higher than the permeability in transversal and radial directions. The wood samples had approximately the same height, width and length.
- The transportation of moisture in the wood is not considered. However, experimentally measured moisture content in the wood is used to determine the relative permeability.
This means that only diffusion within the gas phase in the longitudinal direction is here considered as a transportation mechanism for the terpenes. The model predicts the terpene emission as dependent on the effect of a varying permeability due to moisture variations. Due to the simplifications (above) the model should be taken as qualitative rather than quantitative. The simulation model of the terpene release is presented in Paper II and briefly explained below.
Since diffusion is assumed to be the only mechansim for the terpene transportation, it is described by Fick’s second law of diffusion:
36
2
gas,L 2
C CD
t L (12)
where, C is the concentration of monoterpenes in the gas phase (kg/m3), t is the time (s) and Dgas,L is the coefficient of diffusion in the gas phase in the longitudinal (L) direction (m2/s).
Perré et al. (1993) reported that the ratio of the longitudinal to the transversal diffusion rates for wood can be approximated at 1 to 20. Perré (1989) also showed that the diffusion rate in the transversal direction may be described by a diffusion coefficient which is a function of the mass diffusivity of vapor in air, Dva, and the relative permeability, kg, in the material, i.e.:
vagas,L gas,T g
DD 20D k
1125 (13)
The relative permeability, kg, is dependent on the moisture content in the
material. For fresh Norway spruce and Scots pine, the moisture content varies significantly between sapwood and heartwood. The moisture content in fresh sapwood is well above the fiber saturation point (X>XFSP), whereas in heartwood it is generally below the fiber saturation point (X<XFSP). The moisture prevents transportation in the gas phase, and consequently decreases the relative permeability. Perré et al. (1989) proposed following procedure to calculate kg in the transverse direction:
sat freeg
sat cr
k 0.05X X
X X, cr free satX X X (14)
2
freeg
cr
k 0.95 1 0.05X
X, free cr0 X X (15)
gk 1 , free 0X (16)
where Xsat is the moisture content in totally saturated pores. The amount of free water Xfree is calculated as
free FSPX X X , (17)
where X is the moisture content. In Figure 13, the drying rate is shown calculated as a percentage of the maximum drying rate together with the relative permeability kg for the drying of Scots pine sapwood.

37
0
0,2
0,4
0,6
0,8
1
0 0,5 1 1,5
X (kg/kg)
Dry
ing
rate
(fra
ct. o
f max
),R
elat
ive
perm
eabi
lity
k gRel. perm.Drying rate
Since heartwood contains much less water than sapwood, according to Perré (1989), the relative permeability, kg, remains constant during the whole heart-wood drying process, see Figure 14 and equation (16).
0
0,2
0,4
0,6
0,8
1
0 0,1 0,2 0,3
X (kg/kg)
Dry
ing
rate
(fra
ct. o
f max
),R
elat
ive
perm
eabi
lity
k g
Rel. perm.Drying rate
Figure 14 Drying rate (experimental results) and relative permeability for
Scots pine heartwood.
The initial amount of terpenes in fresh Norway spruce is between 0.02-0.08% calculated on a dry wood basis (Englund and Nussbaum, 2000). With a wood density of 430 kg/m3 this corresponds to 0.086-0.34 kg terpenes per m3 wood. In
Figure 13 Drying rate (experimental results) and relative permeability for Scots pine sapwood.
xcr xFSP
Capillary transport Capillary transport
and diffusion Diffusion
Diffusion

38
the model, the initial terpene concentration was chosen to 0.1 kg/m3 and was assumed to be homogeneously distributed within the wood.
Experimental
Drying equipment A five-liter glass vessel was used as a drying chamber, the temperature of
which was maintained by an electrical heater and a warm strip. Data was collected from the balance, an air flow meter, and temperature and humidity sensors (Figure 15).
Figure 15 Experimental drying equipment for measurement of VOCs.
SPME To identify and quantify emitted volatile compounds, the solid phase
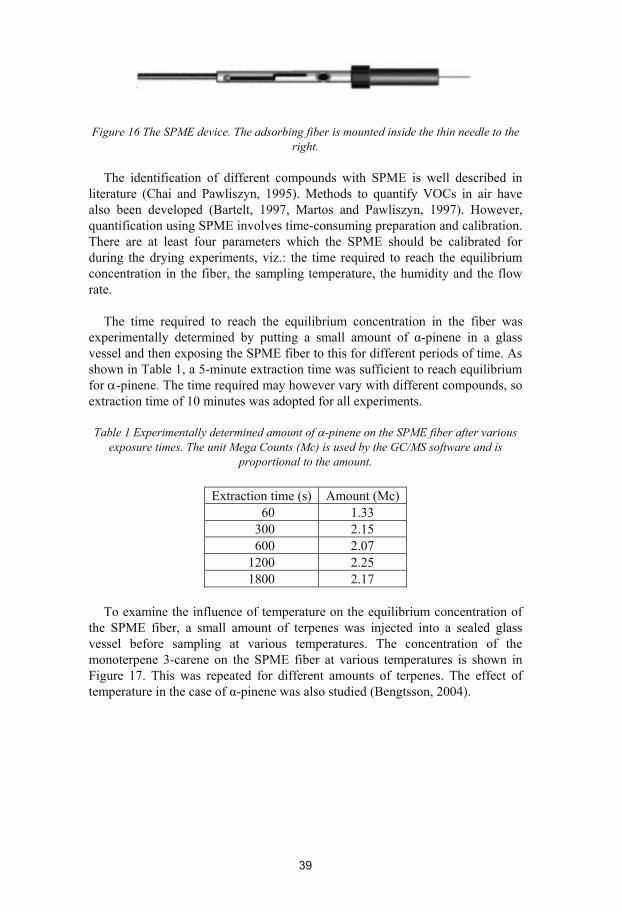
microextraction (SPME) technique was used. SPME has been used since the mid-1990s and has become an important technique in the analysis of VOCs (Ai, 1997). The SPME device is shown in Figure 16. It utilizes a polymer-coated silica fiber which adsorbs analytes in an amount proportional to the concentration of the compound in the sample, provided equilibrium has been established between the fiber and the sample.
Volatile compounds were sampled by exposing the SPME fiber to the
contaminated air leaving the drying chamber.
Electrical heater
Temperature and humidity sensor
Balance
Wood sample
Flow-meter
Air humidifier
Air flow
Regulator Logger
FID
SPME
39
Figure 16 The SPME device. The adsorbing fiber is mounted inside the thin needle to the
right.
The identification of different compounds with SPME is well described in literature (Chai and Pawliszyn, 1995). Methods to quantify VOCs in air have also been developed (Bartelt, 1997, Martos and Pawliszyn, 1997). However, quantification using SPME involves time-consuming preparation and calibration. There are at least four parameters which the SPME should be calibrated for during the drying experiments, viz.: the time required to reach the equilibrium concentration in the fiber, the sampling temperature, the humidity and the flow rate.
The time required to reach the equilibrium concentration in the fiber was
experimentally determined by putting a small amount of -pinene in a glass vessel and then exposing the SPME fiber to this for different periods of time. As shown in Table 1, a 5-minute extraction time was sufficient to reach equilibrium for -pinene. The time required may however vary with different compounds, so extraction time of 10 minutes was adopted for all experiments.
Table 1 Experimentally determined amount of -pinene on the SPME fiber after various
exposure times. The unit Mega Counts (Mc) is used by the GC/MS software and is proportional to the amount.
Extraction time (s) Amount (Mc)
60 1.33 300 2.15 600 2.07 1200 2.25 1800 2.17
To examine the influence of temperature on the equilibrium concentration of
the SPME fiber, a small amount of terpenes was injected into a sealed glass vessel before sampling at various temperatures. The concentration of the monoterpene 3-carene on the SPME fiber at various temperatures is shown in Figure 17. This was repeated for different amounts of terpenes. The effect of temperature in the case of -pinene was also studied (Bengtsson, 2004).

40
0
2
4
6
8
10
0 20 40 60 80Temperature (°C)
Am
ount
of 3
-car
ene
(Mc)
Figure 17 Experimentally determined amount of 3-carene on the SPME fiber at various
temperatures. The unit Mega Counts (Mc) is used by the GC/MS software and is proportional to the amount.
According to Martos and Pawliszyn (1997) the adsorption capacity of the
SPME fiber above a relative humidity of 90% can be reducedinsinuate by approximately 10%. Below 90% r.h. the influence of humidity is low. The humidity in the outgoing air during the drying experiments was below 60% r.h..
The airflow through the vessel was kept low and constant. However,
according to Martos and Pawliszyn (1997), the influence of airflow to SPME adsorption is negligible.
GC/MS A gas chromatograph equipped with a mass spectrometer detector (GC/MS)
was used to detect, identify and quantify the different organic compounds adsorbed on the SPME fiber.
The response from the GC/MS was converted into a concentration measure by calibration curves. These were constructed for -pinene and 3-carene. A series of standard samples was prepared for a range of terpene concentration. A calibration curve for 3-carene, is shown in Figure 18.
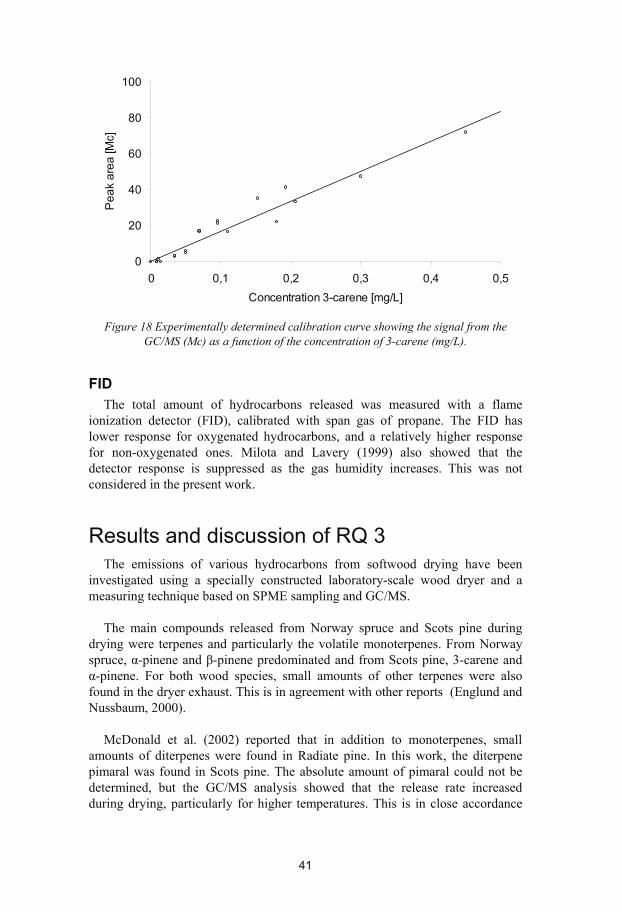
41
0
20
40
60
80
100
0 0,1 0,2 0,3 0,4 0,5Concentration 3-carene [mg/L]
Pea
k ar
ea [M
c]
Figure 18 Experimentally determined calibration curve showing the signal from the
GC/MS (Mc) as a function of the concentration of 3-carene (mg/L).
FID The total amount of hydrocarbons released was measured with a flame
ionization detector (FID), calibrated with span gas of propane. The FID has lower response for oxygenated hydrocarbons, and a relatively higher response for non-oxygenated ones. Milota and Lavery (1999) also showed that the detector response is suppressed as the gas humidity increases. This was not considered in the present work.
Results and discussion of RQ 3 The emissions of various hydrocarbons from softwood drying have been
investigated using a specially constructed laboratory-scale wood dryer and a measuring technique based on SPME sampling and GC/MS.
The main compounds released from Norway spruce and Scots pine during
drying were terpenes and particularly the volatile monoterpenes. From Norway spruce, -pinene and -pinene predominated and from Scots pine, 3-carene and
-pinene. For both wood species, small amounts of other terpenes were also found in the dryer exhaust. This is in agreement with other reports (Englund and Nussbaum, 2000).
McDonald et al. (2002) reported that in addition to monoterpenes, small amounts of diterpenes were found in Radiate pine. In this work, the diterpene pimaral was found in Scots pine. The absolute amount of pimaral could not be determined, but the GC/MS analysis showed that the release rate increased during drying, particularly for higher temperatures. This is in close accordance
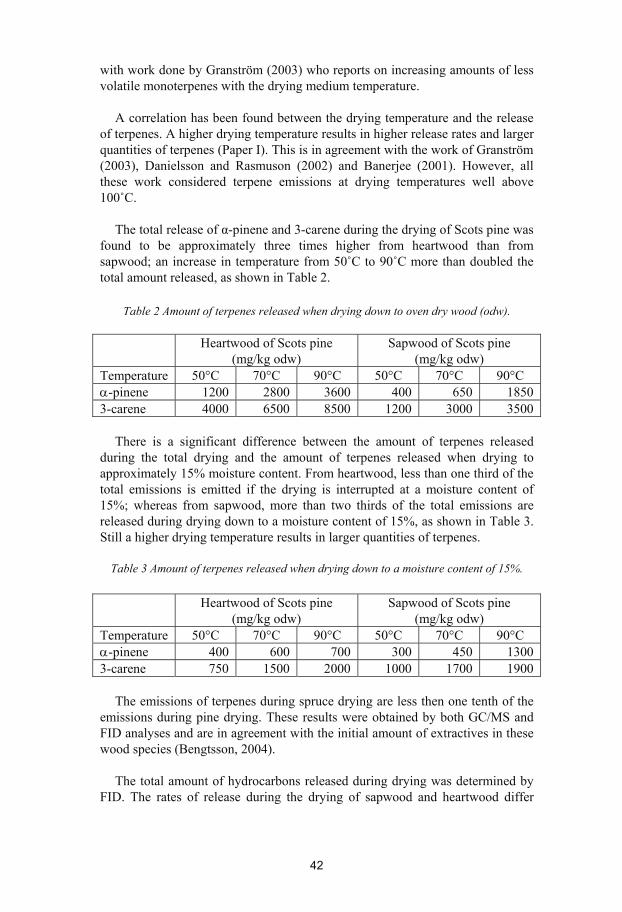
42
with work done by Granström (2003) who reports on increasing amounts of less volatile monoterpenes with the drying medium temperature.
A correlation has been found between the drying temperature and the release
of terpenes. A higher drying temperature results in higher release rates and larger quantities of terpenes (Paper I). This is in agreement with the work of Granström (2003), Danielsson and Rasmuson (2002) and Banerjee (2001). However, all these work considered terpene emissions at drying temperatures well above 100 C.
The total release of -pinene and 3-carene during the drying of Scots pine was found to be approximately three times higher from heartwood than from sapwood; an increase in temperature from 50 C to 90 C more than doubled the total amount released, as shown in Table 2.
Table 2 Amount of terpenes released when drying down to oven dry wood (odw).
Heartwood of Scots pine
(mg/kg odw) Sapwood of Scots pine
(mg/kg odw) Temperature 50°C 70°C 90°C 50°C 70°C 90°C
-pinene 1200 2800 3600 400 650 1850 3-carene 4000 6500 8500 1200 3000 3500
There is a significant difference between the amount of terpenes released during the total drying and the amount of terpenes released when drying to approximately 15% moisture content. From heartwood, less than one third of the total emissions is emitted if the drying is interrupted at a moisture content of 15%; whereas from sapwood, more than two thirds of the total emissions are released during drying down to a moisture content of 15%, as shown in Table 3. Still a higher drying temperature results in larger quantities of terpenes.
Table 3 Amount of terpenes released when drying down to a moisture content of 15%.
Heartwood of Scots pine
(mg/kg odw) Sapwood of Scots pine
(mg/kg odw) Temperature 50°C 70°C 90°C 50°C 70°C 90°C
-pinene 400 600 700 300 450 1300 3-carene 750 1500 2000 1000 1700 1900
The emissions of terpenes during spruce drying are less then one tenth of the emissions during pine drying. These results were obtained by both GC/MS and FID analyses and are in agreement with the initial amount of extractives in these wood species (Bengtsson, 2004).
The total amount of hydrocarbons released during drying was determined by
FID. The rates of release during the drying of sapwood and heartwood differ
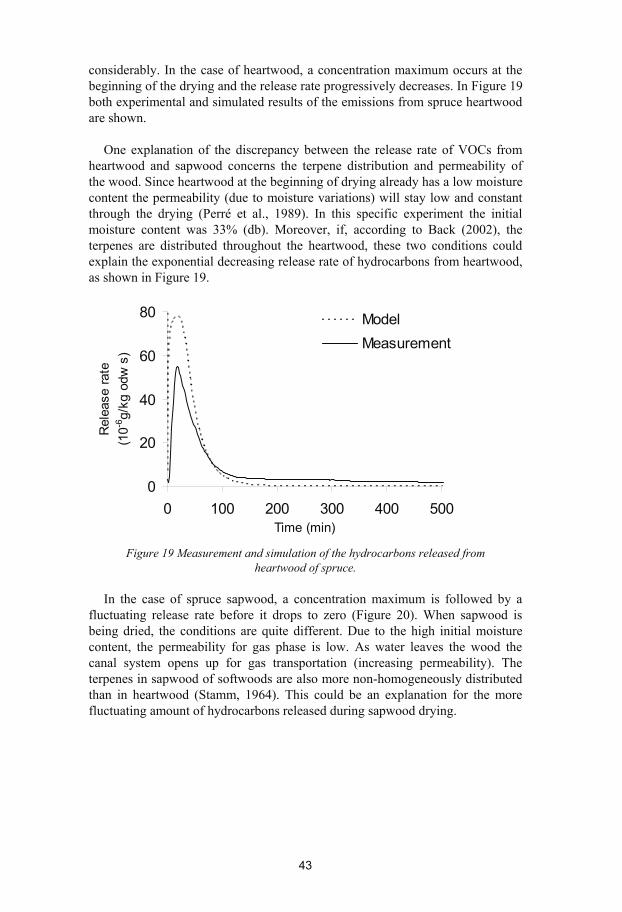
43
considerably. In the case of heartwood, a concentration maximum occurs at the beginning of the drying and the release rate progressively decreases. In Figure 19 both experimental and simulated results of the emissions from spruce heartwood are shown.
One explanation of the discrepancy between the release rate of VOCs from
heartwood and sapwood concerns the terpene distribution and permeability of the wood. Since heartwood at the beginning of drying already has a low moisture content the permeability (due to moisture variations) will stay low and constant through the drying (Perré et al., 1989). In this specific experiment the initial moisture content was 33% (db). Moreover, if, according to Back (2002), the terpenes are distributed throughout the heartwood, these two conditions could explain the exponential decreasing release rate of hydrocarbons from heartwood, as shown in Figure 19.
0
20
40
60
80
0 100 200 300 400 500Time (min)
Rel
ease
rate
(1
0-6g/
kg o
dw s
)
ModelMeasurement
Figure 19 Measurement and simulation of the hydrocarbons released from
heartwood of spruce.
In the case of spruce sapwood, a concentration maximum is followed by a fluctuating release rate before it drops to zero (Figure 20). When sapwood is being dried, the conditions are quite different. Due to the high initial moisture content, the permeability for gas phase is low. As water leaves the wood the canal system opens up for gas transportation (increasing permeability). The terpenes in sapwood of softwoods are also more non-homogeneously distributed than in heartwood (Stamm, 1964). This could be an explanation for the more fluctuating amount of hydrocarbons released during sapwood drying.

44
0
20
40
60
80
0 200 400 600 800 1000Time (min)
Rel
ease
rate
(1
0-6g/
kg o
dw s
)
Model
Measurement
Figure 20 Measurement and simulation of the hydrocarbons released from
sapwood of spruce.
The diffusion model used to describe the hydrocarbon emissions includes variations in permeability in the wood due to variations in water content. The results from the model indicate that the above explanation is to some extent valid. Figure 19 and Figure 20 show the hydrocarbons measured during the drying of heartwood and sapwood samples of spruce, and the results from the corresponding simulations. The characteristic release behavior for heartwood and sapwood are fairly well described by the model. However, the release behavior shown for sapwood indicates that it could be other mechanisms involved besides permeability variations. The results from the model should be taken as qualitative rather than quantitative. For example, the initial terpene concentration used in the model is rather uncertain, and strongly affects the absolute release rate during drying. In this specific measurement of sapwood (Figure 20) the critical moisture content was reached after 160 minutes of drying, and the fiber saturation point after approximately 320 minutes. Note the continuing release of hydrocarbons after 500 minutes drying, when the wood is considered completely dry.
Another probable explanation that is given is that the temperature inside the wood is below the actual drying gas temperature during the first period of drying (Granström, 2003, Ingram et al., 2000). As the moisture content of the wood reaches the fiber saturation point, the temperature in the wood starts to increase. The higher the wood temperature the higher the vapor pressure of VOC; consequently the release rate increases and results in a second peak (Ingram et al., 2000). Ingram et al. (2000) observed the phenomenon for high temperatures (115 C) but not for low temperatures (80 C). Granström (2003) observed a steep increase in terpene emissions below a moisture content of 12% of sawdust dried in a spouted bed at temperatures between 140 C and 200 C. Johansson and Rasmuson (1998) report on similar release behavior at drying temperatures
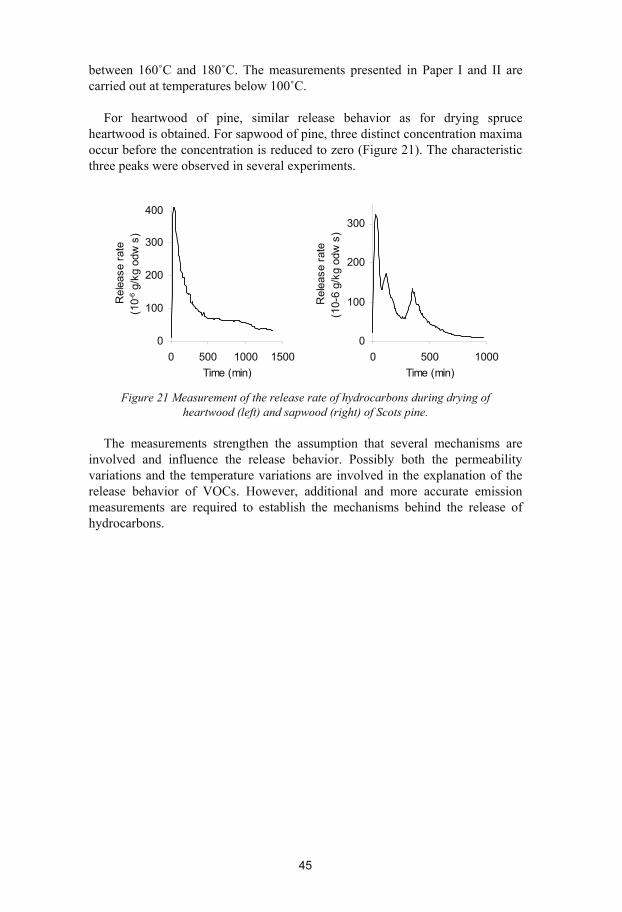
45
between 160 C and 180 C. The measurements presented in Paper I and II are carried out at temperatures below 100 C.
For heartwood of pine, similar release behavior as for drying spruce heartwood is obtained. For sapwood of pine, three distinct concentration maxima occur before the concentration is reduced to zero (Figure 21). The characteristic three peaks were observed in several experiments.
0
100
200
300
400
0 500 1000 1500Time (min)
Rel
ease
rate
(1
0-6 g
/kg
odw
s)
0
100
200
300
0 500 1000Time (min)
Rel
ease
rate
(1
0-6
g/kg
odw
s)
Figure 21 Measurement of the release rate of hydrocarbons during drying of
heartwood (left) and sapwood (right) of Scots pine.
The measurements strengthen the assumption that several mechanisms are involved and influence the release behavior. Possibly both the permeability variations and the temperature variations are involved in the explanation of the release behavior of VOCs. However, additional and more accurate emission measurements are required to establish the mechanisms behind the release of hydrocarbons.

46
47
Final discussion There could be reasons to discuss the applicability of the results from the
emission measurements on bed drying of wood biofuels. On the one hand the samples used for emission analysis were larger than the wood chips and sawdust particles discussed for bed drying; on the other hand the drying techniques differed.
The dependence of the particle size on the emissions of hydrocarbons is interesting. Generally, emission measurements indicate that the drying of smaller particles such as sawdust, when compared to larger wood samples, results in higher emissions, see table in Granström (2005). The shorter diffusion paths for smaller particles could be a reason for the higher emissions (Granström, 2005). This can naturally influence the total amount of hydrocarbons released during the drying of wood biofuels in a bed.
For both heartwood and sapwood drying, the release rate of VOCs declines at the end of the drying process. However, the total hydrocarbon measurement shows that even when the wood is considered dry there are still small amounts being emitted. For bed drying this could imply that from the wood where the drying zone has passed smaller amounts of hydrocarbons are still being released.
Another interesting hypothesis is that the top bed material will remain wet and
at the wet-bulb temperature during most of the drying time. This wet top layer could possibly result in the condensation of hydrocarbons and limitation of the emissions.
These hypotheses should be experimentally investigated. However, they do not change the result obtained in the thesis that a decrease in drying temperature decreases the amount of released VOCs.

48
49
Conclusions Emissions of volatile organic compounds are an environmental and health
problem. During drying of wood, volatile organic compounds, mainly monoterpenes are released to the environment. The main compounds released from Norway spruce and Scots pine during drying are -pinene, -pinene and 3-carene.
The release rate of VOC from heartwood and sapwood during drying differ
considerably. At least two mechanisms related to temperature and permeability variations are assumed to be involved and influence the release behavior.
With respect to this thesis, the most important conclusion drawn from the VOC measurements is that an increase in the drying temperature leads to an increase both in the release rate and in the total amount of terpenes released during the drying. In order to minimize the discharges of volatile organic substances in the drying of wood biofuels, the drying should therefore be carried out at a low temperature.
It has been previously shown that with low temperature waste heat bed drying seems to be a suitable technique for drying biofuels, both from a commercial and technical point of view. Consequently, bed drying has the ability to develop towards a low emitting drying regarding volatile hydrocarbons.
Bed drying of wood biofuels is studied both experimentally and by mathematical modeling. The drying process is investigated regarding low thermal energy consumption and towards low and homogeneous moisture content in the dried fuel.
The simulation model is capable of predicting drying rates, temperature and
moisture distribution and pressure drop for various biofuels and drying conditions. The characteristic drying zone is also predicted by the model.
Experiment on the drying zone propagation show that the grade of saturation of the outlet air from the dryer is dependent on several factors but primarily on the bed height and the biofuel particle size. A high bed of a fine material leads to saturation in a greater part of the drying than is achieved with a low bed of a coarse material. As a comparison, the average drying zone width 100 mm up in a bed of sawdust is 20 mm and 130 mm for wood chips. These numbers indicate approximate bed heights to attain saturated conditions for each material at the beginning of drying. However, air velocity, the height position of the drying

50
zone and possibly the drying temperature influence the character of the drying zone. Increasing air velocity and increasing height position in the bed increases the width of the drying zone. The simulation model indicates a decreasing with of the drying zone with increasing temperature.
An aspect to be considered when a high quality fuel is desired is the need for a low and uniform moisture content. The experiments show that the dried material reaches a moisture content in equilibrium with the humidity of the drying air. This indicates that bed drying has the potential to give a dried fuel with good moisture properties. However, the experiments also indicate that the velocity and width of the drying zone can vary over a cross section of the bed, and thus lead to an unevenly dried material with a great variation in moisture content, as it becomes more difficult to achieve the desired degree of saturation of the exiting air.
A total energy and fuel quality optimization of a bed drying system requires additional considerations, such as available heat and electrical energy consumption. However, the bed drying of wood biofuels can nevertheless be developed on the basis of the experimental method and the simulation model presented here. The drying can be optimized towards a more efficient use of the thermal energy, a low and even moisture content in the fuel, and at low temperatures for low emissions of volatile hydrocarbons.
51
Further work This thesis has given rise to considerably more questions than it has
succeeded in answering. The author considers some of these questions to be more interesting than others as indicated below.
A further chemical analysis of the exiting drying air particularly in the case of
spruce is desirable. Spruce is the most common wood species and a major source of biofuel in Sweden. The substances in the discharges have been relatively well examined but the emission process gives rise to many questions. A clearer relationship between the moisture release and the VOC emission is required. It would also be interesting to measure the emissions from biofuels during bed drying. The results of such measurements would be more applicable to industrial bed drying.
The simulation model can be further developed, and material data can be
obtained by comparison with experimental results. Another interesting idea is to link together the terpene emission model with the simulation model for bed drying.
It would also be interesting to examine bed drying of other biofuels such as
bark and branches and tops, and also the particle size and distribution dependence on drying rate, pressure drop and drying zone progression.

52
53
References Swedish Standard SS 187106. Biobränslen - Terminologi för vissa biobränslen.
http://www.sis.se/.
AI, J. (1997) Solid Phase Microextraction for Quantitative Analysis in Nonequi-librium Situations. Analytical chemistry - publ. by the American Chemi-cal Society, 69, 1230-1236.
AKIMOTO, H. (2003) Global Air Quality and Pollution. Science, 302, 1716-1720.
AREGBA, A. W., SEBASTIAN, P. & NADEAU, J. P. (2006) Stationary deep-bed drying: A comparative study between a logarithmic model and a non-equilibrium model. Journal of Food Engineering, 77, 27-40.
BACK, E. L. (2002) Pattern of parenchyma and canal resin composition in soft-woods and hardwoods. Journal of Wood Science, 48, 167-170.
BANERJEE, S. (2001) Mechanisms of terpene release during sawdust and flake drying. Holzforschung, 55, 413-416.
BARTELT, R. J. (1997) Calibration of a Commercial Solid-Phase Microextrac-tion Device for Measuring Headspace Concentrations of Organic Vola-tiles. Analytical chemistry - publ. by the American Chemical Society, 69, 364-372.
BENGTSSON, P. (2004) Physical and chemical characterization of the emis-sions from softwood drying, Växjö, Växjö University.
BENGTSSON, P. & SANATI, M. (2004) Measurement and Mathematical Mod-eling of the Hydrocarbon Emissions from Wood Drying. 14th Interna-tional Drying Symposium (IDS 2004). São Paulo, Brazil.
BERGHEL, J. (2004) Improved fluidized bed drying technology for wood fuels, Karlstad, Univ.
BIRGERSSON, B., STERNER, O. & ZIMERSON, E. (1995) Kemiska hälsoris-ker : toxikologi i kemiskt perspektiv, Malmö, Liber Hermod.
54
BJÖRK, H. & RASMUSON, A. (1996) Formation of organic compounds in su-perheated steam drying of bark chips. Fuel and Energy Abstracts, 37, 115-115.
BROOKER, D. B., BAKKER-ARKEMA, F. W. & HALL, C. W. (1974) Drying cereal grains, Westport, Conn., Avi Publishing Company
CHAI, M. & PAWLISZYN, J. (1995) Analysis of Environmental Air Samples by Solid-Phase Microextraction and Gas-Chromatography Ion-Trap Mass-Spectrometry. Environmental Science & Technology, 29, 693-701.
DANIELSSON, S. & RASMUSON, A. (2002) The influence of drying medium, temperature, and time on the release of monoterpenes during convective drying of wood chips. Drying Technology, 20, 1427-1444.
DEMERS, P. A., TESCHKE, K. & KENNEDY, S. M. (1997) What to do about softwood? A review of respiratory effects and recommendations regard-ing exposure limits. American Journal of Industrial Medicine, 31, 385-398.
DIEHL, S. V., SAILEELA, B., WASSON, L. L. & BORAZJANI, A. (2000) Biofiltration of selected monoterpenes found in southern yellow pine wood emissions. Forest Products Journal, 50, 43-48.
DUTTA, S. K., NEMA, V. K. & BHARDWAJ, R. K. (1988) Drying Behavior of Spherical Grains. International Journal of Heat and Mass Transfer, 31, 855-861.
EEA (2004) Annual European Community greenhouse gas inventory 1990–2002 and inventory report 2004. Submission to the UNFCCC Secretariat. EEA Technical Report European Environment Agency.
ENGLUND, F. & NUSSBAUM, R. M. (2000) Monoterpenes in Scots pine and Norway spruce and their emission during kiln drying. Holzforschung, 54, 449-456.
FAGERNÄS, L. (1993) Formation and behaviour of organic compounds in bio-mass dryers. Bioresource Technology, 46, 71-76.
FALK, A., LÖF, A., HAGBERG, M., WIGAEUS HJELM, E. & WANG, Z. (1991) Human exposure to 3-carene by inhalation: Toxicokinetics, ef-fects on pulmonary function and occurrence of irritative and CNS symptoms. Toxicology and Applied Pharmacology, 110, 198-205.
55
FALK FILIPSSON, A. (1995) Toxicokinetics and acute effects of inhalation ex-posure to monoterpenes in man, Solna, National Institute of Occupa-tional Health (Arbetsmiljöinstitutet).
FENGEL, D. & WEGENER, G. (1984) Wood : chemistry, ultrastructure, reac-tions, Berlin, de Gruyter.
FRANSMAN, W., MCLEAN, D., DOUWES, J., DEMERS, P. A., LEUNG, V. & PEARCE, N. (2003) Respiratory Symptoms and Occupational Expo-sures in New Zealand Plywood Mill Workers. The Annals of Occupa-tional Hygiene, 47, 287-295.
GRANSTRÖM, K. (2003) Emissions of monoterpenes and VOCs during drying of sawdust in a spouted bed. Forest Products Journal, 53, 48-55.
GRANSTRÖM, K. (2005) Emissions of volatile organic compounds from wood, Karlstad, Division for Engineering Sciences, Physics and Mathematics, Department of Environmental and Energy Systems, Univ.
HERMAN, E., RODRÍGUEZ, G. C. & GARCÍA, M. A. (2001) Mathematical modeling for fixed-bed drying considering heat and mass transfer and interfacial phenomena. Drying Technology, 19, 137-154.
HOLMBERG, H. & AHTILA, P. (2005) Evaluation of energy efficiency in bio-fuel drying by means of energy and exergy analyses. Applied Thermal Engineering, 25, 3115-3128.
HOVMAND, S. (1995) Fluidized bed drying. IN MUJUMDAR, A. S. (Ed.) Handbook of industrial drying. New York, Dekker.
INGMAN, D., GUSTAFSSON, M. & WESTERMARK, M. (2007) Efficient re-covery and upgrading of waste heat from humid air in the forest indus-try, VÄRMEFORSK.
INGRAM, L. L., SHMULSKY, R., DALTON, A. T., TAYLOR, F. W. & TEMPLETON, M. C. (2000) The measurement of volatile organic emissions from drying southern pine lumber in a laboratory-scale kiln. Forest Products Journal, 50, 91-94.
JOHANSSON, A. & RASMUSON, A. (1998) The release of monoterpenes dur-ing convective drying of wood chips. Drying Technology, 16, 1395-1428.
JOHANSSON, I., LARSSON, S. & WENNBERG, O. (2004) Torkning av bio-bränslen med spillvärme (Drying of biofuel utilizing waste heat). Vär-meforskrapport 881. Stockholm, Sweden.

56
KARLBERG, A.-T. & LINDELL, B. (1993) Nordiska expertgruppen för gräns-värdesdokumentation. 107, Limonen, Solna, Arbetarskyddsstyr.
KRISCHER, O. (1956) Die wissenschaftlichen Grundlagen der Trocknungstech-nik, Berlin/Göttingen/heidelberg, Springer-Verlag.
MARTOS, P. A. & PAWLISZYN, J. (1997) Calibration of Solid Phase Microex-traction for Air Analyses Based on Physical Chemical Properties of the Coating. Analytical chemistry - publ. by the American Chemical Soci-ety, 69, 206-215.
MCDONALD, A. G., DARE, P. H., GIFFORD, J. S., STEWARD, D. & RILEY, S. (2002) Assessment of air emissions from industrial kiln drying of Pi-nus radiata wood. Holz als Roh- und Werkstoff, 60, 181-190.
MILOTA, M. R. & LAVERY, M. R. (1999) Effect of moisture on the reading of a total hydrocarbon analyzer. Forest Products Journal, 49, 47-48.
MUJUMDAR, A. S. (1995) Handbook of industrial drying, New York, Dekker.
NICOLETI, J. F., TELIS-ROMERO, J. & TELIS, V. R. N. (2001) Air-drying of fresh and osmotically pre-treated pineapple slices: Fixed air temperature versus fixed slice temperature drying kinetics. Drying Technology, 19, 2175-2191.
OLSSON, F., HANSSON, H., EGARD, M. & BÄRRING, M. (2003) Tillvarata-gande av spillvärme (Utilization of secondary heat). Värmeforskrapport 824. Stockholm, Sweden.
PARIKKA, M. (2004) Global biomass fuel resources. Biomass and Bioenergy, 27, 613-620.
PERRÉ, P., FOHR, J. P. & ARNAUD, G. (1989) A model of drying applied to softwoods. IN MUJUMDAR, A. S. & ROQUES, M. A. (Eds.) Drying '89. New York, Hemisphere.
PERRÉ, P., MOSER, M. & MARTIN, M. (1993) Advances in Transport Phe-nomena During Convective Drying with Superheated Steam and Moist Air. International Journal of Heat and Mass Transfer, 36, 2725-2746.
RAFSON, H. J. (1998) Odor and VOC control handbook, New York, McGraw-Hill.
RESCH, H. (1989) Fuel from wood residues: a “profit center” for mills. World Wood, December, 14–21.

57
RHEN, C., GREF, R., SJÖSTRÖM, M. & WÄSTERLUND, I. (2005) Effects of raw material moisture content, densification pressure and temperature on some properties of Norway spruce pellets. Fuel Processing Technol-ogy, 87, 11-16.
RUDLING, L., AHLING, B. & LÖFROTH, G. (1980) Kemisk och biologisk ka-rakterisering av rökgaser från småskalig eldning av flis och ved : Che-mical and biological characterization of emissions from combustion of wood and wood-chips in small furnaces and stoves, Solna, SNV.
RUPAR, K. & SANATI, M. (2003) The release of organic compounds during biomass drying depends upon the feedstock and/or altering drying heat-ing medium. Biomass and Bioenergy, 25, 615-622.
SAASTAMOINEN, J. & IMPOLA, R. (1997) Drying of biomass particles in fixed and moving beds. Drying Technology, 15, 1919-1929.
SAASTAMOINEN, J. J. & IMPOLA, R. K. (1995) Drying of Solid-Fuel Parti-cles in Hot Gases. Drying Technology, 13, 1305-1315.
SHEIKHOLESLAMI, R. & WATKINSON, A. P. (1991) Drying of wood resi-dues in a fixed bed. Convective heat and mass transfer in porous media. Izmir, Turkey.
SHETH, P. N. & BABU, B. V. (2009) Experimental studies on producer gas ge-neration from wood waste in a downdraft biomass gasifier. Bioresource Technology, 100, 3127-3133.
SJÖSTRÖM, E. (1993) Wood chemistry : fundamentals and applications, San Diego, Academic Press.
STAMM, A. J. (1964) Wood and cellulose science, New York, Ronald Press.
STEM (2008a) Energiläget i siffror = Energy in Sweden : facts and figures 2008. Swedish National Energy Agency Eskilstuna, Energimyndigheten.
STEM (2008b) Energy indicators 2008 : theme: renewable energy, Eskilstuna, Swedish Energy Agency.
STRÖMVALL, A.-M. & PETERSSON, G. (1991) Volatile terpenes emitted to air. IN ALLEN, L. (Ed.) Pitch controll, wood resin and deresination. Atlanta, Tappi Press.
SVOBODA, K., MARTINEC, J., POHO ELÝ, M. & BAXTER, D. (2009) In-tegration of biomass drying with combustion/gasification technologies and minimization of emissions of organic compounds. Chemical Pa-pers, 63, 15-25.
58
THORSSON, O. & WENNBERG, O. (2006) Suitable drying processes and their integration with the gasification and DME-synthesis process. CHRIS-GAS Report.
THÖRNQVIST, T. & GUSTAFSSON, G. (1983) Kalluftstorkningens betydelse för bränsleflisens lagringsbarhet, Uppsala.
THÖRNQVIST, T. & JIRJIS, R. (1990) Bränsleflisens förändring över tiden - vid lagring i stora stackar : Changes in fuel chips during storage in large piles, Uppsala.
WADSÖ, L. (1993) Studies of water vapor transport and sorption in wood, Lund.
VAN GROENESTIJN, J. W. & LIU, J. X. (2002) Removal of alpha-pinene from gases using biofilters containing fungi. Atmospheric Environment, 36, 5501-5508.
WANG, Z. H. & CHEN, G. (1999) Heat and mass transfer in fixed-bed drying. Chemical Engineering Science, 54, 4233-4243.
WIMMERSTEDT, R. (1999) Recent advances in biofuel drying. Chemical Eng-ineering and Processing, 38, 441-447.


![Telephone: Environmental Facsimile: Appeal Board PO Box ...[7] The wood pellet manufacturing process involves drying the wood chips, sawdust and shavings which make up the raw materials](https://img.pdfslide.us/doc/110x75/60421bf2c72497288933ddaf/telephone-environmental-facsimile-appeal-board-po-box-7-the-wood-pellet.jpg)