Embed Size (px)
Citation preview
Abstract The aim was to investigate the development of Whiplash Associated Disorders (WAD) leading to
long‐term consequences for drivers separated for gender in cars introduced at different year intervals and in
different impact directions. An additional aim was to analyze the influence of various whiplash preventive
concepts on WAD in rear impacts.
The developments were studied for cars grouped into 5‐year intervals according to year of introduction
separated for frontal, side and rear‐end impacts and for gender. All drivers (24,452) reporting WAD during the
years 1998‐2012, and those reporting symptoms > 1 month as well as those with permanent impairment, were
included. Whiplash preventive concepts were grouped according to car make and concept.
A reduction in risk of long‐term consequences after reporting initial symptoms of WAD were found in rear‐end and side impacts comparing cars introduced on the market 1980‐84 and 2005‐2009. No reduction was found in frontal impacts. This clearly shows that more focus on preventive interventions for frontal impacts is needed. Existing seat concepts aimed at lowering the risk of WAD were found to reduce the risk of long‐term
consequences after reporting initial symptoms of WAD. However, seats with energy absorption in the seat back, passive seats or reactive seats are more effective for females than seats with Reactive Head Restraints, which showed no major reduction of WAD with long‐term consequences compared with standard seats.
Keywords WAD, whiplash, whiplash symptoms, impairment, gender.
I. INTRODUCTION
Whiplash Associated Disorders (WAD) constitute a major problem for the society and the affected occupants. WAD account for the vast majority of injuries leading to permanent medical impairment (pmi) [1, 2]. They constitute one of the largest problems resulting from road traffic crashes. In Sweden they account for approximately 50% of all traffic injuries leading to long‐term consequences [1]. Harder et al [3] reviewed 2810 claims of WAD of which 1551 included other injuries as well. It was found that 25% of those with WAD recovered within a week compared to 19% of those claiming also for other injuries. One year after the crash, 1.9% of those suffering only WAD and 4.1% of those with multiple injuries had not recovered. A Canadian study [4] found that 2.9% were still absent from usual activities or work one year after the event. Spitzer also stated that patients who still have symptoms lasting six months or more after injury are defined as chronic. WAD is generated in all impact directions [5‐7]. In a Swedish study from the late 1990s it was found that 30%
of all WAD with long‐term symptoms occurred in frontal impacts. Approximately 50 % and 10 % occurred in rear‐end and side impacts respectively [8]. Whiplash preventive measures have mostly been focused on rear impacts. Since the late 1990s more advanced concepts aimed at reducing the risk of WAD have been introduced on
the market [6, 9‐11]. Better protection is achieved through improved geometry and dynamic properties of the head restraint or by active devices that move in a crash as the body loads the seat [12]. The main ways to lower the risk of WAD in rear impacts are to minimize the relative motion between head and torso, to control energy transfer between the seat and the human body and to absorb energy in the seatback. To date several main
A Kullgren is head of traffic research at Folksam Research, Sweden, and Professor at the Department of Applied Mechanics at Chalmers University of Technology, Sweden (phone: +46 70 831 68 35 [email protected]). H. Stigson is road safety researcher at Folksam Research, Sweden and Med. Dr. at the Division of Insurance Medicine, Department of Clinical Neuroscience, Karolinska Institutet, Sweden. M. Krafft is head of traffic and environmental research at Folksam Research, Sweden and Associate Professor in Traffic Medicine at Umeå University, Sweden.
Development of Whiplash Associated Disorders for Male and Female Car Occupants in Cars Launched Since the 80s in Different Impact Directions
Anders Kullgren, Helena Stigson and Maria Krafft
IRC-13-14 IRCOBI Conference 2013
- 51 -
concepts exist, for example Reactive Head Restraint (RHR), WHIPS (Whiplash Prevention System) in Volvo and Jaguar, WIL (Whiplash Injury Lessening) in Toyota. RHR was firstly introduced in Saab cars in 1998 (SAHR) [9] and was further developed in 2003. The RHR concept exists in several models, for example Audi (until MY2007), Ford, Mercedes, Nissan, Opel, Skoda, Seat and VW. RHR is a mechanical system that actively moves the head restraint up and closer to the head in a crash. Saab has apart from the head restraint also designed the seatback structure to better support the torso in a rear‐end crash. WHIPS was first introduced in Volvo cars in 1999 [6, 10]. The seat back in a crash moves rearwards and yields in a controlled way to absorb energy. The Toyota system WIL [11] has no active parts and is only working with improved geometry and softer seat back. Several manufacturers, such as Ford, Audi and Volkswagen (from MY 2007) have also introduced passive seat concepts without active or reactive parts in the headrest, but with an improved design aimed at reducing the risk of WAD. Studies have been presented showing the effect of the Saab RHR and Volvo WHIPS indicating a reducing
effect in WAD of approximately 20‐50% [13‐18]. Mostly the effect of different whiplash protection solutions has not been separated for gender. However, since risk for WAD differs dramatically between males and females, there is a need to evaluate the risk separately. In 2004 consumer test programmes were introduced (IIWPG and Folksam/SRA) [12]. And since 2009 the
European New Car Assessment Program (Euro NCAP) has implemented a whiplash rear‐end test. Consumer test programmes have probably speeded up the implementation on the market and to improve the performance. In order to improve the situation further, it is however important to measure the real‐world performance of existing whiplash prevention concepts for future activities in prevention, legislation and consumer testing. Many studies have shown that females have higher risk of WAD than males. Carlsson [19] have summarized
13 different studies showing the relative injury risk for females compared to males in rear impacts. According to these studies the injury risk varies from approximately 1.5 to 3 times higher risk for females, even under similar crash conditions. Jakobsson [15] found a higher reducing effect of WAD for females than for males comparing Volvo cars with WHIPS and without. But there is a need to further investigate the performance for different design concepts since they vary and partly address different possible injury criteria. Concerning WAD, the effect of model year and design improvements are rarely investigated for other impact
directions than rear end. In frontal collisions in car models from the early 1990s, driver airbags combined with seat belt pretensioners were found to have a high protective effect on WAD in Toyota cars even though mainly head and chest injuries were addressed with the protection device [20]. The influence of side impact protection systems such as side airbags and curtains on WAD have not been evaluated. It has been hypothesized that curtain airbags may reduce the risk of WAD [21]. The aim of this study was to investigate the development of Whiplash Associated Disorders (WAD) leading to long‐term consequences for drivers separated for gender in cars introduced at different year intervals and in different impact directions. An additional aim was to conduct a deeper analysis of the influence of various whiplash preventive concepts on WAD leading to long‐term consequences separated for gender. In the study the influence on symptoms of WAD lasting longer than one month and those leading to permanent medical impairment was studied. This study is partly a combined revision of two previous studies, Kullgren and Krafft [18] and Jonsson et al
[21], with similar aims but in the present study the outcome of long‐term consequences are adjusted to compensate for a more restrictive classification of symptoms leading to long‐term consequences that has been evident during the sampling period. This was not done in the previous studies. Furthermore, the data set in the present study is larger that enables deeper analysis than previous studies.
II. METHODS
Data were collected from a dataset from Folksam Insurance Group, one of the largest insurance companies in Sweden. Insurance claims were used to verify if the reported symptoms of WAD, Grades 1, 2 and 3 according to Spitzer et al [4], led to any long‐term symptoms. The WAD degree 1‐3 is not classified in this study since the aim is to investigate the proportion of long‐term symptoms irrespective of WAD degree. The definition of symptoms lasting longer than one month is that a medical doctor examined the occupant and the occupant claimed injury symptoms for more than four weeks, which corresponds to a payment of at least 2,000 SEK in the claims handling process used by Folksam. Definition of long‐term consequences/medical impairment: In case an injured occupant is not recovered after approximately one year, a medical assessment is made by medical specialists to predict the impairment degree. The injured occupant is classified with a degree of medical
IRC-13-14 IRCOBI Conference 2013
- 52 -
impairment, between 1‐100% depending on the injury type according to the Swedish manual for “Grading Medical Impairment” [22]. All Swedish insurance companies use this manual [22]. The manual consists of instructions of how to set the
degree of medical impairment and table works for all injury types and their consequences. In the impairment tables the degrees of impairment include physical and/or mental functional reduction as well as pain. In the case occupants have multiple injuries leading to medical impairment tables for cumulative degrees of impairments are included. The combined degree of impairments is usually a bit lower than the sum of impairment degrees for each injury. The medical impairment defined by this manual is independent of cause, occupation, hobbies or other special circumstances of the injured person. The occupant’s injury data before and after the injury are collected, and an assessment is made based on the information. Minor impairments are most often set between 5 and 35 %, medium impairments between 30 and 70 % and serious impairments between 65 and 90%. WAD often results in between 3‐18% of medical impairment degree. The whiplash symptoms are regarded as permanent when no additional improvement in the injured patient’s mental or physical status has taken place, normally a maximum of three years after the crash. If the injured person is unsatisfied with the decision of impairment level, he or she can request a reassessment of their case through a public commission. The request is submitted to the insurance company and forwarded to the commission. It has been found that medical expertise in Sweden gradually has been classifying long‐term consequences
from whiplash associated disorders more restrictively. A reduction factor to be used to compensate for this change in classification was calculated by studying the injury outcome for vehicles with identical introduction year over the sampling period. The risk of long‐term symptoms, given reported initial symptoms, should not change over the sampling period. The reduction in the likelihood of classifying an injury as a permanent medical impairment appears to be linear over the sampling period, from 1998 to 2012, and was found to be 11% per year for a large number of vehicle models and for a representative distribution of males and females. In the same way, the reduction in classification of those with symptoms lasting longer than one month was found to be 6.5% per year. The adjustments were made by weighting the number of occupants with long‐term symptoms according to the year of impact. In order not to change the total number of occupants with long‐term symptoms the weighting was made based on accident year 2005, which is the mean accident year in the accident sample. All occupants with long‐term symptoms in crashes occurring before 2005 were weighted lower and all after 2005 were weighted higher (Equation 1 and 2). By making an adjustment for accident year for each occupant, the outcomes from all groups of cars under study could be compared with each other. x1m,adjusted = x1m/1,065^(2005‐ yearaccident), x1m = occupant with symptoms > 1 month Eq (1)
xpmi ,adjusted = xpmi/1,11^(2005‐ yearaccident), xpmi = occupant with pmi Eq (2)
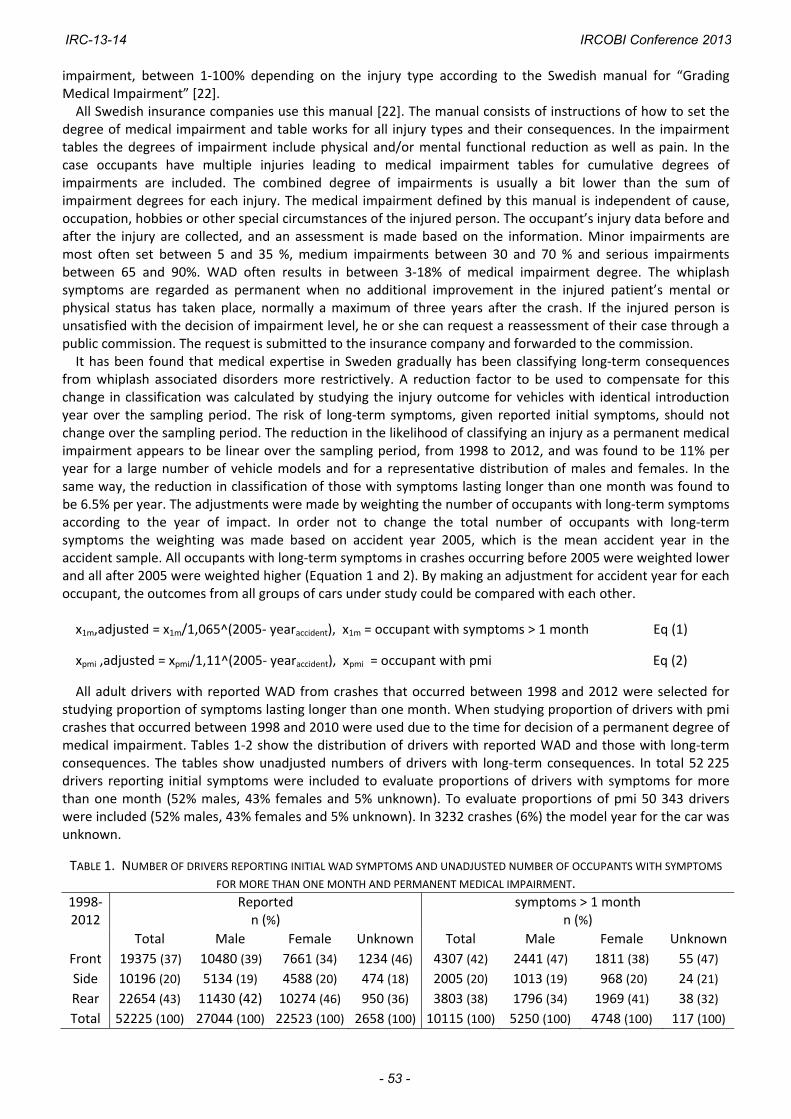
All adult drivers with reported WAD from crashes that occurred between 1998 and 2012 were selected for studying proportion of symptoms lasting longer than one month. When studying proportion of drivers with pmi crashes that occurred between 1998 and 2010 were used due to the time for decision of a permanent degree of medical impairment. Tables 1‐2 show the distribution of drivers with reported WAD and those with long‐term consequences. The tables show unadjusted numbers of drivers with long‐term consequences. In total 52 225 drivers reporting initial symptoms were included to evaluate proportions of drivers with symptoms for more than one month (52% males, 43% females and 5% unknown). To evaluate proportions of pmi 50 343 drivers were included (52% males, 43% females and 5% unknown). In 3232 crashes (6%) the model year for the car was unknown.
TABLE 1. NUMBER OF DRIVERS REPORTING INITIAL WAD SYMPTOMS AND UNADJUSTED NUMBER OF OCCUPANTS WITH SYMPTOMS
FOR MORE THAN ONE MONTH AND PERMANENT MEDICAL IMPAIRMENT.
1998‐2012
Reported n (%)
symptoms > 1 month n (%)
Total Male Female Unknown Total Male Female Unknown
Front 19375 (37) 10480 (39) 7661 (34) 1234 (46) 4307 (42) 2441 (47) 1811 (38) 55 (47)
Side 10196 (20) 5134 (19) 4588 (20) 474 (18) 2005 (20) 1013 (19) 968 (20) 24 (21)
Rear 22654 (43) 11430 (42) 10274 (46) 950 (36) 3803 (38) 1796 (34) 1969 (41) 38 (32)
Total 52225 (100) 27044 (100) 22523 (100) 2658 (100) 10115 (100) 5250 (100) 4748 (100) 117 (100)
IRC-13-14 IRCOBI Conference 2013
- 53 -
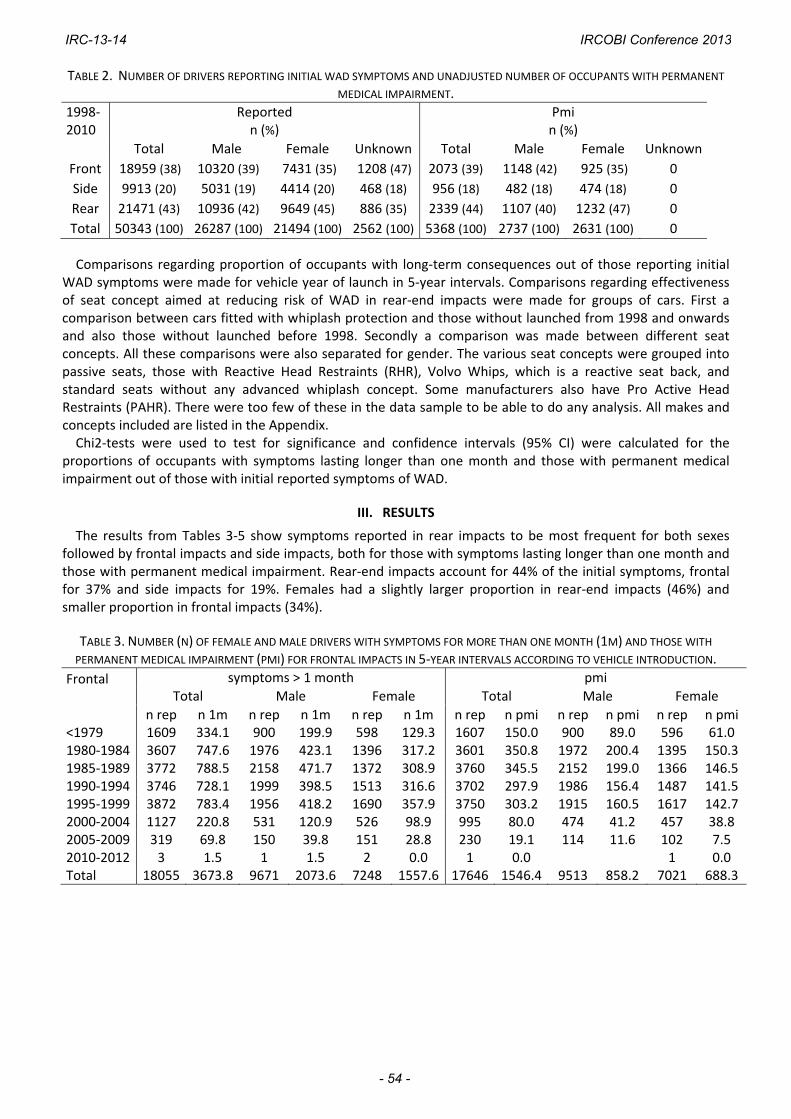
TABLE 2. NUMBER OF DRIVERS REPORTING INITIAL WAD SYMPTOMS AND UNADJUSTED NUMBER OF OCCUPANTS WITH PERMANENT
MEDICAL IMPAIRMENT.
1998‐2010
Reported n (%)
Pmi n (%)
Total Male Female Unknown Total Male Female Unknown
Front 18959 (38) 10320 (39) 7431 (35) 1208 (47) 2073 (39) 1148 (42) 925 (35) 0
Side 9913 (20) 5031 (19) 4414 (20) 468 (18) 956 (18) 482 (18) 474 (18) 0
Rear 21471 (43) 10936 (42) 9649 (45) 886 (35) 2339 (44) 1107 (40) 1232 (47) 0
Total 50343 (100) 26287 (100) 21494 (100) 2562 (100) 5368 (100) 2737 (100) 2631 (100) 0
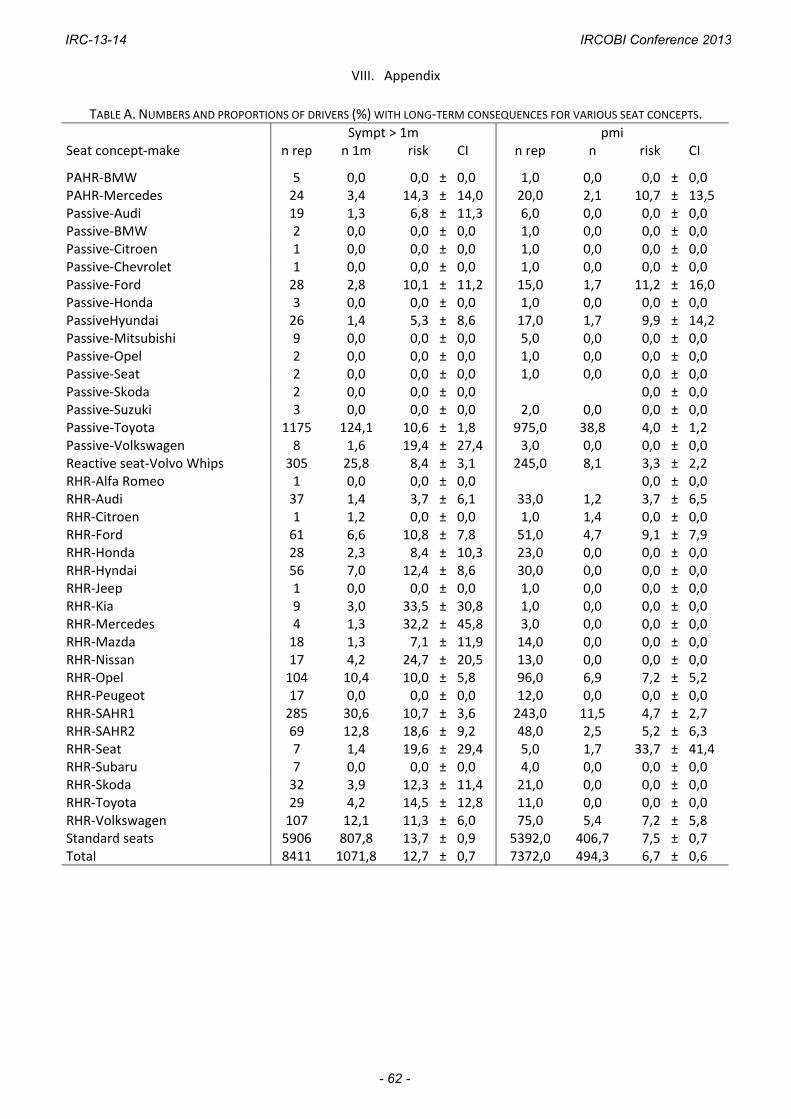
Comparisons regarding proportion of occupants with long‐term consequences out of those reporting initial WAD symptoms were made for vehicle year of launch in 5‐year intervals. Comparisons regarding effectiveness of seat concept aimed at reducing risk of WAD in rear‐end impacts were made for groups of cars. First a comparison between cars fitted with whiplash protection and those without launched from 1998 and onwards and also those without launched before 1998. Secondly a comparison was made between different seat concepts. All these comparisons were also separated for gender. The various seat concepts were grouped into passive seats, those with Reactive Head Restraints (RHR), Volvo Whips, which is a reactive seat back, and standard seats without any advanced whiplash concept. Some manufacturers also have Pro Active Head Restraints (PAHR). There were too few of these in the data sample to be able to do any analysis. All makes and concepts included are listed in the Appendix. Chi2‐tests were used to test for significance and confidence intervals (95% CI) were calculated for the
proportions of occupants with symptoms lasting longer than one month and those with permanent medical impairment out of those with initial reported symptoms of WAD.
III. RESULTS
The results from Tables 3‐5 show symptoms reported in rear impacts to be most frequent for both sexes followed by frontal impacts and side impacts, both for those with symptoms lasting longer than one month and those with permanent medical impairment. Rear‐end impacts account for 44% of the initial symptoms, frontal for 37% and side impacts for 19%. Females had a slightly larger proportion in rear‐end impacts (46%) and smaller proportion in frontal impacts (34%).
TABLE 3. NUMBER (N) OF FEMALE AND MALE DRIVERS WITH SYMPTOMS FOR MORE THAN ONE MONTH (1M) AND THOSE WITH
PERMANENT MEDICAL IMPAIRMENT (PMI) FOR FRONTAL IMPACTS IN 5‐YEAR INTERVALS ACCORDING TO VEHICLE INTRODUCTION.
Frontal
symptoms > 1 month pmi
Total Male Female Total Male Female
n rep n 1m n rep n 1m n rep n 1m n rep n pmi n rep n pmi n rep n pmi <1979 1609 334.1 900 199.9 598 129.3 1607 150.0 900 89.0 596 61.0 1980‐1984 3607 747.6 1976 423.1 1396 317.2 3601 350.8 1972 200.4 1395 150.3 1985‐1989 3772 788.5 2158 471.7 1372 308.9 3760 345.5 2152 199.0 1366 146.5 1990‐1994 3746 728.1 1999 398.5 1513 316.6 3702 297.9 1986 156.4 1487 141.5 1995‐1999 3872 783.4 1956 418.2 1690 357.9 3750 303.2 1915 160.5 1617 142.7 2000‐2004 1127 220.8 531 120.9 526 98.9 995 80.0 474 41.2 457 38.8 2005‐2009 319 69.8 150 39.8 151 28.8 230 19.1 114 11.6 102 7.5 2010‐2012 3 1.5 1 1.5 2 0.0 1 0.0 1 0.0 Total 18055 3673.8 9671 2073.6 7248 1557.6 17646 1546.4 9513 858.2 7021 688.3
IRC-13-14 IRCOBI Conference 2013
- 54 -
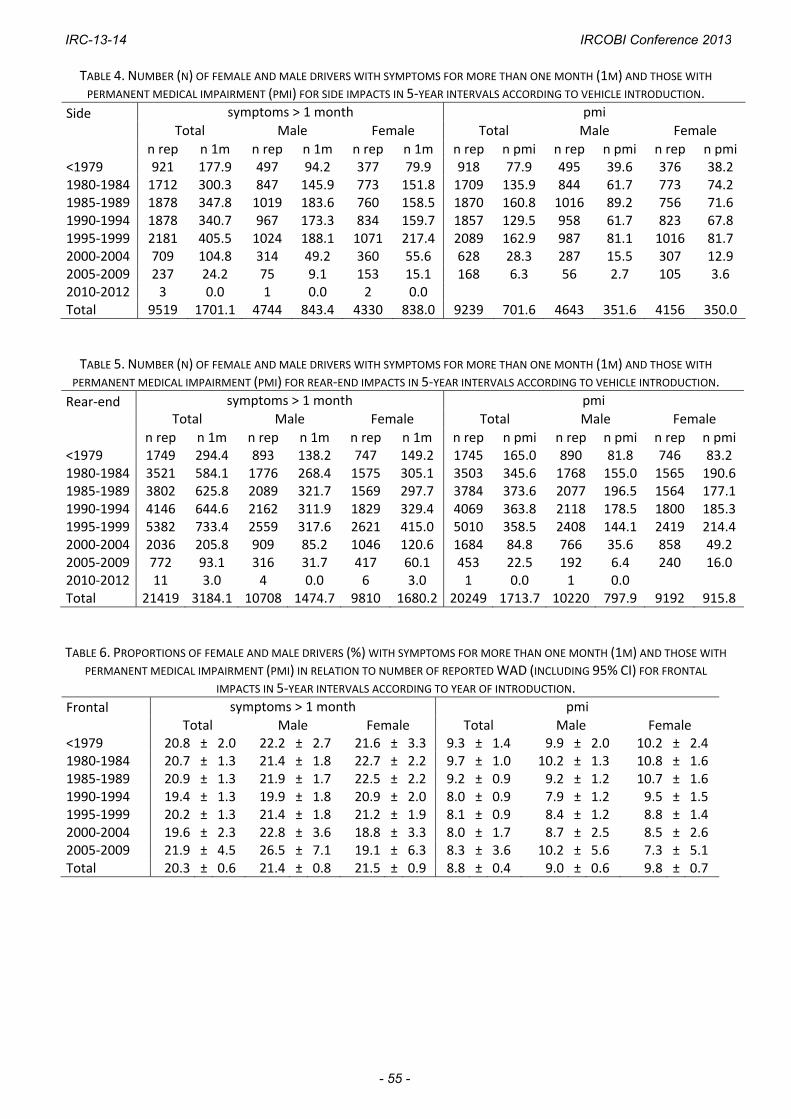
TABLE 4. NUMBER (N) OF FEMALE AND MALE DRIVERS WITH SYMPTOMS FOR MORE THAN ONE MONTH (1M) AND THOSE WITH
PERMANENT MEDICAL IMPAIRMENT (PMI) FOR SIDE IMPACTS IN 5‐YEAR INTERVALS ACCORDING TO VEHICLE INTRODUCTION.
Side
symptoms > 1 month pmi
Total Male Female Total Male Female
n rep n 1m n rep n 1m n rep n 1m n rep n pmi n rep n pmi n rep n pmi <1979 921 177.9 497 94.2 377 79.9 918 77.9 495 39.6 376 38.2 1980‐1984 1712 300.3 847 145.9 773 151.8 1709 135.9 844 61.7 773 74.2 1985‐1989 1878 347.8 1019 183.6 760 158.5 1870 160.8 1016 89.2 756 71.6 1990‐1994 1878 340.7 967 173.3 834 159.7 1857 129.5 958 61.7 823 67.8 1995‐1999 2181 405.5 1024 188.1 1071 217.4 2089 162.9 987 81.1 1016 81.7 2000‐2004 709 104.8 314 49.2 360 55.6 628 28.3 287 15.5 307 12.9 2005‐2009 237 24.2 75 9.1 153 15.1 168 6.3 56 2.7 105 3.6 2010‐2012 3 0.0 1 0.0 2 0.0 Total 9519 1701.1 4744 843.4 4330 838.0 9239 701.6 4643 351.6 4156 350.0
TABLE 5. NUMBER (N) OF FEMALE AND MALE DRIVERS WITH SYMPTOMS FOR MORE THAN ONE MONTH (1M) AND THOSE WITH
PERMANENT MEDICAL IMPAIRMENT (PMI) FOR REAR‐END IMPACTS IN 5‐YEAR INTERVALS ACCORDING TO VEHICLE INTRODUCTION.
Rear‐end
symptoms > 1 month pmi
Total Male Female Total Male Female
n rep n 1m n rep n 1m n rep n 1m n rep n pmi n rep n pmi n rep n pmi <1979 1749 294.4 893 138.2 747 149.2 1745 165.0 890 81.8 746 83.2 1980‐1984 3521 584.1 1776 268.4 1575 305.1 3503 345.6 1768 155.0 1565 190.6 1985‐1989 3802 625.8 2089 321.7 1569 297.7 3784 373.6 2077 196.5 1564 177.1 1990‐1994 4146 644.6 2162 311.9 1829 329.4 4069 363.8 2118 178.5 1800 185.3 1995‐1999 5382 733.4 2559 317.6 2621 415.0 5010 358.5 2408 144.1 2419 214.4 2000‐2004 2036 205.8 909 85.2 1046 120.6 1684 84.8 766 35.6 858 49.2 2005‐2009 772 93.1 316 31.7 417 60.1 453 22.5 192 6.4 240 16.0 2010‐2012 11 3.0 4 0.0 6 3.0 1 0.0 1 0.0 Total 21419 3184.1 10708 1474.7 9810 1680.2 20249 1713.7 10220 797.9 9192 915.8
TABLE 6. PROPORTIONS OF FEMALE AND MALE DRIVERS (%) WITH SYMPTOMS FOR MORE THAN ONE MONTH (1M) AND THOSE WITH
PERMANENT MEDICAL IMPAIRMENT (PMI) IN RELATION TO NUMBER OF REPORTED WAD (INCLUDING 95% CI) FOR FRONTAL IMPACTS IN 5‐YEAR INTERVALS ACCORDING TO YEAR OF INTRODUCTION.
Frontal
symptoms > 1 month pmi
Total Male Female Total Male Female <1979 20.8 ± 2.0 22.2 ± 2.7 21.6 ± 3.3 9.3 ± 1.4 9.9 ± 2.0 10.2 ± 2.4 1980‐1984 20.7 ± 1.3 21.4 ± 1.8 22.7 ± 2.2 9.7 ± 1.0 10.2 ± 1.3 10.8 ± 1.6 1985‐1989 20.9 ± 1.3 21.9 ± 1.7 22.5 ± 2.2 9.2 ± 0.9 9.2 ± 1.2 10.7 ± 1.6 1990‐1994 19.4 ± 1.3 19.9 ± 1.8 20.9 ± 2.0 8.0 ± 0.9 7.9 ± 1.2 9.5 ± 1.5 1995‐1999 20.2 ± 1.3 21.4 ± 1.8 21.2 ± 1.9 8.1 ± 0.9 8.4 ± 1.2 8.8 ± 1.4 2000‐2004 19.6 ± 2.3 22.8 ± 3.6 18.8 ± 3.3 8.0 ± 1.7 8.7 ± 2.5 8.5 ± 2.6 2005‐2009 21.9 ± 4.5 26.5 ± 7.1 19.1 ± 6.3 8.3 ± 3.6 10.2 ± 5.6 7.3 ± 5.1 Total 20.3 ± 0.6 21.4 ± 0.8 21.5 ± 0.9 8.8 ± 0.4 9.0 ± 0.6 9.8 ± 0.7
IRC-13-14 IRCOBI Conference 2013
- 55 -
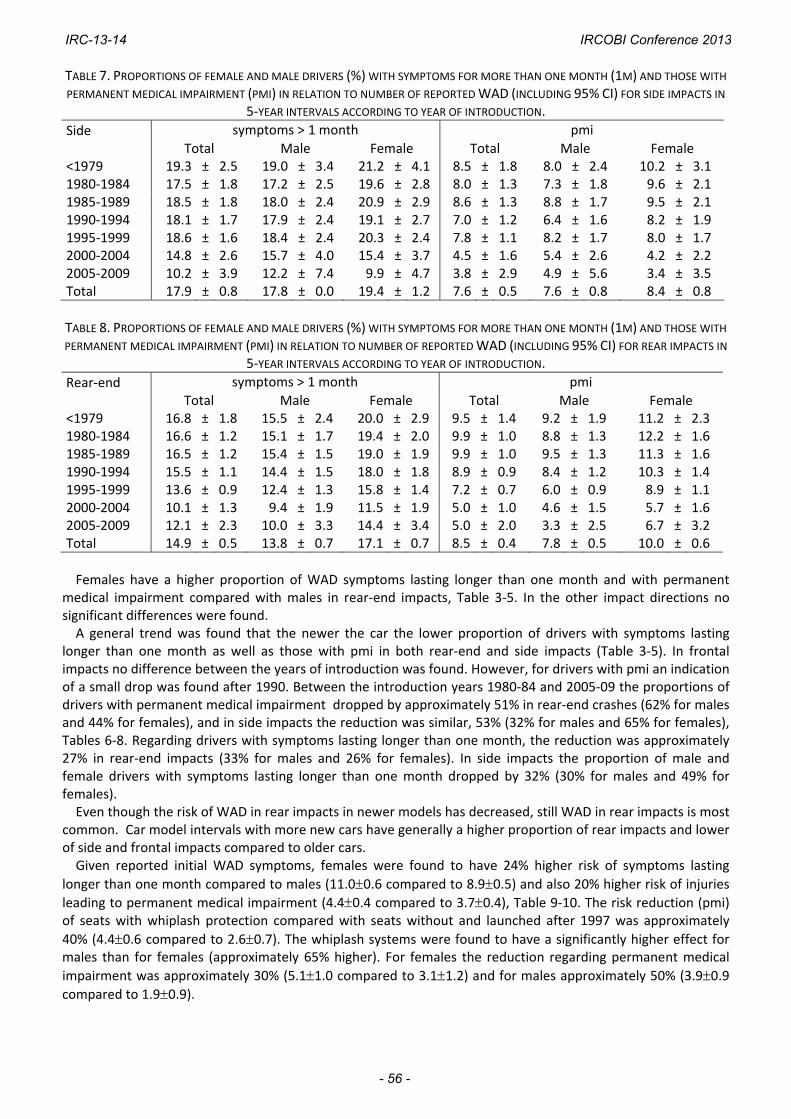
TABLE 7. PROPORTIONS OF FEMALE AND MALE DRIVERS (%) WITH SYMPTOMS FOR MORE THAN ONE MONTH (1M) AND THOSE WITH
PERMANENT MEDICAL IMPAIRMENT (PMI) IN RELATION TO NUMBER OF REPORTED WAD (INCLUDING 95% CI) FOR SIDE IMPACTS IN
5‐YEAR INTERVALS ACCORDING TO YEAR OF INTRODUCTION.
Side
symptoms > 1 month pmi
Total Male Female Total Male Female <1979 19.3 ± 2.5 19.0 ± 3.4 21.2 ± 4.1 8.5 ± 1.8 8.0 ± 2.4 10.2 ± 3.1 1980‐1984 17.5 ± 1.8 17.2 ± 2.5 19.6 ± 2.8 8.0 ± 1.3 7.3 ± 1.8 9.6 ± 2.1 1985‐1989 18.5 ± 1.8 18.0 ± 2.4 20.9 ± 2.9 8.6 ± 1.3 8.8 ± 1.7 9.5 ± 2.1 1990‐1994 18.1 ± 1.7 17.9 ± 2.4 19.1 ± 2.7 7.0 ± 1.2 6.4 ± 1.6 8.2 ± 1.9 1995‐1999 18.6 ± 1.6 18.4 ± 2.4 20.3 ± 2.4 7.8 ± 1.1 8.2 ± 1.7 8.0 ± 1.7 2000‐2004 14.8 ± 2.6 15.7 ± 4.0 15.4 ± 3.7 4.5 ± 1.6 5.4 ± 2.6 4.2 ± 2.2 2005‐2009 10.2 ± 3.9 12.2 ± 7.4 9.9 ± 4.7 3.8 ± 2.9 4.9 ± 5.6 3.4 ± 3.5 Total 17.9 ± 0.8 17.8 ± 0.0 19.4 ± 1.2 7.6 ± 0.5 7.6 ± 0.8 8.4 ± 0.8
TABLE 8. PROPORTIONS OF FEMALE AND MALE DRIVERS (%) WITH SYMPTOMS FOR MORE THAN ONE MONTH (1M) AND THOSE WITH
PERMANENT MEDICAL IMPAIRMENT (PMI) IN RELATION TO NUMBER OF REPORTED WAD (INCLUDING 95% CI) FOR REAR IMPACTS IN
5‐YEAR INTERVALS ACCORDING TO YEAR OF INTRODUCTION.
Rear‐end
symptoms > 1 month pmi
Total Male Female Total Male Female <1979 16.8 ± 1.8 15.5 ± 2.4 20.0 ± 2.9 9.5 ± 1.4 9.2 ± 1.9 11.2 ± 2.3 1980‐1984 16.6 ± 1.2 15.1 ± 1.7 19.4 ± 2.0 9.9 ± 1.0 8.8 ± 1.3 12.2 ± 1.6 1985‐1989 16.5 ± 1.2 15.4 ± 1.5 19.0 ± 1.9 9.9 ± 1.0 9.5 ± 1.3 11.3 ± 1.6 1990‐1994 15.5 ± 1.1 14.4 ± 1.5 18.0 ± 1.8 8.9 ± 0.9 8.4 ± 1.2 10.3 ± 1.4 1995‐1999 13.6 ± 0.9 12.4 ± 1.3 15.8 ± 1.4 7.2 ± 0.7 6.0 ± 0.9 8.9 ± 1.1 2000‐2004 10.1 ± 1.3 9.4 ± 1.9 11.5 ± 1.9 5.0 ± 1.0 4.6 ± 1.5 5.7 ± 1.6 2005‐2009 12.1 ± 2.3 10.0 ± 3.3 14.4 ± 3.4 5.0 ± 2.0 3.3 ± 2.5 6.7 ± 3.2 Total 14.9 ± 0.5 13.8 ± 0.7 17.1 ± 0.7 8.5 ± 0.4 7.8 ± 0.5 10.0 ± 0.6
Females have a higher proportion of WAD symptoms lasting longer than one month and with permanent
medical impairment compared with males in rear‐end impacts, Table 3‐5. In the other impact directions no significant differences were found. A general trend was found that the newer the car the lower proportion of drivers with symptoms lasting
longer than one month as well as those with pmi in both rear‐end and side impacts (Table 3‐5). In frontal impacts no difference between the years of introduction was found. However, for drivers with pmi an indication of a small drop was found after 1990. Between the introduction years 1980‐84 and 2005‐09 the proportions of drivers with permanent medical impairment dropped by approximately 51% in rear‐end crashes (62% for males and 44% for females), and in side impacts the reduction was similar, 53% (32% for males and 65% for females), Tables 6‐8. Regarding drivers with symptoms lasting longer than one month, the reduction was approximately 27% in rear‐end impacts (33% for males and 26% for females). In side impacts the proportion of male and female drivers with symptoms lasting longer than one month dropped by 32% (30% for males and 49% for females). Even though the risk of WAD in rear impacts in newer models has decreased, still WAD in rear impacts is most
common. Car model intervals with more new cars have generally a higher proportion of rear impacts and lower of side and frontal impacts compared to older cars. Given reported initial WAD symptoms, females were found to have 24% higher risk of symptoms lasting
longer than one month compared to males (11.00.6 compared to 8.90.5) and also 20% higher risk of injuries leading to permanent medical impairment (4.40.4 compared to 3.70.4), Table 9‐10. The risk reduction (pmi) of seats with whiplash protection compared with seats without and launched after 1997 was approximately
40% (4.40.6 compared to 2.60.7). The whiplash systems were found to have a significantly higher effect for males than for females (approximately 65% higher). For females the reduction regarding permanent medical
impairment was approximately 30% (5.11.0 compared to 3.11.2) and for males approximately 50% (3.90.9 compared to 1.90.9).
IRC-13-14 IRCOBI Conference 2013
- 56 -
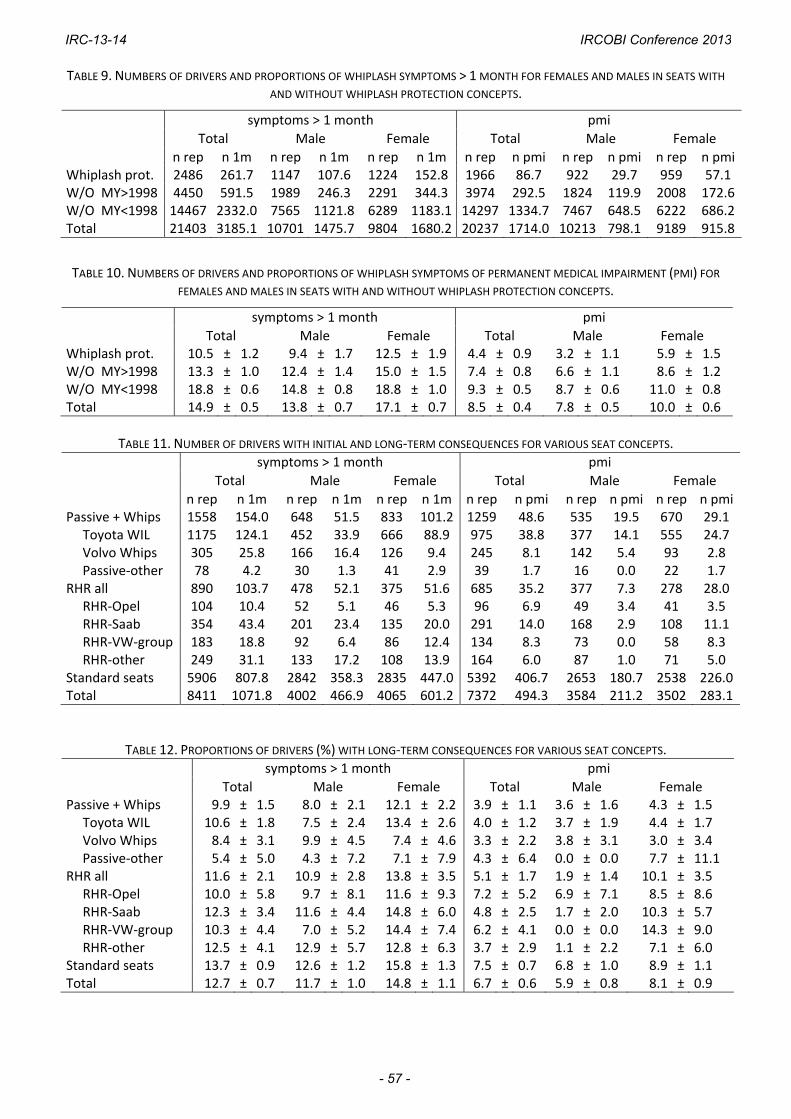
TABLE 9. NUMBERS OF DRIVERS AND PROPORTIONS OF WHIPLASH SYMPTOMS > 1 MONTH FOR FEMALES AND MALES IN SEATS WITH
AND WITHOUT WHIPLASH PROTECTION CONCEPTS.
symptoms > 1 month pmi
Total Male Female Total Male Female
n rep n 1m n rep n 1m n rep n 1m n rep n pmi n rep n pmi n rep n pmiWhiplash prot. 2486 261.7 1147 107.6 1224 152.8 1966 86.7 922 29.7 959 57.1 W/O MY>1998 4450 591.5 1989 246.3 2291 344.3 3974 292.5 1824 119.9 2008 172.6W/O MY<1998 14467 2332.0 7565 1121.8 6289 1183.1 14297 1334.7 7467 648.5 6222 686.2Total 21403 3185.1 10701 1475.7 9804 1680.2 20237 1714.0 10213 798.1 9189 915.8
TABLE 10. NUMBERS OF DRIVERS AND PROPORTIONS OF WHIPLASH SYMPTOMS OF PERMANENT MEDICAL IMPAIRMENT (PMI) FOR FEMALES AND MALES IN SEATS WITH AND WITHOUT WHIPLASH PROTECTION CONCEPTS.
symptoms > 1 month pmi
Total Male Female Total Male Female Whiplash prot. 10.5 ± 1.2 9.4 ± 1.7 12.5 ± 1.9 4.4 ± 0.9 3.2 ± 1.1 5.9 ± 1.5 W/O MY>1998 13.3 ± 1.0 12.4 ± 1.4 15.0 ± 1.5 7.4 ± 0.8 6.6 ± 1.1 8.6 ± 1.2 W/O MY<1998 18.8 ± 0.6 14.8 ± 0.8 18.8 ± 1.0 9.3 ± 0.5 8.7 ± 0.6 11.0 ± 0.8 Total 14.9 ± 0.5 13.8 ± 0.7 17.1 ± 0.7 8.5 ± 0.4 7.8 ± 0.5 10.0 ± 0.6
TABLE 11. NUMBER OF DRIVERS WITH INITIAL AND LONG‐TERM CONSEQUENCES FOR VARIOUS SEAT CONCEPTS.
symptoms > 1 month pmi
Total Male Female Total Male Female
n rep n 1m n rep n 1m n rep n 1m n rep n pmi n rep n pmi n rep n pmiPassive + Whips 1558 154.0 648 51.5 833 101.2 1259 48.6 535 19.5 670 29.1 Toyota WIL 1175 124.1 452 33.9 666 88.9 975 38.8 377 14.1 555 24.7 Volvo Whips 305 25.8 166 16.4 126 9.4 245 8.1 142 5.4 93 2.8 Passive‐other 78 4.2 30 1.3 41 2.9 39 1.7 16 0.0 22 1.7 RHR all 890 103.7 478 52.1 375 51.6 685 35.2 377 7.3 278 28.0 RHR‐Opel 104 10.4 52 5.1 46 5.3 96 6.9 49 3.4 41 3.5 RHR‐Saab 354 43.4 201 23.4 135 20.0 291 14.0 168 2.9 108 11.1 RHR‐VW‐group 183 18.8 92 6.4 86 12.4 134 8.3 73 0.0 58 8.3 RHR‐other 249 31.1 133 17.2 108 13.9 164 6.0 87 1.0 71 5.0 Standard seats 5906 807.8 2842 358.3 2835 447.0 5392 406.7 2653 180.7 2538 226.0Total 8411 1071.8 4002 466.9 4065 601.2 7372 494.3 3584 211.2 3502 283.1
TABLE 12. PROPORTIONS OF DRIVERS (%) WITH LONG‐TERM CONSEQUENCES FOR VARIOUS SEAT CONCEPTS.
symptoms > 1 month pmi
Total Male Female Total Male Female Passive + Whips 9.9 ± 1.5 8.0 ± 2.1 12.1 ± 2.2 3.9 ± 1.1 3.6 ± 1.6 4.3 ± 1.5 Toyota WIL 10.6 ± 1.8 7.5 ± 2.4 13.4 ± 2.6 4.0 ± 1.2 3.7 ± 1.9 4.4 ± 1.7 Volvo Whips 8.4 ± 3.1 9.9 ± 4.5 7.4 ± 4.6 3.3 ± 2.2 3.8 ± 3.1 3.0 ± 3.4 Passive‐other 5.4 ± 5.0 4.3 ± 7.2 7.1 ± 7.9 4.3 ± 6.4 0.0 ± 0.0 7.7 ± 11.1 RHR all 11.6 ± 2.1 10.9 ± 2.8 13.8 ± 3.5 5.1 ± 1.7 1.9 ± 1.4 10.1 ± 3.5 RHR‐Opel 10.0 ± 5.8 9.7 ± 8.1 11.6 ± 9.3 7.2 ± 5.2 6.9 ± 7.1 8.5 ± 8.6 RHR‐Saab 12.3 ± 3.4 11.6 ± 4.4 14.8 ± 6.0 4.8 ± 2.5 1.7 ± 2.0 10.3 ± 5.7 RHR‐VW‐group 10.3 ± 4.4 7.0 ± 5.2 14.4 ± 7.4 6.2 ± 4.1 0.0 ± 0.0 14.3 ± 9.0 RHR‐other 12.5 ± 4.1 12.9 ± 5.7 12.8 ± 6.3 3.7 ± 2.9 1.1 ± 2.2 7.1 ± 6.0 Standard seats 13.7 ± 0.9 12.6 ± 1.2 15.8 ± 1.3 7.5 ± 0.7 6.8 ± 1.0 8.9 ± 1.1 Total 12.7 ± 0.7 11.7 ± 1.0 14.8 ± 1.1 6.7 ± 0.6 5.9 ± 0.8 8.1 ± 0.9
IRC-13-14 IRCOBI Conference 2013
- 57 -
Both Volvo Whips and Toyota WIL showed lower risk of WAD leading to pmi as well as symptoms lasting longer than one month compared to cars with standard seats (Tables 11‐12). The reductions regarding occupants with symptoms lasting longer than one month were approximately 38% for Whips (8.4±3.1 compared to 13.7±0.9) and 23% for WIL (10.6±1.8 compared to 13.7±0.9). Regarding pmi the reductions were
approximately 56% for Volvo Whips (3.32.2 compared to 7.5±0.7) and 47% for Toyota WIL (4.0±1.2 compared
to 7.50.7). For the group RHR‐all including all seats with reactive head restraints, the reduction in risk of pmi was 32% (5.1±1.7 compared to 7.5±0.7). The group of cars consists of many different models listed in the Appendix. The data are too few to differentiate between the RHR concepts. Passive seats were found to have a lower risk of pmi for females compared with RHR. The results even
indicate that the risk for pmi for females is higher compared with standard seats, Table 12. The risk for pmi is higher for females compared to males in seats with RHR (10.1±3.5 compared to 1.9±1.4).
IV. DISCUSSION
The results from the present study are very positive and show that efforts made by car manufacturers to reduce risks of WAD have been successful, although there are still potential improvements to make, especially regarding the differences in effectiveness found between males and females. It is also important to focus on other impact directions than rear‐ends. WAD in rear‐end and side impacts has decreased, while WAD in frontal impacts appear to be more or less constant. Kullgren et al [20] showed a 41 % reduction of WAD in frontal impacts in cars equipped with seat belt pre‐
tensioners and frontal airbags compared to cars without. The airbag was introduced more widely in the Swedish market in the beginning of the 1990s. The indication of decrease in proportion of drivers with pmi after 1990 could be explained by this. However, it is clear that more effective preventive measures in frontal impacts are needed. Probably airbags, seat belt pretensioners and load limiters could be improved to take WAD into account. In side impacts the proportion of drivers with long‐term symptoms decreased between the introduction years
1980‐1984 and 2005‐2009. Side airbags and curtain airbags have been shown to reduce severe and fatal injuries in side impacts [23, 24]. But the influence on WAD has not been evaluated. Curtain airbags were introduced in Sweden in the beginning of 2000, which correlates well with the drop in proportion of long‐term consequences. It seems like the proportions of long‐term symptoms in side impacts dropped more for females than for males in cars launched between 1980‐84 and 2004‐09. One explanation could be that females benefit more than males from side airbags and curtain airbags due to anatomical differences. In rear‐end impacts a similar reduction as in side impacts was found between the introduction years. Lower
proportions of occupants with symptoms leading to permanent medical impairment were found for both males and females in the car group 2004‐2009 compared to 1995‐1999. The study results also show a greater decrease for males than for females. The introduction of whiplash preventive seat concepts at the end of the 1990s, and the fact that they are more effective for males, corresponds well with the reductions found for the years of launch. This study also shows that the existing whiplash preventive seat concepts reduce the risk of WAD leading to long‐term consequences and that they in general are more effective for males than for females. The results show that the effectiveness of whiplash protection systems is larger the more long‐term
consequences that are considered. In this study the effectiveness was approximately 20% regarding WAD with symptoms lasting longer than one month and approximately 40% for verified permanent medical impairment. However, it should be noted that even if studying symptoms lasting longer than just one month, the differences found between the various comparisons were large. In the present study seats designed to absorb energy in the seat back, such as passive seats and Volvo Whips, had equal or even somewhat higher effectiveness for females compared to males, while seats with Reactive Head Restraints (RHR) showed very high reductions for males (approximately 70%) and no reduction for females. This clearly shows that there is a fundamental difference in protecting males and females regarding WAD. RHR focusing on geometric performance initially in the crash phase appears to only affect males. Understanding these differences will probably be a key knowledge in improving future seat concepts and also to improve consumer test programmes.
IRC-13-14 IRCOBI Conference 2013
- 58 -
It is well known that females have a much higher risk for Whiplash Associated Disorders in rear impacts compared to males [25]. The results in the present study clearly show that the seats with RHR are much more effective for males than for females. They even appear to have no effect at all for females. Further research is important to clarify the findings in this study regarding differences in effectiveness between males and females for the various seat concepts. Based on modeling, Viano [26] pointed out that early neck displacements are greater in females because of a higher ratio of seat stiffness to torso mass. The seat stiffness is not sufficiently low in proportion to the female mass in comparison to males. Since females seems to be much more vulnerable to whiplash injuries it is important for preventative measures to determine test criteria, trigger level of protection systems and critical levels of crash test severity mainly based on data related to females, and not based on mean values for the total population. Furthermore, the 50th percentile male dummy might limit the assessment and development of prevention systems that adequately protect both males and females since there might be anatomical differences that partly explain the risk difference [19, 25]. WAD accounts for approximately 50 % of all injuries leading to permanent medical impairment, all crash
directions included [1]. Even if half of the whiplash injuries in rear‐end crashes could be avoided, whiplash will still be the most dominating injury leading to loss of health. Therefore further efforts are necessary to decrease the injury risk in other crash directions than rear‐end. Apart from the variation in effectiveness between the concepts found in this study, results from existing
consumer crash test programmes also indicate a large variation in protection [12, 27]. Some seats perform well even without more advanced whiplash protection systems, while some seats fitted with concepts aimed at reducing risk of WAD seem to receive poor rating results. Identifying that a seat has a whiplash protection device is not enough. It stresses the need for both real‐life studies and consumer test programmes to guide both manufacturers to focus on the most effective concepts and consumers to pick the cars that offer the best protection. To improve the validity and reliability when studying whiplash risks and effectiveness of whiplash concepts
two various definitions of long‐term consequences were used, as it is well known that there are several reasons to report whiplash symptoms. In this way those occupants reporting whiplash symptoms without having any symptoms or those with very short‐term symptoms (less than a week) were excluded. In this study a payment of at least 2,000 SEK was used to define occupants with symptoms lasting longer than
one month. At Swedish insurance companies a general payment of 500 SEK is made each week an occupant is claiming symptoms, but only if the occupant has visited a physician at a hospital or at a emergency care center. The maximum sum for this first general payment is 2,500 SEK corresponding to 5 weeks suffering. After the first month a more thorough examination is made whereby a first decision of a preliminary degree of permanent medical impairment is made by a physician one year after the crash for the occupant claiming symptoms. After three years a final impairment degree is decided. Depending on the degree of impairment and other factors, such as age and occupation, a payment is decided. This payments process and sums may vary considerably between different countries. So it is not recommended to use payments as an indicator for symptoms duration unless the procedures have been checked and verified in each specific country.
Limitations Only proportions given reported WAD were studied and not the absolute risk of sustaining long‐term
consequences. Variations in the risk of reporting WAD are not covered. The differences between vehicle groups and gender could therefore be anticipated to be larger than the ones found. One fact that to some degree influences the results is that the real‐world injury outcome concerns the
performance of the whole car and not only the seat. For instance, there is a correlation between crash severity and risk of WAD [28], which means that heavier cars have an advantage in rear impacts that influences the result from real‐world data. Influence of occupant age, stature and weight was not considered in this study. Studies have shown an
influence of age and stature [7, 29, 30]. The risk of WAD is somewhat greater to the age group 20 to 50 than for the older and younger age groups. Increasing stature seems to influence the risk for both genders. It is reasonable to believe that there is a correlation between occupant age/stature and car size. But in the present study the size of the models are relatively mixed between the study groups and therefore the differences in average age, stature or weight between the groups in the present study could be anticipated to be small, thus the influence on the results or conclusions should be limited.
IRC-13-14 IRCOBI Conference 2013
- 59 -
V. CONCLUSIONS
A reduction of the proportion of drivers with long‐term consequences after reporting initial symptoms of Whiplash Associated Disorders (WAD) were found in rear‐end and side impacts comparing cars introduced on the market 1980‐84 and those introduced 2005‐2009. No reduction was found in frontal impacts. This clearly shows that more focus on preventive interventions for frontal impacts is needed. Existing seat concepts aimed at lowering the risk of WAD were found to reduce the risk of long‐term
consequences after reporting initial symptoms of WAD. However, some differences between the concepts could be identified. Seats with energy absorption in the seat back, passive seats or reactive seat backs are more effective for females than seats with Reactive Head Restraints (RHR). RHR shows no major reduction of WAD with long‐term consequences compared with standard seats.
VI. ACKNOWLEDGEMENTS
The study was partly financed by the European Union Seventh Framework Programme and has been a part of the ADSEAT project (Adaptive Seat to Reduce Neck Injuries for Female and Male Occupants). Project no. 233904. Thanks to Matteo Rizzi, Folksam, for assisting with the tables and the data.
VII. REFERENCES
1. Krafft M. Non‐fatal injuries to car occupants, Injury assessment and analysis of impacts causing short‐ and long‐term consequences with special reference to neck injuries Institute of Clinical Neuroscience, Section on Injury Prevention Karolinska Institute, Folksam Research. PhD. 1998.
2. Nygren Å. Injuries to Car Occupants ‐ Some Aspects of the Interior Safety of Cars Acta Oto‐Laryngologica, Karolinska Institutet. PhD. 1984.
3. Harder S., Veilleux M., and Suissa S. The effect of socio‐demographic and crash‐related factors on the prognosis of whiplash. Journal of Clinical Epidemiology 51(5): 377‐84. 1998.
4. Spitzer W.O., Skovron M.L., Salmi L.R., Cassidy J.D., Duranceau J., Suissa S., and Zeiss E. Scientific monograph of the Quebec Task Force on Whiplash‐Associated Disorders: redefining "whiplash" and its management. Spine (Phila Pa 1976) 20(8 Suppl): 1S‐73S. 1995.
5. Morris A. and Thomas P. Neck Injuries in the UK Co‐operative Crash Injury Study. Proceedings of the 40th Stapp Car crash conf., SAE 962433 pp: 317‐329.1996.
6. Jakobsson L., Automobile Design and Whiplash Prevention, in Whiplash Injuries: Current Concepts in Prevention, Diagnoses and Treatment of the Cervical Whiplash Syndrome., R. Gunzberg and M. Szpalski, Editors. 1998, Lippincott‐Raven Publishers: Philadelphia. pp: 299‐306.
7. Temming J. and Zobel R. Frequency and Risk of cervical Spine Distortion Injuries in Passenger Car Accidents: Significance of Human factors Data. Proceedings of the IRCOBI conf pp: 219‐233 Bron, France.1998.
8. Krafft M. When do AIS 1 Neck Injuries result in Long‐Term Consequences; Vehicle and Human Factors. Traffic Inj Prev 3(2): 89‐97. 2002.
9. Wiklund K. and Larsson H. SAAB Active Head Restraint (SAHR) ‐ Seat Design to Reduce the Risk of Neck Injuries in Rear Impacts. SAE Paper 980297 Warrendale. 1997.
10. Lundell B., Jakobson L., Alfredsson B., Lindström M., and Simonsson L. The WHIPS seat – A car seat for improved protection against neck injuries in rear end impacts Paper No 98‐S7‐O‐08, Proc. 16th ESV Conf. 1998.
11. Sekizuka M. Seat Designs for Whiplash Injury Lessening. Proceedings of the 16th Int. Techn. Conf. on ESV Windsor, Canada.1998.
12. Thatcham. Thatcham whiplash ratings. 2013. 13. Viano D.C. and Olsen S. The effectiveness of active head restraint in preventing whiplash. Journal of
Trauma 51(5): 959‐69. 2001. 14. Farmer C.M., Zuby D.S., Wells J.K., and Hellinga L.A. Relationship of dynamic seat ratings to real‐world
neck injury rates. Traffic Inj Prev 9(6): 561‐7. 2008. 15. Jakobson L. Whiplash Associated Disorders in Frontal and Rear‐End Car Impacts. Biomechanical, Crash
Safety Division , Dep of Machine and Vehicle Systems. , Chalmers University of Technology. Doctor of philosophy. 2004.
IRC-13-14 IRCOBI Conference 2013
- 60 -
16. Jakobsson L., Isaksson‐Hellman I., and Lindman M. WHIPS (Volvo cars' Whiplash Protection System)‐the development and real‐world performance. Traffic Inj Prev 9(6): 600‐5. 2008.
17. Krafft M., Kullgren A., Lie A., and Tingvall C. The risk of whiplash injury in the rear seat compared to the front seat in rear impacts. Traffic Inj Prev 4(2): 136‐40. 2003.
18. Kullgren A. and Krafft M. Gender Analysis on Whiplash Seat Effectiveness: Results from Real‐world Crashes Proceedings of the Int. IRCOBI Conf. on the Biomechanics of Injury Hannover.2010.
19. Carlsson A. Initial Studies of Dynamic Responces of Femlae and Male Volunteers in Rear Impact Tests. Department of Applied Mechanics Chalmers University of Technology, Licentiate of engineering( no 2010:01 ISSN 1652‐8565.). 2010.
20. Kullgren A., Krafft M., Malm S., Ydenius A., and Tingvall C. Influence of Airbags and Seatbelt Pretensioners on AIS1 Neck Injuries for Belted Occupants in Frontal Impacts. Stapp Car Crash J 44 (SAE P‐362): 117‐25. 2000.
21. Jonsson B., Krafft M., and Kullgren A. Development of AIS1 Neck Injuries for Adult and Child Occupants in Cars Launched Since the 80s in Different Impact Directions. Proceedings of the Int. IRCOBI Conf. on the Biomechanics of Injury.2011.
22. TheRoadTrafficInjuriesCommission. The activities of The Road TrafficInjuries Commission(Trafikskadenämnden) in Sweden in determining compensation for personal injuries resulting from the use of motor vehicles. 2011; Available from: http://www.trafikskadenamnden.se/upload/Om%20TSN/Om%20n%C3%A4mnden%20p%C3%A 5%20engelska.pdf . Accessed 21 Jan 2011.
23. McCartt A.T. and Kyrychenko S.Y. Efficacy of side airbags in reducing driver deaths in driver‐side car and SUV collisions. Traffic Inj Prev 8(2): 162‐70. 2007.
24. Stigson H. and Kullgren A. Effect of Side Impact Protection in Reducing Injuries. Proceedings of the 22th International Conference on the Enhanced Safety Vehicles (ESV) pp: Paper Number 11‐0319 Washington, DC. 2011.
25. Carlsson A. Addressing Female Whiplash Injury Protection ‐ A Step Towards 50th Percentile Female Rear Impact Occupant Models. Department of Applied Mechanics, Chalmers University of Technology. PhD. 2012.
26. Viano D.C. Seat influences on female neck responses in rear crashes: a reason why women have higher whiplash rates. Traffic Inj Prev 4(3): 228‐39. 2003.
27. EuroNCAP. 2008 03‐07‐08]; Available from: http://www.euroncap.com/home.aspx. 28. Krafft M., Kullgren A., Malm S., and Ydenius A. Influence of Crash Severity on Various Whiplash Injury
Symptoms: A Study Based on Real‐life Rear‐end Crashes with Recorded Crash Pulses. Proceedings of the 19th International Conference on the Enhanced Safety Vehicles (ESV) Paper No. 05‐0363 Washington DC, USA.2005.
29. Jakobson L. Fields analysis of AIS1 neck injuries in rear end car impacts – injury reducing effect of WHIPS. Journal of Whiplash & Related Disorders 3(2): 37‐53. 2005.
30. Berglund A., Alfredsson L., Jensen I., Bodin L., and Nygren A. Occupant‐ and crash‐related factors associated with the risk of whiplash injury. Annals of Epidemiology 13(1): 66‐72. 2003.
IRC-13-14 IRCOBI Conference 2013
- 61 -
VIII. Appendix
TABLE A. NUMBERS AND PROPORTIONS OF DRIVERS (%) WITH LONG‐TERM CONSEQUENCES FOR VARIOUS SEAT CONCEPTS.
Sympt > 1m pmi Seat concept‐make n rep n 1m risk CI n rep n risk CI
PAHR‐BMW 5 0,0 0,0 ± 0,0 1,0 0,0 0,0 ± 0,0 PAHR‐Mercedes 24 3,4 14,3 ± 14,0 20,0 2,1 10,7 ± 13,5 Passive‐Audi 19 1,3 6,8 ± 11,3 6,0 0,0 0,0 ± 0,0 Passive‐BMW 2 0,0 0,0 ± 0,0 1,0 0,0 0,0 ± 0,0 Passive‐Citroen 1 0,0 0,0 ± 0,0 1,0 0,0 0,0 ± 0,0 Passive‐Chevrolet 1 0,0 0,0 ± 0,0 1,0 0,0 0,0 ± 0,0 Passive‐Ford 28 2,8 10,1 ± 11,2 15,0 1,7 11,2 ± 16,0 Passive‐Honda 3 0,0 0,0 ± 0,0 1,0 0,0 0,0 ± 0,0 PassiveHyundai 26 1,4 5,3 ± 8,6 17,0 1,7 9,9 ± 14,2 Passive‐Mitsubishi 9 0,0 0,0 ± 0,0 5,0 0,0 0,0 ± 0,0 Passive‐Opel 2 0,0 0,0 ± 0,0 1,0 0,0 0,0 ± 0,0 Passive‐Seat 2 0,0 0,0 ± 0,0 1,0 0,0 0,0 ± 0,0 Passive‐Skoda 2 0,0 0,0 ± 0,0 0,0 ± 0,0 Passive‐Suzuki 3 0,0 0,0 ± 0,0 2,0 0,0 0,0 ± 0,0 Passive‐Toyota 1175 124,1 10,6 ± 1,8 975,0 38,8 4,0 ± 1,2 Passive‐Volkswagen 8 1,6 19,4 ± 27,4 3,0 0,0 0,0 ± 0,0 Reactive seat‐Volvo Whips 305 25,8 8,4 ± 3,1 245,0 8,1 3,3 ± 2,2 RHR‐Alfa Romeo 1 0,0 0,0 ± 0,0 0,0 ± 0,0 RHR‐Audi 37 1,4 3,7 ± 6,1 33,0 1,2 3,7 ± 6,5 RHR‐Citroen 1 1,2 0,0 ± 0,0 1,0 1,4 0,0 ± 0,0 RHR‐Ford 61 6,6 10,8 ± 7,8 51,0 4,7 9,1 ± 7,9 RHR‐Honda 28 2,3 8,4 ± 10,3 23,0 0,0 0,0 ± 0,0 RHR‐Hyndai 56 7,0 12,4 ± 8,6 30,0 0,0 0,0 ± 0,0 RHR‐Jeep 1 0,0 0,0 ± 0,0 1,0 0,0 0,0 ± 0,0 RHR‐Kia 9 3,0 33,5 ± 30,8 1,0 0,0 0,0 ± 0,0 RHR‐Mercedes 4 1,3 32,2 ± 45,8 3,0 0,0 0,0 ± 0,0 RHR‐Mazda 18 1,3 7,1 ± 11,9 14,0 0,0 0,0 ± 0,0 RHR‐Nissan 17 4,2 24,7 ± 20,5 13,0 0,0 0,0 ± 0,0 RHR‐Opel 104 10,4 10,0 ± 5,8 96,0 6,9 7,2 ± 5,2 RHR‐Peugeot 17 0,0 0,0 ± 0,0 12,0 0,0 0,0 ± 0,0 RHR‐SAHR1 285 30,6 10,7 ± 3,6 243,0 11,5 4,7 ± 2,7 RHR‐SAHR2 69 12,8 18,6 ± 9,2 48,0 2,5 5,2 ± 6,3 RHR‐Seat 7 1,4 19,6 ± 29,4 5,0 1,7 33,7 ± 41,4 RHR‐Subaru 7 0,0 0,0 ± 0,0 4,0 0,0 0,0 ± 0,0 RHR‐Skoda 32 3,9 12,3 ± 11,4 21,0 0,0 0,0 ± 0,0 RHR‐Toyota 29 4,2 14,5 ± 12,8 11,0 0,0 0,0 ± 0,0 RHR‐Volkswagen 107 12,1 11,3 ± 6,0 75,0 5,4 7,2 ± 5,8 Standard seats 5906 807,8 13,7 ± 0,9 5392,0 406,7 7,5 ± 0,7 Total 8411 1071,8 12,7 ± 0,7 7372,0 494,3 6,7 ± 0,6
IRC-13-14 IRCOBI Conference 2013
- 62 -


![Court of Queen’s Bench of Alberta - cdn.ymaws.com · [13] On October 23, 2004, Ms. Morrow saw Dr. Gash who diagnosed a grade 2 whiplash associated disorder (WAD-II). Dr. Gash prescribed](https://img.pdfslide.us/doc/110x75/5ecd7bf01218753adf1afbe3/court-of-queenas-bench-of-alberta-cdnymawscom-13-on-october-23-2004-ms.jpg)