Embed Size (px)
Citation preview
Development of truly portable track geometryrecording trolley and accompanying newmeasurement principle
Y. Naganuma & T. YadaTechnology Research and Development Department,Central Japan Railway Company, Japan
Abstract
In 2015, a truly portable track geometry measuring trolley was successfullydeveloped to enable real-time measurement after all track maintenance work. Anexperimental model named LRSX01 (development code) was realized that is small(disassembled total length of 1600 mm maximum) and lightweight (9.5 kg, whichis about one-third that of track geometry measuring trolley LIGHTREC). Sevenitems may be measured in real-time; track gauge, cross level, 10m alignment (rightand left), 10 m longitudinal level (right and left), and twist. Measuring accuracy ishigh, and it far outperforms current track geometry measuring trolleys in terms ofrepeatability error. Mechanism of the LRSX01 is very simple and easy to maintainbecause there are no moving parts for measuring alignment and longitudinal level.These advantages, which are not found on any similar conventional product, wereachieved with a brand-new track geometry measuring principle called “differentialdifference method” for the LRSX01. The LRSX01 product model will go on saleglobally in April 2017.Keywords: track geometry measuring trolley, differential difference method,MEMS gyroscope.
1 Introduction
As part of maintenance planning at JR-Central, track geometry is measured bya high-speed track recording car every 10 days on the Tokaido Shinkansen [1]and every month on conventional lines. To confirm the state of the track after
www.witpress.com, ISSN 1743-3509 (on-line) WIT Transactions on The Built Environment, Vol 162, © 2016 WIT Press
doi:10.2495/CR160301
This paper is part of the Proceedings of the 15 International Conference th
on Railway Engineering Design and Operation (CR 2016) www.witconferences.com
maintenance work, a measuring system built into the maintenance machinery isfrequently used after ballast renewal work and a track geometry measuring trolleyknown as LIGHTREC [2] is used after concrete sleeper renewal. However, eventoday, track that is maintained manually is still measured by means of a manualsurvey using a chord and scale. Many types of portable measuring equipmentand trolleys, including LIGHTREC, have been developed and sold globally.Nevertheless, these are rarely used after manual work, because most equipmentis too large and heavy to transport and remove from the track when a train passes.Moreover, it is too expensive to purchase the number of devices required for everymaintenance site.
To provide a solution for such problems, in 2015, we once again launcheddevelopment of a small, inexpensive and lightweight track geometry recordingtrolley that utilizes the latest sensors and data processing technology with the aimof introducing a device for measuring track geometry of all maintenance work.
2 Conventional measurement principal
2.1 Second-order difference method
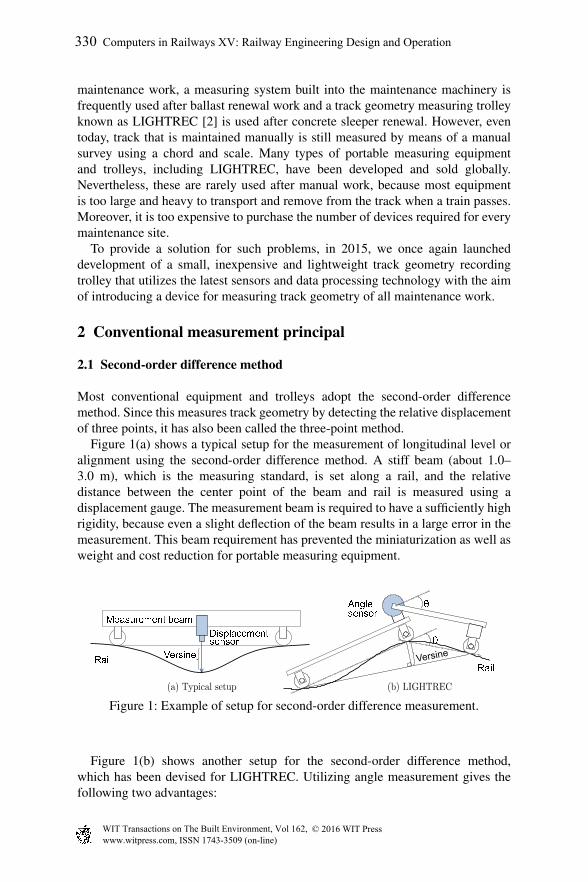
Most conventional equipment and trolleys adopt the second-order differencemethod. Since this measures track geometry by detecting the relative displacementof three points, it has also been called the three-point method.
Figure 1(a) shows a typical setup for the measurement of longitudinal level oralignment using the second-order difference method. A stiff beam (about 1.0–3.0 m), which is the measuring standard, is set along a rail, and the relativedistance between the center point of the beam and rail is measured using adisplacement gauge. The measurement beam is required to have a sufficiently highrigidity, because even a slight deflection of the beam results in a large error in themeasurement. This beam requirement has prevented the miniaturization as well asweight and cost reduction for portable measuring equipment.
θθ
Angle sensorRailRail
Displacement sensorMeasurement beamVersine
Figure 1: Example of setup for second-order difference measurement.
Figure 1(b) shows another setup for the second-order difference method,which has been devised for LIGHTREC. Utilizing angle measurement gives thefollowing two advantages:
330 Computers in Railways XV: Railway Engineering Design and Operation
www.witpress.com, ISSN 1743-3509 (on-line) WIT Transactions on The Built Environment, Vol 162, © 2016 WIT Press

(a) Beams can be folded to half the chord length for transportation.(b) Because the force on each component is small, LIGHTREC is able to use
slender beams, significantly reducing overall weight.
2.2 First-order difference method
A few types of track geometry measuring trolleys do not adopt the second-orderdifference method. In one type, a trolley detects the slope of the track (pitch of thetrolley) using an inclinometer, which is equipped for standard measuring, and thenthe longitudinal level is obtained by integrating the slope over the distance [3]. Thismethod measures the difference between two points of the track geometry, so it iscalled the first-order difference method or the two-point method. Since the first-order difference method requires two measuring points, it is an attractive methodfor measuring track geometry. However, it is difficult to apply for alignment,because an expensive sensor such as an IMU (Inertial Measurement Unit) isrequired to detect the yaw angle.
3 New measurement method for LRSX01
3.1 Two-point angle method
For high accuracy profile measurements, a measuring method known as the two-point angle method is frequently used [4]. Figure 2 shows a schematic of theprinciple behind this method. Two optical sensors, known as laser autocollimators,are mounted on a measurement stage to determine the angle, which is the firststage distance differential, to measure the shape according to the differentialoutput (difference) between the surface of the object and the stage. A differentialoperation for the two sensors can be used to cancel errors due to pitching andbouncing motion of the stage.
Measuredobject
Laserautocollimator Measurement beam
Figure 2: Principle of the two-point angle method (moving laser autocollimator).
Just as with the first-order difference method, the two-point angle methodrequires only two measurement points, so it presents a highly attractive method for
Computers in Railways XV: Railway Engineering Design and Operation 331
www.witpress.com, ISSN 1743-3509 (on-line) WIT Transactions on The Built Environment, Vol 162, © 2016 WIT Press
measuring track geometry. However, because the laser autocollimator is affectedby the reflection factor of the measurement object, it is difficult to apply thismethod to track geometry measurement because rails are not ideal surfaces foran autocollimator as reflected light is dampened due to grime and reflected fully atwheel contact points.
3.2 Differential difference method
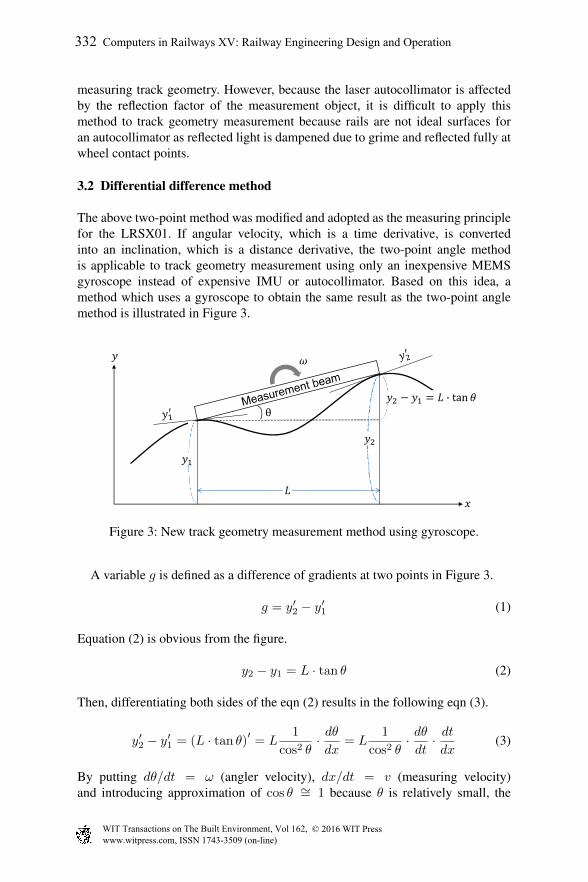
The above two-point method was modified and adopted as the measuring principlefor the LRSX01. If angular velocity, which is a time derivative, is convertedinto an inclination, which is a distance derivative, the two-point angle methodis applicable to track geometry measurement using only an inexpensive MEMSgyroscope instead of expensive IMU or autocollimator. Based on this idea, amethod which uses a gyroscope to obtain the same result as the two-point anglemethod is illustrated in Figure 3.
Figure 3: New track geometry measurement method using gyroscope.
A variable g is defined as a difference of gradients at two points in Figure 3.
g = y′2 − y′1 (1)
Equation (2) is obvious from the figure.
y2 − y1 = L · tan θ (2)
Then, differentiating both sides of the eqn (2) results in the following eqn (3).
y′2 − y′1 = (L · tan θ)′ = L1
cos2 θ· dθdx
= L1
cos2 θ· dθdt· dtdx
(3)
By putting dθ/dt = ω (angler velocity), dx/dt = v (measuring velocity)and introducing approximation of cos θ ∼= 1 because θ is relatively small, the
332 Computers in Railways XV: Railway Engineering Design and Operation
www.witpress.com, ISSN 1743-3509 (on-line) WIT Transactions on The Built Environment, Vol 162, © 2016 WIT Press
difference of gradient g is expressed in the following simple equation.
g ∼=Lω
v(4)
Equation (4) shows that track geometry, which does not depend on themeasuring speed, is provided by following procedure.
(a) A gyroscope is put on a measurement beam of length L.(b) L is multiplied by output pitch angular velocity (or yaw angle velocity) from
the gyroscope.(c) The result is divided by the measured velocity v.This method uses the gyroscope which is an inertial sensor, but does not
necessitate the integral calculus, which is usually required. Therefore, it isunrelated to the drift and revolutionary in that it always stably measures trackgeometry.
This newly devised principle has the same measurement characteristics as thetwo-point angle method, but the sensor configuration is very different. Moreover,this method has not been utilized at all for track geometry measurement. Therefore,we named this new track measuring method the “differential difference method(DD-method).”
3.3 Measurement characteristics of the DD-method
The DD-method is expressed as eqn (5) when L = 2l.
g (x) = (y (x+ l)− y (x− l))′ (5)
The frequency response function H (ω) is expressed as eqn (6) using Fouriertransform of eqn (5).
H (ω) = jω(ejωt − e−jωt
)= −2ω sinωl (6)
Gain and phase characteristics are expressed as shown in eqn (7).
|H (ω)| = 2ω |sinωl|θ (ω) = 0
(7)
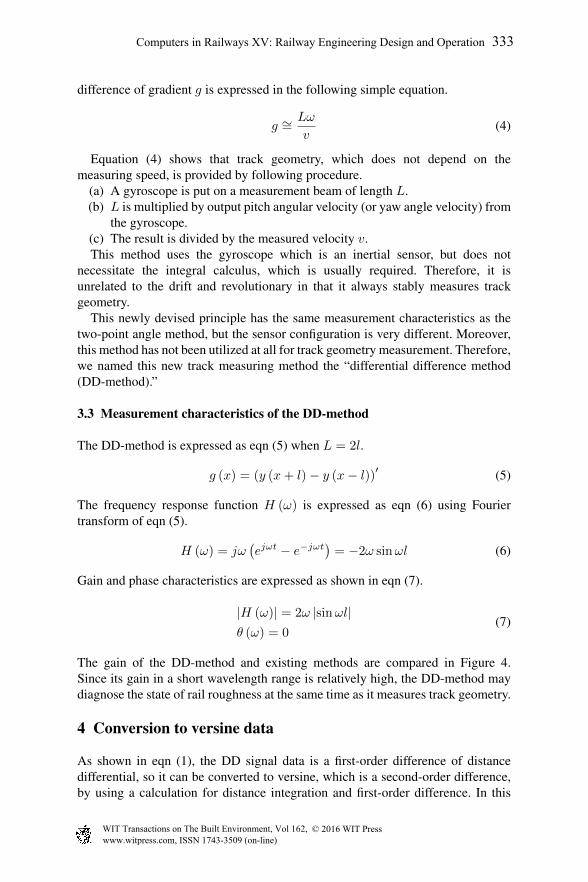
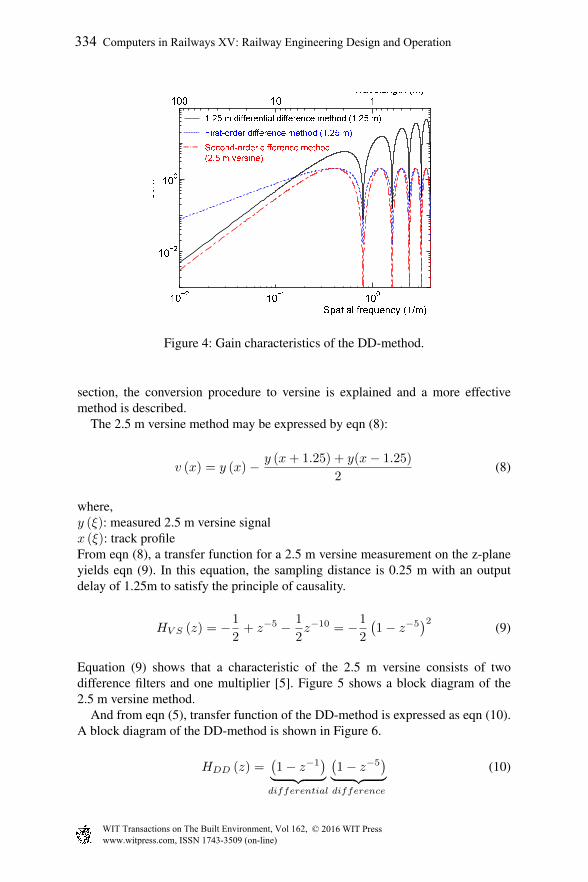
The gain of the DD-method and existing methods are compared in Figure 4.Since its gain in a short wavelength range is relatively high, the DD-method maydiagnose the state of rail roughness at the same time as it measures track geometry.
4 Conversion to versine data
As shown in eqn (1), the DD signal data is a first-order difference of distancedifferential, so it can be converted to versine, which is a second-order difference,by using a calculation for distance integration and first-order difference. In this
Computers in Railways XV: Railway Engineering Design and Operation 333
www.witpress.com, ISSN 1743-3509 (on-line) WIT Transactions on The Built Environment, Vol 162, © 2016 WIT Press
Wavelength (m)
Gain
Spatial frequency (1/m)
1.25 m differential difference method (1.25 m)First-order difference method (1.25 m)Second-order difference method (2.5 m versine)
10−2 10−1 10010−2100100 10 1
Figure 4: Gain characteristics of the DD-method.
section, the conversion procedure to versine is explained and a more effectivemethod is described.
The 2.5 m versine method may be expressed by eqn (8):
v (x) = y (x)− y (x+ 1.25) + y(x− 1.25)
2(8)
where,y (ξ): measured 2.5 m versine signalx (ξ): track profileFrom eqn (8), a transfer function for a 2.5 m versine measurement on the z-planeyields eqn (9). In this equation, the sampling distance is 0.25 m with an outputdelay of 1.25m to satisfy the principle of causality.
HV S (z) = −1
2+ z−5 − 1
2z−10 = −1
2
(1− z−5
)2(9)
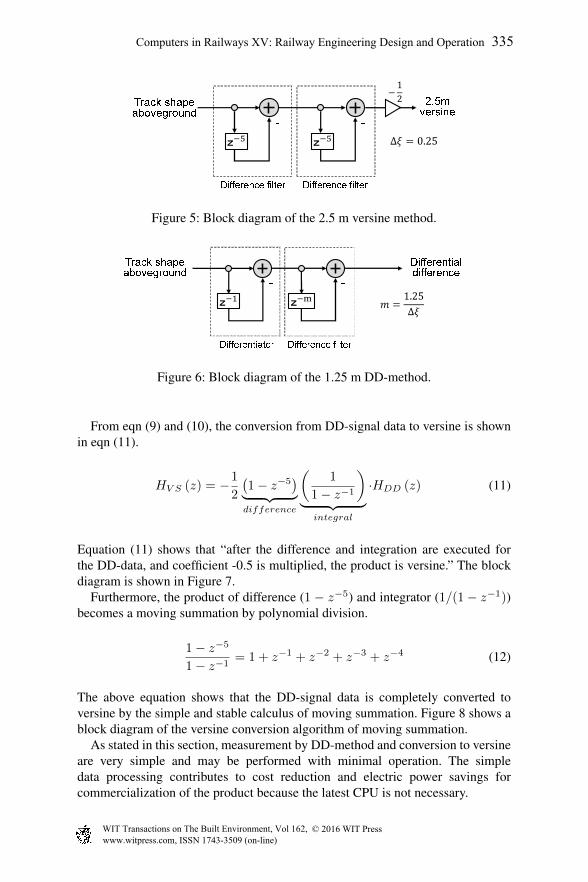
Equation (9) shows that a characteristic of the 2.5 m versine consists of twodifference filters and one multiplier [5]. Figure 5 shows a block diagram of the2.5 m versine method.
And from eqn (5), transfer function of the DD-method is expressed as eqn (10).A block diagram of the DD-method is shown in Figure 6.
HDD (z) =(1− z−1
)︸ ︷︷ ︸differential
(1− z−5
)︸ ︷︷ ︸difference
(10)
334 Computers in Railways XV: Railway Engineering Design and Operation
www.witpress.com, ISSN 1743-3509 (on-line) WIT Transactions on The Built Environment, Vol 162, © 2016 WIT Press
- -Difference filter Difference filter
Track shapeaboveground 2.5m versine
Figure 5: Block diagram of the 2.5 m versine method.
- -Track shapeaboveground Differential differenceDifferentiator Difference filter
Figure 6: Block diagram of the 1.25 m DD-method.
From eqn (9) and (10), the conversion from DD-signal data to versine is shownin eqn (11).
HV S (z) = −1
2
(1− z−5
)︸ ︷︷ ︸difference
(1
1− z−1
)︸ ︷︷ ︸
integral
·HDD (z) (11)
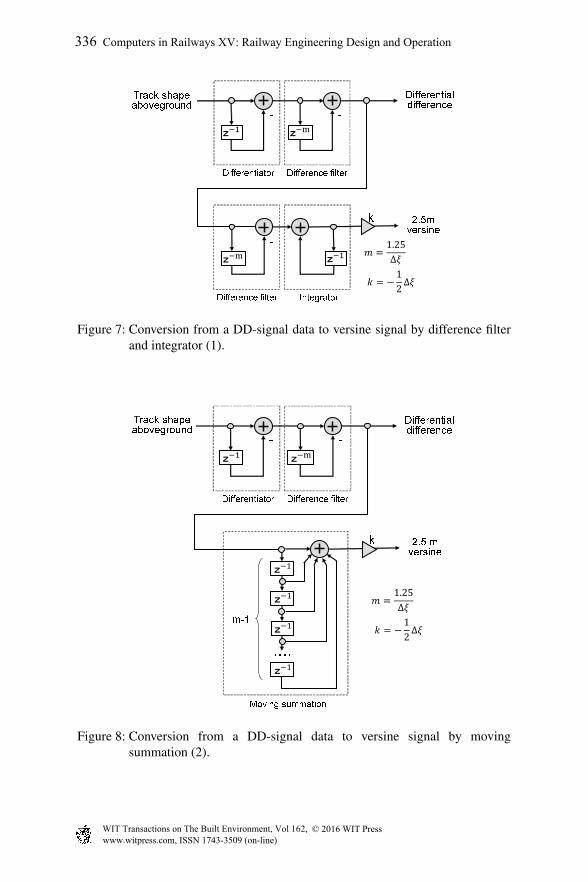
Equation (11) shows that “after the difference and integration are executed forthe DD-data, and coefficient -0.5 is multiplied, the product is versine.” The blockdiagram is shown in Figure 7.
Furthermore, the product of difference (1 − z−5) and integrator (1/(1− z−1))becomes a moving summation by polynomial division.
1− z−5
1− z−1= 1 + z−1 + z−2 + z−3 + z−4 (12)
The above equation shows that the DD-signal data is completely converted toversine by the simple and stable calculus of moving summation. Figure 8 shows ablock diagram of the versine conversion algorithm of moving summation.
As stated in this section, measurement by DD-method and conversion to versineare very simple and may be performed with minimal operation. The simpledata processing contributes to cost reduction and electric power savings forcommercialization of the product because the latest CPU is not necessary.
Computers in Railways XV: Railway Engineering Design and Operation 335
www.witpress.com, ISSN 1743-3509 (on-line) WIT Transactions on The Built Environment, Vol 162, © 2016 WIT Press
- -Track shapeaboveground Differential differenceDifferentiator Difference filter
kDifference filter Integrator
2.5m versine-Figure 7: Conversion from a DD-signal data to versine signal by difference filter
and integrator (1).
Differential difference- -Track shapeabovegroundDifferentiator Difference filter
k 2.5 m versine
・・・・m-1Moving summation
Figure 8: Conversion from a DD-signal data to versine signal by movingsummation (2).
336 Computers in Railways XV: Railway Engineering Design and Operation
www.witpress.com, ISSN 1743-3509 (on-line) WIT Transactions on The Built Environment, Vol 162, © 2016 WIT Press
5 Experimental prototype LRSX01
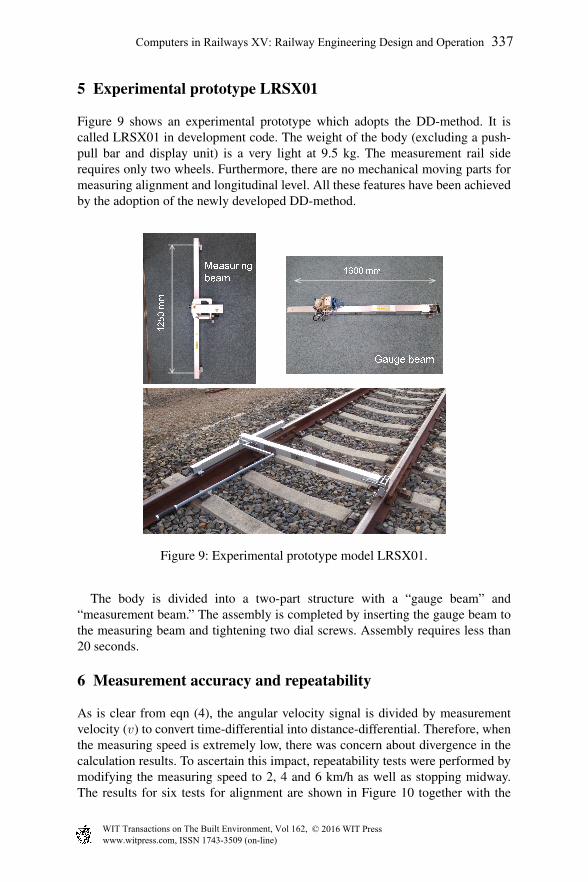
Figure 9 shows an experimental prototype which adopts the DD-method. It iscalled LRSX01 in development code. The weight of the body (excluding a push-pull bar and display unit) is a very light at 9.5 kg. The measurement rail siderequires only two wheels. Furthermore, there are no mechanical moving parts formeasuring alignment and longitudinal level. All these features have been achievedby the adoption of the newly developed DD-method.
Gauge beam1600 mm
1250 mmMeasuring beam
Figure 9: Experimental prototype model LRSX01.
The body is divided into a two-part structure with a “gauge beam” and“measurement beam.” The assembly is completed by inserting the gauge beam tothe measuring beam and tightening two dial screws. Assembly requires less than20 seconds.
6 Measurement accuracy and repeatability
As is clear from eqn (4), the angular velocity signal is divided by measurementvelocity (v) to convert time-differential into distance-differential. Therefore, whenthe measuring speed is extremely low, there was concern about divergence in thecalculation results. To ascertain this impact, repeatability tests were performed bymodifying the measuring speed to 2, 4 and 6 km/h as well as stopping midway.The results for six tests for alignment are shown in Figure 10 together with the
Computers in Railways XV: Railway Engineering Design and Operation 337
www.witpress.com, ISSN 1743-3509 (on-line) WIT Transactions on The Built Environment, Vol 162, © 2016 WIT Press
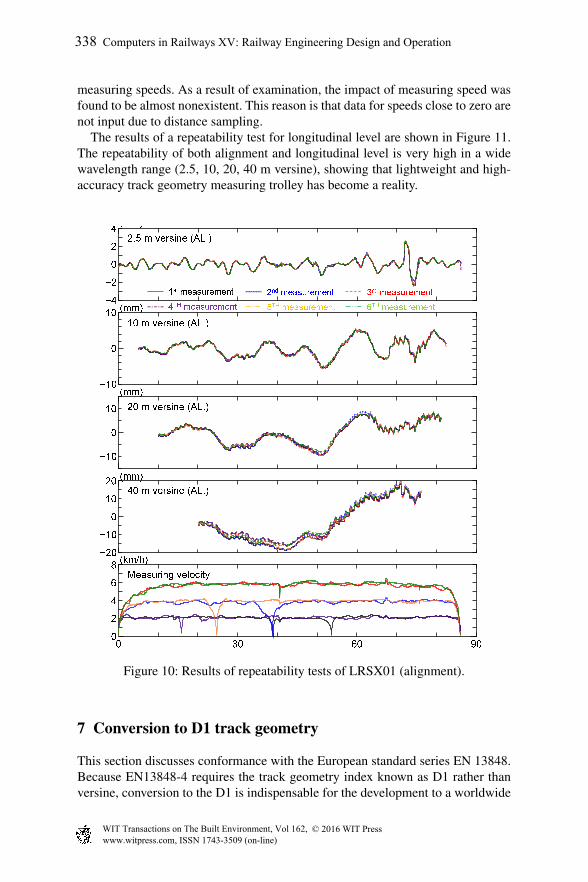
measuring speeds. As a result of examination, the impact of measuring speed wasfound to be almost nonexistent. This reason is that data for speeds close to zero arenot input due to distance sampling.
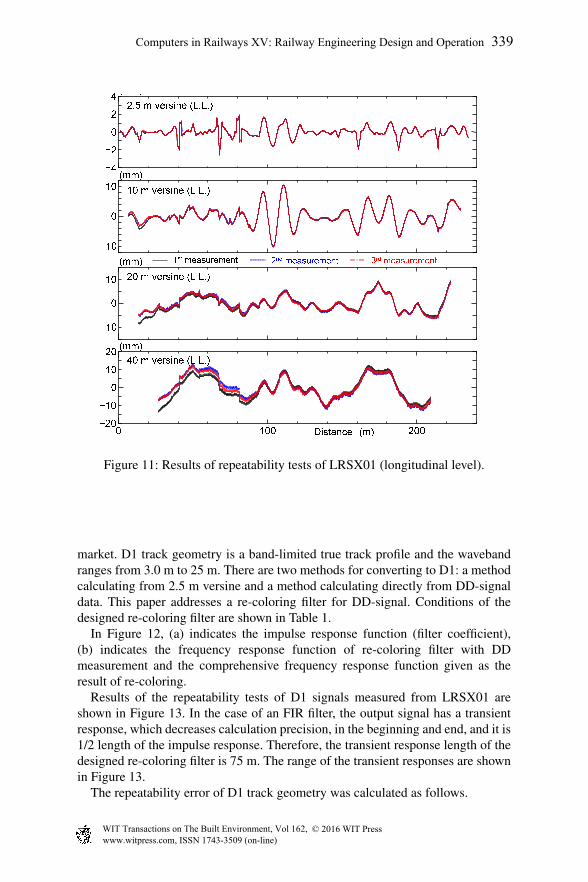
The results of a repeatability test for longitudinal level are shown in Figure 11.The repeatability of both alignment and longitudinal level is very high in a widewavelength range (2.5, 10, 20, 40 m versine), showing that lightweight and high-accuracy track geometry measuring trolley has become a reality.(mm)
0 30 60 9002468
−4−2024
−10010
−10010
−20−1001020
2.5 m versine (AL.)10 m versine (AL.)20 m versine (AL.)40 m versine (AL.)
(mm)(mm)(mm)
Measuring velocity(km/h)
1st measurement 2nd measurement 3rd measurement4TH measurement 5TH measurement 6TH measurement
Figure 10: Results of repeatability tests of LRSX01 (alignment).
7 Conversion to D1 track geometry
This section discusses conformance with the European standard series EN 13848.Because EN13848-4 requires the track geometry index known as D1 rather thanversine, conversion to the D1 is indispensable for the development to a worldwide
338 Computers in Railways XV: Railway Engineering Design and Operation
www.witpress.com, ISSN 1743-3509 (on-line) WIT Transactions on The Built Environment, Vol 162, © 2016 WIT Press
0 100 200−20−1001020
−4−2024
−10010
−10010
Distance (m)
(mm)2.5 m versine (L.L.)10 m versine (L.L.)20 m versine (L.L.)40 m versine (L.L.)
1st measurement 2nd measurement 3rd measurement(mm)(mm)(mm)
Figure 11: Results of repeatability tests of LRSX01 (longitudinal level).
market. D1 track geometry is a band-limited true track profile and the wavebandranges from 3.0 m to 25 m. There are two methods for converting to D1: a methodcalculating from 2.5 m versine and a method calculating directly from DD-signaldata. This paper addresses a re-coloring filter for DD-signal. Conditions of thedesigned re-coloring filter are shown in Table 1.
In Figure 12, (a) indicates the impulse response function (filter coefficient),(b) indicates the frequency response function of re-coloring filter with DDmeasurement and the comprehensive frequency response function given as theresult of re-coloring.
Results of the repeatability tests of D1 signals measured from LRSX01 areshown in Figure 13. In the case of an FIR filter, the output signal has a transientresponse, which decreases calculation precision, in the beginning and end, and it is1/2 length of the impulse response. Therefore, the transient response length of thedesigned re-coloring filter is 75 m. The range of the transient responses are shownin Figure 13.
The repeatability error of D1 track geometry was calculated as follows.
Computers in Railways XV: Railway Engineering Design and Operation 339
www.witpress.com, ISSN 1743-3509 (on-line) WIT Transactions on The Built Environment, Vol 162, © 2016 WIT Press
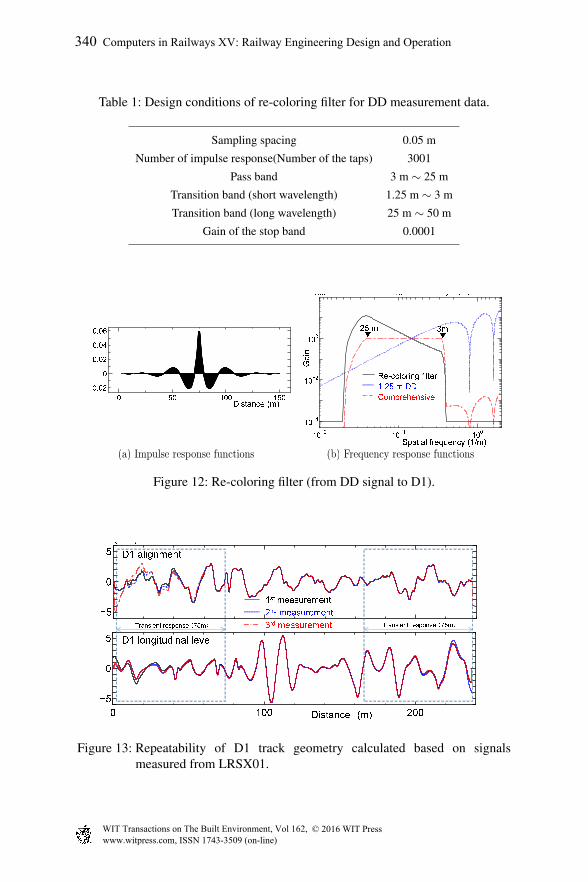
Table 1: Design conditions of re-coloring filter for DD measurement data.
Sampling spacing 0.05 m
Number of impulse response(Number of the taps) 3001
Pass band 3 m ∼ 25 m
Transition band (short wavelength) 1.25 m ∼ 3 m
Transition band (long wavelength) 25 m ∼ 50 m
Gain of the stop band 0.0001
10−2 10−1 10010−410−2100100 10 1
Distance (m)Filter coefficient
0 50 100 150−0.0200.020.040.06
Wavelength (m)
Gain
Spatial frequency (1/m)
25 m 3m▼▼Re-coloring filter1.25 m DDComprehensive
Figure 12: Re-coloring filter (from DD signal to D1).
−505
0 100 200−505
Distance (m)
(mm)1st measurement2nd measurement3rd measurement
D1 alignmentD1 longitudinal levelTransient response (75m) Transient response (75m)
Figure 13: Repeatability of D1 track geometry calculated based on signalsmeasured from LRSX01.
340 Computers in Railways XV: Railway Engineering Design and Operation
www.witpress.com, ISSN 1743-3509 (on-line) WIT Transactions on The Built Environment, Vol 162, © 2016 WIT Press
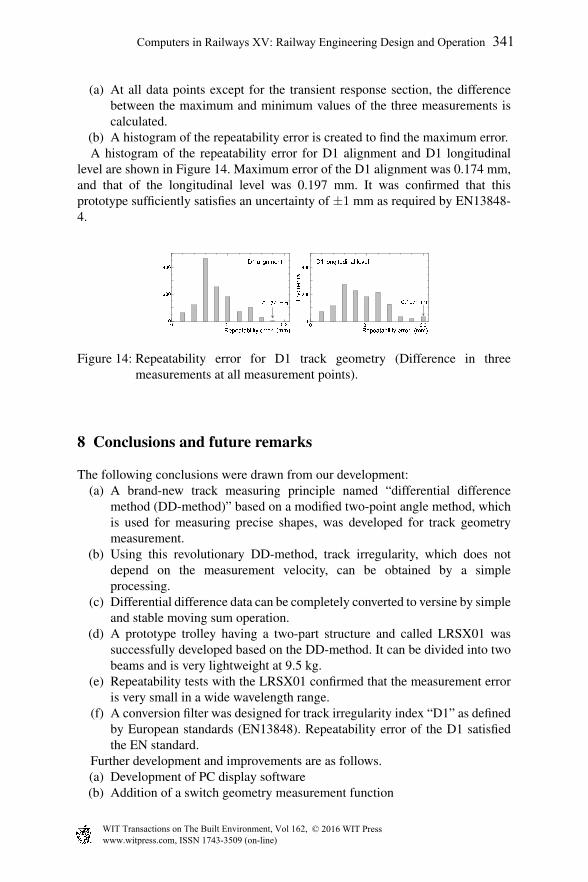
(a) At all data points except for the transient response section, the differencebetween the maximum and minimum values of the three measurements iscalculated.
(b) A histogram of the repeatability error is created to find the maximum error.A histogram of the repeatability error for D1 alignment and D1 longitudinal
level are shown in Figure 14. Maximum error of the D1 alignment was 0.174 mm,and that of the longitudinal level was 0.197 mm. It was confirmed that thisprototype sufficiently satisfies an uncertainty of ±1 mm as required by EN13848-4.
0 0.1 0.20200400
0 0.1 0.20200400 D1 alignment D1 longitudinal level
0.174 mm 0.197 mmRepeatability error (mm) Repeatability error (mm)
Frequency
Frequency
Figure 14: Repeatability error for D1 track geometry (Difference in threemeasurements at all measurement points).
8 Conclusions and future remarks
The following conclusions were drawn from our development:(a) A brand-new track measuring principle named “differential difference
method (DD-method)” based on a modified two-point angle method, whichis used for measuring precise shapes, was developed for track geometrymeasurement.
(b) Using this revolutionary DD-method, track irregularity, which does notdepend on the measurement velocity, can be obtained by a simpleprocessing.
(c) Differential difference data can be completely converted to versine by simpleand stable moving sum operation.
(d) A prototype trolley having a two-part structure and called LRSX01 wassuccessfully developed based on the DD-method. It can be divided into twobeams and is very lightweight at 9.5 kg.
(e) Repeatability tests with the LRSX01 confirmed that the measurement erroris very small in a wide wavelength range.
(f) A conversion filter was designed for track irregularity index “D1” as definedby European standards (EN13848). Repeatability error of the D1 satisfiedthe EN standard.
Further development and improvements are as follows.(a) Development of PC display software(b) Addition of a switch geometry measurement function
Computers in Railways XV: Railway Engineering Design and Operation 341
www.witpress.com, ISSN 1743-3509 (on-line) WIT Transactions on The Built Environment, Vol 162, © 2016 WIT Press
(c) Complete conformance with EN13848-4A commercial model of LRSX01 is expected to go on sale globally in April
2017.
References
[1] Yasukuni Naganuma, Mamoru Tanaka, and Kimihiro Ichikawa. High-speedtrack inspection car in the new dr. yellow. In Proc. of the World Congress onRailway Research (WCRR 2001), 2001.
[2] Yasukuni Naganuma, Seiji Fukushima, and Masaru Morimoto. Truly portabletrack recording equipment and its application for track quality management.In Proc. of the World Congress on Railway Research (WCRR 2003), pages1313–1323, 2003.
[3] Coenraad Esveld. Modern Railway Track. MRT-Productions, 1989.[4] S Kiyono, T Kume, Y Asakawa, and O Kamada. Differential laser auto-
collimation method (2nd report) (in japanese). Journal of JSPE, 57(4): 652,1991.
[5] Yasukuni Naganuma, Mikihito Kobayashi, and Takayuki Okumura. Iner-tial measurement processing techniques for track condition monitoring onshinkansen commercial trains. Journal of Mechanical Systems for Transporta-tion and Logistics, 3(1): 315–325, 2010.
342 Computers in Railways XV: Railway Engineering Design and Operation
www.witpress.com, ISSN 1743-3509 (on-line) WIT Transactions on The Built Environment, Vol 162, © 2016 WIT Press