Embed Size (px)
Citation preview
applied sciences
Article
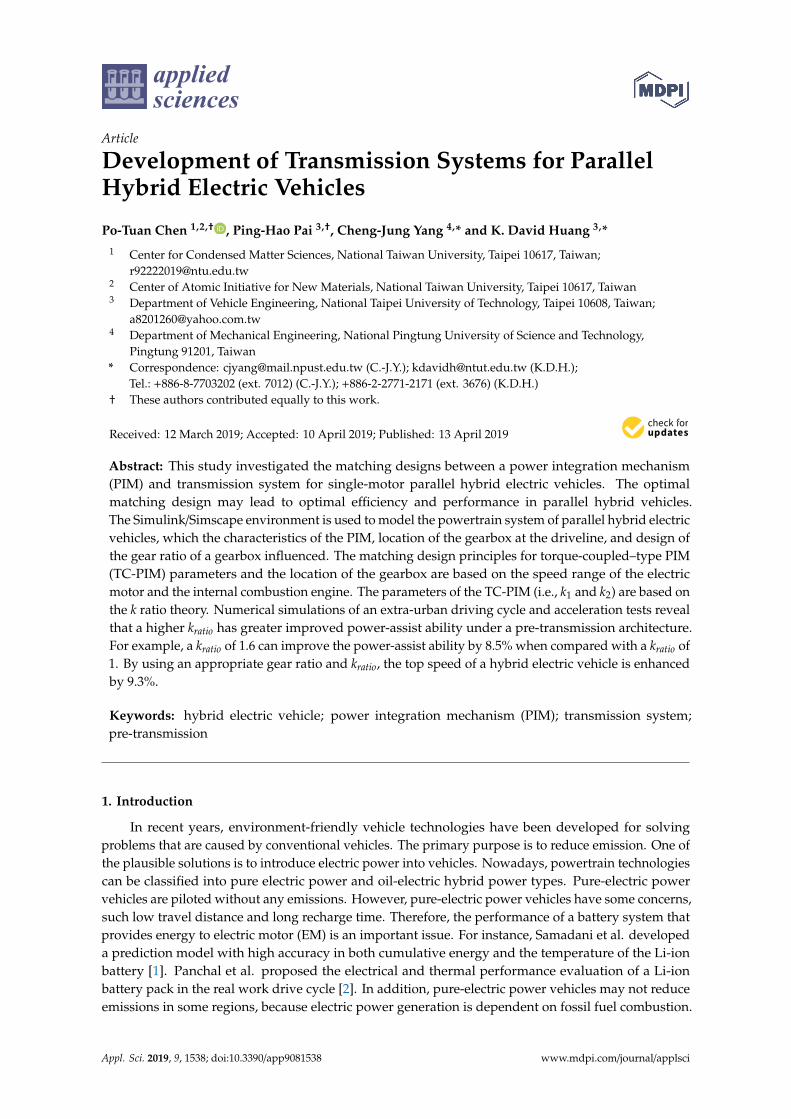
Development of Transmission Systems for ParallelHybrid Electric Vehicles
Po-Tuan Chen 1,2,† , Ping-Hao Pai 3,†, Cheng-Jung Yang 4,* and K. David Huang 3,*1 Center for Condensed Matter Sciences, National Taiwan University, Taipei 10617, Taiwan;
[email protected] Center of Atomic Initiative for New Materials, National Taiwan University, Taipei 10617, Taiwan3 Department of Vehicle Engineering, National Taipei University of Technology, Taipei 10608, Taiwan;
[email protected] Department of Mechanical Engineering, National Pingtung University of Science and Technology,
Pingtung 91201, Taiwan* Correspondence: [email protected] (C.-J.Y.); [email protected] (K.D.H.);
Tel.: +886-8-7703202 (ext. 7012) (C.-J.Y.); +886-2-2771-2171 (ext. 3676) (K.D.H.)† These authors contributed equally to this work.
Received: 12 March 2019; Accepted: 10 April 2019; Published: 13 April 2019�����������������
Abstract: This study investigated the matching designs between a power integration mechanism(PIM) and transmission system for single-motor parallel hybrid electric vehicles. The optimalmatching design may lead to optimal efficiency and performance in parallel hybrid vehicles.The Simulink/Simscape environment is used to model the powertrain system of parallel hybrid electricvehicles, which the characteristics of the PIM, location of the gearbox at the driveline, and design ofthe gear ratio of a gearbox influenced. The matching design principles for torque-coupled–type PIM(TC-PIM) parameters and the location of the gearbox are based on the speed range of the electricmotor and the internal combustion engine. The parameters of the TC-PIM (i.e., k1 and k2) are based onthe k ratio theory. Numerical simulations of an extra-urban driving cycle and acceleration tests revealthat a higher kratio has greater improved power-assist ability under a pre-transmission architecture.For example, a kratio of 1.6 can improve the power-assist ability by 8.5% when compared with a kratio of1. By using an appropriate gear ratio and kratio, the top speed of a hybrid electric vehicle is enhancedby 9.3%.
Keywords: hybrid electric vehicle; power integration mechanism (PIM); transmission system;pre-transmission
1. Introduction
In recent years, environment-friendly vehicle technologies have been developed for solvingproblems that are caused by conventional vehicles. The primary purpose is to reduce emission. One ofthe plausible solutions is to introduce electric power into vehicles. Nowadays, powertrain technologiescan be classified into pure electric power and oil-electric hybrid power types. Pure-electric powervehicles are piloted without any emissions. However, pure-electric power vehicles have some concerns,such low travel distance and long recharge time. Therefore, the performance of a battery system thatprovides energy to electric motor (EM) is an important issue. For instance, Samadani et al. developeda prediction model with high accuracy in both cumulative energy and the temperature of the Li-ionbattery [1]. Panchal et al. proposed the electrical and thermal performance evaluation of a Li-ionbattery pack in the real work drive cycle [2]. In addition, pure-electric power vehicles may not reduceemissions in some regions, because electric power generation is dependent on fossil fuel combustion.
Appl. Sci. 2019, 9, 1538; doi:10.3390/app9081538 www.mdpi.com/journal/applsci
Appl. Sci. 2019, 9, 1538 2 of 26
The improvement of power storage technology [3,4] and alternative clean electric power sources [5,6]remains challenging. Therefore, oil-electric hybrid–powered electric vehicles (EVs) may be a promisingsolution for environment-friendly vehicles until the major challenges of pure EVs are overcome [7].
The development of hybrid vehicles comprises four challenges: research and development ofa low-carbon energy carrier, system control strategy, power unit, and transmission system. Amongthem, the transmission system is the primary factor in integrating mechanical power and performancefor hybrid vehicles. For smooth coordination between the two power outputs, the power integrationmechanism (PIM) design is the most crucial for the parallel hybrid powertrain. The propulsion systemsof oil-electric hybrid vehicles comprise two power units. On the basis of the power flow of powerunits, the power architecture of hybrid–powered vehicles can be classified into series hybrid, parallelhybrid, and series-parallel hybrid power architectures. For the series hybrid power architecture,engine power and traction power are provided to the generator and the traction motor, respectively.This architecture must include two electric machines: one with a generator and traction motor andanother with an internal combustion engine (ICE). Due to the engine powering the generator, the overallefficiency of the series hybrid power architecture is generally higher than that of the parallel hybridpower architecture. However, system performance depends on the specification of the traction motor.The system performance of the series hybrid architecture is worse than that of the parallel hybridarchitecture [8].
For the parallel hybrid power architecture, engine power can be used as the traction power orgenerator power, and the electric machine can work as a traction motor or generator depending onthe system control strategy. In this system, an engine and a motor or each can provide the requiredtraction power alone; thus, the performance of the parallel hybrid vehicles is higher than that of serieshybrid vehicles. The parallel hybrid architecture can comprise an electric machine (motor/generator)and ICE [9]. Xia et al. developed a time efficient energy management strategy for the parallel plug in ahybrid electric vehicle based on the convex optimization and the simulated annealing algorithm [9].Kim et al. evaluated the max fuel economy potential parallel hybrid electric vehicle by consideringpower electronics, drivetrain loss, and system loss [10]. The series-parallel hybrid power architecturecombines both series and parallel systems to enhance the overall efficiency and the performance ofthe system. The series-parallel hybrid power architectures require two electric machines to work asthe traction motor and generator. The series-parallel hybrid architecture has superior efficiency andperformance, nevertheless the system is extremely complex and costly.
The hybridization factor and function of the EM can be classified into micro hybrid, mild hybrid,and strong hybrid factors and functions. The hybridization factor is a ratio that presents the percentageof EM power in a vehicle propulsion system. According to Lukic [11], the hybridization factor has aconsiderable effect on the performance and total efficiency of the hybrid vehicles. On the basis of thehybridization factor, the design can be classified into five types [12]. According to Miller [13], the distinctpropulsion architecture for the parallel hybrid powertrain can be classified into pre-transmission andpost-transmission. In the pre-transmission architecture, the mechanical power flow is first integratedand then adjusted to traction wheels (TWs) through transmission. In the post-transmission architecture,the mechanical power flow is first adjusted through transmission and is then integrated with TWs.Saiful [14] studies the differences between the performance of torque-coupled type hybrid vehicleswith pre-transmission and post-transmission architectures. The result shows that the average engineefficiency slightly improved for the pre-transmission architecture; however, the overall efficiencyand acceleration performance are superior for the post-transmission architecture. Hoang and Yanpresented the configuration synthesis of series-parallel hybrid transmission with eight-bar mechanismsand demonstrated the feasibility [15]. Bonfiglio et al. evaluated the electrical losses and the averageICE efficiency in different operating conditions in the continuously variable transmission architectureand discontinuously variable transmission architecture [16]. Zhang [17] investigated the location andnumber of clutches for the hybrid powertrain of Toyota Prius and Chevrolet Volt, which are hybridpowertrains with a single planetary gear. The result shows that applying one clutch in the Toyota Prius
Appl. Sci. 2019, 9, 1538 3 of 26
transmission can improve fuel consumption by 16% under the federal urban driving cycle (FUDS).Applying two clutches from Chevrolet Volt transmission can evidently improve fuel consumption,irrespective of the city or highway driving cycle.
Although various principles have been proposed, how the intriguing k ratio [18] influences theperformance and efficiency of hybrid EVs has not been investigated so far. Therefore, we performednumerical simulations to examine the effect of design matching between the PIM and transmissionsystem for single-motor parallel hybrid EVs. In this study, the Simulink/Simscape environment is usedto construct a model of the parallel hybrid EV powertrain system, which PIM characteristics, locationsof the gearbox at the driveline, and design of the gear ratio of the gearbox affect. This paper focuseson the influence of k1 and k2, which are the design parameters for the PIM. The matching design ofthe torque-coupled-type PIM (TC-PIM) and the gearbox improves the efficiency and performance ofparallel hybrid vehicles. The matching design principle for TC-PIM parameters and the location ofthe gearbox are based on the speed range of two power units. The simulation results show that thetransmission system design correlates vehicle performance and it uses the combined power of twopower units. The design matching principle that is proposed in this study can identify the effectivedesign range of TC-PIM parameters and the gear ratio of the gearbox. The finding in this study can beused as a design reference theory for the transmission system of a parallel hybrid vehicle that mayimprove fuel consumption, irrespective of the city or high way driving cycle.
2. Materials and Methods
Section 2.1 introduces the basic theory for this study. The proposed parallel hybrid vehicle modelfor the transmission system and vehicle performance is based on the aforementioned theory. Section 2.2presents the analysis of the transmission design for parallel hybrid vehicles. Section 2.3 focuses on thetransmission design of the TC-PIM. The details of nomenclatures that are discussed in this section arealso listed in the section of Appendix A.
2.1. Basic Theory
2.1.1. Vehicle Longitudinal Dynamic
We briefly quote the basic theory vehicle longitudinal dynamic from Ref. [19]. When the vehicle isbeing driven, sufficient traction force is required to move the vehicle. By using a transmission transitsuitable torque to TWs, the power unit provides the traction force, which can be expressed usingEquation (1).
FT =Tw
rwe f f. (1)
To simplify the analysis process, the demand traction force can be determined while using thetotal resistance when driving, which can be expressed using Equation (2).
FT = FR + FD + FG. (2)
The driving resistance in longitudinal motion comprises tire rolling resistance, drag resistance,and grade resistance. The deformation of the load on the tire when the tire is rolling on the road surfacecauses the tire rolling resistance. Therefore, the actual tire radius becomes smaller than the nominaldimension when rolling. When the tire starts rolling, the reaction force of the normal force is appliedon a tiny offset from the tire center due to hysteresis. Therefore, the reaction force generates a reactionmoment on the tire. If the reaction moment is equivalent to the force that is applied on the contactpoint of the tire and road surface, the tire rolling resistance can be expressed using Equation (3).
FR = fR·N =d
rwe f fN. (3)
Appl. Sci. 2019, 9, 1538 4 of 26
The actual rolling resistance coefficient of the tire is influenced by the dimension and compoundof the tire, camber angle, vehicle speed, and road friction. To simplify the analysis, the road friction isonly considered to influence the tire rolling resistance coefficient; thus, Equation (3) can be simplifiedusing Equation (4).
FR = fR·mg· cosθ. (4)
In general, the rolling resistance coefficient of the road is in the range of 0.01–0.05. In this study,the rolling resistance coefficient of 0.02 was used for a common asphalt road.
Air resistance causes the drag resistance. When the vehicle is being driven, the vehicle bodymoves through air in front of the vehicle. In this motion, air provides a force that moves along thevehicle body. This force changes the streamline velocity of air; thus, the turbulence zone is formedbehind the vehicle body. As the turbulence zone has a pressure difference with normal air, this pressuredifference generates resistance for vehicle movement, which is called drag resistance. The value ofdrag resistance is related to the vehicle driving speed, drag coefficient, and front area of the vehiclebody. The drag resistance can be expressed using Equation (5).
FD =12·ρ·Cd·A·v2 (5)
The grade resistance is caused by the gravity of the vehicle. Due to the slope of the road, a part ofthe gravitational force acts in the downhill direction. This force can be expressed using Equation (6).
FG = mg· sinθ (6)
According to Newton’s second law, the acceleration of an object in linear motion can be expressedusing Equation (7).
F = m·a (7)
Therefore, if the traction force minus all of the resistances mentioned above also exceeds zero,it can provide the acceleration force for vehicles, which can be expressed using Equation (8).
Ft − (FR + FD + FG) = (m + m∗)·a (8)
The notation m∗ indicates the added mass of rotating components because of rotating motion.The maximum vehicle speed can be calculated using the traction force and power of the power unit.In general, the maximum vehicle speed is discussed at level ground (θ = 0) and, thus, the maximumvehicle speed can be expressed using Equation (9), as follows:
Vmax =(FR + FD)
Pmax(9)
2.1.2. Transmission Design Demand
The transmission system is the most critical system design for vehicle performance. The primaryaim of the vehicle transmission system is to maintain power units to provide suitable traction powerunder various working conditions. Thus, the power units are always operating under high efficiency.Therefore, if a vehicle has a suitable transmission system, then it has reduced fuel consumptionand emission. Fischer [18] reveals that the vehicle transmission design must satisfy two primarydemands: providing the required traction force under various driving conditions for favorable vehicleperformance and operating power units under high efficiency to reduce fuel consumption and emission.However, these primary design demands are contradictory in some models. To design a suitabletransmission system, the optimal matching of the power unit is required for efficient fuel consumptionand favorable vehicle performance. The key factors are (i) the traction force that is required by

Appl. Sci. 2019, 9, 1538 5 of 26
calculating the total resistance, which is applied on the vehicle body [18] and (ii) the gear ratio designfor the driving power unit operating at the highest efficiency [20].
2.1.3. Power Integration Mechanism
The PIM is a crucial component in the hybrid propulsion system. The function of the PIM is tointegrate input mechanical power from two independent sources into output mechanical power withinits constraints. Figure 1 shows that the PIM is a two-degree-of-freedom mechanism and it has at leastthree ports. Each port is bidirectional and it transmits mechanical power. Without any loss of efficiency,the in-flowing mechanical power is equivalent to mechanical power flow-out. For example, if ports 1and 2 provide mechanical power, and port 3 is connected to the output shaft, then the output shaftmechanical power can be expressed using Equation (10).
T3ω3 = T1ω1 + T2ω2 (10)
Ehsani [21] classified the PIM into two types, namely torque-coupled and speed-coupled types,based on the PIM characteristics. The basic theorem of these PIMs is described, as follows:
Appl. Sci. 2019, 9, x FOR PEER REVIEW 5 of 26
The PIM is a crucial component in the hybrid propulsion system. The function of the PIM is to
integrate input mechanical power from two independent sources into output mechanical power
within its constraints. Figure 1 shows that the PIM is a two-degree-of-freedom mechanism and it has
at least three ports. Each port is bidirectional and it transmits mechanical power. Without any loss of
efficiency, the in-flowing mechanical power is equivalent to mechanical power flow-out. For
example, if ports 1 and 2 provide mechanical power, and port 3 is connected to the output shaft, then
the output shaft mechanical power can be expressed using Equation (10).
𝑇3𝜔3 = 𝑇1𝜔1 + 𝑇2𝜔2 (10)
Ehsani [21] classified the PIM into two types, namely torque-coupled and speed-coupled types,
based on the PIM characteristics. The basic theorem of these PIMs is described, as follows:
Figure 1. Power integration mechanism.
The characteristic of the TC-PIM is that the output torque demand can be satisfied through the
linear superposition of two independent input torques with coefficient 𝑘, which is determined while
using the geometric structure of the PIM. By dividing Equation (10) by output angular velocity 𝜔3,
the relationship of torque for each port can be expressed using Equation (11).
𝑇3 = 𝑇1𝑘1 + 𝑇2𝑘2 (11)
Equation (11) shows that the demand torque 𝑇3 comprises 𝑇1𝑘1 and 𝑇2𝑘2. Therefore, 𝑇1 and
𝑇2 can independently control the demand torque 𝑇3. The angular velocity of each port cannot be
independently controlled because of the power conservation constraint. The angular velocity
constraint can be expressed using Equation (12).
𝜔3 =𝜔1
𝑘1
=𝜔2
𝑘2
(12)
The characteristic of the speed-coupled PIM is that the output speed demand can be satisfied
through the linear superposition of two independent input speeds divided by coefficient 𝑘, which is
determined while using the geometric structure of the PIM. By dividing Equation (10) by output
angular velocity 𝑤3, the relationship of speed for each port can be expressed using Equation (13).
𝜔3 =𝜔1
𝑘1
+𝜔2
𝑘2
(13)
Equation (13) shows that the demand speed 𝜔3 comprises 𝜔1 𝑘1⁄ and 𝜔2 𝑘2⁄ . Thus, 𝜔1 and
𝜔2 can independently control the demand speed 𝜔3 . The torque of each port cannot be
independently controlled due to the power conservation constraint. The torque constraint can be
expressed using Equation (14).
𝑇3 = 𝑘1𝑇1 = 𝑘2𝑇2 (14)
2.1.4. Driving Mode Control Architecture
The driving mode control architecture is important in the parallel hybrid propulsion system. In
general, the hybrid vehicle has five primary driving modes, namely EV mode, ICE mode, power-split
mode, hybrid mode, and regenerate brake mode. The control rule to switch the driving modes in this
study is based on demand power classification. Lin [22] presents the demand power classification for
driving mode switch logic for hybrid trucks. In demand power classification, constant power lines
Figure 1. Power integration mechanism.
The characteristic of the TC-PIM is that the output torque demand can be satisfied through thelinear superposition of two independent input torques with coefficient k, which is determined whileusing the geometric structure of the PIM. By dividing Equation (10) by output angular velocity ω3,the relationship of torque for each port can be expressed using Equation (11).
T3 = T1k1 + T2k2 (11)
Equation (11) shows that the demand torque T3 comprises T1k1 and T2k2. Therefore, T1 andT2 can independently control the demand torque T3. The angular velocity of each port cannot beindependently controlled because of the power conservation constraint. The angular velocity constraintcan be expressed using Equation (12).
ω3 =ω1
k1=ω2
k2(12)
The characteristic of the speed-coupled PIM is that the output speed demand can be satisfiedthrough the linear superposition of two independent input speeds divided by coefficient k, whichis determined while using the geometric structure of the PIM. By dividing Equation (10) by outputangular velocity w3, the relationship of speed for each port can be expressed using Equation (13).
ω3 =ω1
k1+ω2
k2(13)
Equation (13) shows that the demand speed ω3 comprises ω1/k1 and ω2/k2. Thus, ω1 and ω2
can independently control the demand speed ω3. The torque of each port cannot be independentlycontrolled due to the power conservation constraint. The torque constraint can be expressed usingEquation (14).
T3 = k1T1 = k2T2 (14)

Appl. Sci. 2019, 9, 1538 6 of 26
2.1.4. Driving Mode Control Architecture
The driving mode control architecture is important in the parallel hybrid propulsion system.In general, the hybrid vehicle has five primary driving modes, namely EV mode, ICE mode, power-splitmode, hybrid mode, and regenerate brake mode. The control rule to switch the driving modes in thisstudy is based on demand power classification. Lin [22] presents the demand power classification fordriving mode switch logic for hybrid trucks. In demand power classification, constant power linesare used to separate the engine power into three operation regions. These regions can be classifiedinto low-, medium-, and high-power regions. As the engine has superior efficiency in the mediumpower region, motor in low power demand and engine and motor in high power demand. By usingthis approach, fuel consumption can be reduced, and driving mode control rule can be established.
2.2. Parallel Hybrid Transmission Design
The specification of engine and motor and the parameters in this section for following numericalsimulations were obtained from Matlab Simulink of ADVISOR®Software (MathWorks Inc.: Natick,MA, USA, 2018) and Advanced Vehicle Simulator [23].
2.2.1. Specification of Power Units
The data include power specification and efficiency data. Therefore, the data can be used todetermine the traction force and energy usage for the hybrid propulsion system. A 1.0L spark-ignition(SI) engine, which can provide 41 kW power and 81 Nm torque at peak performance, is used. Table 1provides the details. A permanent magnet direct current (PMDC) motor, which can provide a powerof 10 kW and a torque of 46.5 Nm for the peak values, is used as the EM/generator. Figure 2b showsthe efficiency map of this motor, where the thick black line is the motor power envelope. The negativephase of the torque indicates that the motor works as a generator; thus, the efficiency contour in thisphase indicates the recharge efficiency. In the hybrid mode, the operating region of the power unit hassome system constraints and, thus, it cannot freely operate power units. Figure 2a shows the brakespecific fuel consumption map of this engine, where the thick black line represents the engine powerenvelope under the wide-open throttle condition.
Table 1. Engine specification.
Geo Metro 1.0L SI engine 10 kW PMDC Motor
Peak power 41 kW/5700 rpm 10 kWPeak torque 80.9 Nm/3477 rpm 46.5 NmSpeed range 1000–6000 rpm 0–8500 rpm
Voltage n/a 60 VMax Current n/a 180 A
Appl. Sci. 2019, 9, x FOR PEER REVIEW 6 of 26
are used to separate the engine power into three operation regions. These regions can be classified
into low-, medium-, and high-power regions. As the engine has superior efficiency in the medium
power region, motor in low power demand and engine and motor in high power demand. By using
this approach, fuel consumption can be reduced, and driving mode control rule can be established.
2.2. Parallel Hybrid Transmission Design
The specification of engine and motor and the parameters in this section for following numerical
simulations were obtained from Matlab Simulink of ADVISOR® Software (MathWorks Inc.: Natick,
MA, USA, 2018) and Advanced Vehicle Simulator [23].
2.2.1. Specification of Power Units
The data include power specification and efficiency data. Therefore, the data can be used to
determine the traction force and energy usage for the hybrid propulsion system. A 1.0L spark-
ignition (SI) engine, which can provide 41 kW power and 81 Nm torque at peak performance, is used.
Table 1 provides the details. A permanent magnet direct current (PMDC) motor, which can provide
a power of 10 kW and a torque of 46.5 Nm for the peak values, is used as the EM/generator. Figure
2b shows the efficiency map of this motor, where the thick black line is the motor power envelope.
The negative phase of the torque indicates that the motor works as a generator; thus, the efficiency
contour in this phase indicates the recharge efficiency. In the hybrid mode, the operating region of
the power unit has some system constraints and, thus, it cannot freely operate power units. Figure 2a
shows the brake specific fuel consumption map of this engine, where the thick black line represents
the engine power envelope under the wide-open throttle condition.
Table 1. Engine specification.
Geo Metro 1.0L SI engine 10 kW PMDC Motor
Peak power 41 kW/ 5700 rpm 10 kW
Peak torque 80.9 Nm/ 3477 rpm 46.5 Nm
Speed range 1000–6000 rpm 0–8500 rpm
Voltage n/a 60 V
Max Current n/a 180 A
(a) (b)
Figure 2. (a) Engine map and (b) electric motor (EM) map.
2.2.2. Transmission Design Requirements
Speed is a crucial factor in forces on driving vehicles. Table 2 shows the design requirement of
transmission and the parameters of the driving vehicle. These values were obtained from Matlab
Simulink of ADVISOR® Software and Advanced Vehicle Simulator [23].
Figure 2. (a) Engine map and (b) electric motor (EM) map.

Appl. Sci. 2019, 9, 1538 7 of 26
2.2.2. Transmission Design Requirements
Speed is a crucial factor in forces on driving vehicles. Table 2 shows the design requirement oftransmission and the parameters of the driving vehicle. These values were obtained from MatlabSimulink of ADVISOR® Software and Advanced Vehicle Simulator [23].
Table 2. Design requirement of transmission and corresponding parameters.
Design Demand Value
Maximum traction force of tire 3500 NMaximum slope at 10 km/h 25%
Top vehicle speed ICE: 161 km/hHybrid: 176 km/h
Engine max stat rpm 3000 rpmMotor max power in EV mode 8.5 kW
Engine max power in ICE mode 25 kWϕ2 1.1
Vehicle Parameters Value
Weight 1200 kgEffective radius of traction wheel 0.3 m
Front area 2.16 m2
Drag coefficient 0.26Rolling resistance coefficient 0.02Maximum grade resistance 2855.1 N
Rolling resistance 288.41 NDrag resistance 2.6042 N
2.2.3. Influence of Location of Gearbox
For the parallel hybrid propulsion system, the transmission system can be placed at three locations.Figure 3 shows the possible locations of the gearbox (GB) with respect to the ICE, EM, TW, and PIM inthe parallel hybrid propulsion system. These different locations of the gearbox have different effectson the torque and the rotation speed between the PIM in the hybrid driving or power-split mode.The details of the effect of each location of the gearbox are as follows:
• The influence of GB1: The torque and rotation speed of engine outputs can beindependently adjusted.
• The influence of GB2: The torque and rotation speed of motor outputs can beindependently adjusted.
• The Influence of GB3: The torque and rotation speed of PIM outputs can be adjusted, whichindicates that the outputs of the engine and motor are simultaneously adjusted. This location ofthe gearbox alone cannot be used to adjust engine or motor outputs.
Appl. Sci. 2019, 9, x FOR PEER REVIEW 7 of 26
Table 2. Design requirement of transmission and corresponding parameters.
Design Demand Value
Maximum traction force of tire 3500 N
Maximum slope at 10 km/h 25%
Top vehicle speed ICE: 161 km/h
Hybrid: 176 km/h
Engine max stat rpm 3000 rpm
Motor max power in EV mode 8.5 kW
Engine max power in ICE mode 25 kW
𝜑2 1.1
Vehicle Parameters Value
Weight 1200 kg
Effective radius of traction wheel 0.3 m
Front area 2.16 𝑚2
Drag coefficient 0.26
Rolling resistance coefficient 0.02
Maximum grade resistance 2855.1 N
Rolling resistance 288.41 N
Drag resistance 2.6042 N
2.2.3. Influence of Location of Gearbox
For the parallel hybrid propulsion system, the transmission system can be placed at three locations.
Figure 3 shows the possible locations of the gearbox (GB) with respect to the ICE, EM, TW, and PIM in
the parallel hybrid propulsion system. These different locations of the gearbox have different effects on
the torque and the rotation speed between the PIM in the hybrid driving or power-split mode. The
details of the effect of each location of the gearbox are as follows:
⚫ The influence of GB1: The torque and rotation speed of engine outputs can be independently
adjusted.
⚫ The influence of GB2: The torque and rotation speed of motor outputs can be independently
adjusted.
⚫ The Influence of GB3: The torque and rotation speed of PIM outputs can be adjusted, which
indicates that the outputs of the engine and motor are simultaneously adjusted. This location of
the gearbox alone cannot be used to adjust engine or motor outputs.
Figure 3. Gearbox location of parallel hybrid driveline.
The TC-PIM that was in this study used a spur gear train to design and analyze the parallel
hybrid transmission system. Spur gears are widely used in power transmission mechanisms. It is a
simple mechanism to transfer mechanical power. The theory of spur gear-type transmission is that a
gear set comprises drive and driven gears. These gears have different dimensions and, thus, it can
adjust the torque and rotation speed. Equations (15) and (16) can express the relationship of the
torque value and rotation speed value for drive and driven gears. The term 𝑟𝑑𝑛
𝑟𝑑 represents the gear
ratio.
𝜂 ∙𝑇𝑑𝑛
𝑇𝑑
= 𝜂 ∙𝑟𝑑𝑛
𝑟𝑑
(15)
Figure 3. Gearbox location of parallel hybrid driveline.
The TC-PIM that was in this study used a spur gear train to design and analyze the parallel hybridtransmission system. Spur gears are widely used in power transmission mechanisms. It is a simplemechanism to transfer mechanical power. The theory of spur gear-type transmission is that a gear setcomprises drive and driven gears. These gears have different dimensions and, thus, it can adjust the

Appl. Sci. 2019, 9, 1538 8 of 26
torque and rotation speed. Equations (15) and (16) can express the relationship of the torque value androtation speed value for drive and driven gears. The term rdn
rdrepresents the gear ratio.
η·TdnTd
= η·rdnrd
(15)
ωdωdn
=rdnrd
(16)
2.2.4. Torque-Coupled–Type Transmission
The aforementioned discussion examined the constraint of the TC-PIM. In this study, we select thespur gear for the TC-PIM. The flowing section discusses the design torque-coupled–type transmissionbased on speed-torque. The TC-PIM in this study uses the spur gear train to design and analyze theparallel hybrid transmission system. Spur gears are widely used in power transmission mechanisms.It is a simple mechanism that is used to transfer mechanical power. In spur gear-type transmission,a gear set comprises drive and driven gears. These gears have different dimensions and, thus, it canadjust torque and rotation speed. The relationship between the torque value and rotation speed valuefor drive and driven gears can be expressed using Equations (15) and (16). The term rdn
rdalso represents
the gear ratio.Figure 4a shows the basic driveline architecture for TC-PIM. In this architecture, the engine and
motor are always connected with the TC-PIM, which indicates that each power unit cannot onlyprovide power for the traction vehicle. To ensure that all of the driving modes can work, clutches orbrakes must be installed in the driveline architecture. For the ICE mode and the smooth integrationof mechanical power in the hybrid mode, a clutch must be installed between the EM and TC-PIM.To reduce the engine pumping loss, the clutch that is installed between the engine and TC-PIM isnecessary. Figure 4b shows the suitable clutches that were added in the driveline architecture for theTC-type parallel hybrid powertrain. A brake should not be installed in driveline, as the TC-PIM isone-degree-of-freedom mechanism. When the brake is installed in the driveline, it locks up all shafts;thus, the transfer of mechanical power to the TW becomes difficult.
Appl. Sci. 2019, 9, x FOR PEER REVIEW 8 of 26
𝜔𝑑
𝜔𝑑𝑛
=𝑟𝑑𝑛
𝑟𝑑(16)
2.2.4. Torque-Coupled–Type Transmission
The aforementioned discussion examined the constraint of the TC-PIM. In this study, we select
the spur gear for the TC-PIM. The flowing section discusses the design torque-coupled–type
transmission based on speed‐torque. The TC-PIM in this study uses the spur gear train to design and
analyze the parallel hybrid transmission system. Spur gears are widely used in power transmission
mechanisms. It is a simple mechanism that is used to transfer mechanical power. In spur gear-type
transmission, a gear set comprises drive and driven gears. These gears have different dimensions
and, thus, it can adjust torque and rotation speed. The relationship between the torque value and
rotation speed value for drive and driven gears can be expressed using Equations (15) and (16). The
term 𝑟𝑑𝑛
𝑟𝑑 also represents the gear ratio.
Figure 4a shows the basic driveline architecture for TC-PIM. In this architecture, the engine and
motor are always connected with the TC-PIM, which indicates that each power unit cannot only
provide power for the traction vehicle. To ensure that all of the driving modes can work, clutches or
brakes must be installed in the driveline architecture. For the ICE mode and the smooth integration
of mechanical power in the hybrid mode, a clutch must be installed between the EM and TC-PIM. To
reduce the engine pumping loss, the clutch that is installed between the engine and TC-PIM is
necessary. Figure 4b shows the suitable clutches that were added in the driveline architecture for the
TC-type parallel hybrid powertrain. A brake should not be installed in driveline, as the TC-PIM is
one-degree-of-freedom mechanism. When the brake is installed in the driveline, it locks up all
shafts;
(a)
(b)
Figure 4. (a) Basic driveline architecture for the torque-coupled-type PIM (TC-PIM). (b) Clutches
added driveline architecture for TC-PIM.
In the parallel hybrid mode, the gearbox can be installed at three positions. To determine the
position for the installation of the gearbox, the relationship between the speed‐torque characteristic
of power units and the constraints of the TC-PIM must be determined [18]. The TC-PIM would restrict
the angular speed when power is integrated. The speed relationship with power units and the TC-
PIM can be expressed using Equation (17), as follows:
𝜂𝑠𝑝𝑒𝑒𝑑 =𝑘1𝜔𝐸−𝑚𝑎𝑥
𝑘2𝜔𝐼𝐶𝐸−𝑚𝑎𝑥
(17)
If 𝜂𝑠𝑝𝑒𝑒𝑑 ≪ 1, the gearbox or single gear must be installed between the engine and TC-PIM to
ensure that the engine delivers complete power (GB1). If 𝜂𝑠𝑝𝑒𝑒𝑑 ≫ 1, the gearbox or single gear can
be installed between the EM and TC-PIM to ensure that the EM delivers complete power (GB2). If
Figure 4. (a) Basic driveline architecture for the torque-coupled-type PIM (TC-PIM). (b) Clutches addeddriveline architecture for TC-PIM.
In the parallel hybrid mode, the gearbox can be installed at three positions. To determine theposition for the installation of the gearbox, the relationship between the speed-torque characteristic ofpower units and the constraints of the TC-PIM must be determined [18]. The TC-PIM would restrict
Appl. Sci. 2019, 9, 1538 9 of 26
the angular speed when power is integrated. The speed relationship with power units and the TC-PIMcan be expressed using Equation (17), as follows:
ηspeed =k1ωE−max
k2ωICE−max(17)
If ηspeed � 1, the gearbox or single gear must be installed between the engine and TC-PIM to ensurethat the engine delivers complete power (GB1). If ηspeed � 1, the gearbox or single gear can be installedbetween the EM and TC-PIM to ensure that the EM delivers complete power (GB2). If ηspeed � 1,only the gearbox must be installed behind the TC-PIM and, thus, it can simplify system complexity(GB3). Therefore, the proper placement of gearbox for this primary simulation is behind TC-PIM.
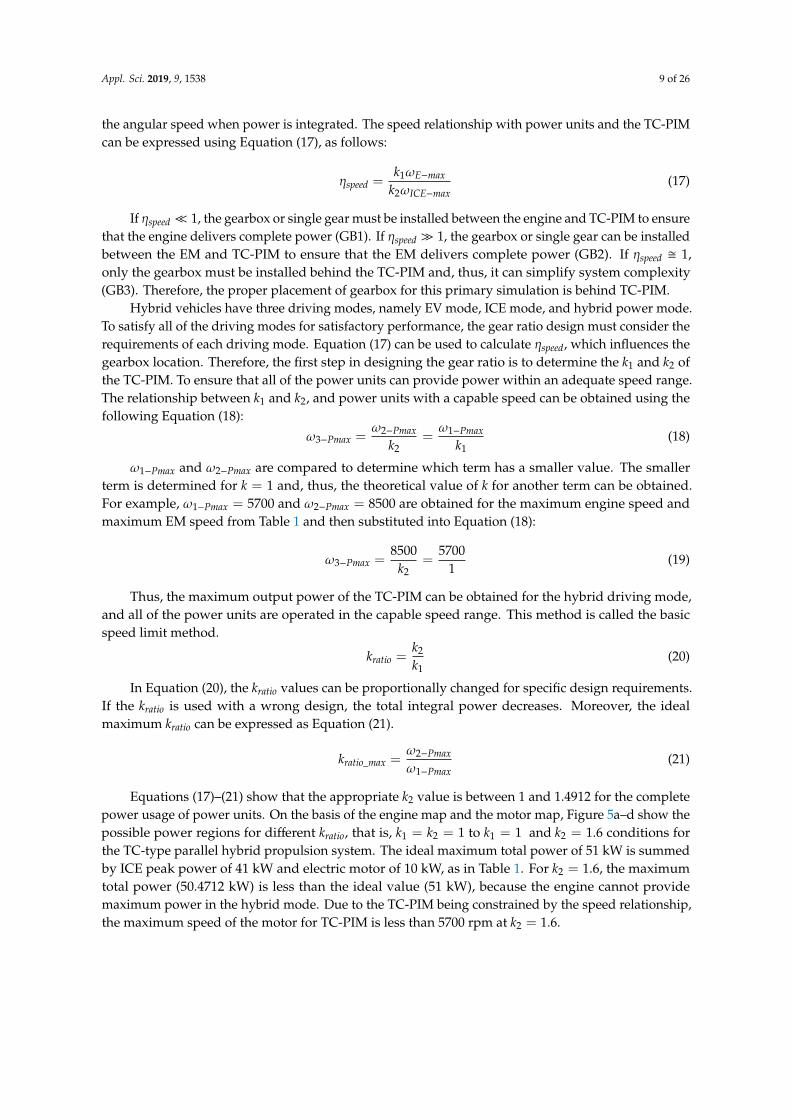
Hybrid vehicles have three driving modes, namely EV mode, ICE mode, and hybrid power mode.To satisfy all of the driving modes for satisfactory performance, the gear ratio design must consider therequirements of each driving mode. Equation (17) can be used to calculate ηspeed, which influences thegearbox location. Therefore, the first step in designing the gear ratio is to determine the k1 and k2 ofthe TC-PIM. To ensure that all of the power units can provide power within an adequate speed range.The relationship between k1 and k2, and power units with a capable speed can be obtained using thefollowing Equation (18):
ω3−Pmax =ω2−Pmax
k2=ω1−Pmax
k1(18)
ω1−Pmax and ω2−Pmax are compared to determine which term has a smaller value. The smallerterm is determined for k = 1 and, thus, the theoretical value of k for another term can be obtained.For example, ω1−Pmax = 5700 and ω2−Pmax = 8500 are obtained for the maximum engine speed andmaximum EM speed from Table 1 and then substituted into Equation (18):
ω3−Pmax =8500
k2=
57001
(19)
Thus, the maximum output power of the TC-PIM can be obtained for the hybrid driving mode,and all of the power units are operated in the capable speed range. This method is called the basicspeed limit method.
kratio =k2
k1(20)
In Equation (20), the kratio values can be proportionally changed for specific design requirements.If the kratio is used with a wrong design, the total integral power decreases. Moreover, the idealmaximum kratio can be expressed as Equation (21).
kratio_max =ω2−Pmax
ω1−Pmax(21)
Equations (17)–(21) show that the appropriate k2 value is between 1 and 1.4912 for the completepower usage of power units. On the basis of the engine map and the motor map, Figure 5a–d show thepossible power regions for different kratio, that is, k1 = k2 = 1 to k1 = 1 and k2 = 1.6 conditions forthe TC-type parallel hybrid propulsion system. The ideal maximum total power of 51 kW is summedby ICE peak power of 41 kW and electric motor of 10 kW, as in Table 1. For k2 = 1.6, the maximumtotal power (50.4712 kW) is less than the ideal value (51 kW), because the engine cannot providemaximum power in the hybrid mode. Due to the TC-PIM being constrained by the speed relationship,the maximum speed of the motor for TC-PIM is less than 5700 rpm at k2 = 1.6.

Appl. Sci. 2019, 9, 1538 10 of 26
Appl. Sci. 2019, 9, x FOR PEER REVIEW 9 of 26
𝜂𝑠𝑝𝑒𝑒𝑑 ≅ 1, only the gearbox must be installed behind the TC-PIM and, thus, it can simplify system
complexity (GB3). Therefore, the proper placement of gearbox for this primary simulation is behind
TC-PIM.
Hybrid vehicles have three driving modes, namely EV mode, ICE mode, and hybrid power
mode. To satisfy all of the driving modes for satisfactory performance, the gear ratio design must
consider the requirements of each driving mode. Equation (17) can be used to calculate 𝜂𝑠𝑝𝑒𝑒𝑑 , which
influences the gearbox location. Therefore, the first step in designing the gear ratio is to determine
the 𝑘1 and 𝑘2 of the TC-PIM. To ensure that all of the power units can provide power within an
adequate speed range. The relationship between 𝑘1 and 𝑘2, and power units with a capable speed
can be obtained using the following Equation (18):
𝜔3−𝑃𝑚𝑎𝑥 =𝜔2−𝑃𝑚𝑎𝑥
𝑘2
=𝜔1−𝑃𝑚𝑎𝑥
𝑘1
(18)
𝜔1−𝑃𝑚𝑎𝑥 and 𝜔2−𝑃𝑚𝑎𝑥 are compared to determine which term has a smaller value. The smaller
term is determined for 𝑘 = 1 and, thus, the theoretical value of 𝑘 for another term can be obtained.
For example, 𝜔1−𝑃𝑚𝑎𝑥 = 5700 and 𝜔2−𝑃𝑚𝑎𝑥 = 8500 are obtained for the maximum engine speed
and maximum EM speed from Table 1 and then substituted into Equation (18):
𝜔3−𝑃𝑚𝑎𝑥 =8500
𝑘2
=5700
1 (19)
Thus, the maximum output power of the TC-PIM can be obtained for the hybrid driving mode,
and all of the power units are operated in the capable speed range. This method is called the basic
speed limit method.
𝑘𝑟𝑎𝑡𝑖𝑜 =𝑘2
𝑘1
(20)
In Equation (20), the 𝑘𝑟𝑎𝑡𝑖𝑜 values can be proportionally changed for specific design
requirements. If the 𝑘𝑟𝑎𝑡𝑖𝑜 is used with a wrong design, the total integral power decreases. Moreover,
the ideal maximum 𝑘𝑟𝑎𝑡𝑖𝑜 can be expressed as Equation (21).
𝑘𝑟𝑎𝑡𝑖𝑜_𝑚𝑎𝑥 =𝜔2−𝑃𝑚𝑎𝑥
𝜔1−𝑃𝑚𝑎𝑥
(21)
Equations (17)–(21) show that the appropriate 𝑘2 value is between 1 and 1.4912 for the complete
power usage of power units. On the basis of the engine map and the motor map, Figure 5a–d show
the possible power regions for different 𝑘𝑟𝑎𝑡𝑖𝑜 , that is, 𝑘1 = 𝑘2 = 1 to 𝑘1 = 1 and 𝑘2 = 1.6
conditions for the TC-type parallel hybrid propulsion system. The ideal maximum total power of 51
kW is summed by ICE peak power of 41 kW and electric motor of 10 kW, as in Table 1. For 𝑘2 = 1.6,
the maximum total power (50.4712 kW) is less than the ideal value (51 kW), because the engine cannot
provide maximum power in the hybrid mode. Due to the TC-PIM being constrained by the speed
relationship, the maximum speed of the motor for TC-PIM is less than 5700 rpm at 𝑘2 = 1.6.
(a) (b)
Appl. Sci. 2019, 9, x FOR PEER REVIEW 10 of 26
(c) (d)
Figure 5. (a) Power region (𝑘1 = 1, 𝑘2 = 1). (b) Power region (𝑘1 = 1, 𝑘2 = 1.2). (c) Power region (𝑘1
= 1, 𝑘2 = 1.4912). (d) Power region (𝑘1 = 1, 𝑘2 = 1.6).
The first step is to determine the gear ratio in the EV mode. The second step is to determine the
overall gear ratio. The overall gear ratio must be determined stepwise for all driving modes due to
the different parallel hybrid driving modes. The largest gear ratio in the EV mode can be expressed
using Equation (22).
𝑖𝐸𝑉 =𝑟𝑤𝑒𝑓𝑓 ∙ (𝐹𝐺𝑚𝑎𝑥 + 𝐹𝑅 + 𝐹𝐷)
𝑘2𝑇𝐸𝑚𝑎𝑥
(22)
Substituted parameters in Table 1 and Table 2 into Equation (22) can determine 𝑖𝐸𝑉_𝑙𝑎𝑟𝑔𝑒𝑠𝑡:
𝑖𝐸𝑉 =0.3 ∙ (2855.1 + 288.41 + 2.6042)
1.4167 ∙ 46.5= 14.06 (23)
The number of gears for EV mode transmission can be designed using a single gear because the
EM has constant power characteristics.
The third step is to determine the overall gear ratio in the ICE mode and hybrid mode. As the
engine provides the primary power to the propulsion system, and the EM just provides start-stop
and power assistance; the gear ratio is mainly designed for the engine with one extra gear for hybrid
power. Thus, the overall gear ratio in the ICE mode and hybrid mode can be obtained. The largest
gear ratio in the ICE and hybrid mode can be expressed using Equation (24).
𝑖𝐼𝐶𝐸_𝑙𝑎𝑟𝑔𝑒𝑠𝑡 =𝑟𝑤𝑒𝑓𝑓 ∙ (𝐹𝐺𝑚𝑎𝑥 + 𝐹𝑅 + 𝐹𝐷)
𝑘1𝑇𝐼𝐶𝐸𝑚𝑎𝑥
(24)
𝑖𝐼𝐶𝐸_𝑙𝑎𝑟𝑔𝑒𝑠𝑡 can be determined by substituting parameters in Table 1 and Table 2 into Equation
(24):
𝑖𝐼𝐶𝐸_𝑙𝑎𝑟𝑔𝑒𝑠𝑡 =0.3 ∙ (2855.1 + 288.41 + 2.6042)
1 ∙ 80.9= 11.67 (25)
The forth step is to determine the smallest gear ratio in the ICE mode and the hybrid mode. In
this study, a 𝑉𝑚𝑎𝑥 optima design is used to determine the smallest gear base on the ICE design and
to add one more gear for excess hybrid power, which can be expressed using Equation (26).
𝑖𝐼𝐶𝐸_𝑠𝑚𝑎𝑙𝑙𝑒𝑠𝑡 = 3.6 ∙
𝜋30
∙ 𝑟𝑤𝑒𝑓𝑓 ∙ 𝑛𝑚𝑎𝑥
𝑉𝑚𝑎𝑥
(26)
𝑖𝐼𝐶𝐸_𝑠𝑚𝑎𝑙𝑙𝑒𝑠𝑡 can be determined by substituting parameters in Table 1 and Table 2 into Equation
(26):
𝑖𝐼𝐶𝐸_𝑠𝑚𝑎𝑙𝑙𝑒𝑠𝑡 = 3.6 ∙
𝜋30
∙ 0.3 ∙ 5700
161= 4.02 (27)
Figure 5. (a) Power region (k1 = 1, k2 = 1). (b) Power region (k1 = 1, k2 = 1.2). (c) Power region (k1 = 1,k2 = 1.4912). (d) Power region (k1 = 1, k2 = 1.6).
The first step is to determine the gear ratio in the EV mode. The second step is to determine theoverall gear ratio. The overall gear ratio must be determined stepwise for all driving modes due to thedifferent parallel hybrid driving modes. The largest gear ratio in the EV mode can be expressed usingEquation (22).
iEV =rwe f f ·(FGmax + FR + FD)
k2TEmax(22)
Substituted parameters in Tables 1 and 2 into Equation (22) can determine iEV_largest:
iEV =0.3·(2855.1 + 288.41 + 2.6042)
1.4167·46.5= 14.06 (23)
The number of gears for EV mode transmission can be designed using a single gear because theEM has constant power characteristics.
The third step is to determine the overall gear ratio in the ICE mode and hybrid mode. As theengine provides the primary power to the propulsion system, and the EM just provides start-stop andpower assistance; the gear ratio is mainly designed for the engine with one extra gear for hybrid power.Thus, the overall gear ratio in the ICE mode and hybrid mode can be obtained. The largest gear ratioin the ICE and hybrid mode can be expressed using Equation (24).
iICE_largest =rwe f f ·(FGmax + FR + FD)
k1TICEmax(24)
Appl. Sci. 2019, 9, 1538 11 of 26
iICE_largest can be determined by substituting parameters in Tables 1 and 2 into Equation (24):
iICE_largest =0.3·(2855.1 + 288.41 + 2.6042)
1·80.9= 11.67 (25)
The forth step is to determine the smallest gear ratio in the ICE mode and the hybrid mode. In thisstudy, a Vmax optima design is used to determine the smallest gear base on the ICE design and to addone more gear for excess hybrid power, which can be expressed using Equation (26).
iICE_smallest = 3.6·π30 ·rwe f f ·nmax
Vmax(26)
iICE_smallest can be determined by substituting parameters in Tables 1 and 2 into Equation (26):
iICE_smallest = 3.6·π30 ·0.3·5700
161= 4.02 (27)
ihy−smallest = 3.6·π30 ·0.3·5700
176= 3.67 (28)
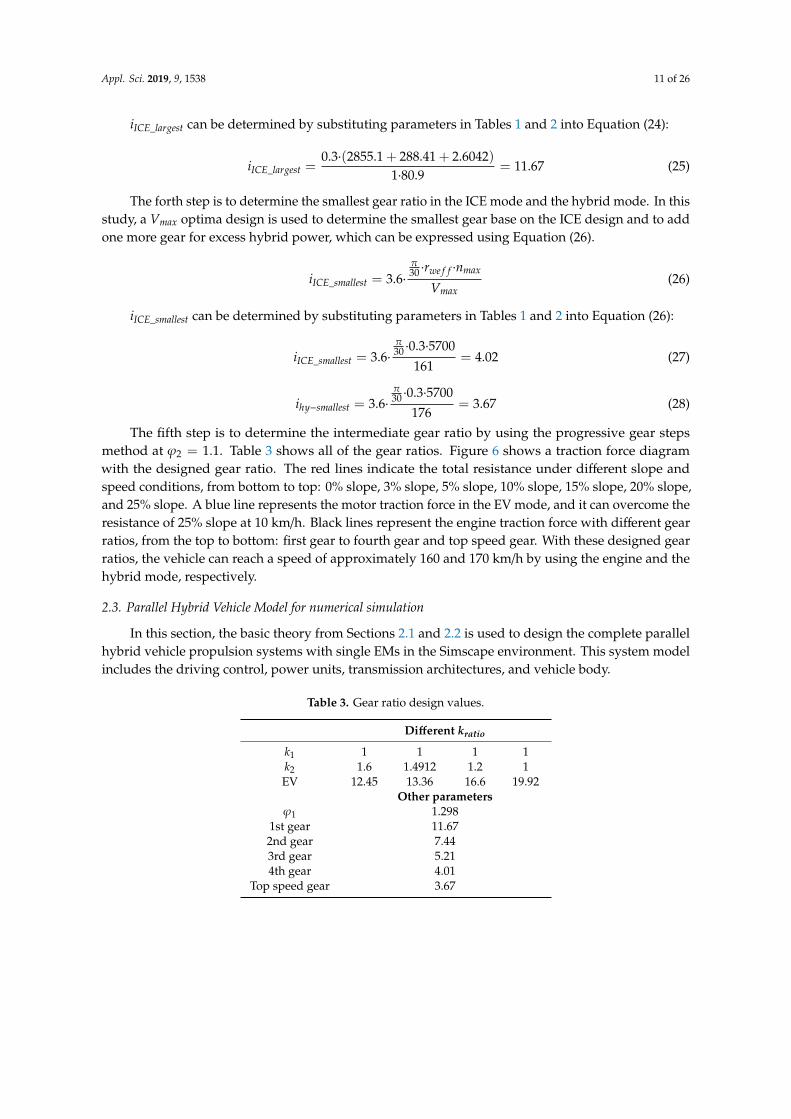
The fifth step is to determine the intermediate gear ratio by using the progressive gear stepsmethod at ϕ2 = 1.1. Table 3 shows all of the gear ratios. Figure 6 shows a traction force diagramwith the designed gear ratio. The red lines indicate the total resistance under different slope andspeed conditions, from bottom to top: 0% slope, 3% slope, 5% slope, 10% slope, 15% slope, 20% slope,and 25% slope. A blue line represents the motor traction force in the EV mode, and it can overcome theresistance of 25% slope at 10 km/h. Black lines represent the engine traction force with different gearratios, from the top to bottom: first gear to fourth gear and top speed gear. With these designed gearratios, the vehicle can reach a speed of approximately 160 and 170 km/h by using the engine and thehybrid mode, respectively.
2.3. Parallel Hybrid Vehicle Model for numerical simulation
In this section, the basic theory from Sections 2.1 and 2.2 is used to design the complete parallelhybrid vehicle propulsion systems with single EMs in the Simscape environment. This system modelincludes the driving control, power units, transmission architectures, and vehicle body.
Table 3. Gear ratio design values.
Different kratio
k1 1 1 1 1k2 1.6 1.4912 1.2 1EV 12.45 13.36 16.6 19.92
Other parametersϕ1 1.298
1st gear 11.672nd gear 7.443rd gear 5.214th gear 4.01
Top speed gear 3.67

Appl. Sci. 2019, 9, 1538 12 of 26
Appl. Sci. 2019, 9, x FOR PEER REVIEW 11 of 26
𝑖ℎ𝑦−𝑠𝑚𝑎𝑙𝑙𝑒𝑠𝑡 = 3.6 ∙
𝜋30
∙ 0.3 ∙ 5700
176= 3.67 (28)
The fifth step is to determine the intermediate gear ratio by using the progressive gear steps
method at 𝜑2 = 1.1. Table 3 shows all of the gear ratios. Figure 6 shows a traction force diagram with
the designed gear ratio. The red lines indicate the total resistance under different slope and speed
conditions, from bottom to top: 0% slope, 3% slope, 5% slope, 10% slope, 15% slope, 20% slope, and
25% slope. A blue line represents the motor traction force in the EV mode, and it can overcome the
resistance of 25% slope at 10 km/h. Black lines represent the engine traction force with different gear
ratios, from the top to bottom: first gear to fourth gear and top speed gear. With these designed gear
ratios, the vehicle can reach a speed of approximately 160 and 170 km/h by using the engine and the
hybrid mode, respectively.
Table 3. Gear ratio design values.
Different 𝒌𝒓𝒂𝒕𝒊𝒐
𝑘1 1 1 1 1
𝑘2 1.6 1.4912 1.2 1
EV 12.45 13.36 16.6 19.92
Other parameters
𝜑1 1.298
1st gear 11.67
2nd gear 7.44
3rd gear 5.21
4th gear 4.01
Top speed gear 3.67
Figure 6. Traction force diagram with designed gear ratio.
2.3. Parallel Hybrid Vehicle Model for numerical simulation
In this section, the basic theory from Section 2.1 and Section 2.2 is used to design the complete
parallel hybrid vehicle propulsion systems with single EMs in the Simscape environment. This
system model includes the driving control, power units, transmission architectures, and vehicle body.
2.3.1. Introduction of Simscape Environment
Figure 6. Traction force diagram with designed gear ratio.
2.3.1. Introduction of Simscape Environment
The basic theory from Sections 2.1 and 2.2 is used to design the complete parallel hybrid vehiclepropulsion systems with single EMs in the Simscape environment [24]. This system model includesthe driving control, power units, transmission architectures, and vehicle body.
Simscape is a set of block libraries and particular simulation features for modeling the physicalsystems in the Simulink environment [24]. It employs the physical network approach, which differsfrom the standard Simulink modeling approach, and it is particularly suited to simulate systemscomprising real physical components. The physical network approach, with Through and Acrossvariables and nondirectional physical connections, automatically resolves all conventional concernswith various factors, such as variables and directionality. Simscape can create a network representationof the designed system that is based on the physical network approach. According to this approach,each system comprises functional elements that interact with each other by exchanging energy throughtheir ports. The number of connection ports for each element is determined while using the number ofenergy flows that were exchanged with other elements in the system, and it depends on the level ofidealization. Energy flow is characterized using its variables. Each energy flow is associated with twovariables, namely Through and Across. In general, and the product of these variables provides energyflow in watts.
Simscape blocks may have the following types of ports:• Physical conserving ports—Nondirectional ports that represent physical connections and relate
physical variables based on the physical network approach.• Physical signal ports—Unidirectional ports transferring signals that use an internal Simscape
engine for computations.Physical Network approach supports the following two of variables:• Through—Variables that are measured with a gauge connected in series with an element.• Across—Variables that are measured with a gauge connected in parallel with an element.To simulate and analyze the propulsion system of the hybrid EV, this study focused on electrical,
mechanical rotational, and mechanical translational domain. All of the simulation was performedusing the commercial program of Matlab [25].
2.3.2. Subsystem Models
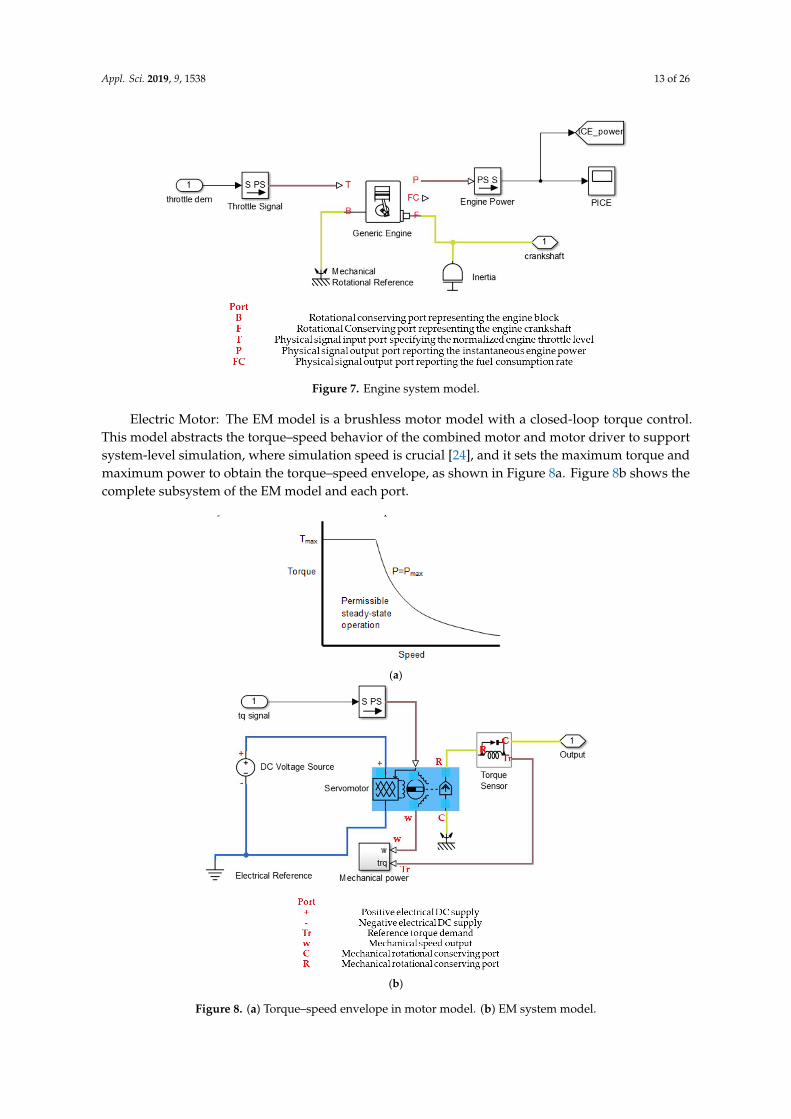
Engine: The hybrid propulsion system comprises two power units of ICE and the EM, as well ascontaining PIM, transmission, and vehicle body. This model uses a programmed relationship betweenthe torque and speed modulated using a throttle signal [25]. Figure 7 shows the subsystem of theengine model.
Appl. Sci. 2019, 9, 1538 13 of 26
Appl. Sci. 2019, 9, x FOR PEER REVIEW 12 of 26
The basic theory from Section 2.1 and Section 2.2 is used to design the complete parallel hybrid
vehicle propulsion systems with single EMs in the Simscape environment [24]. This system model
includes the driving control, power units, transmission architectures, and vehicle body.
Simscape is a set of block libraries and particular simulation features for modeling the physical
systems in the Simulink environment [24]. It employs the physical network approach, which differs
from the standard Simulink modeling approach, and it is particularly suited to simulate systems
comprising real physical components. The physical network approach, with Through and Across
variables and nondirectional physical connections, automatically resolves all conventional concerns
with various factors, such as variables and directionality. Simscape can create a network
representation of the designed system that is based on the physical network approach. According to
this approach, each system comprises functional elements that interact with each other by exchanging
energy through their ports. The number of connection ports for each element is determined while
using the number of energy flows that were exchanged with other elements in the system, and it
depends on the level of idealization. Energy flow is characterized using its variables. Each energy
flow is associated with two variables, namely Through and Across. In general, and the product of
these variables provides energy flow in watts.
Simscape blocks may have the following types of ports:
• Physical conserving ports—Nondirectional ports that represent physical connections and relate
physical variables based on the physical network approach.
• Physical signal ports—Unidirectional ports transferring signals that use an internal Simscape
engine for computations.
Physical Network approach supports the following two of variables:
• Through—Variables that are measured with a gauge connected in series with an element.
• Across—Variables that are measured with a gauge connected in parallel with an element.
To simulate and analyze the propulsion system of the hybrid EV, this study focused on electrical,
mechanical rotational, and mechanical translational domain. All of the simulation was performed using
the commercial program of Matlab [25].
2.3.2. Subsystem Models
Engine: The hybrid propulsion system comprises two power units of ICE and the EM, as well as
containing PIM, transmission, and vehicle body. This model uses a programmed relationship
between the torque and speed modulated using a throttle signal [25]. Figure 7 shows the subsystem
of the engine model.
Figure 7. Engine system model. Figure 7. Engine system model.
Electric Motor: The EM model is a brushless motor model with a closed-loop torque control.This model abstracts the torque–speed behavior of the combined motor and motor driver to supportsystem-level simulation, where simulation speed is crucial [24], and it sets the maximum torque andmaximum power to obtain the torque–speed envelope, as shown in Figure 8a. Figure 8b shows thecomplete subsystem of the EM model and each port.
Appl. Sci. 2019, 9, x FOR PEER REVIEW 13 of 26
Electric Motor: The EM model is a brushless motor model with a closed-loop torque control. This
model abstracts the torque–speed behavior of the combined motor and motor driver to support
system-level simulation, where simulation speed is crucial [24], and it sets the maximum torque and
maximum power to obtain the torque–speed envelope, as shown in Figure 8a. Figure 8b shows the
complete subsystem of the EM model and each port.
(a)
(b)
Figure 8. (a) Torque–speed envelope in motor model. (b) EM system model.
Transmission: The transmission model comprises a clutch model and gear model to simulate
multigear transmission behavior. Two types of gear models can be used for the transmission model.
The spur gear model with a gearbox or a TC-PIM constrains the two connected driveline axes within
a fixed gear ratio and it imposes a kinematic constraint on the two connected axes using Equation
(16). The torque transfer function of this model is obtained using Equation (29).
𝐺𝐹𝐵𝑇𝐵 + 𝑇𝐹 − 𝑇𝑙𝑜𝑠𝑠 = 0 (29)
In real-time applications, the angular velocity of a pair of the spur gear set exhibits an opposite
rotation direction. In this study, all of the angular speeds through the spur gear set are set-up in the
same rotation direction without losses to simplify the simulation process and the complexity of
system model under ideal conditions. Figure 9 shows the details of a six-speed gearbox model the
meaning of each port, which shifts the gear by using a controlled shift link in each clutch. Table 4
shows the clutch schedule for each gear.
Figure 8. (a) Torque–speed envelope in motor model. (b) EM system model.

Appl. Sci. 2019, 9, 1538 14 of 26
Transmission: The transmission model comprises a clutch model and gear model to simulatemultigear transmission behavior. Two types of gear models can be used for the transmission model.The spur gear model with a gearbox or a TC-PIM constrains the two connected driveline axes within afixed gear ratio and it imposes a kinematic constraint on the two connected axes using Equation (16).The torque transfer function of this model is obtained using Equation (29).
GFBTB + TF − Tloss = 0 (29)
In real-time applications, the angular velocity of a pair of the spur gear set exhibits an oppositerotation direction. In this study, all of the angular speeds through the spur gear set are set-up in thesame rotation direction without losses to simplify the simulation process and the complexity of systemmodel under ideal conditions. Figure 9 shows the details of a six-speed gearbox model the meaning ofeach port, which shifts the gear by using a controlled shift link in each clutch. Table 4 shows the clutchschedule for each gear.Appl. Sci. 2019, 9, x FOR PEER REVIEW 14 of 26
Figure 9. Gearbox system model.
Table 4. Clutch schedule.
Clutch 1 Clutch 2 Clutch 3
EV gear Left engaged N N
1st gear Right engaged N N
2nd gear N Left engaged N
3rd gear N Right engaged N
4th gear N N Left engaged
Hybrid top speed gear N N Right engaged
Vehicle body: The vehicle body model includes the TWs, vehicle body, and brake system, as
shown in Figure 10. The values in Table 5 are the preset recommended values that are provided by
Simscape [24]. As our simulation specifications are general, the simulation is done with the
recommended values that are provided in the software. Cg is the mass center of vehicles. The position
of the center is related to the height of the vehicle from the ground and the position of the front and
rear axles. In this model, the slope of the road and wind velocity can be set to simulate the different
conditions of the driving resistance if required. In general, there are three types of air resistance: the
first is the resistance caused by the air impact on the front of the vehicle, the second is the friction
resistance, and the third is the external resistance. The value of the wind velocity is also preset in
Simscape.
Figure 9. Gearbox system model.
Table 4. Clutch schedule.
Clutch 1 Clutch 2 Clutch 3
EV gear Left engaged N N1st gear Right engaged N N2nd gear N Left engaged N3rd gear N Right engaged N4th gear N N Left engaged
Hybrid top speed gear N N Right engaged
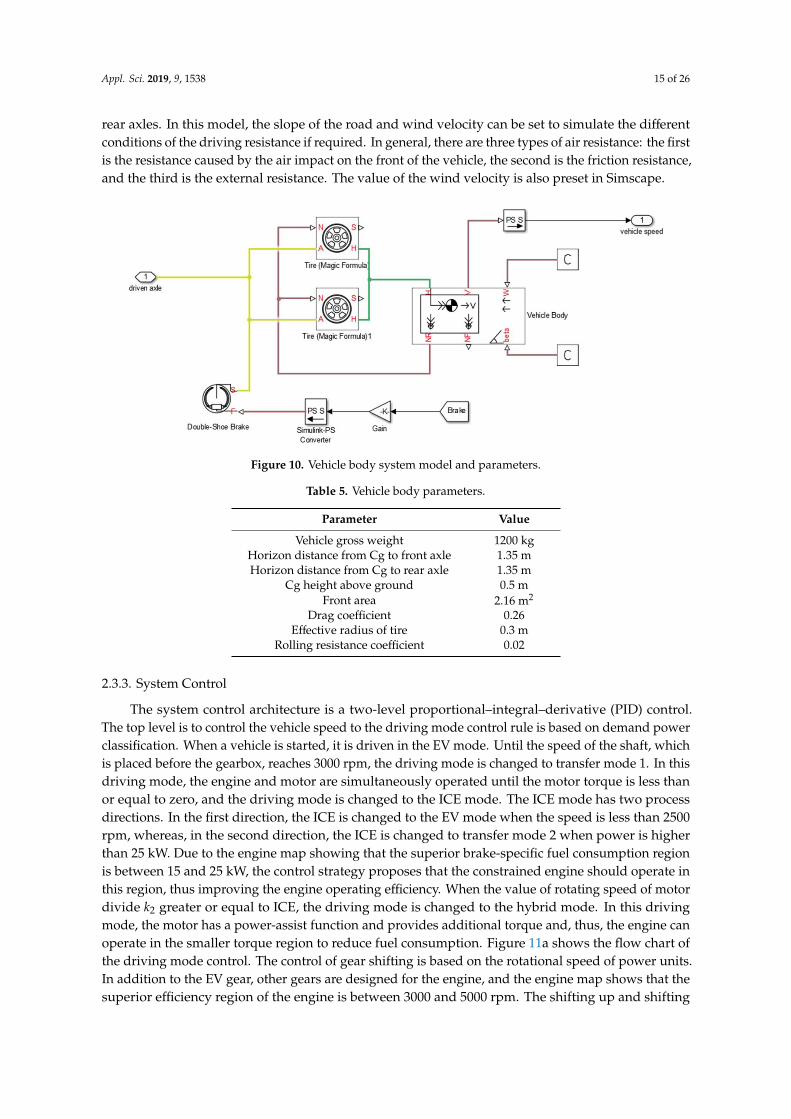
Vehicle body: The vehicle body model includes the TWs, vehicle body, and brake system,as shown in Figure 10. The values in Table 5 are the preset recommended values that are providedby Simscape [24]. As our simulation specifications are general, the simulation is done with therecommended values that are provided in the software. Cg is the mass center of vehicles. The positionof the center is related to the height of the vehicle from the ground and the position of the front and
Appl. Sci. 2019, 9, 1538 15 of 26
rear axles. In this model, the slope of the road and wind velocity can be set to simulate the differentconditions of the driving resistance if required. In general, there are three types of air resistance: the firstis the resistance caused by the air impact on the front of the vehicle, the second is the friction resistance,and the third is the external resistance. The value of the wind velocity is also preset in Simscape.Appl. Sci. 2019, 9, x FOR PEER REVIEW 15 of 26
Figure 10. Vehicle body system model and parameters.
Table 5. Vehicle body parameters.
Parameter Value
Vehicle gross weight 1200 kg
Horizon distance from Cg to front axle 1.35 m
Horizon distance from Cg to rear axle 1.35 m
Cg height above ground 0.5 m
Front area 2.16 m2
Drag coefficient 0.26
Effective radius of tire 0.3 m
Rolling resistance coefficient 0.02
2.3.3. System Control
The system control architecture is a two-level proportional–integral–derivative (PID) control.
The top level is to control the vehicle speed to the driving mode control rule is based on demand
power classification. When a vehicle is started, it is driven in the EV mode. Until the speed of the
shaft, which is placed before the gearbox, reaches 3000 rpm, the driving mode is changed to transfer
mode 1. In this driving mode, the engine and motor are simultaneously operated until the motor
torque is less than or equal to zero, and the driving mode is changed to the ICE mode. The ICE mode
has two process directions. In the first direction, the ICE is changed to the EV mode when the speed
is less than 2500 rpm, whereas, in the second direction, the ICE is changed to transfer mode 2 when
power is higher than 25 kW. Due to the engine map showing that the superior brake-specific fuel
consumption region is between 15 and 25 kW, the control strategy proposes that the constrained
engine should operate in this region, thus improving the engine operating efficiency. When the value
of rotating speed of motor divide 𝑘2 greater or equal to ICE, the driving mode is changed to the
hybrid mode. In this driving mode, the motor has a power-assist function and provides additional
torque and, thus, the engine can operate in the smaller torque region to reduce fuel consumption.
Figure 11a shows the flow chart of the driving mode control. The control of gear shifting is based on
the rotational speed of power units. In addition to the EV gear, other gears are designed for the
engine, and the engine map shows that the superior efficiency region of the engine is between 3000
and 5000 rpm. The shifting up and shifting down references are higher than 5000 rpm and less than
3000 rpm, respectively. Figure 11b shows the flow chart of the gear shifting control.
Figure 10. Vehicle body system model and parameters.
Table 5. Vehicle body parameters.
Parameter Value
Vehicle gross weight 1200 kgHorizon distance from Cg to front axle 1.35 mHorizon distance from Cg to rear axle 1.35 m
Cg height above ground 0.5 mFront area 2.16 m2
Drag coefficient 0.26Effective radius of tire 0.3 m
Rolling resistance coefficient 0.02
2.3.3. System Control
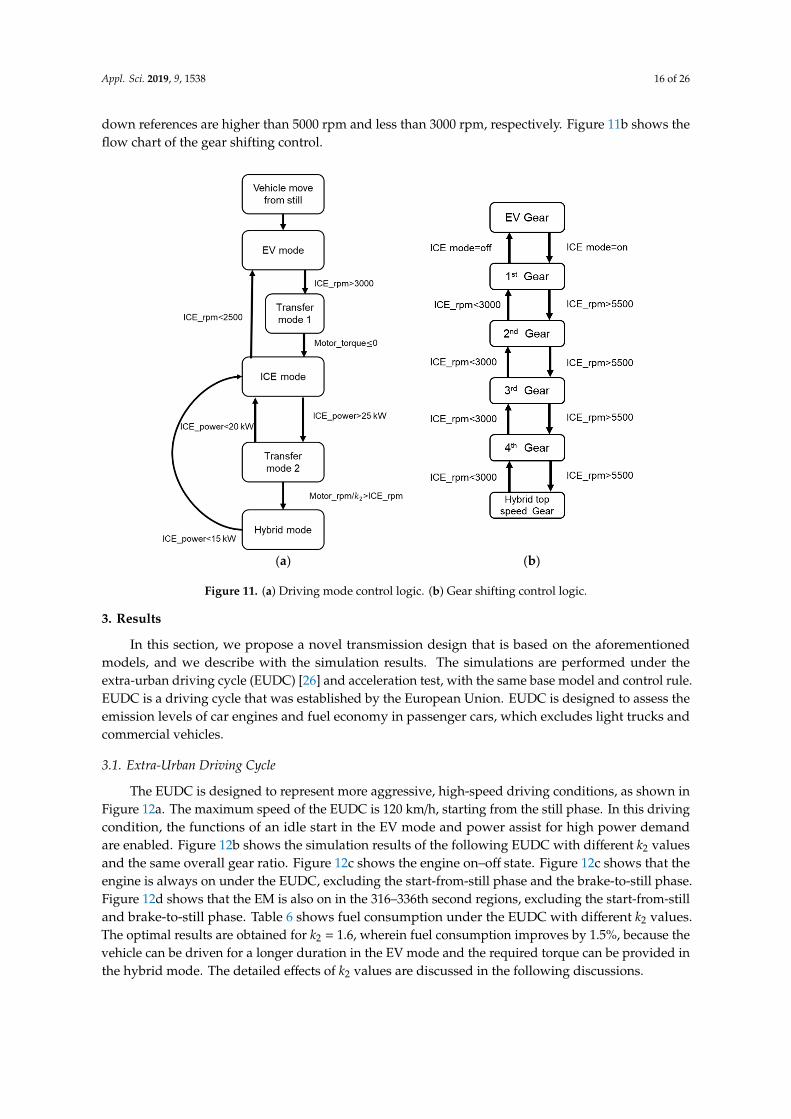
The system control architecture is a two-level proportional–integral–derivative (PID) control.The top level is to control the vehicle speed to the driving mode control rule is based on demand powerclassification. When a vehicle is started, it is driven in the EV mode. Until the speed of the shaft, whichis placed before the gearbox, reaches 3000 rpm, the driving mode is changed to transfer mode 1. In thisdriving mode, the engine and motor are simultaneously operated until the motor torque is less thanor equal to zero, and the driving mode is changed to the ICE mode. The ICE mode has two processdirections. In the first direction, the ICE is changed to the EV mode when the speed is less than 2500rpm, whereas, in the second direction, the ICE is changed to transfer mode 2 when power is higherthan 25 kW. Due to the engine map showing that the superior brake-specific fuel consumption regionis between 15 and 25 kW, the control strategy proposes that the constrained engine should operate inthis region, thus improving the engine operating efficiency. When the value of rotating speed of motordivide k2 greater or equal to ICE, the driving mode is changed to the hybrid mode. In this drivingmode, the motor has a power-assist function and provides additional torque and, thus, the engine canoperate in the smaller torque region to reduce fuel consumption. Figure 11a shows the flow chart ofthe driving mode control. The control of gear shifting is based on the rotational speed of power units.In addition to the EV gear, other gears are designed for the engine, and the engine map shows that thesuperior efficiency region of the engine is between 3000 and 5000 rpm. The shifting up and shifting
Appl. Sci. 2019, 9, 1538 16 of 26
down references are higher than 5000 rpm and less than 3000 rpm, respectively. Figure 11b shows theflow chart of the gear shifting control.Appl. Sci. 2019, 9, x FOR PEER REVIEW 16 of 26
(a) (b)
Figure 11. (a) Driving mode control logic. (b) Gear shifting control logic.
3. Results
In this section, we propose a novel transmission design that is based on the aforementioned
models, and we describe with the simulation results. The simulations are performed under the extra-
urban driving cycle (EUDC) [26] and acceleration test, with the same base model and control rule.
EUDC is a driving cycle that was established by the European Union. EUDC is designed to assess the
emission levels of car engines and fuel economy in passenger cars, which excludes light trucks and
commercial vehicles.
3.1. Extra-Urban Driving Cycle
The EUDC is designed to represent more aggressive, high-speed driving conditions, as shown
in Figure 12a. The maximum speed of the EUDC is 120 km/h, starting from the still phase. In this
driving condition, the functions of an idle start in the EV mode and power assist for high power
demand are enabled. Figure 12b shows the simulation results of the following EUDC with different
𝑘2 values and the same overall gear ratio. Figure 12c shows the engine on–off state. Figure 12c shows
that the engine is always on under the EUDC, excluding the start-from-still phase and the brake-to-
still phase. Figure 12d shows that the EM is also on in the 316–336th second regions, excluding the
start-from-still and brake-to-still phase. Table 6 shows fuel consumption under the EUDC with
different 𝑘2 values. The optimal results are obtained for 𝑘2 = 1.6, wherein fuel consumption
improves by 1.5%, because the vehicle can be driven for a longer duration in the EV mode and the
required torque can be provided in the hybrid mode. The detailed effects of 𝑘2 values are discussed
in the following discussions.
Figure 11. (a) Driving mode control logic. (b) Gear shifting control logic.
3. Results
In this section, we propose a novel transmission design that is based on the aforementionedmodels, and we describe with the simulation results. The simulations are performed under theextra-urban driving cycle (EUDC) [26] and acceleration test, with the same base model and control rule.EUDC is a driving cycle that was established by the European Union. EUDC is designed to assess theemission levels of car engines and fuel economy in passenger cars, which excludes light trucks andcommercial vehicles.
3.1. Extra-Urban Driving Cycle
The EUDC is designed to represent more aggressive, high-speed driving conditions, as shown inFigure 12a. The maximum speed of the EUDC is 120 km/h, starting from the still phase. In this drivingcondition, the functions of an idle start in the EV mode and power assist for high power demandare enabled. Figure 12b shows the simulation results of the following EUDC with different k2 valuesand the same overall gear ratio. Figure 12c shows the engine on–off state. Figure 12c shows that theengine is always on under the EUDC, excluding the start-from-still phase and the brake-to-still phase.Figure 12d shows that the EM is also on in the 316–336th second regions, excluding the start-from-stilland brake-to-still phase. Table 6 shows fuel consumption under the EUDC with different k2 values.The optimal results are obtained for k2 = 1.6, wherein fuel consumption improves by 1.5%, because thevehicle can be driven for a longer duration in the EV mode and the required torque can be provided inthe hybrid mode. The detailed effects of k2 values are discussed in the following discussions.

Appl. Sci. 2019, 9, 1538 17 of 26Appl. Sci. 2019, 9, x FOR PEER REVIEW 17 of 26
(a) (b)
(c) (d)
Figure 12. (a) Standard extra-urban driving cycle (EUDC) driving cycle. (b) Simulation follow driving
cycle. (c) Status of engine. (d) State of motor (𝑘2 = 1).
Table 6. Fuel consumption under extra-urban driving cycle (EUDC).
𝒌𝟐 = 1 𝒌𝟐 = 1.2 𝒌𝟐 = 1.4912 𝒌𝟐 = 1.6
EV gear ratio 19.92 14.06 13.36 12.45
EV overall ratio 19.92
Fuel consumption (km/L) 16.9 16.98 17.12 17.15
Figure 13a shows the different motor statuses, which indicate that a larger 𝑘2 value drives the
motor for a longer duration in the EV mode. Figure 13b shows the motor torque that is provided
under the EUDC. The motor provides a positive torque under the EUDC, which indicates that the
motor works as a traction motor. Engage and disengage clutches when shifting the gear or when
changing the driving mode generate negative impulse. Figure 13c shows that the motor provides a
torque in the power-assist region, and a smaller of 𝑘2 value provides more torque, whereas a larger
𝑘2 provides less torque from the motor side before TC-PIM. The torque that is provided by the motor
increases after the 325th second due to gear shifting, as shown in Figure 13d. Table 7 shows that the
torque provided by the motor after the TC-PIM is larger for 𝑘2 = 1.6; thus, higher 𝑘2 values exhibit
superior power-assist ability.
Figure 12. (a) Standard extra-urban driving cycle (EUDC) driving cycle. (b) Simulation follow drivingcycle. (c) Status of engine. (d) State of motor (k2 = 1).
Table 6. Fuel consumption under extra-urban driving cycle (EUDC).
k2 = 1 k2 = 1.2 k2 = 1.4912 k2 = 1.6
EV gear ratio 19.92 14.06 13.36 12.45EV overall ratio 19.92
Fuel consumption (km/L) 16.9 16.98 17.12 17.15
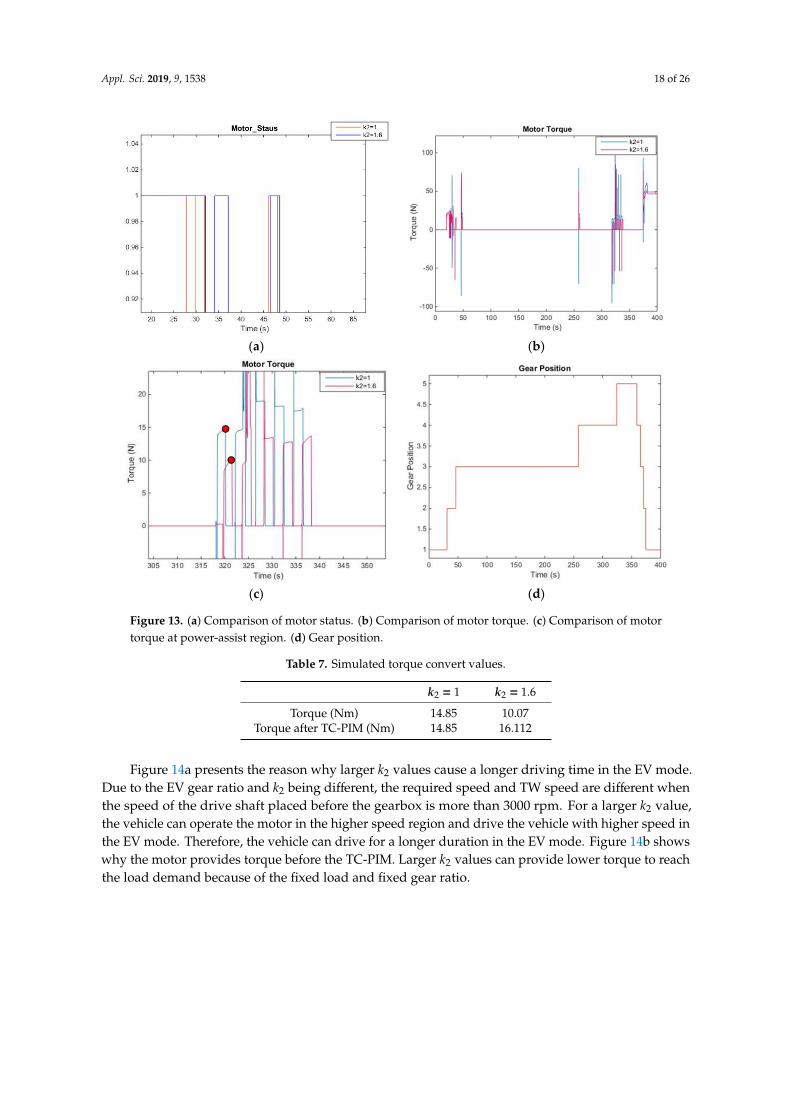
Figure 13a shows the different motor statuses, which indicate that a larger k2 value drives themotor for a longer duration in the EV mode. Figure 13b shows the motor torque that is provided underthe EUDC. The motor provides a positive torque under the EUDC, which indicates that the motorworks as a traction motor. Engage and disengage clutches when shifting the gear or when changingthe driving mode generate negative impulse. Figure 13c shows that the motor provides a torque inthe power-assist region, and a smaller of k2 value provides more torque, whereas a larger k2 providesless torque from the motor side before TC-PIM. The torque that is provided by the motor increasesafter the 325th second due to gear shifting, as shown in Figure 13d. Table 7 shows that the torqueprovided by the motor after the TC-PIM is larger for k2 = 1.6; thus, higher k2 values exhibit superiorpower-assist ability.
Appl. Sci. 2019, 9, 1538 18 of 26
Appl. Sci. 2019, 9, x FOR PEER REVIEW 18 of 26
(a) (b)
(c) (d)
Figure 13. (a) Comparison of motor status. (b) Comparison of motor torque. (c) Comparison of motor
torque at power-assist region. (d) Gear position.
Table 7. Simulated torque convert values.
𝒌𝟐 = 1 𝒌𝟐 = 1.6
Torque (Nm) 14.85 10.07
Torque after TC-PIM (Nm) 14.85 16.112
Figure 14a presents the reason why larger 𝑘2 values cause a longer driving time in the EV mode.
Due to the EV gear ratio and 𝑘2 being different, the required speed and TW speed are different when
the speed of the drive shaft placed before the gearbox is more than 3000 rpm. For a larger 𝑘2 value,
the vehicle can operate the motor in the higher speed region and drive the vehicle with higher speed
in the EV mode. Therefore, the vehicle can drive for a longer duration in the EV mode. Figure 14b
shows why the motor provides torque before the TC-PIM. Larger 𝑘2 values can provide lower
torque to reach the load demand because of the fixed load and fixed gear ratio.
(a) (b)
Figure 13. (a) Comparison of motor status. (b) Comparison of motor torque. (c) Comparison of motortorque at power-assist region. (d) Gear position.
Table 7. Simulated torque convert values.
k2 = 1 k2 = 1.6
Torque (Nm) 14.85 10.07Torque after TC-PIM (Nm) 14.85 16.112
Figure 14a presents the reason why larger k2 values cause a longer driving time in the EV mode.Due to the EV gear ratio and k2 being different, the required speed and TW speed are different whenthe speed of the drive shaft placed before the gearbox is more than 3000 rpm. For a larger k2 value,the vehicle can operate the motor in the higher speed region and drive the vehicle with higher speed inthe EV mode. Therefore, the vehicle can drive for a longer duration in the EV mode. Figure 14b showswhy the motor provides torque before the TC-PIM. Larger k2 values can provide lower torque to reachthe load demand because of the fixed load and fixed gear ratio.

Appl. Sci. 2019, 9, 1538 19 of 26
Appl. Sci. 2019, 9, x FOR PEER REVIEW 18 of 26
(a) (b)
(c) (d)
Figure 13. (a) Comparison of motor status. (b) Comparison of motor torque. (c) Comparison of motor
torque at power-assist region. (d) Gear position.
Table 7. Simulated torque convert values.
𝒌𝟐 = 1 𝒌𝟐 = 1.6
Torque (Nm) 14.85 10.07
Torque after TC-PIM (Nm) 14.85 16.112
Figure 14a presents the reason why larger 𝑘2 values cause a longer driving time in the EV mode.
Due to the EV gear ratio and 𝑘2 being different, the required speed and TW speed are different when
the speed of the drive shaft placed before the gearbox is more than 3000 rpm. For a larger 𝑘2 value,
the vehicle can operate the motor in the higher speed region and drive the vehicle with higher speed
in the EV mode. Therefore, the vehicle can drive for a longer duration in the EV mode. Figure 14b
shows why the motor provides torque before the TC-PIM. Larger 𝑘2 values can provide lower
torque to reach the load demand because of the fixed load and fixed gear ratio.
(a) (b)
Figure 14. (a) Influence of different k2 and electric vehicle (EV) gear ratio and (b) influence of torqueapplies with different values k2.
Figure 15a–d present the operation points of the engine under the EUDC. The engine starts atapproximately 3000 rpm to avoid an idle start, and many operation points are observed between the3000-rpm and 5000-rpm region because of gear shifting for controlling the engine speed in this region.
Appl. Sci. 2019, 9, x FOR PEER REVIEW 19 of 26
Figure 14. (a) Influence of different 𝑘2 and electric vehicle (EV) gear ratio and (b) influence of torque
applies with different values 𝑘2.
Figure 15a–d present the operation points of the engine under the EUDC. The engine starts at
approximately 3000 rpm to avoid an idle start, and many operation points are observed between the
3000-rpm and 5000-rpm region because of gear shifting for controlling the engine speed in this region.
(a) (b)
(c) (d)
Figure 15. (a) Engine operation points (with 𝑘2 = 1). (b) Engine operation points (with 𝑘2 = 1.2). (c)
Engine operation points (with 𝑘2 = 1.4912). (d) Engine operation points (with 𝑘2 = 1.6).
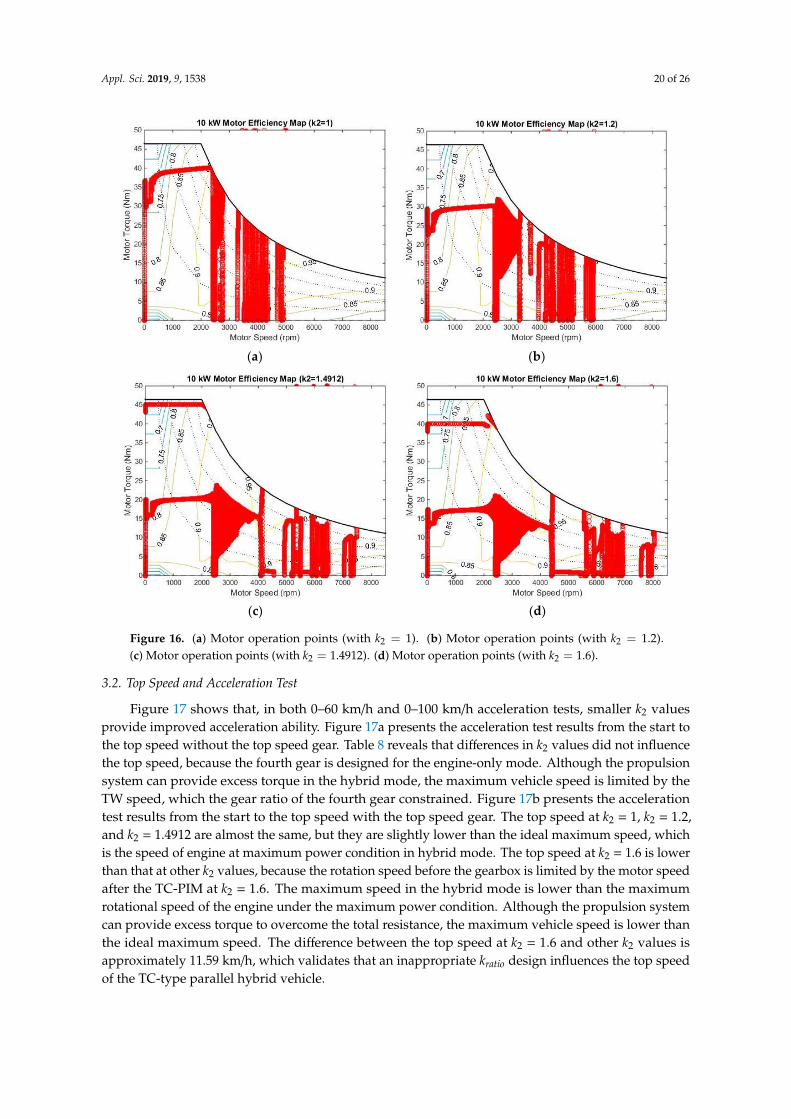
Figure 16a–d provide the operation points of the motor under the EUDC with different 𝑘2
values. The operation points are evident in different regions as the 𝑘2 values change.
(a) (b)
Figure 15. (a) Engine operation points (with k2 = 1). (b) Engine operation points (with k2 = 1.2).(c) Engine operation points (with k2 = 1.4912). (d) Engine operation points (with k2 = 1.6).
Figure 16a–d provide the operation points of the motor under the EUDC with different k2 values.The operation points are evident in different regions as the k2 values change.
Appl. Sci. 2019, 9, 1538 20 of 26
Appl. Sci. 2019, 9, x FOR PEER REVIEW 19 of 26
Figure 14. (a) Influence of different 𝑘2 and electric vehicle (EV) gear ratio and (b) influence of torque
applies with different values 𝑘2.
Figure 15a–d present the operation points of the engine under the EUDC. The engine starts at
approximately 3000 rpm to avoid an idle start, and many operation points are observed between the
3000-rpm and 5000-rpm region because of gear shifting for controlling the engine speed in this region.
(a) (b)
(c) (d)
Figure 15. (a) Engine operation points (with 𝑘2 = 1). (b) Engine operation points (with 𝑘2 = 1.2). (c)
Engine operation points (with 𝑘2 = 1.4912). (d) Engine operation points (with 𝑘2 = 1.6).
Figure 16a–d provide the operation points of the motor under the EUDC with different 𝑘2
values. The operation points are evident in different regions as the 𝑘2 values change.
(a) (b)
Appl. Sci. 2019, 9, x FOR PEER REVIEW 20 of 26
(c) (d)
Figure 16. (a) Motor operation points (with 𝑘2 = 1). (b) Motor operation points (with 𝑘2 = 1.2). (c)
Motor operation points (with 𝑘2 = 1.4912). (d) Motor operation points (with 𝑘2 = 1.6).
3.2. Top Speed and Acceleration Test
Figure 17 shows that, in both 0–60 km/h and 0–100 km/h acceleration tests, smaller 𝑘2 values
provide improved acceleration ability. Figure 17a presents the acceleration test results from the start
to the top speed without the top speed gear. Table 8 reveals that differences in 𝑘2 values did not
influence the top speed, because the fourth gear is designed for the engine-only mode. Although the
propulsion system can provide excess torque in the hybrid mode, the maximum vehicle speed is
limited by the TW speed, which the gear ratio of the fourth gear constrained. Figure 17b presents the
acceleration test results from the start to the top speed with the top speed gear. The top speed at 𝑘2
= 1, 𝑘2 = 1.2, and 𝑘2 = 1.4912 are almost the same, but they are slightly lower than the ideal maximum
speed, which is the speed of engine at maximum power condition in hybrid mode. The top speed at
𝑘2 = 1.6 is lower than that at other 𝑘2 values, because the rotation speed before the gearbox is limited
by the motor speed after the TC-PIM at 𝑘2 = 1.6. The maximum speed in the hybrid mode is lower
than the maximum rotational speed of the engine under the maximum power condition. Although
the propulsion system can provide excess torque to overcome the total resistance, the maximum
vehicle speed is lower than the ideal maximum speed. The difference between the top speed at 𝑘2 =
1.6 and other 𝑘2 values is approximately 11.59 km/h, which validates that an inappropriate 𝑘𝑟𝑎𝑡𝑖𝑜
design influences the top speed of the TC-type parallel hybrid vehicle.
(a) (b)
Figure 17. (a) Acceleration test with different 𝑘2 values without top speed gear. (b) Acceleration test
under different 𝑘2 values with top speed gear.
Figure 16. (a) Motor operation points (with k2 = 1). (b) Motor operation points (with k2 = 1.2).(c) Motor operation points (with k2 = 1.4912). (d) Motor operation points (with k2 = 1.6).
3.2. Top Speed and Acceleration Test
Figure 17 shows that, in both 0–60 km/h and 0–100 km/h acceleration tests, smaller k2 valuesprovide improved acceleration ability. Figure 17a presents the acceleration test results from the start tothe top speed without the top speed gear. Table 8 reveals that differences in k2 values did not influencethe top speed, because the fourth gear is designed for the engine-only mode. Although the propulsionsystem can provide excess torque in the hybrid mode, the maximum vehicle speed is limited by theTW speed, which the gear ratio of the fourth gear constrained. Figure 17b presents the accelerationtest results from the start to the top speed with the top speed gear. The top speed at k2 = 1, k2 = 1.2,and k2 = 1.4912 are almost the same, but they are slightly lower than the ideal maximum speed, whichis the speed of engine at maximum power condition in hybrid mode. The top speed at k2 = 1.6 is lowerthan that at other k2 values, because the rotation speed before the gearbox is limited by the motor speedafter the TC-PIM at k2 = 1.6. The maximum speed in the hybrid mode is lower than the maximumrotational speed of the engine under the maximum power condition. Although the propulsion systemcan provide excess torque to overcome the total resistance, the maximum vehicle speed is lower thanthe ideal maximum speed. The difference between the top speed at k2 = 1.6 and other k2 values isapproximately 11.59 km/h, which validates that an inappropriate kratio design influences the top speedof the TC-type parallel hybrid vehicle.
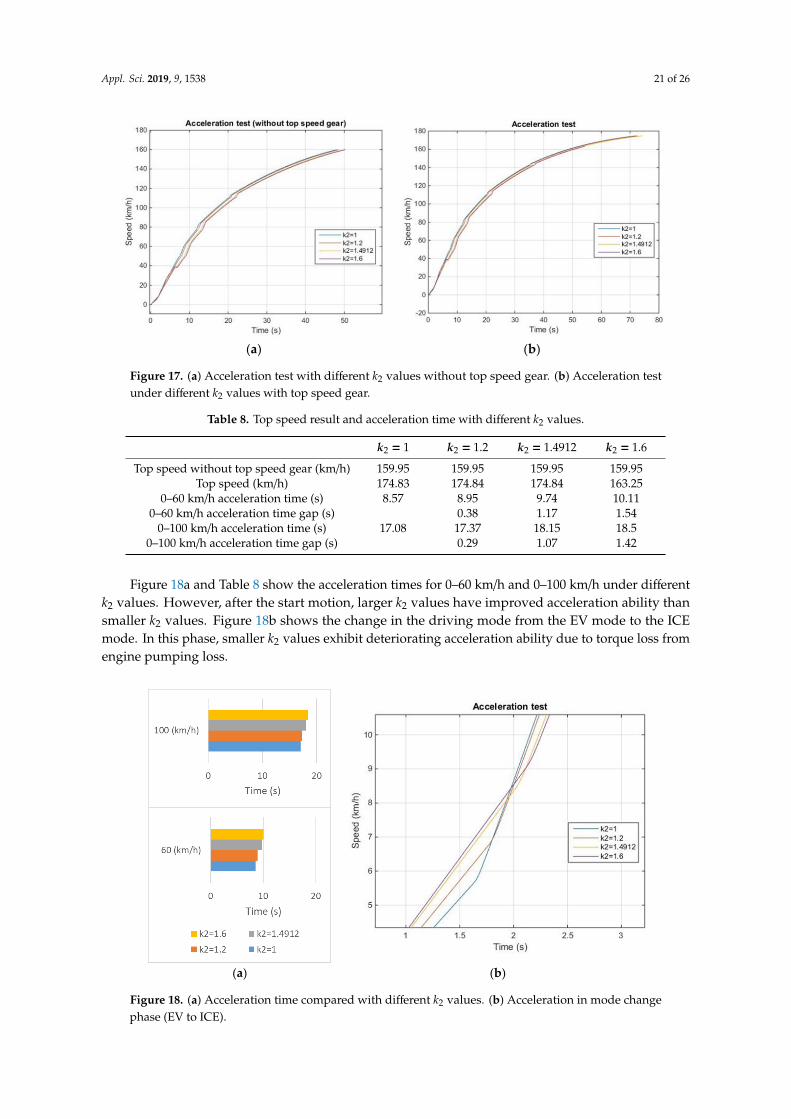
Appl. Sci. 2019, 9, 1538 21 of 26
Appl. Sci. 2019, 9, x FOR PEER REVIEW 20 of 26
(c) (d)
Figure 16. (a) Motor operation points (with 𝑘2 = 1). (b) Motor operation points (with 𝑘2 = 1.2). (c)
Motor operation points (with 𝑘2 = 1.4912). (d) Motor operation points (with 𝑘2 = 1.6).
3.2. Top Speed and Acceleration Test
Figure 17 shows that, in both 0–60 km/h and 0–100 km/h acceleration tests, smaller 𝑘2 values
provide improved acceleration ability. Figure 17a presents the acceleration test results from the start
to the top speed without the top speed gear. Table 8 reveals that differences in 𝑘2 values did not
influence the top speed, because the fourth gear is designed for the engine-only mode. Although the
propulsion system can provide excess torque in the hybrid mode, the maximum vehicle speed is
limited by the TW speed, which the gear ratio of the fourth gear constrained. Figure 17b presents the
acceleration test results from the start to the top speed with the top speed gear. The top speed at 𝑘2
= 1, 𝑘2 = 1.2, and 𝑘2 = 1.4912 are almost the same, but they are slightly lower than the ideal maximum
speed, which is the speed of engine at maximum power condition in hybrid mode. The top speed at
𝑘2 = 1.6 is lower than that at other 𝑘2 values, because the rotation speed before the gearbox is limited
by the motor speed after the TC-PIM at 𝑘2 = 1.6. The maximum speed in the hybrid mode is lower
than the maximum rotational speed of the engine under the maximum power condition. Although
the propulsion system can provide excess torque to overcome the total resistance, the maximum
vehicle speed is lower than the ideal maximum speed. The difference between the top speed at 𝑘2 =
1.6 and other 𝑘2 values is approximately 11.59 km/h, which validates that an inappropriate 𝑘𝑟𝑎𝑡𝑖𝑜
design influences the top speed of the TC-type parallel hybrid vehicle.
(a) (b)
Figure 17. (a) Acceleration test with different 𝑘2 values without top speed gear. (b) Acceleration test
under different 𝑘2 values with top speed gear.
Figure 17. (a) Acceleration test with different k2 values without top speed gear. (b) Acceleration testunder different k2 values with top speed gear.
Table 8. Top speed result and acceleration time with different k2 values.
k2 = 1 k2 = 1.2 k2 = 1.4912 k2 = 1.6
Top speed without top speed gear (km/h) 159.95 159.95 159.95 159.95Top speed (km/h) 174.83 174.84 174.84 163.25
0–60 km/h acceleration time (s) 8.57 8.95 9.74 10.110–60 km/h acceleration time gap (s) 0.38 1.17 1.54
0–100 km/h acceleration time (s) 17.08 17.37 18.15 18.50–100 km/h acceleration time gap (s) 0.29 1.07 1.42
Figure 18a and Table 8 show the acceleration times for 0–60 km/h and 0–100 km/h under differentk2 values. However, after the start motion, larger k2 values have improved acceleration ability thansmaller k2 values. Figure 18b shows the change in the driving mode from the EV mode to the ICEmode. In this phase, smaller k2 values exhibit deteriorating acceleration ability due to torque loss fromengine pumping loss.
Appl. Sci. 2019, 9, x FOR PEER REVIEW 21 of 26
Figure 18a and Table 8 show the acceleration times for 0–60 km/h and 0–100 km/h under
different 𝑘2 values. However, after the start motion, larger 𝑘2 values have improved acceleration
ability than smaller 𝑘2 values. Figure 18b shows the change in the driving mode from the EV mode
to the ICE mode. In this phase, smaller 𝑘2 values exhibit deteriorating acceleration ability due to
(a) (b)
Figure 18. (a) Acceleration time compared with different 𝑘2 values. (b) Acceleration in mode change
phase (EV to ICE).
Figure 19a shows engine pumping loss under the EUDC test and, thus, the motor provides a
torque to TWs and to start the rotation of the engine. Figure 19b shows the influence of engine
pumping loss on the pre-transmission architecture. As the engine pumping loss is almost constant,
the torque after the TC-PIM is affected. When the 𝑘2 value is larger, the torque after the TC-PIM is
larger. The engine pumping loss requires a smaller percentage of the total value of the torque after
the TC-PIM and, thus, the acceleration ability is superior for larger 𝑘2 values in the EV mode.
However, when the driving mode changes from the EV mode to ICE mode, the acceleration ability
rapidly increases because the engine can provide a larger torque than the EM. Smaller 𝑘2 values
enable an earlier change in the driving mode from the EV mode to the ICE mode. This observation is
because smaller 𝑘2 values exhibit more improved acceleration ability. Apart from the mode change,
Table 8 shows that the time gap between each 𝑘2 value and the smallest 𝑘2 value improves. Larger
𝑘2 values can improve the time gap, which indicates that larger 𝑘2 values have more improved
superior power-assist ability. This result is consistent with that of the EUDC test.
(a) (b)
Figure 18. (a) Acceleration time compared with different k2 values. (b) Acceleration in mode changephase (EV to ICE).
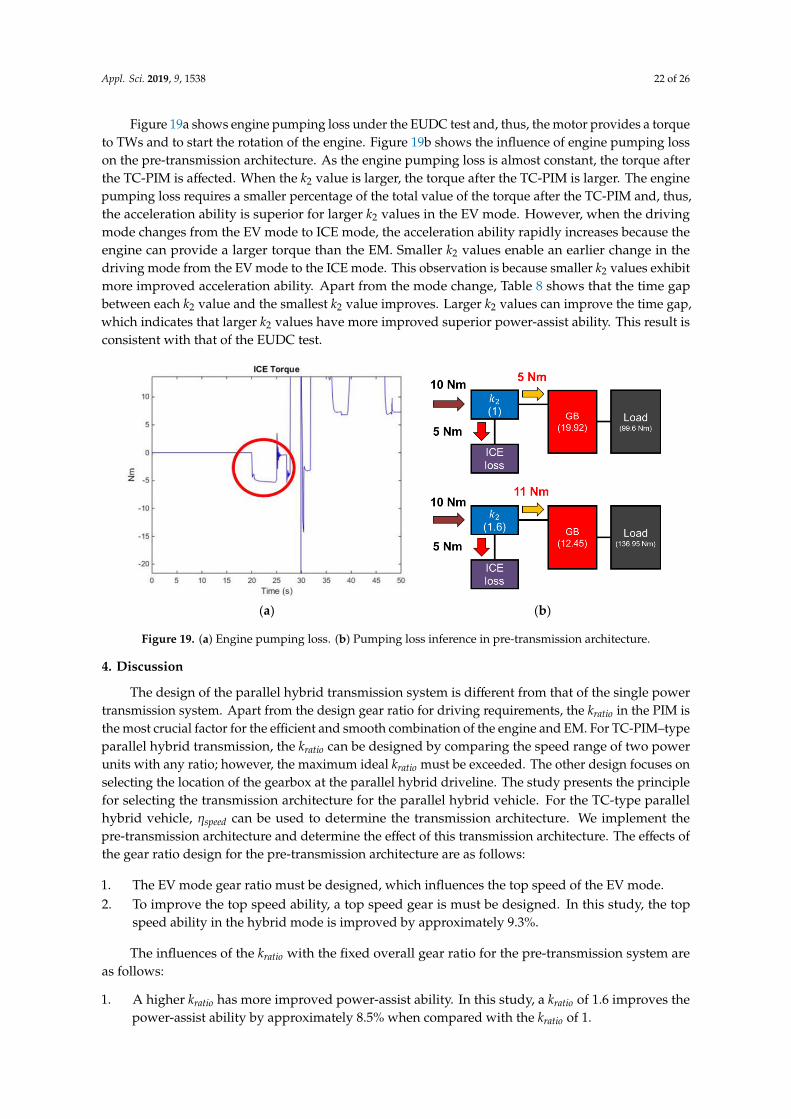
Appl. Sci. 2019, 9, 1538 22 of 26
Figure 19a shows engine pumping loss under the EUDC test and, thus, the motor provides a torqueto TWs and to start the rotation of the engine. Figure 19b shows the influence of engine pumping losson the pre-transmission architecture. As the engine pumping loss is almost constant, the torque afterthe TC-PIM is affected. When the k2 value is larger, the torque after the TC-PIM is larger. The enginepumping loss requires a smaller percentage of the total value of the torque after the TC-PIM and, thus,the acceleration ability is superior for larger k2 values in the EV mode. However, when the drivingmode changes from the EV mode to ICE mode, the acceleration ability rapidly increases because theengine can provide a larger torque than the EM. Smaller k2 values enable an earlier change in thedriving mode from the EV mode to the ICE mode. This observation is because smaller k2 values exhibitmore improved acceleration ability. Apart from the mode change, Table 8 shows that the time gapbetween each k2 value and the smallest k2 value improves. Larger k2 values can improve the time gap,which indicates that larger k2 values have more improved superior power-assist ability. This result isconsistent with that of the EUDC test.
Appl. Sci. 2019, 9, x FOR PEER REVIEW 21 of 26
Figure 18a and Table 8 show the acceleration times for 0–60 km/h and 0–100 km/h under
different 𝑘2 values. However, after the start motion, larger 𝑘2 values have improved acceleration
ability than smaller 𝑘2 values. Figure 18b shows the change in the driving mode from the EV mode
to the ICE mode. In this phase, smaller 𝑘2 values exhibit deteriorating acceleration ability due to
torque loss from engine pumping loss.
(a) (b)
Figure 18. (a) Acceleration time compared with different 𝑘2 values. (b) Acceleration in mode change
phase (EV to ICE).
Figure 19a shows engine pumping loss under the EUDC test and, thus, the motor provides a
torque to TWs and to start the rotation of the engine. Figure 19b shows the influence of engine
pumping loss on the pre-transmission architecture. As the engine pumping loss is almost constant,
the torque after the TC-PIM is affected. When the 𝑘2 value is larger, the torque after the TC-PIM is
larger. The engine pumping loss requires a smaller percentage of the total value of the torque after
the TC-PIM and, thus, the acceleration ability is superior for larger 𝑘2 values in the EV mode.
However, when the driving mode changes from the EV mode to ICE mode, the acceleration ability
rapidly increases because the engine can provide a larger torque than the EM. Smaller 𝑘2 values
enable an earlier change in the driving mode from the EV mode to the ICE mode. This observation is
because smaller 𝑘2 values exhibit more improved acceleration ability. Apart from the mode change,
Table 8 shows that the time gap between each 𝑘2 value and the smallest 𝑘2 value improves. Larger
𝑘2 values can improve the time gap, which indicates that larger 𝑘2 values have more improved
superior power-assist ability. This result is consistent with that of the EUDC test.
(a) (b)
Figure 19. (a) Engine pumping loss. (b) Pumping loss inference in pre-transmission architecture.
4. Discussion
The design of the parallel hybrid transmission system is different from that of the single powertransmission system. Apart from the design gear ratio for driving requirements, the kratio in the PIM isthe most crucial factor for the efficient and smooth combination of the engine and EM. For TC-PIM–typeparallel hybrid transmission, the kratio can be designed by comparing the speed range of two powerunits with any ratio; however, the maximum ideal kratio must be exceeded. The other design focuses onselecting the location of the gearbox at the parallel hybrid driveline. The study presents the principlefor selecting the transmission architecture for the parallel hybrid vehicle. For the TC-type parallelhybrid vehicle, ηspeed can be used to determine the transmission architecture. We implement thepre-transmission architecture and determine the effect of this transmission architecture. The effects ofthe gear ratio design for the pre-transmission architecture are as follows:
1. The EV mode gear ratio must be designed, which influences the top speed of the EV mode.2. To improve the top speed ability, a top speed gear is must be designed. In this study, the top
speed ability in the hybrid mode is improved by approximately 9.3%.
The influences of the kratio with the fixed overall gear ratio for the pre-transmission system areas follows:
1. A higher kratio has more improved power-assist ability. In this study, a kratio of 1.6 improves thepower-assist ability by approximately 8.5% when compared with the kratio of 1.
Appl. Sci. 2019, 9, 1538 23 of 26
2. The higher kratio provides wider-speed-region operation.3. A higher kratio can reduce the influence of engine pumping loss and, thus, it has more improved
acceleration ability in the EV mode.4. The top speed performance decreases with an improper kratio, which exceeds the maximum ideal
kratio. In this study, the top speed at the kratio of 1.6 is lower by approximately 6.63% than the topspeed at a kratio of 1.
Apart from the kratio, the torque–speed characteristic and hybridization factor are crucial in thesmooth coordination of the two power units in the hybrid power system. The relationship between thekratio and torque–speed characteristics is unclear. The quality of the design principle the kratio combinedwith the torque–speed characteristic must be examined. Apart from the TC-PIM, another powerintegral speed-coupled mechanism is available. The design principle of the kratio for the SC-PIM mustbe determined in the future. Therefore, a more efficient and powerful hybrid vehicle can be designed.
5. Conclusions
The design of TC-PIM parameters (i.e., k1 and k2) are based on kratio theory. We can uncovereffective k values for TC-PIM and a suitable location of gearbox, by following the simulations ofdriving cycles (EUDC) and acceleration test. The results show that a higher kratio has more improvedpower-assist ability for the pre-transmission architecture. For example, the kratio of 1.6 can improve thepower-assist ability by 8.5% as compared with the kratio of 1. In the design with an appropriate gearratio and kratio, the top speed ability of the vehicle can be improved by 9.3%, whereas, in an improperdesign, the top speed ability of vehicle can be improved by 2.06%. The simulation results show thatthe transmission system design influences vehicle performance, and it uses the combined power of thetwo power units for the parallel hybrid vehicle. The design matching principle that is proposed inthis study can determine the effective design range of the TC-PIM parameters and gear ratio of thegearbox. It can be used as a design reference theory for the transmission system of parallel hybridvehicles. However, performing the tests for practical vehicles remains challenge due to the difficultiesof the experimental constructions, including power integration mechanism, power units, gearbox, etc.The practical experiments may be demonstrated as future works.
Author Contributions: Conceptualization, P.-H.P.; methodology, P.-H.P.; software, P.-H.P.; validation, P.-T.C.,P.-H.P. and K.D.H.; formal analysis, P.-H.P.; investigation, P.-H.P.; resources, C.-J.Y.; data curation, P.-H.P.;writing—original draft preparation, P.-T.C. and C.-J.Y.; writing—review and editing, P.-T.C. and C.-J.Y.; visualization,P.-H.P.; supervision, C.-J.Y. and K.D.H.
Funding: This research received no external funding.
Acknowledgments: P.-T.C. thank the financial supported from the Center of Atomic Initiative for New Materials(AI-Mat), National Taiwan University, Taipei, Taiwan from the Featured Areas Research Center Program within theframework of the Higher Education Sprout Project by the Ministry of Education (MOE) in Taiwan. This manuscriptwas edited by Wallace Academic Editing.
Conflicts of Interest: The authors declare no conflict of interest.
Appendix A Nomenclature (Including Subscript)
A Front area of vehicle body (m2)Cd Drag coefficientCg Mass center of vehicleFD Drag resistance (N)FG Grade resistance (N)FGmax Maximum grade resistance (N)FR Rolling resistance (N)FT Traction force (N)
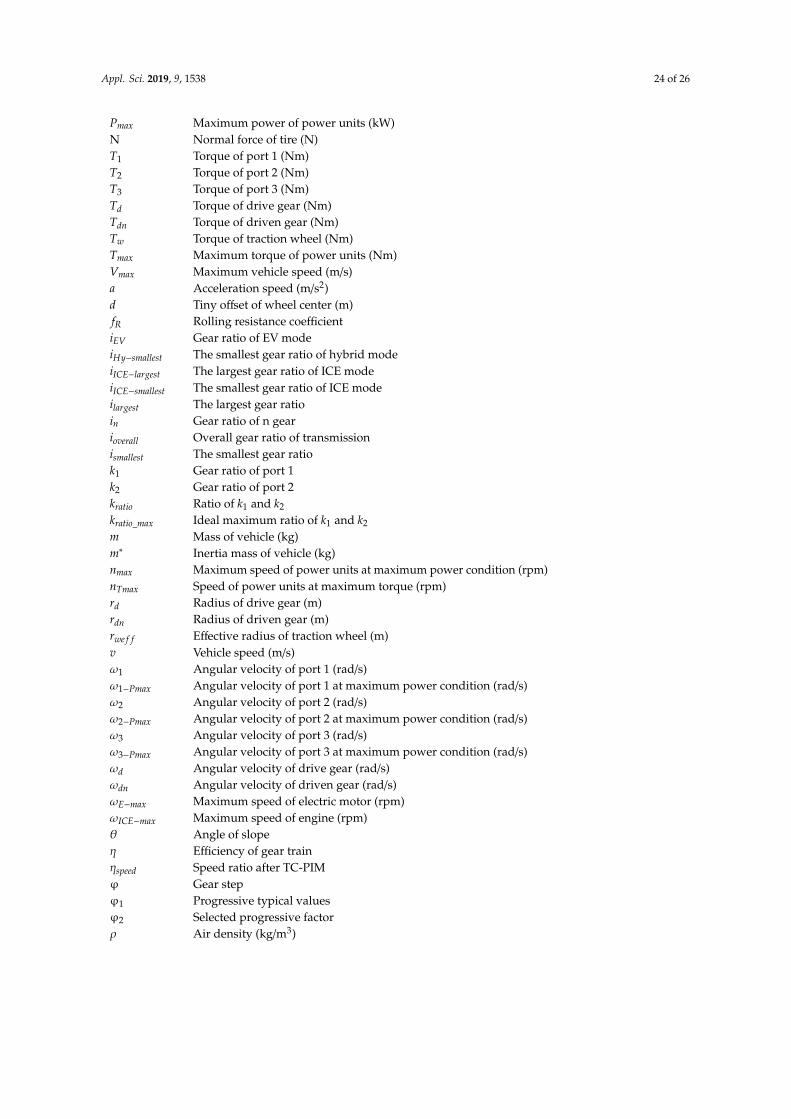
Appl. Sci. 2019, 9, 1538 24 of 26
Pmax Maximum power of power units (kW)N Normal force of tire (N)T1 Torque of port 1 (Nm)T2 Torque of port 2 (Nm)T3 Torque of port 3 (Nm)Td Torque of drive gear (Nm)Tdn Torque of driven gear (Nm)Tw Torque of traction wheel (Nm)Tmax Maximum torque of power units (Nm)Vmax Maximum vehicle speed (m/s)a Acceleration speed (m/s2)d Tiny offset of wheel center (m)fR Rolling resistance coefficientiEV Gear ratio of EV modeiHy−smallest The smallest gear ratio of hybrid modeiICE−largest The largest gear ratio of ICE modeiICE−smallest The smallest gear ratio of ICE modeilargest The largest gear ratioin Gear ratio of n gearioverall Overall gear ratio of transmissionismallest The smallest gear ratiok1 Gear ratio of port 1k2 Gear ratio of port 2kratio Ratio of k1 and k2
kratio_max Ideal maximum ratio of k1 and k2
m Mass of vehicle (kg)m∗ Inertia mass of vehicle (kg)nmax Maximum speed of power units at maximum power condition (rpm)nTmax Speed of power units at maximum torque (rpm)rd Radius of drive gear (m)rdn Radius of driven gear (m)rwe f f Effective radius of traction wheel (m)v Vehicle speed (m/s)ω1 Angular velocity of port 1 (rad/s)ω1−Pmax Angular velocity of port 1 at maximum power condition (rad/s)ω2 Angular velocity of port 2 (rad/s)ω2−Pmax Angular velocity of port 2 at maximum power condition (rad/s)ω3 Angular velocity of port 3 (rad/s)ω3−Pmax Angular velocity of port 3 at maximum power condition (rad/s)ωd Angular velocity of drive gear (rad/s)ωdn Angular velocity of driven gear (rad/s)ωE−max Maximum speed of electric motor (rpm)ωICE−max Maximum speed of engine (rpm)θ Angle of slopeη Efficiency of gear trainηspeed Speed ratio after TC-PIMϕ Gear stepϕ1 Progressive typical valuesϕ2 Selected progressive factorρ Air density (kg/m3)
Appl. Sci. 2019, 9, 1538 25 of 26
Abbreviations
EM Electric moterEV Electric vehicleEUDC Extra-urban driving cycleFUDS Federal urban driving cycleGB GearboxICE Internal combustion enginePID Proportional integral derivativePIM Power integration mechanismPMDC Permanent magnet direct currentSI Spark ignitionTC-PIM Torque-coupled-type power integration mechanismTW Traction wheel
References
1. Samadani, E.; Farhad, S.; Panchal, S.; Fraser, R.; Fowler, M. Modeling and Evaluation of Li-Ion BatteryPerformance Based on the Electric Vehicle Field Tests. SAE Technical Paper Series. 2014, 2014-01-1848.Available online: https://doi.org/10.4271/2014-01-1848 (accessed on 11 April 2019). [CrossRef]
2. Panchal, S.; Mathew, M.; Dincer, I.; Agelin-Chaab, M.; Fraser, R.; Fowler, M. Thermal and electricalperformance assessments of lithium-ion battery modules for an electric vehicle under actual drive cycles.Electr. Syst. Res. 2018, 163, 18–27. [CrossRef]
3. Chen, P.-T.; Yang, F.-H.; Sangeetha, T.; Gao, H.-M.; Huang, K.D. Moderate Energy for Charging Li-IonBatteries Determined by First-Principles Calculations. Batter. Supercaps 2018, 1, 209–214. [CrossRef]
4. Chen, P.T.; Yang, F.H.; Cao, Z.T.; Jhang, J.M.; Gao, H.M.; Yang, M.H.; Huang, K.D. Reviving Aged Lithium-IonBatteries and Prolonging Their Cycle Life by Sinusoidal Waveform Charging Strategy. Batter. Supercaps 2019.accepted. [CrossRef]
5. Huang, K.D.; Sangeetha, T.; Cheng, W.-F.; Lin, C.; Chen, P.-T. Computational Fluid Dynamics Approach forPerformance Prediction in a Zinc–Air Fuel Cell. Energies 2018, 11, 2185. [CrossRef]
6. Sangeetha, T.; Chen, P.-T.; Cheng, W.-F.; Yan, W.-M.; Huang, K.D. Optimization of the Electrolyte Parametersand Components in Zinc Particle Fuel Cells. Energies 2019, 12, 1090. [CrossRef]
7. Min, H.; Lai, C.; Yu, Y.; Zhu, T.; Zhang, C. Comparison Study of Two Semi-Active Hybrid Energy StorageSystems for Hybrid Electric Vehicle Applications and Their Experimental Validation. Energies 2017, 10, 279.[CrossRef]
8. Wellesley Toyota, How Your Toyota Hybrid Engine Works? Available online: http://blog.wellesleytoyota.com/blog/bid/328878/How-Your-Toyota-Hybrid-Engine-Works (accessed on 1 June 2018).
9. Xiao, R.; Liu, B.; Shen, J.; Guo, N.; Yan, W.; Chen, Z. Comparisons of Energy Management Methods for aParallel Plug-In Hybrid Electric Vehicle between the Convex Optimization and Dynamic Programming.Appl. Sci. 2018, 8, 218. [CrossRef]
10. Kim, H.; Wi, J.; Yoo, J.; Son, H.; Park, C.; Kim, H. A Study on the Fuel Economy Potential of Parallel andPower Split Type Hybrid Electric Vehicles. Energies 2018, 11, 2103. [CrossRef]
11. Lukic, S.; Emadi, A. Effects of Drivetrain Hybridization on Fuel Economy and Dynamic Performance ofParallel Hybrid Electric Vehicles. IEEE Trans. Veh. Technol. 2004, 53, 385–389. [CrossRef]
12. Lukic, S.; Cao, J.; Bansal, R.; Rodriguez, F.; Emadi, A. Energy Storage Systems for Automotive Applications.IEEE Trans. Ind. Electron. 2008, 55, 2258–2267. [CrossRef]
13. Miller, J.M. Propulsion System for Hybrid Vehicles, 2nd ed.; IET Digital Library: London, UK, 2011; pp. 62–81,ISBN 978-1-84919-147-0.
14. Zulkifli, S.A.; Saad, N.; Aziz, A.R.A.; Ghani, S.C.; Alias, A.; Mamat, R.; Rahman, M.M. Comparative Analysisof Torque and Acceleration of Pre- and Post-Transmission Parallel Hybrid Drivetrains. MATEC Web Conf.2016, 74, 1. [CrossRef]
15. Hoang, N.-T.; Yan, H.-S. Configuration Synthesis of Novel Series-Parallel Hybrid Transmission Systems withEight-Bar Mechanisms. Energies 2017, 10, 1044. [CrossRef]
Appl. Sci. 2019, 9, 1538 26 of 26
16. Bonfiglio, A.; Lanzarotto, D.; Marchesoni, M.; Passalacqua, M.; Procopio, R.; Repetto, M. Electrical-LossAnalysis of Power-Split Hybrid Electric Vehicles. Energies 2017, 10, 2142. [CrossRef]
17. Zhang, X.; Li, C.T.; Kum, D.; Peng, H. Prius+ and Volt−: Configuration Analysis of Power-Split HybridVehicles with a Single Planetary Gear. IEEE Trans. Veh. Technol. 2012, 61, 3544–3552. [CrossRef]
18. Fischer, R.; Küçükay, F.; Jürgens, G.; Najork, R.; Pollak, B. The Automotive Transmission Book, 2015th ed.;Springer: Cham, Switzerland, 2015; ISBN 978-3319052625.
19. Cossalter, V. Motorcycle Dynamics, 2nd ed.; LuLu Enterprises, Inc.: Morrisville, NC, USA, 2006;ISBN 978-1-4303-0861-4.
20. Naunheimer, H.; Bertsche, B.; Ryborz, J.; Novak, W. Automotive Transmissions, 2nd ed.; Springer: Cham,Switzerland, 2011; pp. 102–113, ISBN 978-3-642-16214-5.
21. Ehsani, M.; Gao, Y.; Emadi, A. Modern Electric, Hybrid Electric, and Fuel Cell Vehicles: Fundamentals, Theory,and Design, 2nd ed.; CRC Press: Boca Raton, FL, USA, 2009; pp. 112–120, ISBN 978-1420053982.
22. Lin, C.-C.; Peng, H.; Grizzle, J.W.; Kang, J.-M. Power management strategy for a parallel hybrid electric truck.IEEE Trans. Control Syst. Technol. 2003, 11, 839–849.
23. Matlab Simulink of ADVISOR® Software and Advanced Vehicle Simulator. Available online: https://sourceforge.net/projects/adv-vehicle-sim (accessed on 12 March 2019).
24. Simscape User’s Guide, R2018b ed.; The MathWorks Inc.: Natick, MA, USA, 2018.25. Simscape Driveline User’s Guide, R2018b ed.; The MathWorks Inc.: Natick, MA, USA, 2018.26. ECE15+ EUDC/NEDC. Emission Test Cycles. Available online: https://www.dieselnet.com/standards/cycles/
ece_eudc.php (accessed on 12 March 2019).
© 2019 by the authors. Licensee MDPI, Basel, Switzerland. This article is an open accessarticle distributed under the terms and conditions of the Creative Commons Attribution(CC BY) license (http://creativecommons.org/licenses/by/4.0/).