Embed Size (px)
Citation preview

Navy Personnel Research, Studies, and Technology Division Bureau of Naval Personnel (NPRST/PERS-1) Millington, TN 38055-1000 NPRST-TR-06-2 September 2006
Development of the Navy Computer Adaptive Personality Scales (NCAPS)
Edited by Janis S. Houston
Walter C. BormanPersonnel Decisions Research Institutes, Inc.
William F. Farmer, Ph.D.Ronald M. Bearden, M.S.
Navy Personnel Research, Studies, and Technology
Approved for public release; distribution is unlimited.


NPRST-TR-06-2 September 2006
Development of the Navy Computer Adaptive Personality Scales (NCAPS)
Edited by Janis S. Houston
Walter C. Borman Personnel Decisions Research Institutes, Inc. (PDRI)
William L. Farmer, Ph.D. Ronald M. Bearden, M.S.
Navy Personnel Research, Studies, and Technology (NPRST)
Reviewed and Approved by Jacqueline A. Mottern, Ph.D.
Institute for Selection and Classification
Released by David L. Alderton, Ph.D.
Director
Approved for public release; distribution is unlimited.
Navy Personnel Research, Studies, and Technology (NPRST/PERS-1) Bureau of Naval Personnel
5720 Integrity Drive Millington, TN 38055-1000
www.nprst.navy.mil


5(3257�'2&80(17$7,21�3$*( )RUP�$SSURYHG
20%�1R�����������
����5(3257�'$7(��''�00�<<<<� ����5(3257�7<3(�
����7,7/(�$1'�68%7,7/(
�D���&2175$&7�180%(5
����$87+25�6�
����3(5)250,1*�25*$1,=$7,21�1$0(�6��$1'�$''5(66�(6�
����6321625,1*�021,725,1*�$*(1&<�1$0(�6��$1'�$''5(66�(6�
���3(5)250,1*�25*$1,=$7,21
����5(3257�180%(5
����6321625�021,7256�$&521<0�6�
����6833/(0(17$5<�127(6
����',675,%87,21�$9$,/$%,/,7<�67$7(0(17
����$%675$&7
����68%-(&7�7(506
����180%(5
������2)�
������3$*(6
��D��1$0(�2)�5(63216,%/(�3(5621�
��D���5(3257
E��$%675$&7 F��7+,6�3$*(
����/,0,7$7,21�2)
������$%675$&7
6WDQGDUG�)RUP������5HY�������
3UHVFULEHG�E\�$16,�6WG��=�����
7KH�SXEOLF�UHSRUWLQJ�EXUGHQ�IRU�WKLV�FROOHFWLRQ�RI� LQIRUPDWLRQ�LV�HVWLPDWHG�WR�DYHUDJH���KRXU�SHU�UHVSRQVH�� LQFOXGLQJ�WKH�WLPH�IRU�UHYLHZLQJ�LQVWUXFWLRQV��VHDUFKLQJ�H[LVWLQJ�GDWD�VRXUFHV�
JDWKHULQJ�DQG�PDLQWDLQLQJ�WKH�GDWD�QHHGHG��DQG�FRPSOHWLQJ�DQG�UHYLHZLQJ�WKH�FROOHFWLRQ�RI�LQIRUPDWLRQ���6HQG�FRPPHQWV�UHJDUGLQJ�WKLV�EXUGHQ�HVWLPDWH�RU�DQ\�RWKHU�DVSHFW�RI�WKLV�FROOHFWLRQ
RI� LQIRUPDWLRQ�� LQFOXGLQJ� VXJJHVWLRQV� IRU� UHGXFLQJ� WKH� EXUGHQ�� WR� 'HSDUWPHQW� RI� 'HIHQVH�� :DVKLQJWRQ� +HDGTXDUWHUV� 6HUYLFHV�� 'LUHFWRUDWH� IRU� ,QIRUPDWLRQ� 2SHUDWLRQV� DQG� 5HSRUWV
������������������-HIIHUVRQ�'DYLV�+LJKZD\��6XLWH�������$UOLQJWRQ��9$���������������5HVSRQGHQWV�VKRXOG�EH�DZDUH�WKDW�QRWZLWKVWDQGLQJ�DQ\�RWKHU�SURYLVLRQ�RI�ODZ��QR�SHUVRQ�VKDOO�EH
VXEMHFW�WR�DQ\�SHQDOW\�IRU�IDLOLQJ�WR�FRPSO\�ZLWK�D�FROOHFWLRQ�RI�LQIRUPDWLRQ�LI�LW�GRHV�QRW�GLVSOD\�D�FXUUHQWO\�YDOLG�20%�FRQWURO�QXPEHU�
3/($6(�'2�127�5(7851�<285��)250�72�7+(�$%29(�$''5(66���
����'$7(6�&29(5('��)URP���7R�
�E���*5$17�180%(5
�F���352*5$0�(/(0(17�180%(5
�G���352-(&7�180%(5
�H���7$6.�180%(5
�I���:25.�81,7�180%(5
����6321625�021,7256�5(3257�
������180%(5�6�
����6(&85,7<�&/$66,),&$7,21�2)�
��E��7(/(3+21(�180%(5��,QFOXGH�DUHD�FRGH�


Foreword
This report documents the early steps in our development of the Navy Computer Adaptive Personality Scales (NCAPS). NCAPS is a computer adaptive personality measure being developed and validated for use in the selection and classification of Sailors for entry level Navy enlisted jobs. This is an important component of our research program to overhaul and improve the Navy’s enlisted selection and classification process. The over program—Whole Person Assessment—is designed to replace the current classification algorithm with a more flexible and accurate one that will also allow us to de-emphasize the almost exclusive focus on mental ability by including personality and interest measures in making classification decisions. Collectively, these efforts would transform and modernize enlisted classification by making it applicant-centric while improving job satisfaction and performance, reducing attrition, and increasing continuation behavior.
NCAPS uses a cutting-edge technological approach to personality measurement which is designed to mitigate many problems that plague traditional instruments. Specifically, traditional instruments use straight-forward Likert rating scales, generally contain sets of homogeneous items, and therefore are subject to both directed faking and socially desirable responding. To minimize these problems, NCAPS is developing a paired forced-choice item format, uses a complex item response theory (IRT) adaptive selection and scoring algorithm, and intersperses item content. The complexity and novelty of the design constraints requires a series of interrelated research projects. This report covers how the personality constructs were selected, items were developed and scaled, and the results from an initial test of the validity of NCAPS.
The research was sponsored by the Office of Navy Research (Code 34) and funded under PE 0602236N and PE 0603236N.
David L. Alderton, Ph.D. Director
v


Executive Summary
To begin a Navy enlisted career today, an applicant must take the Armed Forces Vocational Aptitude Battery (ASVAB). By combining scores across individual ASVAB tests, a new recruit is qualified for service, assigned to a school, and enlisted into an entire Navy career. The research described in this technical report is part of a broader research program in which the Navy is investigating the usefulness of adding measures of non-cognitive attributes to supplement the ASVAB. This would result in a more multidimensional, "whole person" assessment process for use in selecting and placing Navy recruits.
This report describes the development and validation of an instrument entitled Navy Computer Adaptive Personality Scales (NCAPS). NCAPS uses a computerized adaptive testing approach in which successive pairs of items representing two different levels of a trait are presented to examinees. Examinees choose which item is more self-descriptive. Responding to the first item-pair sets an initial estimated trait score, and the computer algorithm selects successive pairs of items so that the amount of trait information obtained from the next response is maximized as defined by item response theory (IRT). Item-pairs are generated iteratively, with as many pairs presented for a trait as are needed to arrive at a stable trait score for the examinee, up to a maximum of 15 pairs.
We began this research by formulating a 19-dimension taxonomy of personality traits that integrated prominent personality taxonomies and instruments. We then obtained expert ratings of the relevance of each trait for performing effectively in each of the 79 Navy enlisted ratings, as well as in the Navy in general. Twenty-five PDRI and U.S. Navy psychologists from the Navy Personnel Research, Studies, and Technology (NPRST) Department of the Bureau of Naval Personnel performed this rating task. Data were pooled across the experts, and 10 traits were selected based on the results: Adaptability/Flexibility, Attention to Detail, Achievement, Dependability, Dutifulness, Social Orientation, Self-Reliance, Stress Tolerance, Vigilance, and Willingness to Learn. In general, traits were selected that had the greatest relevance for the greatest number of enlisted ratings, though one trait, Vigilance, was selected purely for its classification potential; that is, it did not have a high mean across all enlisted ratings, but was found to be highly relevant for nine ratings.
Three of these traits—Achievement, Social Orientation, and Stress Tolerance—had already been pilot tested in a previous project. Building on this previous work, a team of PDRI item-writers generated items reflecting all possible levels on each of the 10 NCAPS traits. All items were carefully reviewed, and then scaled in terms of trait level by at least 20 personality research experts from PDRI and NPRST. In all, three rounds of item writing and review were completed to help ensure high-quality measurement of each of the 10 traits. The final NCAPS item pool consists of 1,494 items: from 106 to 199 items per trait.
vii

A sample of 305 first-term Navy enlisted personnel was administered both this final version of NCAPS (Adaptive NCAPS) and a 205-item, computerized, traditionally-formatted (5-point Likert scale) personality inventory measuring the same 10 personality traits (Traditional NCAPS). After testing, most of the examinees served as peer raters of their fellow examinees’ work performance. Raters rated from one to five peers on nine behavior-based rating scales (e.g., Cooperating/Working Well with Others, Initiative, and Self-Development), resulting in at least one peer rating for 249 examinees. Subsequent to this data collection, we obtained supervisor ratings for 135 examinees.
The validation results we obtained using the peer ratings as criteria were so counter to our expectations, based on our own past experience and that of others, that we question the accuracy of these peer ratings and thus the accuracy of those findings. Using the supervisory ratings as criteria produced results that were more in line with our and others’ expectations. Thus, we are inclined to place more credence in these findings. We present both sets of results in this report, along with an explanation of our hesitancy to accept the findings based on peer ratings.
Results showed that both Adaptive and Traditional NCAPS were reliable, and that Adaptive NCAPS was more reliable than Traditional NCAPS. Also, importantly, Adaptive and Traditional NCAPS measures of the same traits correlated quite highly, which further supports the viability of the Adaptive NCAPS approach to personality assessment. It should also be noted that the intercorrelations between personality scales for Adaptive NCAPS were more in line with what the personality literature suggests should be found than were the intercorrelations between Traditional NCAPS scales. This is consistent with the notion that Adaptive NCAPS is providing more accurate personality assessment than Traditional NCAPS.
Because both Traditional and Adaptive NCAPS were administered by computer, we were able to accurately capture the amount of time that examinees took to complete each test. For Adaptive NCAPS, the mean was 23.3 minutes; for Traditional NCAPS, the mean was 26.3 minutes.
Using peer ratings as criterion measures, the correlations between Adaptive NCAPS scales and Overall Performance (a composite of the performance ratings on the 9 behavior-based rating scales) ranged from .04 for Self-Reliance to .35 for Achievement, when corrected for criterion unreliability. In addition to Achievement, Attention to Detail, Dependability, Stress Tolerance, and Vigilance, all correlated above .20 with peer-rated Overall Performance. For Traditional NCAPS scales, corrected correlations against peer-rated Overall Performance ranged from .22 for Adaptability/Flexibility to .41 for Dependability, and all 10 Traditional NCAPS scales correlated above .20 with Overall Performance. A summary of the relationship between NCAPS and Overall Performance was obtained by correlating a composite of the 10 NCAPS scales with the composite Overall Performance rating. When corrected for criterion unreliability, this summary correlation was .32 for Adaptive NCAPS and .39 for Traditional NCAPS.
viii

The finding that Traditional NCAPS had higher validity levels than Adaptive NCAPS against peer-rated performance was unexpected. The greater reliability of Adaptive NCAPS, the smaller scale intercorrelations associated with Adaptive NCAPS, the successful use of methodology similar to Adaptive NCAPS within the performance rating domain, and a compelling argument made by Borman and colleagues in previous work all suggest that Adaptive NCAPS should provide more precise measurement than Traditional NCAPS and should out-predict Traditional NCAPS.
Various possible reasons for these unexpected results are described in the report. The most straightforward explanation is that peers were not providing sufficiently accurate ratings of the examinees’ work performance. We considered it likely that supervisor ratings would be more accurate than the peer ratings. Anecdotally, we were told that the supervisors were often in a position to observe more of the examinees’ work behavior than were the peers. In addition, the supervisors were far more accustomed to rating others’ work performance and were actually involved in development of the criterion rating scales used in this research. As such, they were using dimensions and rating scales with which they were more familiar, and to which they were therefore more highly calibrated. Finally, our experience, accumulated over many years, strongly suggests that supervisors provide performance ratings that are superior to those provided by other rating sources, including peers.
Using the supervisor ratings as criterion measures, the corrected correlations between Adaptive NCAPS scales and Overall Performance ranged from .07 for Self-Reliance to .48 for Achievement (median corrected validity across the 10 scales = .24). By contrast, for Traditional NCAPS scales, corrected correlations against supervisor-rated Overall Performance ranged from .03 for Social Orientation to .40 for Willingness to Learn (median corrected validity across the 10 scales = .14). A summary of the relationship between NCAPS and supervisor-rated Overall Performance was obtained by correlating a composite of the 10 NCAPS scales against the composite supervisor-based Overall Performance rating. When corrected for criterion unreliability, this summary correlation was .37 for Adaptive NCAPS and .18 for Traditional NCAPS. The validity results against supervisor-rated performance criteria were therefore quite different from the validity results associated with peer-rated performance criteria, and indicated that Adaptive NCAPS had considerably higher validities than Traditional NCAPS.
In summary, the authors of this report believe the evidence strongly supports the viability of the Adaptive NCAPS approach to personality assessment. Adaptive NCAPS yielded more precise trait estimates and out-predicted Traditional NCAPS against supervisor-rated performance ratings for Navy enlisted personnel. It was also completed in less time than Traditional NCAPS. Therefore, notwithstanding the peer rating results, this research has demonstrated the promise of the innovative Adaptive NCAPS technology for substantially improving the prediction of success in Navy careers.
ix


Contents
Chapter 1. Introduction (Janis Houston and Walter Borman, PDRI) ........... 1-1 Background ...................................................................................................................1-1 Organization of Report ................................................................................................ 1-2 Chapter 1 References ................................................................................................... 1-3
Chapter 2. Identification and Literature-Based Evaluation of Potential NCAPS Constructs (Rob Schneider and Shonna Waters, PDRI)................ 2-1 Formulation of Initial NCAPS Taxonomy ...................................................................2-2 Literature-Based Evaluation of Initial NCAPS Constructs Against NCAPS Inclusion
Criteria.....................................................................................................................2-4 Achievement.................................................................................................................2-7
Unidimensionality/Stability....................................................................................2-7 Criterion-Related Validity .......................................................................................2-8 Construct Validity....................................................................................................2-9 Usefulness for Classification .................................................................................2-10 Summary ...............................................................................................................2-10
Energy Level...............................................................................................................2-10 Unidimensionality/Stability..................................................................................2-10 Criterion-Related Validity .....................................................................................2-10 Construct Validity...................................................................................................2-11 Usefulness for Classification ..................................................................................2-11 Summary ............................................................................................................... 2-12
Positive Self-Concept ................................................................................................. 2-12 Unidimensionality/Stability.................................................................................. 2-12 Criterion-Related Validity ..................................................................................... 2-13 Construct Validity.................................................................................................. 2-14 Usefulness for Classification ................................................................................. 2-14 Summary ............................................................................................................... 2-14
Leadership Orientation.............................................................................................. 2-15 Unidimensionality/Stability.................................................................................. 2-15 Criterion-Related Validity ..................................................................................... 2-15 Construct Validity.................................................................................................. 2-16 Usefulness for Classification ................................................................................. 2-16 Summary ............................................................................................................... 2-17
Social Orientation ...................................................................................................... 2-17 Unidimensionality/Stability.................................................................................. 2-17
xi

Criterion-Related Validity .....................................................................................2-18 Construct Validity.................................................................................................. 2-19 Usefulness for Classification ................................................................................. 2-19 Summary .............................................................................................................. 2-20
Compassion............................................................................................................... 2-20 Unidimensionality/Stability................................................................................. 2-20 Criterion-Related Validity ..................................................................................... 2-21 Construct Validity.................................................................................................. 2-21 Usefulness for Classification ................................................................................. 2-21 Summary ...............................................................................................................2-22
Social Astuteness .......................................................................................................2-22 Unidimensionality/Stability..................................................................................2-22 Criterion-Related Validity .....................................................................................2-22 Construct Validity..................................................................................................2-23 Usefulness for Classification .................................................................................2-23 Summary ...............................................................................................................2-24
Adaptability/Flexibility..............................................................................................2-24 Unidimensionality/Stability..................................................................................2-24 Criterion-Related Validity .....................................................................................2-24 Construct Validity..................................................................................................2-25 Usefulness for Classification .................................................................................2-25 Summary ...............................................................................................................2-26
Impulsivity/Self-control ............................................................................................2-26 Unidimensionality/Stability..................................................................................2-26 Criterion-Related Validity .....................................................................................2-27 Construct Validity................................................................................................. 2-28 Usefulness for Classification ................................................................................ 2-28 Summary .............................................................................................................. 2-28
Adventurous/Courageous..........................................................................................2-29 Unidimensionality/Stability..................................................................................2-29 Criterion-Related Validity .....................................................................................2-29 Construct Validity................................................................................................. 2-30 Usefulness for Classification ................................................................................. 2-31 Summary ............................................................................................................... 2-31
Dependability.............................................................................................................2-32 Unidimensionality/Stability..................................................................................2-32 Criterion-Related Validity .....................................................................................2-32 Construct Validity..................................................................................................2-33 Usefulness for Classification .................................................................................2-33
xii

Summary ...............................................................................................................2-34 Dutifulness/Integrity .................................................................................................2-34
Unidimensionality/Stability..................................................................................2-34 Criterion-Related Validity .....................................................................................2-35 Construct Validity..................................................................................................2-35 Usefulness for Classification .................................................................................2-36 Summary ...............................................................................................................2-36
Attention to Detail .....................................................................................................2-37 Unidimensionality/Stability..................................................................................2-37 Criterion-Related Validity .....................................................................................2-37 Construct Validity................................................................................................. 2-38 Usefulness for Classification ................................................................................ 2-38 Summary ...............................................................................................................2-39
Stress Tolerance.........................................................................................................2-39 Unidimensionality/Stability..................................................................................2-39 Criterion-Related Validity .................................................................................... 2-40 Construct Validity.................................................................................................. 2-41 Usefulness for Classification ................................................................................. 2-41 Summary ...............................................................................................................2-42
Innovation..................................................................................................................2-42 Unidimensionality/Stability..................................................................................2-42 Criterion-Related Validity .....................................................................................2-43 Construct Validity..................................................................................................2-43 Usefulness for Classification .................................................................................2-43 Summary ...............................................................................................................2-44
Perceptiveness/Depth of Thought.............................................................................2-44 Unidimensionality/Stability..................................................................................2-44 Criterion-Related Validity .....................................................................................2-44 Construct Validity..................................................................................................2-45 Usefulness for Classification .................................................................................2-46 Summary ...............................................................................................................2-46
Willingness to Learn ..................................................................................................2-46 Unidimensionality/Stability..................................................................................2-46 Criterion-Related Validity .....................................................................................2-47 Construct Validity..................................................................................................2-47 Usefulness for Classification ................................................................................ 2-48 Summary .............................................................................................................. 2-48
Self-Reliance ............................................................................................................. 2-48 Unidimensionality/Stability................................................................................. 2-48
xiii
Criterion-Related Validity .....................................................................................2-49 Construct Validity..................................................................................................2-49 Usefulness for Classification ................................................................................ 2-50 Summary ............................................................................................................... 2-51
Vigilance..................................................................................................................... 2-51 Unidimensionality/Stability.................................................................................. 2-51 Criterion-Related Validity ..................................................................................... 2-51 Construct Validity.................................................................................................. 2-51 Usefulness for Classification .................................................................................2-52 Summary ...............................................................................................................2-52
Summary....................................................................................................................2-52 Chapter 2. References................................................................................................2-54
Chapter 3. Selecting the Final Set of NCAPS Constructs (Janis Houston and Michael Cullen, PDRI) ........................................................................ 3-1 Ratings of Importance/Relevance for Performance in Navy Jobs ............................. 3-1 Additional “Overall” Ratings .......................................................................................3-2 Final Selection of Constructs for NCAPS ....................................................................3-4
Chapter 4. Developing and Scaling NCAPS Items (Kerri Ferstl and Janis Houston, PDRI)......................................................................................... 4-1 Facet Identification...................................................................................................... 4-1 Item Writing.................................................................................................................4-2
Background and Instructions for Item Writers ......................................................4-2 Item Development in Three Rounds.......................................................................4-4 Determining Target Numbers of Items...................................................................4-4
Item Review Based on Content....................................................................................4-5 Trait Level Scaling .......................................................................................................4-6
SME Rating Task .....................................................................................................4-6 Rater Screening .......................................................................................................4-7 Item Review Based on Trait Level Ratings ............................................................ 4-8 Final NCAPS Item Bank ......................................................................................... 4-8
Assessing Trait Level Coverage....................................................................................4-9 Developing a Traditionally-formatted version of NCAPS Items ...............................4-11 Chapter 4. References................................................................................................ 4-12
Chapter 5. Initial Validation of NCAPS (Rob Schneider, Walter Borman and Janis Houston, PDRI)......................................................................... 5-1 Overview ...................................................................................................................... 5-1 Analysis of Examinee Data .......................................................................................... 5-1
Description of Examinee Sample ............................................................................ 5-1
xiv

Data Screening Analyses .........................................................................................5-3 Traditional NCAPS Screening. ................................................................................5-4 Adaptive NCAPS Screening.....................................................................................5-5 Scoring Traditional NCAPS Responses...................................................................5-6
Descriptive Statistics, Reliability Analyses, and Intercorrelations............................. 5-7 Traditional NCAPS Scales ....................................................................................... 5-7 Traditional NCAPS Facets.......................................................................................5-8 Traditional NCAPS Items........................................................................................5-9 Adaptive NCAPS Scales ...........................................................................................5-9
Relationship Between EAP (Adaptive NCAPS Trait Level) and Test Information/ Conditional Standard Error of Measurement....................................................... 5-13 NCAPS Scale Intercorrelations ............................................................................. 5-13
Analysis of Performance Rating Data........................................................................ 5-14 Data Screening....................................................................................................... 5-16 Multiple Ratings Screen ........................................................................................ 5-16 Insufficient Acquaintanceship Screen .................................................................. 5-16 Hostility to the Rating Process.............................................................................. 5-16 Missing Data.......................................................................................................... 5-17 Non-Variability...................................................................................................... 5-17 Interrater Reliability and Agreement.................................................................... 5-17 Descriptive Statistics and Intercorrelations ......................................................... 5-18 Reliability of Performance Dimension Ratings .................................................... 5-18 Factor Analysis of Performance Dimension Ratings............................................ 5-18 Generalizability Study to Determine Reliability of Unit-Weighted Overall
Performance Composite .................................................................................. 5-20 Validity Analyses........................................................................................................5-22
Uncorrected Zero-Order Correlations Between NCAPS Scales and Peer-Rated Performance Dimensions .................................................................................5-22
Facet-Level Validities ............................................................................................5-25 Corrected Zero-Order Correlations Between NCAPS Scales/Facets and
Peer-Rated Work Performance.........................................................................5-26 Overlap Between Predictor Space and Criterion Space........................................5-32
Comparative Validity Analysis of Adaptive and Traditional NCAPS for Differing Numbers of Items/Item-Pairs ...............................................................5-33
Investigation of Possible Reasons for Higher Validities of Traditional NCAPS.......5-44 Relationship Between Item Validities and Frequency of Presentation................5-44 Departure from Unidimensionality ......................................................................5-46 Possible Ways to More Fully Realize the Potential Advantages of Adaptive
NCAPS Based on this Discussion .....................................................................5-47
xv

Follow-on Research Directed Toward Fuller Realization of Adaptive NCAPS’ Potential ............................................................................................................5-49
Gender and Race/Ethnicity Subgroup Difference Comparisons..............................5-49 Response Latency Analyses .......................................................................................5-50
Supplemental Screening of Response Latency Data ............................................5-50 Comparison of Adaptive and Traditional NCAPS Latencies ................................ 5-51
Frequency of Adaptive NCAPS Item-Pair Presentation............................................5-54 Incorporation of Supervisor Rating Data .............................................................5-55 Analysis of Supervisor Performance Rating Data................................................. 5-57 Data Screening....................................................................................................... 5-57 Reliability of Performance Dimension Ratings ....................................................5-58 Descriptive Statistics and Intercorrelations .........................................................5-58 Factor Analysis of Performance Dimension Ratings............................................5-58
Validity Analyses....................................................................................................... 5-60 Uncorrected Zero-Order Correlations between NCAPS Scales and Supervisor-
Rated Performance Dimensions...................................................................... 5-60 Corrected Zero-Order Correlations between NCAPS Scales and Supervisor-
Rated Performance ...........................................................................................5-63 Overlap between Predictor Space and Criterion Space Based on Supervisor
Ratings ..............................................................................................................5-64 Summary ...............................................................................................................5-64
Chapter 5 References .................................................................................................5-66
Appendix A: Expert Judgment Rating Forms................................................A-0
Appendix B: Means and SDs of Ratings of Importance for 19 Constructs for 79 Navy Jobs .....................................................................B-0
Appendix C: Background and Instructions for NCAPS Item Writers ............C-0
Appendix D: NCAPS Personality Taxonomy: Similarities Across Facets (Item Reviewer’s Tool).............................................................................D-0
Appendix E: Screening of Expert Rater Data for Round 1 Trait Level Ratings ............................................................................................ E-0
Appendix F: Screening of Expert Rater Data for Round 2 Trait Level Ratings ............................................................................................ F-0
Appendix G: Screening of Expert Rater Data for Round 3 Trait Level Ratings ............................................................................................G-0
Appendix H: Histograms of Trait Levels for Traditional NCAPS Scales.........H-0
Appendix I: Traditional NCAPS Item-Level Descriptive Statistics ................ I-0
Appendix J: Histograms of Trait Levels for Adaptive NCAPS Scales ............. J-0
xvi

Appendix K: Scatterplots Showing Relationship Between Trait Level and Test Information for Adaptive NCAPS................................................K-0
Appendix L: Scatterplots Showing Relationship Between Trait Level and Posterior Standard Deviation (PSD) for Adaptive NCAPS .................. L-0
Appendix M: Interrater Reliability and Agreement Statistics for Examinees Rated by at Least Two Raters................................................ M-0
Appendix N: Corrected Zero-Order Correlations Between Traditional-Format NCAPS Facets and Peer Ratings on Work Performance Dimensions..........................................................................N-0
Appendix O: Gender and Race/Ethnicity Differences on NCAPS Scales .......O-0
Appendix P: Adaptive NCAPS Mean and Cumulative Response Latencies by Scale and Number of Item-Pairs Presented Using Original and Revised Screening Rules ......................................................P-0
Appendix Q: Item-Level Response Latencies for Traditional NCAPS............Q-0
List of Tables
2-1 Instruments/taxonomies integrated to formulate initial NCAPS taxonomy............ 2-3 2-2 Initial NCAPS personality taxonomy ................................................................. 2-5 3-1 Mean and SDs for 19 constructs across 79 Navy jobs (N=25 raters) ................... 3-2 3-2 Means and SDs for overall ratings (N=18)........................................................ 3-3 3-3 Summary of construct ratings ......................................................................... 3-4 3-4 NCAPS personality taxonomy .......................................................................... 3-5 4-1 NCAPS facets used in item development .......................................................... 4-3 4-2 Sample NCAPS items targeting various levels of dependability ........................... 4-4 4-3 Count of draft items written in Phase 2, by round and construct ........................ 4-5 4-4 SMEs and interrater reliability, Trait Level scaling.............................................. 4-7 4-5 Final NCAPS Item Bank: Item counts by trait level and construct ....................... 4-9 4-6 Final NCAPS Item Bank: Item counts by trait level and facet............................ 4-10 4-7 Number of items by construct in traditionally-formatted inventory.................... 4-11 5-1 Background characteristics of examinee sample ............................................... 5-1 5-2 Frequency distribution for examinees’ Naval enlisted ratings.............................. 5-2 5-2 Frequency distribution for examinees’ Naval enlisted ratings.............................. 5-3 5-3 Score values assigned to Traditional NCAPS Items, by trait level and response.... 5-6 5-4 Descriptive statistics and internal consistency reliabilities for Traditional NCAPS .. 5-8 5-5 Descriptive statistics and internal consistency reliabilities of Traditional
NCAPS facets ................................................................................................. 5-9 5-6 Descriptive statistics for Adaptive NCAPS scales.............................................. 5-11
xvii

5-7 Reliability of Adaptive NCAPS by scale at various points along the posterior standard deviation (PSD) distribution ............................................................. 5-13
5-8 Intercorrelations between traditional NCAPS scales, between Adaptive NCAPS scales, and between Traditional and Adaptive NCAPS scales ........................... 5-15
5-9 NCAPS Performance rating dimensions: means, standard deviations, interrater reliabilities, and intercorrelations.................................................................... 5-19
5-10 Parallel analysis results for principal axis factor analysis of criterion rating data ............................................................................................................ 5-20
5-11 Variance components and G-Coefficients for unit-weighted overall performance composite.................................................................................................... 5-22
5-12 Uncorrected zero-order correlations between Traditional and Adaptive NCAPS scales and peer ratings on work performance dimensions ................................ 5-23
5-13 Uncorrected zero-order correlations between Traditional and Adaptive NCAPS scales and peer ratings of overall performance and potential ........................... 5-25
5-14 Uncorrected zero-order correlations between Traditional NCAPS facets and peer ratings of work performance .................................................................. 5-27
5-15 Corrected zero-order correlations between Traditional and Adaptive NCAPS scales and peer ratings on work performance dimensions ................................ 5-30
5-16 Corrected zero-order correlations between Traditional and Adaptive NCAPS scales and measures of peer-rated unit-weighted overall performance composite and global overall potential rating .................................................................. 5-31
5-17 Criterion-related validity statistics associated with Adaptive NCAPS statements differing in frequency of presentation to examinees......................................... 5-45
5-18 Evaluation of hypothesis that greater scale multidimensionality is associated with greater differences between Traditional and Adaptive NCAPS validities ...... 5-48
5-19 Gender and race effect size comparisons for Traditional and Adaptive NCAPS scales ............................................................................................... 5-50
5-20 Comparison of response latencies for Adaptive and Traditional NCAPS scales and items by scale........................................................................................ 5-53
5-21 Frequency with which Adaptive NCAPS statements were presented to examinees ................................................................................................... 5-56
5-22 NCAPS supervisor performance rating dimensions: Means, Standard Deviations, Interrater Reliabilities, and Intercorrelations .................................. 5-59
5-23 Parallel analysis results for principal axis factor analysis of supervisor rating data................................................................................................... 5-60
5-24 Uncorrected zero-order correlations between Traditional and Adaptive NCAPS scales and supervisor ratings on work performance dimensions........................ 5-62
5-25 Uncorrected and corrected zero-order correlations between Traditional and Adaptive NCAPS scales and supervisor ratings of overall performance............... 5-63
xviii

List of Figures
4-1. Trait Level rating task: instructions................................................................. 4-6 5-1. Validities associated with different numbers of items/item-pairs
(adaptability/flexibility). ................................................................................ 5-35 5-2. Validities associated with different numbers of items/item-pairs (attention to
detail). ........................................................................................................ 5-36 5-3. Validities associated with different numbers of items/item-pairs
(achievement).............................................................................................. 5-37 5-4. Validities associated with different numbers of items/item-pairs
(dependability)............................................................................................. 5-38 5-5. Validities associated with different numbers of items/item-pairs (dutifulness)... 5-39 5-6. Validities associated with different numbers of items/item-pairs
(social orientation). ...................................................................................... 5-40 5-7. Validities associated with different numbers of items/item-pairs (self-reliance). 5-41 5-8. Validities associated with different numbers of items/item-pairs (vigilance). ..... 5-42 5-9. Validities associated with different numbers of items/item-pairs (willingness
to learn). ..................................................................................................... 5-43
xix

Chapter 1. Introduction (Janis Houston and Walter Borman, PDRI)
Background
To start a Navy enlisted career today, individuals take the Armed Services Vocational Aptitude Battery (ASVAB), which measures basic cognitive ability. New recruits are assigned to training and to career paths based largely on ASVAB scores and the immediate needs of the Navy. Cognitive ability is a very good predictor of the cognitive component of jobs, especially successful training completion. After training, however, other factors play a more important role in determining how well individuals will perform their jobs. Individuals possess a variety of preferences, interests, and personal characteristics that would be useful for identifying who will be best suited for military missions of the future.
In response to the realization that cognitive ability alone is not an adequate predictor of all of the outcomes important to the modern Navy, an effort was initiated to add one or more measures of other characteristics to the ASVAB for selection and classification purposes. Specifically, we developed Enlisted Computer Adaptive Personality Scales (NCAPS). The decision to develop a personality inventory as a potential complement to the ASVAB in Navy selection and classification followed from work presented in two previous reports, referred to as the Roadmap Report (Borman, Hedge, Ferstl, Kaufman, Farmer, & Bearden, 2003) and the Following the Roadmap Report (Ferstl, Schneider, Hedge, Houston, Borman, & Farmer, 2003). Both of these reports were joint efforts of Personnel Decisions Research Institutes (PDRI) and Navy Personnel Research, Studies, and Technology (NPRST), Navy Personnel Command.
The Roadmap Report (Borman et al., 2003) reviews recent research on job performance criteria and a wide variety of predictors of job performance, as well as person-organization fit models. Borman and his colleagues highlight the importance of using a whole-person approach when making selection and classification decisions for the Navy.
In the Following the Roadmap Report, Ferstl and her colleagues (2003) discuss their rationale for the decision to develop a personality test, rather than some other type of measure (e.g., interest inventory, situational judgment test, biodata inventory, specific cognitive ability tests). This report also describes the computer based, adaptive format selected for NCAPS. Finally, the report describes the selection of the first three constructs for which scales were developed: achievement, social orientation, and stress tolerance.
1-1

Phase 1 of the development of NCAPS was documented in a report entitled NCAPS: Development of the Enlisted Computer Adaptive Personality Scales for the United States Navy by Houston, Schneider, Ferstl, Borman, Hedge, Farmer, and Bearden (2003). This report describes the development and pilot testing of the first three NCAPS scales. The results of this effort provided sufficient justification for pursuing a full version of the NCAPS model, or Phase 2 of NCAPS.
Organization of Report
This report describes Phase 2 of the development of NCAPS, designed to measure non-cognitive attributes for the purpose of selecting and classifying recruits into enlisted jobs in the United States Navy. As mentioned above, in Phase 1, we developed, scaled, and pilot tested three scales for NCAPS. These were: Achievement, Stress Tolerance, and Social Orientation.
From the outset of the NCAPS development effort, we planned to add more constructs in a second phase of development. Phase 2 was to begin after the pilot test of the Phase 1 scales was completed. The present report describes Phase 2 of NCAPS development, including the selection of the full set of constructs to be measured by NCAPS, the item writing and item scaling procedures used to develop scales for those constructs, and the initial validation data collections and results.
This report is organized into chapters. This introductory chapter is followed by a chapter describing the identification and evaluation of potential constructs to be included in the full version of NCAPS (Chapter 2). Chapter 3 outlines the procedure used to finalize the selection of constructs, using expert judgment ratings, and Chapter 4 details the development of items/scales to measure those constructs. Chapter 5 describes our initial efforts to validate NCAPS.
1-2

Chapter 1 References
Borman, W. C., Hedge, J. W., Ferstl, K., & Kaufman, J. D. (2002). A roadmap for the future of Navy selection/classification (Institute Report #413). Tampa, FL: Personnel Decisions Research Institutes, Inc.
Ferstl, K. L., Schneider, R. J., Hedge, J. W., Houston, J. S., Borman, W. C., & Farmer, W. L. (2003). Following the roadmap: Evaluating potential predictors for Navy selection and classification (Institute Report #421). Minneapolis, MN: Personnel Decisions Research Institutes, Inc.
Houston, J. S., Schneider, R. J., Ferstl, K. L., Borman, W. C., Hedge, J. W., Farmer, W. L., & Bearden, R. M. (2003). NCAPS: Development of the Enlisted Computer Adaptive Personality Scales for the United States Navy (Institute Report #449). Minneapolis: Personnel Decisions Research Institutes, Inc.
1-3


Chapter 2. Identification and Literature-Based Evaluation of Potential NCAPS Constructs
(Rob Schneider and Shonna Waters, PDRI)
In this chapter, we describe the methodology used to identify constructs to be measured by the Navy’s Enlisted Computer Adaptive Personality Scales (NCAPS) and review literature to evaluate those constructs against inclusion criteria previously specified for the NCAPS personality taxonomy by Ferstl, Schneider, Hedge, Houston, Borman, and Farmer (2003). NCAPS are designed to provide both precise and efficient measurement of non-cognitive attributes for selecting and classifying naval recruits into enlisted positions.
The inclusion criteria specified by Ferstl et al. (2003), along with the rationale behind those criteria, are as follows:
1. Unidimensionality. Because NCAPS are scored using an item response theory (IRT) measurement model, constructs that they measure must be approximately unidimensional.
2. Temporal stability. NCAPS will be used to select and classify naval enlisted personnel into ratings they will occupy over significant periods of time. As such, it is important that they measure stable personality traits.
3. Appropriate level of specificity. Personality traits vary in their breadth. Some traits, such as those represented in the five-factor model of personality (FFM), are quite broad, whereas other personality traits, such as those represented in more specific taxonomies, are narrower. We sought to strike a balance, whereby NCAPS traits would be broad enough to provide efficient measurement, but narrow enough not to (a) obscure meaningful distinctions, or (b) preclude measurement of specific variance that would increment the validity associated with the common variance measured by the broader trait.
4. Criterion-related validity: Prediction of important job performance criteria. Since NCAPS are designed for selecting and classifying naval enlisted personnel into Navy ratings, there must be a rational or empirical basis for believing that constructs included in the NCAPS taxonomy will be predictive of one or more important job performance dimensions in at least some Navy ratings. Moreover, traits in the NCAPS taxonomy must, collectively, account for most of the non-cognitive variance on job performance dimensions across all Navy enlisted ratings.
2-1

5. Well understood and history of successful measurement (construct validity).1 Most constructs in the NCAPS taxonomy should be well represented in major personality taxonomies and/or instruments and have at least some history of successful measurement. Moreover, there should be evidence that speaks to the basic nature of the constructs through patterns of correlations with other variables, and/or a consensus of experts. Ideally, this will be shown through accumulated construct validity evidence and/or definitional overlap. It should be noted, however, that Ferstl et al. (2003) did allow for inclusion of some experimental constructs in the NCAPS taxonomy, if a strong rational basis could be made for the potential usefulness of those constructs.
Finally, at least some of the constructs in the NCAPS taxonomy must be useful for classification purposes. That is, there must be a rational or empirical basis for believing that measures of such constructs will show differential validity across naval enlisted ratings. The value of predictors used for classification purposes lies in their ability to predict performance dimensions relevant for some Navy jobs, but not for others.
Formulation of Initial NCAPS Taxonomy
To formulate an initial NCAPS taxonomy, we began by identifying several prominent personality taxonomies/instruments. To address the level of specificity issue (inclusion criterion 3), we utilized taxonomies/instruments that most would regard as “middle-level.” While we are aware of no precise definition of “middle-level” in this context, such taxonomies should certainly be more specific than the Big-Five personality dimensions. Neither, however, should they contain too large a number of dimensions. The latter requirement was driven in part by practical necessity: In order to populate NCAPS scales with a sufficient number of items, a trait needed to have a certain level of breadth. We also reviewed some taxonomies that might be considered beyond middle-level if it appeared that they contained traits that were sufficiently broad to justify inclusion, as well as likely to be useful for inclusion in NCAPS. The taxonomies/instruments that formed the basis for our initial NCAPS taxonomy are listed in Table 2.1.
1 “History of successful measurement” really encompasses several of the Ferstl et al. (2003) inclusion criteria. As such, it is implicitly addressed throughout each construct’s evaluation. It should be noted that the method used to formulate the initial NCAPS taxonomy largely guaranteed that each construct would be represented in major personality taxonomies and/or instruments and have been successfully measured, at least to some degree, in the past. This section is therefore largely confirmatory, and really becomes an exploration of the extant construct validity data for measures of each proposed construct.
2-2
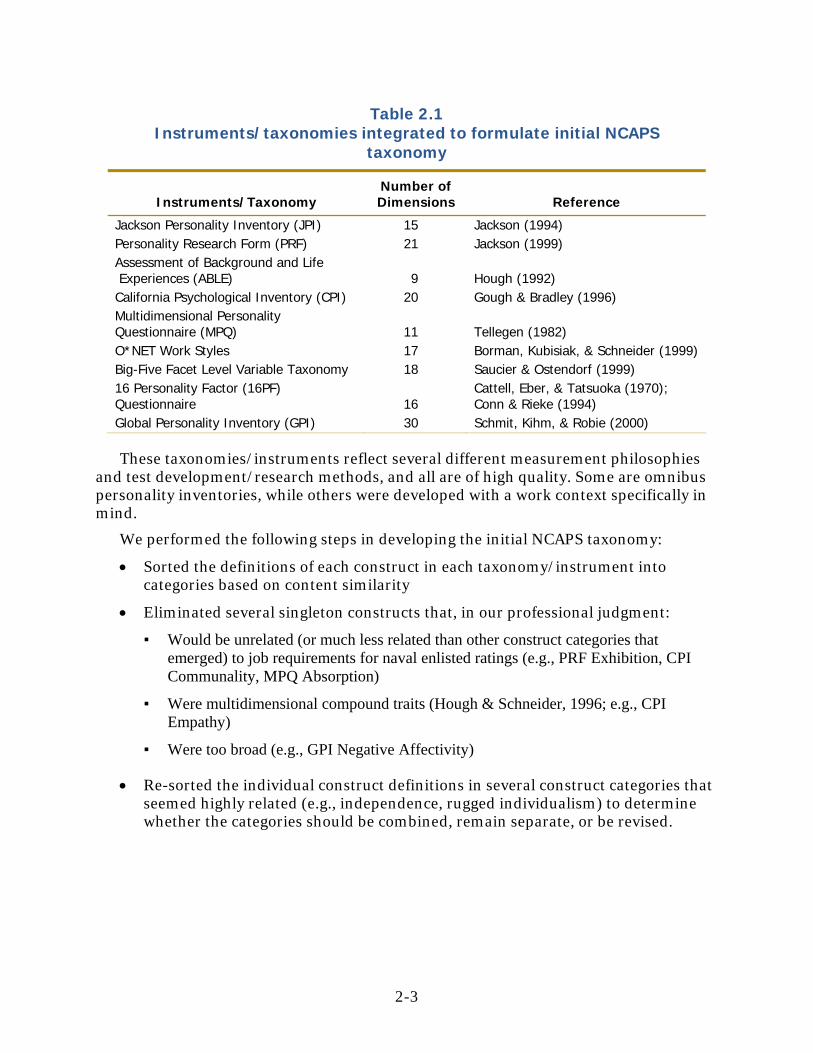
Table 2.1 Instruments/taxonomies integrated to formulate initial NCAPS
taxonomy
Instruments/Taxonomy Number of Dimensions Reference
Jackson Personality Inventory (JPI) 15 Jackson (1994) Personality Research Form (PRF) 21 Jackson (1999) Assessment of Background and Life Experiences (ABLE) 9 Hough (1992) California Psychological Inventory (CPI) 20 Gough & Bradley (1996) Multidimensional Personality Questionnaire (MPQ) 11 Tellegen (1982) O*NET Work Styles 17 Borman, Kubisiak, & Schneider (1999) Big-Five Facet Level Variable Taxonomy 18 Saucier & Ostendorf (1999) 16 Personality Factor (16PF) Questionnaire 16
Cattell, Eber, & Tatsuoka (1970); Conn & Rieke (1994)
Global Personality Inventory (GPI) 30 Schmit, Kihm, & Robie (2000)
These taxonomies/instruments reflect several different measurement philosophies and test development/research methods, and all are of high quality. Some are omnibus personality inventories, while others were developed with a work context specifically in mind.
We performed the following steps in developing the initial NCAPS taxonomy:
• Sorted the definitions of each construct in each taxonomy/instrument into categories based on content similarity
• Eliminated several singleton constructs that, in our professional judgment:
▪ Would be unrelated (or much less related than other construct categories that emerged) to job requirements for naval enlisted ratings (e.g., PRF Exhibition, CPI Communality, MPQ Absorption)
▪ Were multidimensional compound traits (Hough & Schneider, 1996; e.g., CPI Empathy)
▪ Were too broad (e.g., GPI Negative Affectivity)
• Re-sorted the individual construct definitions in several construct categories that seemed highly related (e.g., independence, rugged individualism) to determine whether the categories should be combined, remain separate, or be revised.
2-3

• Created descriptions of high and low scorers for each category by integrating the definitions within category, removing those aspects of the definitions that were, in our professional judgment, irrelevant (or largely irrelevant) to the naval enlisted rating context. In the process, we simplified and clarified the wording when necessary (e.g., removing academic personality jargon).
• In some cases, we filled in gaps in the definitions based on our own research and understanding of the constructs.
• In some cases, there was more information about the high end of a construct than about the low end. In such cases, we extrapolated definitions for the low end based on definitions of the high end.
This methodology yielded 22 candidate personality constructs for NCAPS. Three of these constructs were eliminated from the taxonomy for the practical reason that they were being addressed in another Navy research study. This left us with 19 candidate constructs. The descriptions of high and low scorers were then reviewed by PDRI and NPRST psychologists, and revised somewhat to enhance their relevance to Navy enlisted ratings. Those constructs, together with their high and low behavior descriptors, are shown in Table 2.2.
Literature-Based Evaluation of Initial NCAPS Constructs Against NCAPS Inclusion Criteria
Our next step was to evaluate the personality constructs in the initial NCAPS taxonomy against the inclusion criteria set forth by Ferstl et al. (2003) and described above. We reviewed technical manuals for major non-cognitive inventories, together with relevant empirical studies, including key meta-analyses. These materials were identified based on our knowledge of the literature, supplemented by a thorough computerized literature search. In the following sections, we review evidence relevant to each of the 19 initial NCAPS constructs in turn, using the Ferstl et al. (2003) criteria as our framework.2
2 We do not explicitly discuss the specificity issue for each construct evaluated. As discussed above, the methodology used to formulate our working taxonomy was designed to produce constructs at an appropriate (middle-level) level of specificity. All of our proposed constructs are at a level below the Big-Five; they are not, however, so narrow that they compromise measurement efficiency or yield constructs insufficiently broad to allow development of an adequate number of items to populate the NCAPS item pool.
2-4

Table 2-2 Initial NCAPS personality taxonomy
Construct Description of High Scorer Description of Low Scorer
Achievement Like to set challenging goals; work hard, over long periods of time when necessary, to achieve goals; persist in the face of significant obstacles that would cause others to give up; strive for excellence
Avoid challenging goals and projects; prefer to work only as hard as necessary to complete projects and tasks; give up easily when confronted with obstacles
Energy Level Are active and spirited; possess great reserves of energy; are capable of continuous, intense work activity over long periods of time
Often appear lethargic; possess little stamina; are not able to maintain continuous, intense work activity for significant periods of time
Positive Self-Concept
Feel good about themselves, mentally and physically; are self-assured; are optimistic about the future; get excited and enthusiastic about things; are lively and cheerful
Experience little joy or excitement; are self-doubting; are hesitant to express opinions; believe others are superior to them; give in others too easily; are pessimistic; accept undeserved blame and criticism
Leadership Orientation Are willing to lead, take charge, offer opinions and direction, and take responsibility for guiding others’ actions; assume the role of leader when no one else steps forward; are able to mobilize others to act; are confident, forceful, firm, and decisive
Prefer to let others assume leadership roles; are indecisive; do not enjoy being the center of attention; are submissive and readily fall into the role of “follower”
Social Orientation Are outgoing, sociable, warm, likable, cooperative, and participative; like to work with others rather than alone; like and accept people readily; value connections with others
Are shy, reserved, and aloof; prefer to be alone; are critical and generally unaccepting of others; create friction when around others
Compassion Demonstrate compassion toward others; enjoy taking care of others in need; often provide sympathy, comfort, and assistance to others
Are emotionally aloof; prefer impersonal to personal relationships; display little interest in, and compassion for, other people’s problems
Social Astuteness Understand the underlying motives, feelings, needs, and intentions of others and accurately predict and control others’ behavior based on that understanding; accurately interpret social cues
Misinterpret, and are often surprised by, others’ social behavior; have difficulty seeing things from others people’s perspectives.
Adaptability/Flexibility Are willing to change their approach to tasks and projects; like considerable variety at work; are able to work effectively with many different types of people in many different types of situations; adapt readily to changes in their environment
Like to do things the way they have always done them; have difficulty adjusting to new people, situations, and environments; do not adapt well to changes in their environment
2-5

Table 2-2 (Continued)
Construct Description of High Scorer Description of Low Scorer
Impulsivity/Self-Control Tend to act on the “spur of the moment;” speak and vent emotions without thinking through possible consequences
Suppress negative emotions and inappropriate behaviors, even in situations where it is difficult to do so; think before acting
Adventurous/Courageous
Are daring and adventurous; are unafraid of exposing themselves to possible attack or injury; enjoy the excitement of a dangerous emergency
Do not enjoy adventurous activities, especially if danger is involved; avoid risk of bodily harm; seek to maximize personal safety
Dependability Are reliable, well organized, orderly and planful; use their time efficiently; prioritize tasks; stay on schedule; are not easily distracted or bored by routine tasks
Are unreliable and undependable; fall behind in assignments or duties; miss deadlines; put off unpleasant tasks and are easily distracted while working on them; often lose things
Dutifulness/Integrity Have a strong sense of duty and moral obligation; try to do what is right and ethical; accept authority and follows laws, rules, and regulations; are honest and trustworthy
Are rebellious and contemptuous of laws, rules, and regulations; cannot be trusted; break promises; refuse to be held accountable for their own actions; are undisciplined and self-indulgent
Attention to Detail Are exacting, precise, and accurate; spot minor imperfections or errors; are meticulous and thorough in their approach to tasks; dislike clutter; enjoy developing methods for keeping materials methodically organized
Are sloppy and imprecise; miss important details; make careless errors; frequently maintain their personal effects in a state of disarray
Stress Tolerance Maintain composure and retain ability to think clearly and take effective action when confronted with stressful situations; can readily put aside worries and feelings of guilt
Become indecisive or make poor decisions in times of stress due to loss of composure; are prone to feelings of worry, guilt, and vulnerability; are easily upset; tend to ruminate about troubling events and perceived failures
Innovation Are able to come up with new ideas for, and answers to, work-related problems; do not stick to old approaches simply because things have always been done that way; look at old things in new ways; are open to new ideas and alternate ways of thinking; are inventive and imaginative
Like to stick to “tried-and-true” methods rather than experimenting with new approaches; have little or no desire to innovate or think creatively; become impatient when others seek to brainstorm new ideas or approaches
2-6

Table 2-2 (Continued)
Construct Description of High Scorer Description of Low Scorer
Perceptiveness/Depth of Thought
Are interested in pursuing topics in depth; enjoy abstract thought; have a need to understand how things work and the underlying causes of problems; enjoy searching for underlying themes and patterns in data and information; seek to understand the “big picture;” are impatient with oversimplification; are knowledgeable about many things; are perceptive and insightful
Take little time for reflection; are not comfortable engaging in abstract thought; have little desire to think things through in depth or to probe for new insights; are not mentally engaged by new, challenging problems; are not observant; take a shortsighted, shallow view of things
Willingness to Learn Demonstrate a willingness to learn new material in a classroom environment or on the job and to apply that material in new work situations; learn from mistakes, take useful advice, and ask questions when they are unsure about something; actively seek out learning opportunities; are interested in learning many different things
Avoid training opportunities; do not apply what they learn in training to new work situations; do not learn from mistakes or listen to others’ advice; do not seek clarification when they fail to understand something in a training situation; have a narrow range of interests
Self-Reliance Are self-sufficient, resourceful, and like to make their own decisions; avoid becoming dependent on others to get things done; have a no-nonsense approach to things; are realistic and unsentimental
Frequently rely on others to get things done; easily become dependent on others for advice and reassurance, and may feel insecure or helpless without that support; often take up receptive listeners’ time by confiding difficulties to them and seeking support
Vigilance Are able to constantly scan the environment for things that require attention, even when no action may be required for long periods of time (e.g., staying alert to possible safety hazards)
Experience lapses in attention when required to scan the environment for low frequency, but critical, actions or events over long periods of time
Achievement
Unidimensionality/Stability3
Measures of achievement have shown good internal consistency and temporal stability. For example, Hough, Eaton, Dunnette, Kamp, and McCloy (1990) reported that the ABLE Work Orientation (Achievement) scale had α = .84 (n = 8,498 military enlisted personnel) and 1- to 2-week test-retest reliability of .78 (n = 408 to 414 military enlisted personnel). Jackson (1999) reported internal consistency reliabilities of .76 and 3 In many cases, the best available evidence of unidimensionality was internal consistency reliability. Where possible, we attempted to locate data that spoke more directly to whether constructs under evaluation are sufficiently unidimensional to be subjected to IRT analyses.
2-7
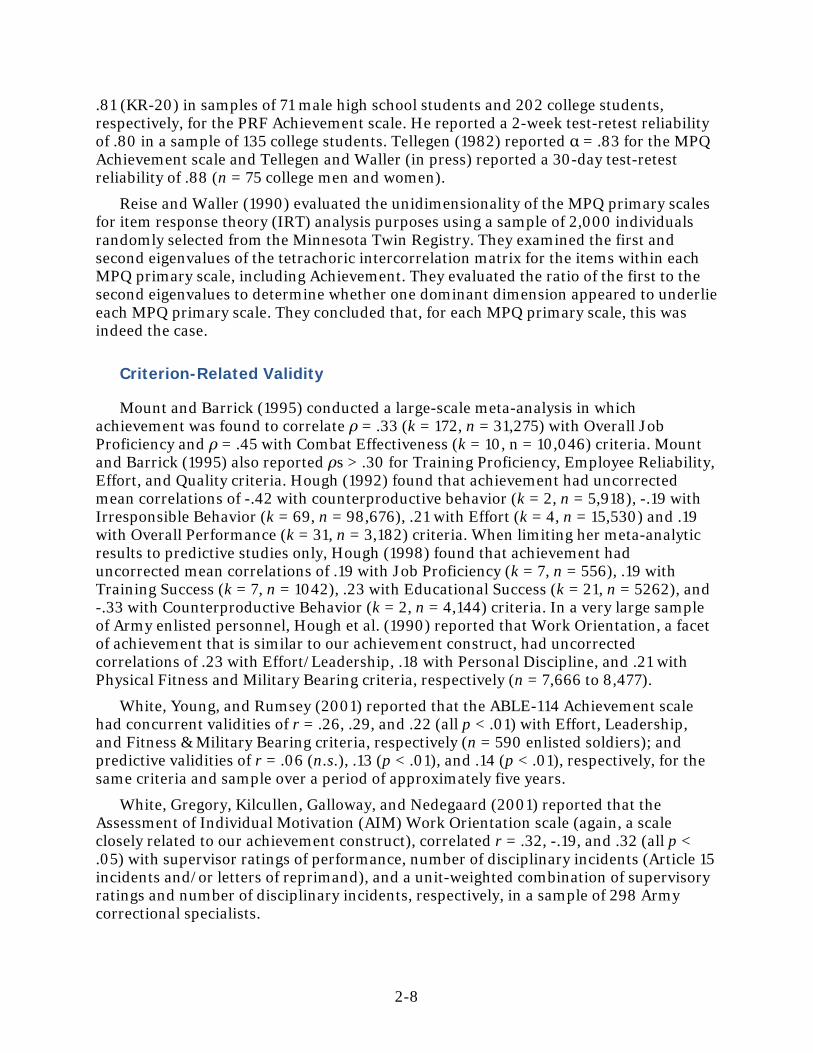
.81 (KR-20) in samples of 71 male high school students and 202 college students, respectively, for the PRF Achievement scale. He reported a 2-week test-retest reliability of .80 in a sample of 135 college students. Tellegen (1982) reported α = .83 for the MPQ Achievement scale and Tellegen and Waller (in press) reported a 30-day test-retest reliability of .88 (n = 75 college men and women).
Reise and Waller (1990) evaluated the unidimensionality of the MPQ primary scales for item response theory (IRT) analysis purposes using a sample of 2,000 individuals randomly selected from the Minnesota Twin Registry. They examined the first and second eigenvalues of the tetrachoric intercorrelation matrix for the items within each MPQ primary scale, including Achievement. They evaluated the ratio of the first to the second eigenvalues to determine whether one dominant dimension appeared to underlie each MPQ primary scale. They concluded that, for each MPQ primary scale, this was indeed the case.
Criterion-Related Validity
Mount and Barrick (1995) conducted a large-scale meta-analysis in which achievement was found to correlate ρ = .33 (k = 172, n = 31,275) with Overall Job Proficiency and ρ = .45 with Combat Effectiveness (k = 10, n = 10,046) criteria. Mount and Barrick (1995) also reported ρs > .30 for Training Proficiency, Employee Reliability, Effort, and Quality criteria. Hough (1992) found that achievement had uncorrected mean correlations of -.42 with counterproductive behavior (k = 2, n = 5,918), -.19 with Irresponsible Behavior (k = 69, n = 98,676), .21 with Effort (k = 4, n = 15,530) and .19 with Overall Performance (k = 31, n = 3,182) criteria. When limiting her meta-analytic results to predictive studies only, Hough (1998) found that achievement had uncorrected mean correlations of .19 with Job Proficiency (k = 7, n = 556), .19 with Training Success (k = 7, n = 1042), .23 with Educational Success (k = 21, n = 5262), and -.33 with Counterproductive Behavior (k = 2, n = 4,144) criteria. In a very large sample of Army enlisted personnel, Hough et al. (1990) reported that Work Orientation, a facet of achievement that is similar to our achievement construct, had uncorrected correlations of .23 with Effort/Leadership, .18 with Personal Discipline, and .21 with Physical Fitness and Military Bearing criteria, respectively (n = 7,666 to 8,477).
White, Young, and Rumsey (2001) reported that the ABLE-114 Achievement scale had concurrent validities of r = .26, .29, and .22 (all p < .01) with Effort, Leadership, and Fitness & Military Bearing criteria, respectively (n = 590 enlisted soldiers); and predictive validities of r = .06 (n.s.), .13 (p < .01), and .14 (p < .01), respectively, for the same criteria and sample over a period of approximately five years.
White, Gregory, Kilcullen, Galloway, and Nedegaard (2001) reported that the Assessment of Individual Motivation (AIM) Work Orientation scale (again, a scale closely related to our achievement construct), correlated r = .32, -.19, and .32 (all p < .05) with supervisor ratings of performance, number of disciplinary incidents (Article 15 incidents and/or letters of reprimand), and a unit-weighted combination of supervisory ratings and number of disciplinary incidents, respectively, in a sample of 298 Army correctional specialists.
2-8

Finally, the AIM Work Orientation scale correlated r = .23, .17, and .25 (all p < .05) with sales ratings, gross production (archival sales effectiveness data), and overall effectiveness criteria (a linear combination of rating and archival sales data) in a sample of 304 to 452 Army recruiters (White, Borman, Penney, Kubisiak, Horgan, et al., 2002).
Construct Validity
In a joint factor analysis of the MPQ, 16PF, and PRF, Tellegen and Waller (in press) found that the MPQ and PRF Achievement scales loaded on the same factor, with identical loadings of .71 (n = 288 college men and women). Their joint factor analysis also showed that the MPQ and PRF Achievement scales not only had the same loadings on the same factor, but also showed very similar patterns of loadings across all four factors that were extracted.
For the PRF Achievement scale, correlations with adjective ratings by an aggregate of peers (unspecified in number) who knew the examinees well ranged from r = .46 to .53 in samples of college students ranging from n = 40 to 202 (Jackson, 1999). The correlation between self-ratings and roommate ratings on the PRF Achievement scale was r = .63 (n = 90 college students). It is noteworthy that the roommate ratings consisted of only one judge, rather than an aggregate (Jackson, 1999), making this convergent validity evidence quite impressive.
Jackson (1999) provided evidence of both the convergent and discriminant validity of the PRF Achievement scale in a factor analysis of a multi-trait multi-method correlation matrix (n = 202 college students) in which each of the 20 constructs in the PRF was measured using (1) the examinees’ PRF scale scores, along with (2) self-ratings and (3) peer-ratings of the extent to which each trait (operationalized by trait label plus behavioral description relevant to the trait) was present or absent in the examinee being rated. Eighteen factors were extracted and rotated to a Varimax criterion. Results showed that the PRF Achievement scale scores loaded on the same factor as achievement scores yielded by the other two measurement methods. None of the three achievement scores/ratings loaded on any other factor extracted in that study, with the exception of peer-rated achievement, which had a loading of .49 on an Endurance factor. This provides good evidence of both convergent and discriminant validity.
Costa and McCrae (1992) report that the Achievement Striving facet of the NEO-PI-R Conscientiousness scale correlates r = .59 with the PRF Achievement scale (despite the fact that the NEO-PI-R Achievement Striving facet has only 8 items) in a sample of 203 to 296 participants in the Baltimore Longitudinal Study of Aging (BLSA). The BLSA sample “consisted largely of individuals working in or retired from professional, managerial, or scientific occupations and was considerably better educated than the population in general. Some evidence, however, suggests that BLSA volunteers did not differ greatly from national samples of the distribution of personality dispositions” (Costa & McCrae, 1992, p. 40).
2-9

Usefulness for Classification
The available data suggest that achievement will be somewhat useful for classification purposes. Borman et al. (1999) reported results of expert-rated importance of various personality trait (“work style”) requirements across six occupations, five of which were relevant to Naval enlisted ratings (computer programmer, registered nurse, police patrol officer, janitor/cleaner, and maintenance/repair/general utility). Results suggested modest differences across relevant occupations (the largest effect size between occupations was .57, though most effect sizes were in the .40s or below).
Summary
Achievement is one of the most prominent traits in the personality sphere. It is prominently featured in many major personality instruments and taxonomies, including the ABLE, the PRF, the MPQ, and the O*NET work style taxonomy. Measures of achievement are internally consistent/unidimensional and temporally stable, predictive of a number of important criteria in both military and non-military settings, and show both convergent and discriminant validity. Achievement may be somewhat useful for classification purposes, but will almost certainly be more useful for selection.
Energy Level
Unidimensionality/Stability
Hough et al. (1990) reported that the ABLE Energy Level scale had an alpha coefficient of .82 and a 1- to 2-week test-retest reliability of .78 in a sample of 8,488 Army enlisted personnel. The JPI Energy Level scale had internal consistency reliabilities ranging from .76 to .80 across four university samples (n = 82 to 1,107). Test-retest reliability for the JPI Energy Level scale was r = .81, with a 13-week interval between administrations (Moorefield & Kofman, 2000). Jackson (1999) reported internal consistencies for the PRF Endurance scale (which is closely related to our energy level construct) of .75 and .78 (KR-20), respectively, in samples of 71 male high school students and 202 college students. The stability of the PRF Endurance scale was reported to be r = .90 to .92 (2-week interval) for a sample of 82 college students for each of two PRF forms. The PRF Endurance scale had 2- to 3-week stability coefficients using parallel forms that ranged from .71 to .80 in high school, college, and graduate students samples ranging in size from 82 to 192.
Criterion-Related Validity
Although validity data relevant to energy level is sparse, the available evidence supports the criterion-related validity of this construct. Specifically, in a large-scale study highly relevant to Naval enlisted personnel, the ABLE Energy Level scale had uncorrected correlations of r = .22 with Effort and Leadership and r = .25 with Physical Fitness and Military Bearing (n = 7,666 to 8,477 Army enlisted personnel) (Hough et al., 1990).
2-10

Construct Validity
The JPI Energy Level scale, which is conceptually related (though not identical) to the PRF Endurance scale, correlates r = .38 with the PRF Endurance scale for females and r = .40 for males. The JPI Energy Level scale correlates r = .71 with self-ratings on “active versus tires easily” and r = .52 with self-ratings of “lively versus listless,” and is also related to measures of achievement and dominance (Jackson, 1994).
In other results reported by Jackson (1994, 1999), an all-female sample of 116 university students yielded a self-roommate correlation of r = .33 (p < .01) for the JPI Energy Level scale. While somewhat low, this was higher than self-roommate correlations between the JPI Energy Level scale and any other JPI trait. In another sample of 70 college students, JPI Energy Level correlated r = .47 with peer ratings (where ratings were provided by multiple peers). In a sample of 90 college roommates, the self-peer correlation for the PRF Endurance scale was r = .51.
Jackson (1994) conducted a multi-method factor analysis of a multi-trait multi-method intercorrelation matrix in which each of the constructs in the JPI was measured by four methods: the JPI scale score, an adjective checklist, and peer and self-ratings. The sample consisted of 70 college undergraduates residing in common housing units, each of whom was rated by 6 to 10 people in his or her unit. Self-ratings were obtained using a nine-point bipolar rating scale anchored at each pole with opposite adjectives defining alternative extremes of the given trait. Peer ratings were obtained by providing judges with an adjective trait name for each trait dimension along with the definition of the trait. Adjective checklist self-ratings were ratings made using an adjective checklist constructed by selecting 10 positively keyed and 10 negatively keyed adjectives for each scale. Fifteen factors were extracted, one for each of the 15 JPI scales. For the JPI Energy Level scale, all of these four different methods loaded on the same factor, with loadings ranging from .65 to .77. The mean of the absolute values of construct-irrelevant loadings was .10. This provides good evidence of both convergent and discriminant validity of the JPI Energy Level scale.
Usefulness for Classification
Evidence regarding the utility of energy level for classification purposes is sparse. One source of evidence, however, involves correlations between measures related to energy level and various scales that operationalize Holland’s (1973) RIASEC taxonomy of occupational types. Hogan and Blake (1996) synthesized a number of studies to evaluate correlations between a variety of personality traits and the Holland occupational types. In Holland’s taxonomy, R = Realistic, I = Investigative, A = Artistic, S = Social, E = Enterprising, and C = Conventional. As described by Hogan and Blake (1996, pp. 97-98), Realistic types are “practical, hands-on, real-world people who are action-oriented;” Investigative types are “abstract, analytical, and theory-oriented;” Artistic types are “imaginative and impractical and try to entertain, amuse, and fascinate others;” Social types “enjoy helping, serving, and assisting others;” Enterprising types try to “manipulate, persuade, and outperform others;” and Conventional types “count, regulate, and organize people or things.”
2-11

It is likely that Naval enlisted ratings reflect most or all of the six types, though to varying degrees and in varying combinations. For example, the Gunner’s Mate rating would likely be primarily realistic; the Intelligence Specialist rating would likely be primarily investigative; the Illustrator–Draftsman rating would likely have a significant artistic component; the Navy Counselor rating would likely be primarily social; and the Disbursing Clerk would likely be primarily conventional. Enterprising interests have been linked to leadership-related traits. As such, their usefulness as classification tools would primarily be in their ability to identify individuals likely to become non-commissioned officers with supervisory responsibilities.
If a personality scale exhibited a variable pattern of correlations across the six RIASEC occupational types, this would be evidence that the construct operationalized by that scale has utility for classification purposes. While energy level is not specifically incorporated into the Hogan and Blake personality-RIASEC correlational data, correlations between positive emotionality and the RIASEC types are relevant because energy level is related to positive emotionality (Tellegen & Waller, in press). Hogan and Blake’s results show that positive emotionality has significant positive correlations in the low 20s with the Social and Enterprising RIASEC types, but is relatively uncorrelated with the other types. This suggests some limited usefulness for classification purposes.
Summary
Energy level has been measured in several prominent instruments/taxonomies. It is similar to the ABLE Energy Level scale, the JPI Energy Level scale, and the PRF Endurance scale. Measures of energy level have been shown to be internally consistent, temporally stable, and related to important criteria in a military enlisted sample. In addition, they have been found to possess convergent and discriminant validity and to have greater utility for selection than for classification, though they may have some limited usefulness for classification purposes.
Positive Self-Concept
Unidimensionality/Stability
The CPI Well-Being scale has internal consistency reliability of α = .84 (n = 6,000; 3,000 males and 3,000 females). In addition, it has a 1-year stability coefficient of r = .72 in a sample of 237 high school students first assessed as juniors, a 5-year stability of r = .69 in a sample of 91 females first assessed as college seniors, and a 25-year stability of r = .79 for 44 males first assessed at the age of approximately 40 (Gough & Bradley, 1996). The MPQ Well-being scale has internal consistency of α = .89 (n = 300 college men, 500 college women, 223 community men, and 391 community women) and a 30-day stability coefficient of r = .90 (n = 75 college men and women) (Tellegen & Waller, in press). The CPI Self-Acceptance scale has an internal consistency reliability of α = .67 (n = 6,000; 3,000 males and 3,000 females). Gough and Bradley (1996) report that the 1-year stability of the CPI Self-Acceptance scale is r = .69 in a sample of 237
2-12

high school students first assessed as juniors, the five-year stability is r = .49 for 91 females first assessed as college seniors, and the 25-year stability is r = .63 for 44 males first assessed at the age of approximately 40. The NEO-PI-R Positive Emotion facet has an internal consistency of α = .73 to .82 (2 samples: n = 1,539 and 277; Costa & McCrae, 1992).
The OPQ Optimistic scale had a mean internal consistency of α = .76 (range = .66 to .86) across six samples. By far the largest of these samples (n = 2,987 individuals drawn from the British general population) had α = .73. The OPQ Optimistic scale had a 4-week test-retest reliability of r = .81 (n = 88 college undergraduates); and the 15-month test-retest reliability r = .71 (n = 108 human resource professionals) (Saville & Holdsworth, 1993). Finally, the internal consistency reliability of the ARC Self-Esteem scale was found to be α = .62 (n = 298 Army correctional specialists; White, Gregory, et al., 2001).
Reise and Waller’s (1990) evaluation of the unidimensionality of the MPQ primary scales for IRT analysis purposes provides additional evidence of the unidimensionality of the MPQ Well-Being scale and, therefore, of positive self-concept measures.
Criterion-Related Validity
In a meta-analysis, Judge and Bono (2001) reported a corrected correlation of .26 for self-esteem, a variable closely related to positive self-concept for both Overall Job Performance and Job Satisfaction criteria (ks = 56 and 40, ns = 20,819 and 5,145, respectively). The link between self-esteem and job satisfaction has important implications in military settings. This is because job satisfaction is a good predictor of turnover (Harter, Schmitt, & Hayes, 2002; Tett & Meyer, 1993). Low employee turnover is generally desirable in all organizations, but is especially important in the military, where retention has become increasingly problematic. The ARC Self-Esteem scale was found to correlate r = .20 (p < .05), -.01 (n.s.), and .08 (n.s.) with supervisor ratings of performance, number of disciplinary incidents (Article 15 incidents and/or letters of reprimand), and a unit-weighted combination of supervisory ratings and number of disciplinary incidents, respectively, in a sample of 298 Army correctional specialists (White, Gregory et al., 2001). In other military research, the Self-Esteem scale of an instrument known as the Background Information Questionnaire (BIQ) correlated r = .15, .17, and .19 (all p < .05) with Sales Rating, Gross Production (archival sales effectiveness data), and Overall Effectiveness (linear combination of rating and archival sales data) criteria in a sample of 304 to 452 Army recruiters (White et al., 2002). In their study of explosive ordnance disposal (EOD) Naval divers and diver trainees, the Self-Confident homogeneous item composite (HIC) of the Hogan Personality Inventory (HPI; R. Hogan, 1986; R. Hogan & J. Hogan, 1995) correlated r = .22 (p < .01) with explosive ordnance disposal (EOD) diving success and r = .18 (p < .05) with EOD course success (n = 97 EOD trainees) (J. Hogan & R. Hogan, 1989). These results are particularly noteworthy given that the Self-Confident HIC consists of only three items. Finally, meta-analytic research reported by Robertson and Kinder (1993) showed that the OPQ Optimistic scale had a mean weighted uncorrected validity of .14 against Resilience criteria (k = 10; n = 1,152; lower bound of 90 percent credibility interval greater than zero).
2-13

Construct Validity
Gough and Bradley (1996) report that the CPI Well-Being and Self-Acceptance scales correlated r = .31 in the case of females and r = .28 in the case of males (both n = 3,000). Consistent with these results, Hakstian, Woolsey, and Schroeder (1987) reported that the CPI Self-Acceptance and Well-Being scales load on different factors. It appears that the CPI Self-Acceptance scale has more to do with Dominance, whereas the CPI Well-Being scale has more to do with the negative pole of Emotional Stability. For example, the CPI Well-Being scale correlates r = -.55 to -.61 with 16PF Factor O (Apprehensive, Insecure), whereas the CPI Self-Acceptance scale correlates r = .57 to .75 with the PRF Dominance scale and r = .58 to .68 with the PRF Exhibition scale.
The NEO-PI-R Positive Emotion facet scale correlates most highly with measures of extroversion such as the Interpersonal Adjective Scales-Revised (IAS-R; Wiggins, Trapnell, & Phillips, 1988) Gregarious-Extroverted scale (r = .58, p < .01, n = 221). On the other hand, the OPQ Optimistic scale correlates with both the 16PF Social Boldness (r = .31) and Tension scales (r = -.36) (both n = 2,007).
These results indicate that the positive self-concept construct in our initial NCAPS taxonomy encompasses several facets that, while related, are not highly cohesive. Indeed, it is not even entirely clear that they form a single higher-order construct.
Usefulness for Classification
The Hogan and Blake (1996) work shows that the CPI Well-Being scale is uncorrelated with any of the six Holland RIASEC types, and that measures related to positive emotionality tend to correlate in the .20s with the Social and Enterprising types. Judge, Erez, and Bono (1998) make a theoretical argument that positive self-concept should be broadly useful for a variety of selection purposes. We therefore expect that positive self-concept will be more useful for selection than for classification purposes, though it may have some limited usefulness for classification.
Summary
Various facets of positive self-concept have been measured in several prominent instruments. Positive self-concept is similar to the CPI and MPQ Well-being scales, the CPI Self-Acceptance scale, the NEO-PI-R Positive Emotion facet scale, and the OPQ Optimistic scale. It is also similar to a Self-Esteem scale in an instrument known as Assessment of Right Conduct (ARC; White, Gregory et al., 2001). Scales operationalizing these facets have been shown to be internally consistent and temporally stable. They have shown modest criterion-related validities against various criteria. Their facets, while correlated, are somewhat distinct, and it is not clear whether a higher-order positive self-concept construct accounts for the correlations. While there is some limited evidence that positive self-concept would be useful for classification, it is likely that it would be more useful for selection purposes, though its usefulness as a selection tool is more limited than many other constructs in our taxonomy.
2-14

Leadership Orientation
Unidimensionality/Stability
Internal consistency and temporal stability for this construct are good. In an enlisted military sample, Hough et al. (1990) found that the ABLE Dominance scale had an alpha coefficient of .80 in a sample of 8,477 military enlisted personnel and a 1- to 2-week test-retest reliability coefficient of r = .79 (n = 408 to 414).
Jackson (1999) reported internal consistency reliabilities of .85 and .86 (KR-20) for the PRF Dominance scale (n = 71 male high school students and 202 male and female college students), with 2-week test-retest reliability coefficients ranging from r = .91 to .93 (n = 82 college students for each of two forms) and 2- to 3-week parallel form reliabilities ranging from r = .79 to .87 in samples ranging from 82 to 192 high school, college, and graduate students. Similarly, the CPI Dominance scale had internal consistency reliability of α = .83 (n = 6,000; 3,000 males and 3,000 females). Gough and Bradley (1996) reported that the 1-year stability of the CPI Dominance scale was r = .67 in a sample of 237 high school students first assessed as juniors, with a 5-year test-retest reliability coefficient of r = .65 in a sample of 91 females initially tested as college seniors, and a 25-year stability coefficient of r = .82 in a sample of 44 adult males initially tested at the age of approximately 40. Tellegen and Waller (in press) reported a mean alpha coefficient of .88 for the MPQ Social Potency scale across four samples consisting of 300 college men, 500 college women, 223 community men, and 391 community women. They also reported a 30-day stability coefficient of r = .82 for the MPQ Social Potency scale.
Reise and Waller’s (1990) evaluation of the unidimensionality of the MPQ primary scales for IRT analysis purposes provides additional evidence of the unidimensionality of the MPQ Social Potency scale and, therefore, of leadership orientation measures.
Criterion-Related Validity
White, Young, and Rumsey (2001) reported that the ABLE-114 Dominance scale showed concurrent validities of r = .26, .30, and .23 (all p < .01), respectively, against Effort, Leadership, and Fitness & Military Bearing criteria (n = 590 enlisted soldiers). In a follow-up 5-year criterion-related validity study involving the same 590 enlisted soldiers, the ABLE-114 Dominance scale showed validities of r = .10 (p < .05), .15 (p < .01), and .15 (p < .01), respectively, for Effort, Leadership, and Fitness and Military Bearing criteria. White, Gregory et al. (2001) reported that the AIM Leadership (Dominance) scale correlated r = .16 (p < .05) with supervisor ratings of performance, but did not correlate significantly with number of disciplinary incidents (Article 15 incidents and/or letters of reprimand) or with a unit-weighted combination of supervisory ratings and number of disciplinary incidents in a sample of 298 Army correctional specialists. The AIM Leadership scale also correlated r = .23, .17, and .25 (p < .05) with Sales Rating, Gross Production, and Overall Effectiveness criteria in a sample of 491 Army recruiters representing 10 recruiting battalions nationwide (White et al., 2002). In their study of Navy fleet explosive ordnance disposal (EOD) divers and diver trainees, J. Hogan and R. Hogan (1989), reported a correlation of r = .25 (p < .05)
2-15

between the 6-item Leadership HIC of the HPI and a dichotomous variable distinguishing excellent from average performers (n = 48 EOD enlisted fleet technicians). Finally, the Hough (1992) meta-analysis revealed that potency measures had an uncorrected mean correlation of .17 with Effort criteria (k = 16, n = 17,156), .25 with Sales Effectiveness criteria (k = 7, n = 1,111), and .21 with Creativity criteria (k = 11, n = 550). In a follow-up meta-analysis, Hough (1998) reported an uncorrected mean correlation of .15 with Educational Success criteria (k = 80, n = 27,564), with a meta-analytic database limited to predictive studies only.
Construct Validity
Gough and Bradley (1996) showed that the CPI Dominance scale correlates r = .71 to .78 with the PRF Dominance scale (n = 133 males and 84 females, respectively). Conn and Rieke (1994) reported that the 16PF Dominance scale had its highest correlations with the same or closely related scales within the PRF (r = .48 with the PRF Dominance scale; n = 225); and within the CPI (r = .50 with the CPI Dominance scale; n = 212). Within the NEO-PI-R, the CPI Dominance scale had its highest correlation with the NEO-PI-R Assertiveness facet scale (r = .55; n = 257). Correlations between the 16PF Dominance scale and unrelated or less related scales were correspondingly lower for each of these instruments.
In the Tellegen and Waller (in press) joint factor analysis, MPQ Social Potency and PRF Dominance had very similar patterns of loadings across the four factors that were extracted in a sample of 288 college men and women. Similarly, the CPI Dominance scale loaded on same factor as the 16PF Dominance scale in a sample of 238 first-level supervisors in the telecommunications industry (Hackstian et al., 1987).
Usefulness for Classification
Another useful source of information in helping us determine whether a measure of a given personality construct would be likely to have utility for classification purposes was data reported by Cattell, Eber, and Tatsuoka (1970). Cattell et al. provided profiles on 16PF scales for individuals in a number of distinct occupations. We examined personality profiles of individuals in occupations that seemed most relevant to Navy enlisted ratings. Ten such occupations were identified: Accounting Clerk, Aircraft Engineer, Clerical Worker, Cook/Kitchen Help, Electrician, Employment Counselor, Janitor, Mechanic (Garage), Policemen, and Psychiatric Technician. For each 16PF scale, we computed the mean and standard deviation across these occupations. Scales with larger standard deviations should be most useful for classification purposes. The 16PF Dominance scale had a standard deviation that was lower than the majority of other 16PF scales, suggesting limited utility for classification purposes.
On the other hand, the Borman et al. (1999) O*NET data relating to the leadership orientation job descriptor yielded large effect sizes (d > 1.0) between certain jobs (e.g., police patrol officer and janitor/cleaner), suggesting that leadership orientation measures may have very good utility for classification purposes—at least for some occupations. The Hogan and Blake (1996) work indicates that measures related to leadership orientation (e.g., MPQ Social Potency, HPI Ambition) correlate between .22
2-16

and .43 with the Social and Enterprising RIASEC occupational types, whereas their correlations with other RIASEC occupational types are negligible. Taken together, this evidence suggests that leadership orientation measures will have at least adequate, and possibly good, utility for classification purposes.
Summary
Leadership orientation is closely related to dominance and social potency measures, which can be found in a number of prominent personality taxonomies/instruments. For example, dominance can be found in the PRF, the CPI, the 16PF, and the ABLE; and social potency can be found in the MPQ. Leadership Orientation can also be found in the O*NET work style taxonomy. It has been shown to be internally consistent/unidimensional and temporally stable, and to be valid against a variety of important job performance criteria. There is, however, some evidence that these validities will attenuate over time. Leadership orientation measures have been shown to possess good construct validity, and the available evidence suggests that leadership orientation will have at least adequate, and possibly good, utility as a classification tool.
Social Orientation
Social orientation encompasses measures of sociability/affiliation and warmth. It is most closely aligned with the MPQ Social Closeness, the 16PF Warmth, and the PRF Affiliation scales.
Unidimensionality/Stability
Tellegen and Waller (in press) reported a mean alpha coefficient of .83 for the MPQ Social Closeness scale (n = 300 college men, 500 college women, 223 community men, and 391 community women), with a 30-day test-retest reliability coefficient of r = .92 (n = 75 college men and women). Jackson (1999) reported internal consistency reliabilities of .81 and .76 (KR-20) for the PRF Affiliation scale in samples of 71 male high school students and 202 male and female college students, respectively. Jackson further reported a 2-week stability coefficient of r = .93 in a sample of 82 college students, and parallel form test-retest reliabilities ranging from r = .72 to .83 in samples ranging from 82 to 192 high school, college, and graduate students. Conn and Rieke (1994) reported that the 16PF Warmth scale had internal consistency of α = .70 (n = 4,660 individuals drawn from the general population and undergraduate/graduate students), a 2-week test-retest reliability coefficient of r = .83 (n = 204 undergraduates), and a 2-month test-retest reliability coefficient of r = .77 (n = 159 undergraduates). Finally, Hough et al. (1990) reported that the ABLE Cooperativeness scale had internal consistency reliability of α = .81 (n = 8,494 Army enlisted personnel), and a 1- to 2-week test-retest reliability coefficient of r = .76; n = 408 to 414 Army enlisted personnel).
Reise and Waller’s (1990) evaluation of the unidimensionality of the MPQ primary scales for IRT analysis purposes provides additional evidence of the unidimensionality of the MPQ Social Closeness scale and, therefore, of social orientation measures.
2-17

Chernyshenko, Stark, Chan, Drasgow, and Williams (2001) performed analyses that complement the Reise and Waller (1990) unidimensionality analysis that are relevant to some of our constructs. Chernyshenko et al. evaluated 16PF scales for evidence of unidimensionality for IRT purposes based on a sample of 13,059 individuals who took the 16PF in 1995 and 1996 for research, counseling/development, and selection purposes. To evaluate unidimensionality, Chernyshenko et al. (2001) first computed inter-item tetrachoric correlations for each scale and conducted a principal axis factor analysis of those intercorrelations. They then created a synthetic data set that was truly unidimensional, and conducted a parallel principal axis factor analysis of the inter-item tetrachoric correlations associated with that synthetic data set. Finally, they compared the eigenvalues associated with the real-data and synthetic-data factor analyses and determined whether the second eigenvalue appeared to be significantly higher in the real data set than in the synthetic data set. Though they didn’t report results for all 16PF scales, they indicated that results of this analysis satisfied them that the 16PF scales were all sufficiently unidimensional for IRT analysis. To supplement this analysis, Chernyshenko et al. (2001) also conducted confirmatory factor analyses to evaluate the fit of 1-factor models to the inter-item tetrachoric intercorrelation matrices for each of the 16PF scales. For the 16PF Warmth scale, which is closely related to our social orientation construct, the Root Mean Squared Error of Approximation (RMSEA) was .07, and the Goodness of Fit Index (GFI) was .95. The Comparative Fit Index (CFI) was .80, which is somewhat lower than the recommended level, but after evaluating the totality of unidimensionality data, the authors concluded—reasonably, we think—that the 16PF Warmth scale can be considered adequately unidimensional for IRT analysis. This provides further support for the unidimensionality of social orientation measures.
Criterion-Related Validity
Hough (1992) reported meta-analytic evidence showing that affiliation had a mean uncorrected validity of .19 with Sales Effectiveness (n = 667, k = 1) and -.25 with Creativity (n = 116, k = 2) criteria. In their Navy EOD personnel study, J. Hogan and R. Hogan (1989) reported that the Easy To Live With HIC was significantly negatively correlated with EOD diving and course success (both r = -.16, p < .05). The BIQ Interpersonal Skills scale, which has significant content overlap with social orientation, was found to correlate r = .18, .14, and .17 (all p < .05), respectively, with Sales Rating, Gross Production (archival sales effectiveness data), and Overall Effectiveness criteria (linear combination of rating and archival sales data) in a sample of 304 to 452 Army recruiters (White et al., 2002).
Although social orientation does not overlap precisely with the Big-Five Agreeableness factor, its overlap is close enough that validity coefficients quantifying agreeableness-performance relations are relevant to this analysis. The following summarizes relevant evidence. White, Gregory et al. (2001) reported correlations of r = .17, -.13, and .22 (all p < .05) between the AIM Agreeableness scale and supervisory ratings of performance, number of disciplinary incidents (Article 15 incidents and/or letters of reprimand) and a unit-weighted combination of supervisory ratings and number of disciplinary incidents in a sample of 298 Army correctional specialists. White et al. (2002) reported correlations between the AIM Agreeableness scale and Sales
2-18

Ratings, Gross Sales Production, and Overall Sales Effectiveness criteria of r = .13, .14, and .15 (all p < .05). Finally, Mount, Barrick, and Stewart (1998) conducted a meta-analysis in which they found that Agreeableness measures had an estimated true operational validity of .29 against supervisory ratings of interactions with others across four team–based jobs in manufacturing plants (k = 4, n = 678). They further reported that Agreeableness measures had an estimated true operational validity of .19 against supervisor ratings of interaction with others (k = 6, n = 813) for six dyadic service jobs (e.g., grocery store cashiers, residential counselors). Results for an Overall Supervisory Performance Rating criterion were .27 for team jobs (k = 4, n = 678) and .12 for dyadic service jobs (k = 7, n = 908).
Construct Validity
Construct validity evidence for social orientation measures is generally quite good. MPQ Social Closeness, a personality scale very similar to social orientation, was found to have the same pattern of factor of loadings as the PRF Affiliation scale in the Tellegen and Waller (in press) joint factor analysis. Jackson (1999) reported that the PRF Affiliation scale had a correlation of r = .57 with roommate ratings in a sample of 90 college students. In another study, self-peer correlations on the PRF Affiliation scale ranged from r = .40 to .44 (n = 40 to 202 college students). Multi-method factor analysis of self ratings, peer ratings, and PRF scores in a sample of 202 college students yielded a clear content factor Affiliation, with no other construct’s measures loading on that factor (Jackson, 1999).
Finally, the 16PF Warmth scale correlated r = .44 and .46, respectively (both p < .01, n = 257) with the NEO-PI-R Warmth and Gregariousness facets (Conn & Rieke, 1994). This finding was somewhat surprising, since we would have expected the correlation between warmth-warmth correlations to be higher than warmth-gregariousness correlations. However, we also would have expected to observe substantial correlations between warmth and gregariousness measures, as indeed we did.
Usefulness for Classification
The 16PF data reported by Cattell, Eber, and Tatsuoka (1970) indicates that 16PF Warmth has one of the highest standard deviations across the 10 relevant occupations. The Borman et al. (1999) O*NET work styles data indicate that the cross-occupational difference in social orientation ratings approached two standard deviations for the occupations most differentiable on this dimension. Finally, the Hogan and Blake (1996) work shows that the MPQ Social Closeness scale correlates in the .20s with the Social and Enterprising RIASEC types, but correlates r = -.16 (n.s.) with the Realistic occupational type. The 16PF Warmth scale shows an even more differentiated pattern of correlations with RIASEC occupational types: from r = -.36 with the Realistic occupational type to r = .35 with the Social occupational type. Taken together, these data indicate that social orientation measures should have substantial utility for classification purposes.
2-19

Summary
Social orientation measures have been featured in at least two prominent personality taxonomies/instruments: Tellegen’s MPQ and the Borman et al. O*NET work styles taxonomy. However, measures related to social orientation have also been prominently featured in a variety of other personality instrument/taxonomies, including the 16PF, the PRF, and the ABLE. Social orientation measures have been shown to be internally consistent/unidimensional and temporally stable. Criterion-related validity evidence indicates that social orientation measures⎯including measures related to, though not overlapping precisely with, social orientation⎯correlate at useful levels with a variety of important criteria. Importantly, however, the correlations vary widely, ranging from significantly negative to significantly positive. Significant negative correlations sometimes occur in occupations within Holland’s Realistic occupational type, and significant positive correlations are most likely to occur in occupations falling within Holland’s Social occupational type. Consistent with these findings, the available data suggest that social orientation measures will be among the very useful for classification purposes. Finally, we note that the construct validity evidence, particularly the convergent validity evidence, associated with social orientation measures is strong.
Compassion
Unidimensionality/Stability
Jackson (1994) reported that the JPI Empathy scale had a mean alpha coefficient of .79 (range = .78 to .83 across four college samples). Similarly, the PRF Nurturance scale had internal consistency reliabilities of .76 and .73 (KR-20) in samples of 71 male high school students and 202 male and female college students. The PRF Nurturance scale had 2-week test-retest reliability coefficients of r = .89 to .95 (n = 82 college students for each of two parallel forms) and 2- to 3- week parallel form test-retest reliabilities ranging from .70 to .75 in samples ranging from 82 to 192 high school, college, and graduate students (Jackson, 1999).
The OPQ Caring scale was found to have a mean alpha coefficient of .70 (range: .54 to .83) across six samples. By far the largest sample (n = 2,987 individuals drawn from the British general population) had an alpha coefficient of .82. The OPQ Caring scale’s 4-week test-retest reliability coefficient in a sample of 88 undergraduate students was found to be r = .89, and its 15-month test-retest reliability coefficient was reported to be r = .66 in a sample of 108 human resource professionals (Saville & Holdsworth, 1993).
2-20

Criterion-Related Validity
The most relevant validity evidence we were able to locate relating to the compassion construct was a meta-analysis of the OPQ conducted by Robertson and Kinder (1993). In that meta-analysis, the OPQ Caring scale was found to have a mean uncorrected validity against Interpersonal Sensitivity criteria of .06 (k = 12, n = 1,753). Compassion is also quite similar to the Big-Five Agreeableness factor, making criterion-related validity results involving Agreeableness, described above for the social orientation construct, relevant to the compassion construct also.
While validities are low for the most direct measures of compassion, it is likely that job content would moderate these validities, as it did with measures of social orientation (cf. Hough, 1992). For example, we would expect compassion to correlate highly with job performance for the helping professions, but not for technical positions.
Construct Validity
Jackson (1994) reported that the JPI Empathy scale correlated r = .70 with the PRF Nurturance scale for males and r = .66 with the PRF Nurturance scale for females (n = 100 male and 115 female college students). Correlations between PRF Nurturance scale scores and peer ratings of nurturance ranged from r = .27 to .41 across three college student samples ranging from 40 to 202. Self-peer ratings on a trait rating form had much higher correlations (.72 in two separate samples). In another study, however, Jackson (1994) reported that the correlation between JPI self-rated and roommate-rated empathy was only r = .09 (n = 116 self-roommate pairs). On the other hand, he found a correlation of r = .61 between self-rated and roommate-rated nurturance in a sample of 90 self-roommate pairs. In a multi-method factor analysis of JPI, adjective checklist, self-ratings, and peer ratings, factor loadings defining an Empathy factor across methods ranged from .52 to .77, with a mean absolute value of construct-irrelevant loadings of .08.
Costa and McCrae (1992) reported that the NEO-PI-R Altruism facet scale, which has significant content overlap with our compassion construct, had a peer/peer correlation of r = .36 (n = 193), a peer/self correlation of r = .33 (n = 250), and a spouse/self correlation of r = .57 (n = 68).
Usefulness for Classification
The Borman et al. (1999) O*NET work styles data indicate that the cross-occupational difference in social orientation ratings approached two standard deviations for the occupations most differentiable on this dimension. Consistent with these results, the Hogan and Blake (1996) work showed that measures of warmth, agreeableness, and sensitivity, all of which are relevant to our compassion construct, exhibited highly variable patterns of correlations across the six RIASEC occupational types. Therefore, as with social orientation measures, we expect measures of compassion to be among the most useful for classification purposes.
2-21

Summary
Constructs closely related to compassion have appeared in several prominent personality instruments/taxonomies, including Jackson’s JPI and PRF, the NEO-PI-R, and the O*NET work style taxonomy. Measures of compassion have been shown to be internally consistent and temporally stable. The somewhat limited criterion-related validity evidence associated with compassion measures has not provided support for compassion-job performance relations. However, it is likely that compassion is a construct for which job content would moderate criterion-related validities to a great extent. As such, compassion measures are expected to be useful for classification purposes. Finally, construct validity evidence for compassion measures has been generally supportive, though some self-peer results have been negative.
Social Astuteness
Unidimensionality/Stability
The JPI Social Astuteness scale has been found to have internal consistency reliabilities ranging from α = .62 to .71 across four college student samples, with a mean of α = .65 (Jackson, 1994). Schneider, Roberts, and Heggestad (2002) reported that the PDRI Social Competence Inventory’s (SCI; Schneider, 1998) Social Insight scale, which has almost complete conceptual overlap with the social astuteness construct, had an alpha coefficient of .75 in a sample of 749 Air Force enlisted personnel. Social astuteness also has conceptual overlap with the CPI Psychological Mindedness scale. The CPI Psychological Mindedness scale had internal consistency reliability of α = .62 (n = 6,000; 3,000 males and 3,000 females). The Psychological Mindedness scale had a 1-year test-retest reliability coefficient of r = .60 for 237 high school students first tested as juniors, a five-year test-retest reliability coefficient of r = .51 for 91 females first tested as college seniors, and a 25-year test-retest reliability coefficient of r = .53 for 44 adult males first tested at the age of approximately 40 (Gough & Bradley, 1996).
Criterion-Related Validity
White et al. (2002) conducted a relevant study involving the use of a Social Perceptiveness scale from the Army’s Background Information Questionnaire to predict Army recruiter performance. In that study, they reported uncorrected correlations of r = .15, .14, and .17 (all p < .05), respectively, with measures of sales performance ratings, objective measures of sales volume, and a measure of overall sales performance (n = 304 to 452). The PDRI Social Competence Inventory, Version 2 (SCI-2; Schneider, 2001) Social Insight scale had estimated true operational validities (corrected for criterion unreliability only) of .24, .25, .20, and .25, respectively, with Effective Supervision, Interpersonal Sensitivity, Handling Social Challenges, and Social Presence rating criteria in a sample of 150 advanced ROTC cadets and midshipmen (Schneider & Johnson, 2004).
2-22

Construct Validity
Some of the social astuteness measures that have been developed over the years have been maximal performance measures resembling traditional cognitive ability tests (e.g., the O’Sullivan & Guilford Behavioral Cognition Tests [BCTs; O’Sullivan & Guilford, 1976]; the Chapin Social Insight Test [Chapin, 1942]), while others have more in common with personality inventories (e.g., JPI Social Astuteness scale; CPI Psychological Mindedness scale, SCI and SCI, Version 2 [SCI-2; Schneider, 2001] Social Insight scales). Some evidence of convergent validity across these two types of social astuteness measurement has been reported. For example, the CPI Psychological Mindedness scale has been found to correlate r = .32 and .35 (both p < .01) for males and females, respectively with the Chapin Social Insight Test (n = 766 males and 218 females; Gough & Bradley, 1996). On the other hand, Schneider and his colleagues (Schneider & Johnson, 2004; Schneider, Roberts, & Heggestad, 2002) found little or no correlation between the SCI/SCI-2 Social Insight scales and the O’Sullivan and Guilford BCTs. However, Schneider and Johnson (2004) questioned the construct validity of O’Sullivan and Guilford BCTs due to the fact that the BCTs’ overlap with general cognitive ability accounted for much of their predictive power as antecedents of social knowledge. Moreover, while the SCI-2’s Social Insight scale predicted conceptually related social performance criteria at significant levels, the Guilford BCTs did not.
In a university student sample (n = 208), the SCI-2’s Social Insight scale loaded on a factor with other related SCI-2 scales such as Social Appropriateness, Social Memory, Listening Skills, and Social Knowledge, providing evidence of convergent validity. This factor was not, however, observed in a sample of Air Force enlistees (Schneider, Roberts, & Heggestad, 2002).
Jackson’s (1994) multi-method factor analysis of JPI scale scores, adjective checklist ratings, self-ratings, and peer ratings (n = 70) showed rather low factor loadings for two of the four methods used to measure social astuteness (JPI scale score and peer rating score). Consistent with these results, correlations between the JPI Social Astuteness scale scores and roommate ratings of social astuteness in the different sample involving 116 college roommate-pairs were non-significant. It is not clear, however, that this is evidence against the construct validity of social astuteness measures, since individuals low on social astuteness might be expected to produce social astuteness self-ratings at odds with others’ perceptions of them. Indeed, the low self-other correlations might actually be evidence in favor of the construct validity of social astuteness measures.
Usefulness for Classification
Vanden Bosch and Oswald (2002) reported correlations between the SCI-2 Social Insight scale and the Holland RIASEC occupational types in a sample of 207 university students. The Social Insight scale correlated negatively with the Realistic (r = -.24, p < .01) and Conventional (r = -.17, p < .05) occupational types, and was uncorrelated with the other four occupational types (though there was a correlation with the Artistic type that approached statistical significance at r = .13). These data suggest that social astuteness may have some limited utility as a classification tool.
2-23
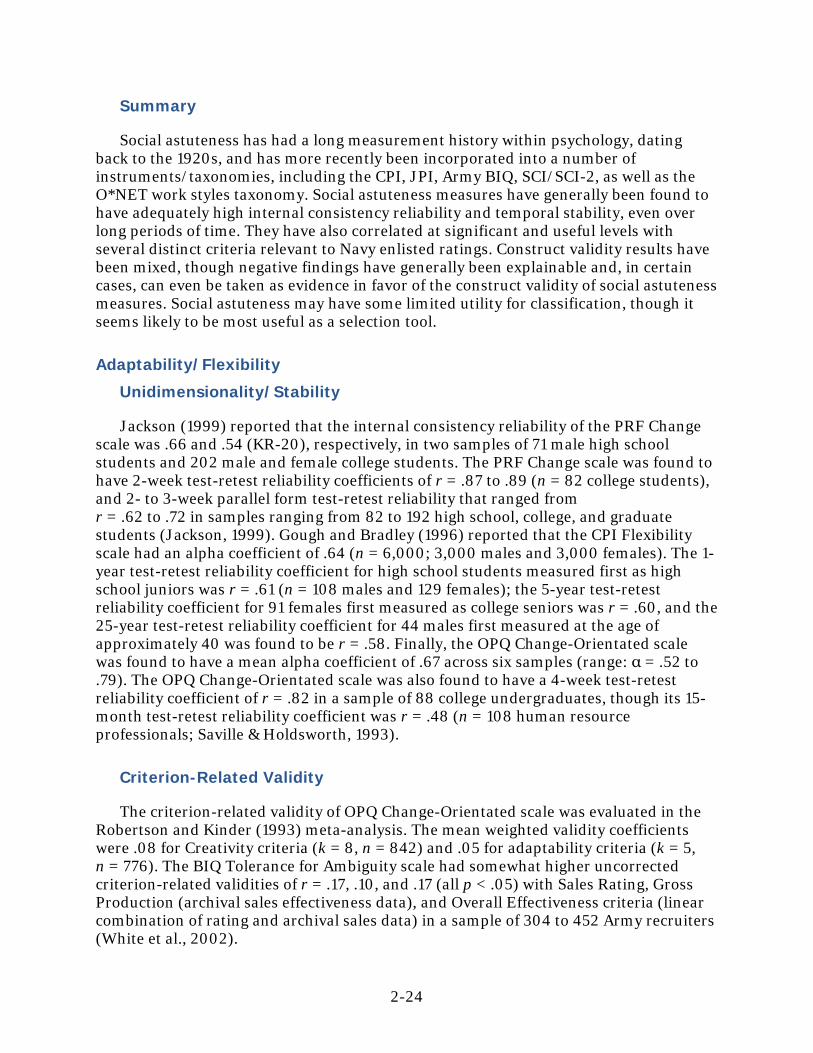
Summary
Social astuteness has had a long measurement history within psychology, dating back to the 1920s, and has more recently been incorporated into a number of instruments/taxonomies, including the CPI, JPI, Army BIQ, SCI/SCI-2, as well as the O*NET work styles taxonomy. Social astuteness measures have generally been found to have adequately high internal consistency reliability and temporal stability, even over long periods of time. They have also correlated at significant and useful levels with several distinct criteria relevant to Navy enlisted ratings. Construct validity results have been mixed, though negative findings have generally been explainable and, in certain cases, can even be taken as evidence in favor of the construct validity of social astuteness measures. Social astuteness may have some limited utility for classification, though it seems likely to be most useful as a selection tool.
Adaptability/Flexibility
Unidimensionality/Stability
Jackson (1999) reported that the internal consistency reliability of the PRF Change scale was .66 and .54 (KR-20), respectively, in two samples of 71 male high school students and 202 male and female college students. The PRF Change scale was found to have 2-week test-retest reliability coefficients of r = .87 to .89 (n = 82 college students), and 2- to 3-week parallel form test-retest reliability that ranged from r = .62 to .72 in samples ranging from 82 to 192 high school, college, and graduate students (Jackson, 1999). Gough and Bradley (1996) reported that the CPI Flexibility scale had an alpha coefficient of .64 (n = 6,000; 3,000 males and 3,000 females). The 1-year test-retest reliability coefficient for high school students measured first as high school juniors was r = .61 (n = 108 males and 129 females); the 5-year test-retest reliability coefficient for 91 females first measured as college seniors was r = .60, and the 25-year test-retest reliability coefficient for 44 males first measured at the age of approximately 40 was found to be r = .58. Finally, the OPQ Change-Orientated scale was found to have a mean alpha coefficient of .67 across six samples (range: α = .52 to .79). The OPQ Change-Orientated scale was also found to have a 4-week test-retest reliability coefficient of r = .82 in a sample of 88 college undergraduates, though its 15-month test-retest reliability coefficient was r = .48 (n = 108 human resource professionals; Saville & Holdsworth, 1993).
Criterion-Related Validity
The criterion-related validity of OPQ Change-Orientated scale was evaluated in the Robertson and Kinder (1993) meta-analysis. The mean weighted validity coefficients were .08 for Creativity criteria (k = 8, n = 842) and .05 for adaptability criteria (k = 5, n = 776). The BIQ Tolerance for Ambiguity scale had somewhat higher uncorrected criterion-related validities of r = .17, .10, and .17 (all p < .05) with Sales Rating, Gross Production (archival sales effectiveness data), and Overall Effectiveness criteria (linear combination of rating and archival sales data) in a sample of 304 to 452 Army recruiters (White et al., 2002).
2-24

Despite these low-to-modest validities, a strong rational argument can be made that Naval enlisted personnel must possess adaptability if they are to survive in today’s constantly changing military environment. Modern military personnel must adapt to new environments, roles, and cultures with ever-increasing frequency, and it seems reasonable to conclude that the non-adaptive individual will not perform well under such conditions.
Construct Validity
According to Jackson (1999), the PRF Change scale correlated r = .33 with the CPI Flexibility scale (no sample size given), and r = .23 with the Flexibility scale of the Bentler Psychological Inventory (n = 84; p < .05) (Jackson, 1999). The CPI Flexibility scale correlated much more highly with the PRF Cognitive Structure scale (r = -.70) and the PRF Order scale (r = -.61). Similarly, Gough and Bradley (1996) reported that the CPI Flexibility scale correlated r = .29 (p < .01) and r = .14 (n.s.), respectively, with the PRF Change scale in a sample of 133 males and 84 females. Again, higher correlations were observed between the CPI Flexibility scale and the PRF Order scale (r = -.47 and -.49 for males and females, respectively), and higher correlations were observed between the CPI Flexibility and PRF Cognitive Structure scales (r = -.49 and -.58 for males and females, respectively).
The CPI Flexibility and PRF Change scales are defined fairly similarly, with the exception of the fact that the CPI Flexibility scale includes orderliness versus carelessness as a component, which the PRF Change scale’s definition does not include or imply. This would account for the CPI Flexibility scale’s high correlation with the PRF Order scale.
Correlations between the PRF Change scale scores and peer ratings of change ranged from r = .22 to .38 across three college student samples ranging from 40 to 202 (four out of five of these correlations were significant at p < .05). In another sample, consisting of 90 college roommate-pairs, the self-roommate correlation associated with the PRF Change scale was r = .48 (p < .01).
Jackson’s (1999) multi-method factor analysis showed that the PRF Change scale scores loaded on the same factor as change scores yielded by the other two measurement methods and that the PRF Change scale did not load on any other factor extracted in that study, providing some evidence of both convergent and discriminant validity. Factor loadings across methods differed substantially, however, ranging from .35 to .73.
Usefulness for Classification
The Borman et al. (1999) work on O*NET work styles indicated that the rated importance of adaptability/flexibility varies substantially across occupations, with the largest effect size between occupations exceeding one standard deviation. The Hogan and Blake (1996) work showed that the CPI Flexibility scale correlated r = -.22 with the Artistic occupational type, and was uncorrelated with the other five RIASEC occupational types, suggesting less utility as a classification tool than the Borman et al.
2-25

work. It is therefore uncertain whether adaptability/flexibility will have utility as a classification tool. Rationally, it would seem more likely that adaptability/flexibility would be more useful as a selection tool, since it should be relatively important for most Navy enlisted ratings.
Summary
Constructs related to adaptability/flexibility have been incorporated into the PRF, the OPQ, the CPI, and the O*NET work style taxonomy. The adaptability/flexibility construct did not, however, fare especially well against the Ferstl et al. (2003) taxonomic inclusion criteria. Reliabilities varied, with internal consistency reliabilities ranging from inadequate to good, and test-retest reliability coefficients ranging from modest to good. Criterion-related validities were poor, even against criteria that were closely related to adaptability/flexibility conceptually. Construct validity evidence showed only limited convergent validity caused, at least in part, by lack of definitional consistency among personality researchers. Evidence regarding the utility of adaptability/flexibility measures for classification purposes was mixed.
Despite these findings, adaptability/flexibility is a construct that seems impossible to ignore as a potential predictor of success in enlisted military occupations. The Borman et al. (1999) research on work styles revealed that adaptability/flexibility is an important job requirement across diverse occupations, and Pulakos, Arad, Donovan, and Plamondon (2000) showed that adaptability is a critically important criterion construct in military settings. On the strength of this research base, researchers have already begun to assimilate adaptability into the evolving taxonomic structure of job performance (e.g., Johnson, 2003).
Previous attempts to measure adaptability/flexibility in no way indicate that this construct is impossible to measure successfully, and recently gained insights into the nature of the construct will facilitate future attempts to measure it. Moreover, Ferstl et al. (2003) explicitly allow for inclusion in the NCAPS taxonomy of more experimental predictor constructs, assuming a reasonable expectation of successful measurement and prediction. As such, we regard adaptability/flexibility as a viable candidate for measurement by NCAPS.
Impulsivity/Self-control
Unidimensionality/Stability
Tellegen and Waller (in press) reported a mean alpha coefficient of .83 for the MPQ Control scale (n = 300 college men, 500 college women, 223 community men, and 391 community women), with a 30-day test-retest reliability coefficient of r = .82 (n = 75 college men and women).
2-26

Jackson (1999) reported internal consistency reliabilities of .72 and .67 (KR-20) for the PRF Impulsivity scale in samples of 71 male high school students and 202 male and female college students, respectively. Jackson further reported a 2-week test-retest reliability coefficient of r = .93 in a sample of 82 college students, and parallel form test-retest reliability coefficients ranging from r = .72 to .83 in samples ranging from 82 to 192 high school, college, and graduate students.
Gough and Bradley (1996) reported that the CPI Self-Control scale had an internal consistency reliability of α = .83 (n = 6,000; 3,000 males and 3,000 females) and a 1-year test-retest reliability coefficient of r = .73 (n = 237 high school students first tested as juniors), a 5-year test-retest reliability coefficient of r = .73 (n = 91 females first tested as college seniors), and a 25-year test-retest reliability coefficient of r = .50 (n = 44 males first tested at the age of approximately 40).
White, Gregory et al. (2001) reported internal consistency reliability of α = .64 for the ARC Impulsiveness scale (n = 298 Army correctional specialists).
The OPQ Emotional Control scale had a mean internal consistency reliability of α = .73 (range = .57 to .85) across six samples. By far the largest of these samples (n = 2,987 individuals drawn from the British general population) was α = .76 (Saville & Holdsworth, 1993). The OPQ Emotional Control scale had 4-week test-retest reliability coefficient of r = .87 (n = 88 college undergraduates) and a 15-month test-retest reliability coefficient of r = .67 (n = 108 human resource professionals).
Reise and Waller’s (1990) evaluation of the unidimensionality of the MPQ primary scales for IRT analysis purposes provides additional evidence of the unidimensionality of the MPQ Control scale and, therefore, of impulsivity/self-control measures.
Criterion-Related Validity
The HPI Impulse Control HIC correlated r = -.30 (p < .01) with both explosive ordnance disposal (EOD) diving success and EOD course success in a sample of 97 EOD technician trainees in the Navy (J. Hogan & R. Hogan, 1989). The ARC Impulsiveness scale correlated r = -.13 (p < .05), -.11 (n.s.), and .12 (p < .05) with supervisor ratings of performance, number of disciplinary incidents (Article 15 incidents and/or letters of reprimand), and a unit-weighted combination of supervisory ratings and number of disciplinary incidents, respectively, in a sample of 298 Army correctional specialists. In the Robertson and Kinder (1993) meta-analysis, the OPQ Emotional Control scale had an average weighted uncorrected validity coefficient of .10 against Resilience criteria (k = 10, n = 1,152) and .05 against Adaptability criteria (k = 5, n = 776). Finally, the PRF Impulsivity scale correlated r = .24 (p < .05) with a Fraud criterion, though not with Rule-Breaking or Pilferage criteria, in sample of 52 undergraduates (Mikulay & Goffin, 1998).
2-27

Construct Validity
The CPI Self-Control scale correlated r = .47 and .23 (both p < .05) with the MPQ Control scale in samples of 111 college females and 62 college males, respectively. The CPI Self-Control scale correlated r = -.36 and -.52 (both p < .01) in samples of 133 males and 84 females, respectively, with the PRF Impulsivity scale (Gough & Bradley, 1996). In a joint factor analysis of the MPQ, PRF, and 16PF scales, the MPQ Control and PRF Impulsivity scales both had very high loadings on the same factor (.66 and -.70, respectively), and loaded similarly on the other three factors that were extracted (Tellegen & Waller, in press).
The OPQ Emotional Control scale correlated r = -.32 with the 16PF Liveliness scale and r = -.31 with the 16PF Social Boldness scale (both n = 2,007; Saville & Holdsworth, 1993). This is about what one would expect, given that the definitions of these two 16PF scales both involve not only aspects of self-control but also other facets that are not related to self-control.
Correlations between the PRF Impulsivity scale scores and peer ratings of impulsivity ranged from r = .30 to .36 across three college student samples ranging in size from 40 to 202. In another sample, consisting of 90 college roommate pairs, the self-roommate correlation associated with the PRF Impulsivity scale was r = .56 (Jackson, 1999). Jackson’s multi-method factor analysis showed that the PRF Impulsivity scale scores loaded on the same factor as impulsivity scores yielded by the other two measurement methods. The PRF Impulsivity scale did not load on any other factor extracted in that study.
Usefulness for Classification
The Hogan and Blake (1996) work showed that the MPQ Control scale displays a pattern of correlations that vary modestly across the six RIASEC occupational types. The correlations ranged from r = -.16 for the Artistic occupational type to r = .22 with the Conventional occupational type. Correlations with the Investigative, Social, and Enterprising occupational types were negligible. The Borman et al. (1999) work on O*NET work styles showed that self-control requirements varied substantially across occupations, with the largest effect size between occupations exceeding 1.30. Taken together, this work suggests that the impulsivity/self-control construct will have modest to good utility as a classification tool.
Summary
Constructs related to impulsivity/self-control appear in several prominent personality instruments/taxonomies, including the CPI, MPQ, OPQ, PRF, and O*NET work style taxonomy. Measures of impulsivity/self-control have been shown to be internally consistent and temporally stable. Criterion-related validity results have been mixed; though the study with the greatest relevance to Navy enlisted ratings (J. Hogan & R. Hogan, 1989) did reveal a sizable uncorrected correlation between an impulsivity/self-control measure and the training and job performance of Navy EOD personnel. The weight of construct validity evidence generally supports the convergent
2-28

and discriminant validity of impulsivity/self-control measures, though the strength of that support varies somewhat. The available research suggests that impulsivity/self-control may have at least some utility as a classification tool.
Adventurous/Courageous
Unidimensionality/Stability
Harmavoidance and risk-taking scales are conceptually closest to our adventurous/courageous construct, and we therefore focus our attention on measures of those constructs in evaluating our adventurous/courageous construct for possible inclusion in NCAPS. Tellegen and Waller (in press) reported a mean alpha coefficient of .83 for the MPQ Harmavoidance scale (n = 300 college men, 500 college women, 223 community men, and 391 community women), with a 30-day test-retest reliability coefficient of r = .88 (n = 75 college men and women). Jackson (1999) reported internal consistency reliabilities of .80 and .83 (KR-20) for the PRF Harmavoidance scale in samples of 71 male high school students and 202 male and female college students, respectively. Jackson further reported a 2-week test-retest reliability coefficient of r = .96 in a sample of 82 college students, and parallel form test-retest reliability coefficients ranging from r = .84 to .85 in samples ranging from 82 to 192 high school, college, and graduate students. Similarly, the JPI Risk-Taking scale had internal consistency reliabilities ranging from α = .82 to .84 across four university student samples ranging from 82 to 1,107 (Jackson, 1994).
Reise and Waller’s (1990) evaluation of the unidimensionality of the MPQ primary scales for IRT analysis purposes provides additional evidence of the unidimensionality of the MPQ Harmavoidance scale and, therefore, of adventurous/courageous measures.
Criterion-Related Validity
The 5-item HPI Not Thrill Seeking HIC correlated r = .16 and .22 (both p < .05) with explosive ordnance disposal diving success and course success, respectively (n = 97 Navy enlisted EOD trainees), and r = 28 (p < .05) with EOD rank in a sample of 48 EOD enlisted fleet technicians (J. Hogan & R. Hogan, 1989). Mikulay and Goffin (1998) found that the JPI Risk Taking scale correlated r = .33, .29, and .39 with Fraud, Rule-Breaking, and Pilferage criteria, respectively (all p < .05). Ashton (1998) reported that the JPI Risk Taking scale correlated r = .30 (p < .01) with an overall self-reported Delinquency criterion (e.g., alcohol abuse, unsafe behavior, goldbricking, theft, and vandalism) in sample of 131 undergraduates.
2-29

Construct Validity
Harmavoidance, as defined by both Jackson and Tellegen is the opposite pole of the adventurous/courageous construct. For example, the negative pole of the PRF Harmavoidance scale in defined by adjectives such as “adventurous, daring, fearless, bold, intrepid, brave, audacious, rash, game, thrill-seeking, and courageous” (Jackson, 1999, p. 6). Similarly, Tellegen (1982) defined the individual high on Harmavoidance as someone who “does not enjoy the excitement of adventure and danger... [and who] prefers safer activities even if they are tedious or aggravating” (p. 8). Therefore, investigating the construct validity of Harmavoidance scales is essentially the same thing as investigating the construct validity of adventurous/courageous measures.
There is strong evidence of convergent validity of measures related to adventurousness/courageousness. In the Tellegen and Waller (in press) joint factor analysis of MPQ, PRF, and 16PF scales, the MPQ and PRF Harmavoidance scales have very similar patterns of factor loadings, with both loading primarily on a factor labeled Constraint. Jackson (1999) reported that the PRF Harmavoidance scale correlated r = -.58 (p < .01) with the Adventurous scale of the Jackson Vocational Interest Survey in a sample of 100 male college students. Jackson (1994) reported that the JPI Risk Taking scale correlated r = -.57 and -.61 with the PRF Harmavoidance scale for males and females, respectively (n = 100 male and 115 female college students; both p < .01). For both males and females, this was the highest correlation between the JPI Risk Taking scale and any other PRF scale.
Self-other correlations are also generally quite supportive of the construct validity of adventurousness/courageousness measures. Jackson (1999) reported a study of self-roommate pairs in which the self-roommate correlation was r = .45 (p < .05). Correlations between PRF Harmavoidance scale scores and peer ratings of harmavoidance behavior ranged from r = .53 to .62 across three college student samples ranging from 40 to 202. Correlations between PRF Harmavoidance scale scores and self-ratings of harmavoidance on a trait rating form were r = .40 and .42 in separate samples of 40 and 51 university students, respectively. Jackson’s (1999) multi-method factor analysis showed that the PRF Harmavoidance scale scores loaded on the same factor as harmavoidance scores yielded by the other two measurement methods, and that the factor loadings were similar across measurement methods. The PRF Harmavoidance scale did not load on any other factor extracted in that study.
Jackson (1994) reported that the correlation between JPI Risk Taking scale scores and roommate-rated risk-taking behavior was r = .43 (p < .01; n = 116 self-roommate pairs). Jackson (1994) also cited evidence that the JPI Risk Taking scale scores correlated with monetary, physical, and social risk-taking, all at r > .59. In his multi-method factor analysis of JPI scale scores, adjective checklist, self-ratings, and peer ratings, factor loadings defining a Risk Taking factor across methods ranged from .57 to .88, with a mean absolute value of construct-irrelevant loadings = .07.
2-30

Usefulness for Classification
Randolph and Wood (1998) reported mean PRF Harmavoidance scores obtained by 67 male and 90 female university undergraduates classified into the RIASEC occupational type on which they scored most highly. Harmavoidance t-scores (i.e., scores that are standardized, with a mean of 50 and a standard deviation of 10) ranged from a low of 46.9 on the Enterprising scale to a high of 52.4 on the Social scale. This represents a difference of approximately .50 standard deviations. Hogan and Blake (1996) reported correlations between the MPQ Constraint factor (on which Harmavoidance loads highly and positively; Tellegen & Waller, in press) and the six RIASEC occupational scales ranging from a low of r = -.29 with the Artistic occupational type to a high of r = .24 with the Conventional occupational type.
Hogan and Blake’s (1996) results are at odds with the Randolph and Wood results, which reported PRF Harmavoidance scale mean t-scores of 51.7 on the Artistic occupational type scale and 48.4 on the Conventional occupational type scale. The Hogan and Blake work is probably the more compelling of these two sources of evidence, given that classification into a RIASEC occupational type in the Randolph and Wood study was based on the occupational type scale on which subjects scored most highly, regardless of how highly they scored on the occupational type scale into which they were classified, or how much more highly they scored on that scale than on the other occupational type scales. This renders the Randolph and Wood results less compelling. It also bears mention that the number of individuals falling within each of the six RIASEC types in the Randolph and Wood study was small (n = 18 to 41; median n = 23.5), making their mean PRF Harmavoidance scale scores somewhat unstable, and rendering their findings suggestive at best. Based on the foregoing, we believe that measures of the adventurous/courageous construct may have modest utility as classification tools, but the evidence for this is somewhat indirect and inconsistent.
Summary
Measures conceptually close to the adventurous/courageous construct have been shown to be internally consistent and temporally stable, with good criterion-related validities in both military and non-military samples against diverse criteria. The available evidence is also supportive of the convergent and discriminant validity of adventurousness/courageousness measures, including self-other correlations. While somewhat indirect and inconsistent, the available evidence also indicates that adventurous/courageous measures may have modest utility for classification purposes, in addition to being useful as selection tools.
2-31

Dependability
Unidimensionality/Stability
Hough et al. (1990) reported that the ABLE Conscientiousness scale had α = .72 (n = 8,504 military enlistees) and 1- to 2-week test-retest reliability of r = .74 (n = 408 to 414 military enlistees). The ABLE Conscientiousness scale “assesses a person’s tendency to be reliable. The person who scores high on the Conscientiousness scale is well-organized, planful, prefers order, thinks before acting, and holds him- or herself accountable. The person who scores low tends to be careless and disorganized and to act on the spur of the moment” (Hough et al., 1990, p. 585). This definition is very close to our dependability construct definition, and does not include facets of achievement, as do many other conscientiousness measures (e.g., NEO-PI-R and other Big-Five Conscientiousness measures; cf. Costa & McCrae, 1992). As such, the Hough et al. results are highly relevant to this analysis.
Providing further support for the internal consistency of dependability, Kamp (1991) reported that the Job Candidate Profile (JCP; Kamp, 1991) Dependability scale had internal consistency of α = .86 (n = 3,522 job applicants for blue-collar and hourly white-collar positions).
The high scorer on the OPQ Conscientious scale: “sticks to deadlines, completes jobs, perseverance with routine, [and] likes fixed schedules.” Thus, the OPQ conscientious scale also has significant, though not complete, overlap with our dependability construct. The OPQ Conscientious scale was found to have a mean internal consistency reliability of α = .64 (range: α = .45 to .80) across six samples. By far the largest sample (n = 2,987 individuals drawn from the British general population), however, yielded α = .80. Four-week test-retest reliability in a sample of 88 undergraduate students was found to be r = .87 for the OPQ Conscientious scale; 15-month test-retest reliability for the OPQ Conscientious scale was r = .55 in a sample of 108 human resource professionals (Saville & Holdsworth, 1993).
Criterion-Related Validity
Meta-analytic evidence reported by Mount and Barrick (1995) revealed estimated true validities for dependability measures of ρ = .30 (k = 133, n = 26,234) with Overall Job Proficiency criteria and ρ = .47 with Employee Reliability criteria (k = 13, n = 15,054). The corresponding uncorrected mean correlations are .17 and .27 for Overall Job Proficiency and Employee Reliability criteria, respectively. Mount and Barrick (1995) also reported estimated true validities of ρ > .30 for Training Proficiency, Effort, Quality, Administration, and Combat Effectiveness criteria.
In other meta-analytic work, Hough (1992) reported uncorrected mean correlations of -.24 with Irresponsible Behavior criteria (k = 69, n = 98,676) and .58 with Law-Abiding Behavior criteria (k = 22, n = 25,867). Hough (1998), in meta-analytic work limited to predictive criterion-related validity studies only, reported an uncorrected mean correlation of -.23 with Counterproductive Behavior criteria (k = 24, n = 56,603).
2-32

White, Young, and Rumsey (2001) reported that the ABLE-114 Dependability scale had concurrent validities of r = .16, .18, and .20 (all p < .01) against Effort, Leadership, and Personal Discipline criteria, respectively (n = 590 enlisted soldiers) and predictive validities of r = .10 (p < .05), .16 (p < .01), and .20 (p < .01), respectively, for the same criteria and sample over a period of approximately five years.
White, Gregory et al. (2001) reported that the AIM Dependability scale correlated r = .29, -.29 and .36 (all p < .05) with supervisor ratings of performance, number of disciplinary incidents (i.e., Article 15 and/or letters of reprimand), and a unit-weighted combination of supervisory ratings and number of disciplinary incidents, respectively, in a sample of 298 Army correctional specialists.
In the Robertson and Kinder (1993) meta-analysis, the OPQ Conscientious scale had an average weighted validity coefficient of .07 against Planning/Organizing criteria (k = 17, n = 1,859).
Finally, Kamp (1991) reported that the JCP Dependability scale had a mean uncorrected correlation of .31 across a variety of criteria, including number of days absent and number of disciplinary write-ups; supervisory ratings of following company policies, sticking to work schedule, attendance, and dependability; self-reported paid work time missed; on-the-job alcohol use; and on-the-job marijuana use (validities ranged from .23 to .41 [ns ranged from 59 to 561]).
Construct Validity
The NEO-PI-R Self-Discipline facet scale relates fairly closely to our dependability construct. It is defined as: “the ability to begin tasks and carry them through to completion despite boredom and other distractions” (Costa & McCrae, 1992, p. 18). The NEO-PI-R Self-Discipline facet has its highest convergent validity correlations (r > .50) with the Orderly and Persistent scales of the Interpersonal Style Inventory (ISI; Lorr, 1986), and the CPI Achievement via Conformance scale (Costa & McCrae, 1992). Costa and McCrae (1992) also reported that the NEO-PI-R Self-Discipline facet had a self/peer correlation of r = .33 (n = 250) and a self/spouse correlation of r = .23 (n.s.; n = 68).
Some of the most impressive construct validity evidence of the dependability construct, however, comes from the criterion-related validity evidence cited above. These correlations, many of them based on military samples and theoretically related criteria (e.g., sticking to work schedule, employee reliability) provide impressive convergent validity evidence.
Usefulness for Classification
The Borman et al. (1999) O*NET work style data revealed moderate variability in dependability requirements across occupations, with a maximum effect size of approximately .60. Hough (1992) reported differential validity across occupations for dependability measures, with mean uncorrected correlations against Job Proficiency criteria of -.03 for managers and executives (k = 22, n = 3,213) versus .24 for health-care workers (k = 15, n = 758). These results suggest that dependability measures may have some utility as classification tools for the Navy. It should be noted, however, that within
2-33

the greater structure that characterizes military culture, differences in dependability requirements across occupations will likely become attenuated, making dependability measures less useful for classification.
Summary
Dependability, and measures closely related to it, have been successfully measured in a number of prominent personality inventories and are part of many personality taxonomies. Dependability measures have been shown to be internally consistent and temporally stable and to correlate with a wide variety of important criteria, even when the correlations are uncorrected and longitudinal. Much of the criterion-related validity evidence involves criteria that are theoretically related to dependability and, as such, provide excellent evidence of construct validity as well. Available data indicate that dependability measures may have some limited utility as classification tools, though their primary usefulness to the Navy is likely to be in the selection domain.
Dutifulness/Integrity
Unidimensionality/Stability
Hough et al. (1990) reported that the ABLE Non-Delinquency scale had internal consistency of α = .81 (n = 8,482 military enlisted personnel) and 1- to 2-week test-retest reliability of r = .80 (n = 408 to 414 military enlisted personnel).
Gough and Bradley (1996) reported that the CPI Responsibility scale had internal consistency reliability of α = .77 (n = 6,000; 3,000 males and 3,000 females), 1-year test-retest reliability of r = .68 (n = 237 high school students first tested as juniors); 5-year test-retest reliability of r = .67 (n = 91 females first tested as college seniors), and 25-year test-retest reliability of r = .59 (n = 44 males first tested at the age of approximately 40).
The JPI Responsibility scale has been found to have internal consistency reliabilities ranging from α = .66 to .70 across four university samples ranging from 82 to 1,107, with a mean of α = .68 (Jackson, 1994).
Conn and Rieke (1994) reported that the 16PF Rule-Consciousness scale had an internal consistency reliability of α = .75 (n = 4,660 drawn from the general population, as well as undergraduate/graduate students.). They further reported that the Rule-Consciousness scale had 2-week test-retest reliability of r = .80 and 2-month test-retest reliability of r = .76 (n = 159 undergraduates).
Chernyshenko et al. (2001) provided additional evidence regarding the unidimensionality of the 16PF Rule-Consciousness scale and, therefore, of dutifulness/integrity measures. In addition to their analysis of eigenvalue plots obtained from synthetic and real data sets based on tetrachoric intercorrelations of 16PF Rule-Consciousness scale items, their CFA to evaluate the fit of a 1-factor model of 16PF Rule-Consciousness scale items supported the unidimensionality of that scale. The Root Mean Squared Error of Approximation (RMSEA) was .07, and the Goodness of Fit Index
2-34

(GFI) was .96. The Comparative Fit Index (CFI) was .87, which is somewhat lower than the recommended level, but after evaluating the totality of unidimensionality data, Chernyshenko et al. concluded that the 16PF Rule-Consciousness scale is sufficiently unidimensional for IRT analysis. This provides further support for the unidimensionality of dutifulness/integrity measures.
Criterion-Related Validity
Hough et al. (1990) reported that the ABLE Non-Delinquency scale correlated r = .29, .22, and .18 (all p < .01) with Personal Discipline, Physical Fitness & Military Bearing, and Effort & Leadership criteria, respectively (n = 7,666–8,477 Army enlisted personnel). White, Gregory et al. (2001) reported that the Assessment of Right Conduct (ARC) Hostility to Authority scale correlated r = -.32, -.25, and .32 (all p < .05) with supervisor ratings of performance, number of disciplinary incidents (i.e., Article 15 and/or letters of reprimand), and a unit-weighted combination of supervisory ratings and number of disciplinary incidents, respectively, in a sample of 298 Army correctional specialists.
In non-military samples, the JPI Responsibility scale correlated r = .01, -.34, and -.34 with Fraud, Rule Breaking, and Pilferage criteria, respectively (the latter 2 correlations are p < .05) in sample of 52 undergraduates (Mikulay & Goffin, 1998) and r = -.40 (p < .01) with an overall self-reported Delinquency criterion (e.g., alcohol abuse, unsafe behavior, goldbricking, theft, vandalism) in sample of 127 undergraduates (Ashton, 1998).
Construct Validity
Jackson (1994) reported that the JPI Responsibility scale correlated most highly (r = .77) with the Law Abidance scale of the Bentler Interactive Psychological Inventory (no reference provided) as well as with measures of “ethical risk-taking.” In a multi-method factor analysis of JPI scale scores, adjective checklist ratings, self-ratings, and peer ratings, the factor loadings defined a Responsibility factor across methods (n = 70). Loadings for three of the methods (JPI scale score, adjective checklist score, and self-rating) ranged from .46 to .52, and the loading for peer ratings was .28. The mean absolute value of construct-irrelevant loadings was .12. Consistent with the multi-method factor analysis results, Jackson (1994) reported that the correlation between JPI Responsibility scale scores and roommate-rated responsibility was r = .17 (n.s.) in a sample of 116 self-roommate pairs.
According to Costa and McCrae (1992), and consistent with the self/peer correlations found by Jackson (1994), the NEO-PI-R Dutifulness facet scale, which relates more closely than any other NEO-PI-R facet scale to our dutifulness/integrity construct, had a self/peer correlation of r = .28 (p < .05; n = 250) and self/spouse correlation of r = .23 (n.s.; n = 68). When correlated with a variety of other personality instruments, the NEO-PI-R Dutifulness facet scale correlated most highly with the CPI Achievement via Conformance scale (r = .43, p < .01, n = 216 to 348) and the MMPI Antisocial scale (r = -.41, p < .01, n = 170), providing evidence of convergent validity.
2-35

Gough and Bradley (1996) reported that the CPI Responsibility scale correlated r = .29 (n = 93 males) and r = .52 (n = 111 females) with the 16PF Rule-Conscious scale. They also report that the CPI Responsibility scale’s highest correlations with the PRF scales are with PRF Achievement (r = .31, females; r = .37, males); Impulsivity (r = -.28, males; r = -.41, females); and Aggression (females only: r = -.47) (n = 133 males, 84 females).
Finally, it should again be noted that the criterion-related validity evidence cited in support of this construct provides additional evidence of the construct validity of the dutifulness/integrity construct.
Usefulness for Classification
The data reported by Cattell et al. (1970) indicate that the 16PF Rule-Consciousness scale had the lowest standard deviation across the 10 relevant occupations of any of the 16PF scales. The Borman et al. (1999) O*NET work style data, however, indicated significant variability in integrity requirements across occupations, with a maximum cross-occupation effect size of approximately 1.4 standard deviations. The available data are therefore equivocal regarding the utility of dutifulness/integrity scales for classification purposes. Once again, we note that duty and integrity are so deeply engrained in the military culture that the dutifulness/integrity requirements across occupations may be so similar as to mitigate whatever classification utility such measures might otherwise have. On the other hand, a reasonable argument could be made that the consequences of lack of integrity or failure to do one’s duty are greater for some enlisted ratings than for others. For example, it would seem important that sailors working on high-security matters be higher on dutifulness/integrity than sailors working in a janitorial capacity.
Summary
Dutifulness/integrity measures are internally consistent/unidimensional and temporally stable. The weight of evidence indicates that dutifulness/integrity measures correlate at useful levels with a variety of theoretically relevant and important criteria in both military and non-military settings. The weight of evidence further indicates that dutifulness/integrity measures show evidence of both convergent and discriminant validity. Self-other correlations may appear somewhat low, but are in line with criterion-related validity coefficients and, when conceptualized in that way, can be regarded as evidence of convergent validity (or, at the very least, should not be regarded as evidence against the construct validity of dutifulness/integrity measures). Correlations between measures of dutifulness/integrity (e.g., CPI Responsibility, 16PF Rule-Consciousness) provide further evidence of convergent validity (especially for females). It was perhaps a little odd that the NEO-PI-R Dutifulness facet scale correlated higher with the CPI Achievement via Conformance scale than it did with the CPI Responsibility scale, given that the latter is much more highly related conceptually to our dutifulness/integrity construct, but Achievement via Conformance is also conceptually related to dutifulness/integrity, so the correlation between NEO-PI-R Dutifulness and CPI Achievement via Conformance makes sense, and can be regarded as evidence of convergent validity.
2-36

Attention to Detail
Unidimensionality/Stability
The OPQ Detail Conscious scale had a mean internal consistency reliability of α = .75 (range = .66 to .81) across six samples. By far the largest of the samples (n = 2,987 individuals drawn from the British general population) was α = .74 (Saville & Holdsworth, 1993). The OPQ Detail Conscious scale had 4-week test-retest reliability of r = .84 (n= 88 college undergraduates) and 15-month test-retest reliability of r = .65 (n = 108 human resource professionals).
Schmit et al. (2000) reported that the Attention to Detail facet scale of the GPI was found to have an alpha coefficient of .77 (n = 303) in a United States sample, and a mean alpha coefficient of .79 across 12 distinct samples in 11 countries (mean n = 173).
The JPI Organization scale had internal consistency reliabilities ranging from α = .74 to .79 across four university samples ranging from 82 to 1,107, with a mean of α = .77 (Jackson, 1994).
Jackson (1999) reported internal consistency reliabilities of .85 (KR-20) for the PRF Order scale in each of 2 samples: 71 male high school students and 202 male and female college students. Jackson further reported 2-week test-retest reliability of r = .94 in a sample of 82 college students, and 2- to 3-week parallel form test-retest reliability coefficients ranging from r = .81 to .84 in samples ranging from 82 to 192 high school, college, and graduate students.
Criterion-Related Validity
Validity data associated with the attention to detail construct is somewhat sparse. In the Robertson and Kinder (1993) meta-analysis, the OPQ Detail Conscious scale had a mean weighted uncorrected validity coefficient of .06 against Planning/Organizing criteria (k = 17; n = 1,859). The Planning/Organizing criteria used in that study, however, do not overlap fully with detail consciousness. Neither the OPQ Detail Conscious scale nor our attention to detail construct incorporate planning, resulting in a mismatch in construct content and breadth that could be responsible for driving down the validity coefficient. Hough et al. (1990) found more favorable criterion-related validity results. They found that the ABLE Conscientiousness scale had uncorrected validities of r = .23, .22, and .18, respectively (all p < .01), with Personal Discipline, Physical Fitness & Military Bearing, and Effort & Leadership criteria (n = 7,666 to 8,477 enlisted military personnel). While the ABLE Conscientiousness scale is not a perfect overlap with our attention to detail construct, there is substantial content overlap, making the Hough et al. (1990) validity findings relevant to this analysis. The relevance of their findings is enhanced by the fact that their results were based on a large sample of military enlisted personnel, whereas the Robertson and Kinder meta-analytic results were not based on military samples.
2-37

Construct Validity
Jackson (1994) reported that the JPI Organization scale correlated most highly with the PRF Order scale (r = .77 for females, r = .84 for males), r = .73 with the Bentler Psychological Inventory Orderliness scale, and r = -.68 with the PRF Impulsivity scale (for males).
In Jackson’s (1994) multi-method factor analysis of JPI scale scores, adjective checklist ratings, self-ratings, and peer ratings, factor loadings defined an Organization factor across methods (n = 70). Loadings for three of the methods (JPI Organization scale score, adjective checklist score, and self-rating) ranged from .69 to .85, and the loading for peer ratings was .46. The mean absolute value of construct-irrelevant loadings was .09.
In PRF research reported by Jackson (1999), correlations between PRF Order scale scores and peer ratings of order ranged from r = .63 to .64 across three college student samples ranging from 40 to 202.
Jackson (1999) also reported correlations of r = .81 between the PRF Order scale and the Bentler Psychological Inventory Orderliness scale (n = 84) and r = -.61 with the CPI Flexibility scale. The latter correlation makes sense in light of the fact that the CPI Flexibility scale’s negative pole is defined, in part, as being “well-organized” (Gough & Bradley, 1996, p. 13).
Jackson’s (1999) multi-method factor analysis showed that the PRF Order scale scores loaded on the same factor as order scores yielded by the other two measurement methods, and the factor loadings are similar across measurement methods. The PRF Order scale did not load on any other factor extracted in that study.
According to Costa and McCrae (1992), the NEO-PI-R Order facet scale, which relates closely to our attention to detail construct, had a self/peer correlation of r = .36 (p < .01; n = 250) and a self/spouse correlation of r = .48 (p < .01; n = 68). When correlated with a variety of other personality instruments, the NEO-PI-R Order facet correlated most highly with the PRF Order scale (r = .71, p < .01 n = 203-296).
The OPQ Detail Conscious scale correlated r = .41 with the 16PF Perfectionism (Q3) scale (n = 2,007). The 16PF Perfectionism (Q3) scale is defined in part by organization and precision (Conn and Rieke, 1994, p. 18). This is, therefore, further evidence of the convergent validity attention to detail measures (Saville & Holdsworth, 1993).
Usefulness for Classification
The Borman et al. (1999) O*NET work style data indicated moderate variability in attention to detail requirements across occupations, with a maximum cross-occupation effect size of approximately .75 standard deviations. In their joint factor analysis of MPQ, 16PF, and PRF scales, Tellegen and Waller (in press) found that the PRF Order scale had virtually the same pattern of factor loadings as the MPQ Control scale, suggesting a close relationship between those two scales. Hogan and Blake (1996) reported correlations between the MPQ Control scale and the six RIASEC occupational types. In general, they reported little variability in correlations across RIASEC types, with the only correlation above ± .20 involving the Conventional occupational type (r = .22).
2-38

Randolph and Wood (1998) reported mean PRF Order scores obtained by 67 male and 90 female university undergraduates classified into the RIASEC occupational type on which they scored most highly. Order t-scores ranged from a low of 46.7 on the Investigative occupational type scale to a high of 55.0 on the Social occupational type scale. This represents a difference of approximately .80 standard deviations. The foregoing results suggest that attention to detail measures will have at most modest utility as classification tools.
Summary
Attention to detail measures have been found to be internally consistent and temporally stable. Criterion-related validity evidence provides a basis for optimism. Some meta-analytic results have been negative, while others have been more positive. The negative results appear dismissible, at least in part, on rational grounds. Construct validity evidence for attention to detail measures reveals excellent convergent and discriminant validity. The utility of attention to detail measures for classification appears modest.
Stress Tolerance
Unidimensionality/Stability
Hough et al. (1990) reported that the ABLE Emotional Stability scale has an internal consistency reliability of α = .81 in a sample of 8,522 military enlistees, and 1- to 2-week test-retest reliability of r = .74 (n = 408 to 414 military enlistees).
Tellegen and Waller (in press) reported a mean alpha coefficient of .89 for the MPQ Stress Reaction scale (n = 300 college men, 500 college women, 223 community men, and 391 community women), with a 30-day test-retest reliability coefficient of .89 (n= 75 college men and women).
Conn and Rieke (1994) reported that the 16PF Apprehension scale had an internal consistency reliability of α = .78 (n = 4,660 drawn from the general population as well as undergraduate/graduate students.). They further reported that the 16PF Apprehension scale had 2-week test-retest reliability of r = .79 and 2-month test-retest reliability of r = .64 (n = 159 undergraduates). The 16PF also has a higher-order scale measuring anxiety that is relevant to this analysis. For this scale, Conn and Rieke report internal consistency reliability of α = .78, 2-week test-retest reliability of r = .75 and 2-month test-retest reliability of r = .67 (n = 159 undergraduates).
The OPQ Relaxed scale had a mean internal consistency reliability of α = .80 (range: α = .73 to .86) across six samples. By far the largest of the samples (n = 2,987 individuals drawn from the British general population) was α = .83 (Saville & Holdsworth, 1993). The OPQ Relaxed scale had 4-week test-retest reliability of r = .90 (n = 88 college undergraduates) and 15-month test-retest reliability of r = .67 (n = 108 human resource professionals).
2-39

The JPI Anxiety scale has been found to have internal consistency reliabilities ranging from α = .77 to .85 across four university samples ranging from 82 to 1,107, with a mean of α = .82 (Jackson, 1994).
In the unidimensionality analysis described above, Chernyshenko et al. (2001) concluded that the 16PF Apprehension scale met the test for unidimensionality for IRT purposes. In their confirmatory factor analysis, they reported that the 16PF Apprehension scale had RMSEA = .07, GFI = .97, and NFI and CFI values equal to .90. Similarly, Reise and Waller (1990) concluded that the MPQ Stress Reaction scale met IRT unidimensionality requirements as well. These data provide converging evidence that measures of stress tolerance measures are largely unidimensional.
Criterion-Related Validity
After conscientiousness, emotional stability has proven to be the next best of the Big-Five constructs in terms of criterion-related validity (Barrick et al., 2001; Judge & Bono, 2001). Moreover, some research has suggested that emotional stability is more important in predicting occupational success in military occupations than it is in civilian occupations (Barrick et al., 2001; Salgado, 1998; Vickers, 1995). For example, in a meta-analysis based on European samples, Salgado (1998) reported a mean corrected validity of .12 for Emotional Stability in civilian jobs, compared to .30 in military samples4.
In her 1992 meta-analysis, Hough reported that adjustment measures had uncorrected mean correlations of .41 with Law-Abiding Behavior criteria (k = 15, n = 36,210) and .19 with Combat Effectiveness criteria (k = 13, n = 3,880). In a meta-analysis limited to predictive studies only, Hough (1998) reported that adjustment measures had uncorrected mean correlations of .21 with Educational Success criteria (k = 108, n = 28,799) and -.17 with Counterproductive Behavior criteria (k = 5, n = 12,889). Her definition of “adjustment” closely fits the definition of our stress tolerance construct.
In other military research, White, Gregory et al. (2001) reported that the AIM Adjustment scale had concurrent validities of r = .27 (p < .05), -.11 (n.s.), and .22 (p < .05), respectively, with supervisor ratings of performance, number of disciplinary incidents (i.e., Article 15 and/or letters of reprimand), and a unit-weighted combination of supervisory ratings and number of disciplinary incidents (n = 298 Army correctional specialists).
In other military validity research, involving different criteria, White, Young, and Rumsey (2001) reported that the ABLE-114 Adjustment scale had non-significant validities when criteria were measured approximately five years later (n = 590 enlisted soldiers).
In the Robertson and Kinder (1993) meta-analysis, the OPQ Relaxed scale had a mean weighted uncorrected validity of .14 against Resilience criteria and (k = 7; n = 1,017; lower bound of credibility interval overlapped with zero).
4 It is important to note, however, that Salgado’s (1998) validities are corrected for predictor unreliability and other artifacts, and that his military data were based exclusively on aviator samples (k = 8, n = 1,180) and involved training proficiency rather than job performance criteria.
2-40

Emotional stability has also been shown to relate to job satisfaction. In another meta-analysis, Judge, Heller, and Mount (2002) reported an uncorrected mean correlation of .24 (k = 92, n = 24,527) and a corrected mean correlation of .29 (correlation corrected for sampling error and predictor and criterion unreliability). This is important for the Navy because job satisfaction is a good predictor of personnel retention. Not surprisingly, satisfied employees are more likely to stay on the job than are dissatisfied employees (Harter et al., 2002; Tett & Meyer, 1993).
Construct Validity
In the Tellegen and Waller (in press) joint factor analysis, the MPQ Stress Reaction scale and the 16PF Emotional Stability scale loaded on the same factor and had identical, high loadings (n = 288 college men and women). These two scales not only had the same loadings on the same factor, but also showed similar patterns of loadings across all four factors that were extracted.
The OPQ Relaxed scale correlated r = -.70 with the 16PF Tension scale and r = -.45 with the 16PF Apprehension scale (n = 2,007). Jackson (1994) reported that the JPI Anxiety scale correlated most highly with the Stability scale of the Bentler Personality Inventory (r = -.74), and self-ratings on the trait adjectives “Nervous versus Calm” (r = .73) and “Tense versus Relaxed” (r = .65).
In the Jackson (1994) multi-method factor analysis of JPI scale scores, adjective checklist ratings, self-ratings, and peer ratings, factor loadings defined an Anxiety factor across methods (n = 70). Loadings across methods ranged from .69 to .80, and the mean of the absolute values of construct-irrelevant loadings was .07. Jackson (1994) further reported that the correlation between JPI Anxiety scale scores and roommate-rated anxiety was r = .25 (p < .01) in a sample of n = 116 self-roommate pairs.
Usefulness for Classification
To evaluate the utility of stress tolerance measures for classification purposes, we first examined the Cattell et al. (1970) cross-occupation data for the 16PF scale most relevant to our stress tolerance construct: Apprehension. The standard deviation across the 10 occupations selected for this analysis was .96. The standard deviation associated with the Apprehension scale was above average relative to the standard deviations associated with other 16PF scales.
Consistent with the Cattell et al. work, The Borman et al. (1999) O*NET work style data revealed substantial variability in Attention to Detail requirements across occupations, with a maximum cross-occupation effect size of approximately 1.50.
By contrast, the Hogan and Blake (1996) work indicated that the MPQ Stress Reaction and 16PF Apprehensiveness scales are both uncorrelated with any of the six RIASEC occupational types.
2-41

While these data are somewhat inconsistent, we are inclined to give the Hogan and Blake results less weight, since they speak only to correlations between personality variables and occupational preferences, whereas the Cattell et al. and Borman et al. results speak more directly to occupational differences in personality requirements. Moreover, a strong rational argument can be made that stress tolerance requirements will vary substantially across enlisted Navy ratings. It seems highly likely, for example, that Navy SEALs experience more stress than disbursement clerks.
Summary
Stress tolerance is a facet of Big-Five Emotional Stability, and has been incorporated into a number of prominent personality instruments/taxonomies. Stress tolerance measures have been shown to be internally consistent/unidimensional and temporally stable. Criterion-related validity data indicate that stress tolerance measures correlate at useful levels for many different criteria of importance to the Navy in both predictive and concurrent studies (though stress tolerance has not correlated with some criteria in predictive studies). The list of critically important criteria with which stress tolerance measures have been shown to correlate includes: combat effectiveness, law-abiding behavior, job satisfaction, counterproductive behavior, and educational success (the latter two in studies with predictive designs). There is also evidence that stress tolerance variables have higher validity coefficients in military settings than in civilian settings. The link with job satisfaction is very important because job satisfaction relates to retention, which is an increasingly important issue for the military. Stress tolerance measures have been shown to be construct-valid, showing both convergent and discriminant validity. While the evidence is not perfectly consistent, it appears that stress tolerance will be useful for classification purposes for Navy enlisted ratings.
Innovation
Unidimensionality/Stability
The OPQ Innovative scale had a mean internal consistency reliability of α = .81 (range: α = .73 to .84) across six samples. By far the largest of the samples (n = 2,987 individuals drawn from the British general population) was α = .84 (Saville & Holdsworth, 1993). The OPQ Innovative scale had 4-week test-retest reliability of r = .86 (n = 88 college undergraduates) and 15-month test-retest reliability of r = .70 (n = 108 human resource professionals).
Jackson (1994) reported that the JPI Innovation scale had internal consistency reliabilities ranging from α = .82 to .87 across four university samples ranging from 82 to 1,107, with a mean of α = .85 (Jackson, 1994).
2-42

Criterion-Related Validity
In the Robertson and Kinder (1993) meta-analysis, the OPQ Innovative scale had a mean weighted uncorrected validity of .32 against Creativity criteria (k = 8, n = 842).
Construct Validity
Jackson (1994) reported that the JPI Innovation scale correlated most highly with self-ratings on the trait adjectives of “Inventive versus Unimaginative” (r = .68). In a multi-method factor analysis of JPI Innovation scale scores, adjective checklist ratings, self-ratings, and peer ratings, factor loadings defined an Innovation factor across methods (n = 70). Loadings for three of the methods (JPI scale score, adjective checklist score, and self-rating) ranged from .79 to .87, and the loading for peer ratings was .44. The mean of the absolute values of construct-irrelevant loadings was .07. Jackson (1994) further reported that the correlation between JPI Innovation scale scores and roommate-rated innovativeness was r = .23 (p < .05) in a sample of 116 self-roommate pairs.
Detwiler and Ramanaiah (1996) conducted a joint factor analysis of the JPI, NEO-Five-Factor Inventory (NEO-FFI; Costa & McCrae, 1992), and Interpersonal Adjective Scales Revised–B5 (IAS-R-B5; Trapnell & Wiggins, 1990) scales and found that the JPI Innovation scale loaded on the same factor as openness to experience scales from the NEO-FFI, and IAS-R-B5. Not surprisingly, innovation appears closely related to the Big-Five Openness to Experience factor.
Usefulness for Classification
The Cattell et al. (1970) cross-occupation data for the 16PF Abstractedness scale, which includes imaginativeness as part of its definition (Conn & Rieke, 1994, Table 1.5), had a standard deviation of 1.05 across the 10 occupations selected for this analysis, which was one of the highest of the 16 primary scales in the instrument. The Borman et al. (1999) O*NET work style data indicated significant variability in innovation requirements across occupations, with a maximum cross-occupation effect size of approximately 1.0. Hogan and Blake (1996) reported that the 16PF Abstractedness scale correlated r = .28 with the Artistic RIASEC occupational type, and was uncorrelated with the Conventional occupational type. Hogan and Blake reported correlations between the NEO-PI-R Openness to Experience scale and the six RIASEC occupational types ranging from r = -.26 with the Conventional occupational type to r = .52 with the Artistic occupational type. Correlations with the Realistic, Investigative, and Social occupational types ranged from r = .24 to .36, and Openness to Experience was uncorrelated with the Enterprising occupational type. Taken together, these data suggest that innovation should have high utility as a classification tool for Navy enlisted ratings.
2-43

Summary
Evidence relevant to innovation is sparser than for many of the other constructs proposed for the NCAPS taxonomy. The available evidence, however, indicates that measures of innovation are internally consistent, temporally stable, and correlated with creativity criteria. The available evidence also reveals that innovation measures shows the expected pattern of convergent and discriminant validity, and are related to the Big-Five Openness to Experience factor. Data relevant to classification suggests that innovation measures would have good utility as classification tools for naval enlisted ratings.
Perceptiveness/Depth of Thought
Unidimensionality/Stability
Two OPQ scales are relevant to the perceptiveness/depth of thought construct: the Conceptual scale and the Critical scale. The OPQ Conceptual scale had a mean internal consistency reliability of α = .74 (range: α = .67 to .78) across six samples. By far the largest of the samples (n = 2,987 individuals drawn from the British general population) had α = .75. The OPQ Critical scale had a mean internal consistency reliability of α = .63 (range: α = .50 to .79) across the six samples. By far the largest of the samples (the 2,987 individuals drawn from the British general population) had α = .60 (Saville & Holdsworth, 1993). The OPQ Conceptual scale had 4-week test-retest reliability of r = .74 (n = 88 college undergraduates) and 15-month test-retest reliability of r = .62 (n = 108 human resource professionals). The OPQ Critical scale had 4-week test-retest reliability of r = .72 (n = 88 college undergraduates) and 15-month test-retest reliability of r = .55 (n = 108 human resource professionals).
Jackson (1999) reported internal consistency reliabilities of .62 to .66 (KR-20) for the PRF Understanding scale in 2 samples involving 71 male high school students and 202 male and female college students, respectively. Jackson further reported 2-week test-retest reliabilities for 2 parallel forms of the PRF Understanding scale of r = .89 and .93 in a sample of 82 college students. The 2- to 3-week parallel form test-retest reliabilities ranged from r = .60 to .77 in samples ranging from 82 to 192 high school, college, and graduate students.
Jackson (1994) reported that the JPI Complexity scale had internal consistency reliabilities ranging from α = .66 to .74 across four university samples ranging from 82 to 1,107, with a mean of α = .71.
Criterion-Related Validity
The Robertson and Kinder (1993) meta-analysis indicated that the OPQ Conceptual scale had a mean weighted uncorrected validity of .28 against Creativity criteria (k = 8, n = 842) and that the OPQ Critical scale had a mean weighted uncorrected validity of .21 against Analysis criteria (k = 11, n = 1,063).
2-44

The perceptiveness/depth of thought construct is also highly related to openness to experience/intellectance (Detwiler & Ramanaiah, 1996; Costa & McCrae, 1992). As such, criterion-related validity evidence relating to the openness to experience/intellectance construct is relevant to this section. Meta-analytic evidence indicates that Intellectance measures had an uncorrected mean correlation of .24 with a Commendable Behavior criterion (k = 1, n = 747), .16 with Technical Proficiency criteria (k = 2, n = 700), and .13 with Educational Success criteria (k = 8, n = 3,628) (Hough, 1992). In her meta-analysis of criterion-related validities for predictive studies only, Hough (1998) reported uncorrected mean correlations of .12 (k = 5, n = 3,229) with Educational Success criteria and .24 with a Counterproductive Behavior criterion (k = 1, n = 747).
Construct Validity
As indicated above, the perceptiveness/depth of thought construct, which is perhaps best operationalized by the JPI Complexity scale and the PRF Understanding scale, is closely related to intellectance/openness to experience. In the Detwiler and Ramanaiah (1996) joint principal axis factor analysis of JPI, NEO FFI, and IASR–B5, the JPI Complexity scale loaded .76 on a factor labeled Openness, and had very similar loadings with the Openness scales of the NEO-FFI (r = .84) and IASR-B5 (r = .79). To further support this notion, Costa and McCrae (1992) reported that the Ideas facet of Openness to Experience in the NEO-PI-R correlated r = .67 with the PRF Understanding scale (n = 203 to 296). Consistent with the foregoing, Jackson (1999) reported substantial convergent validity between the JPI Complexity scale and the PRF Understanding scale (r = .64), based on a sample of 215 college students.
In Jackson’s (1994) multi-method factor analysis of JPI Complexity scale scores, adjective checklist ratings, self-ratings, and peer ratings, factor loadings defined a Complexity factor across methods (n = 70). Loadings for three of the methods (JPI scale score, adjective checklist score, and self-rating) ranged from .57 to .83, and the loading for peer ratings was .23. The mean of the absolute values of construct-irrelevant loadings was .10. Jackson (1994) further reported that the correlation between JPI Complexity scale scores and roommate-rated complexity was r = .13 (n.s.) in a sample of 116 self-roommate pairs.
Jackson’s (1999) multi-method factor analysis showed that the PRF Understanding scale scores loaded on the same factor as scores yielded by the other two measurement methods, with factor loadings ranging from .49 to .79. The PRF Understanding scale did not load on any other factor extracted in that study. Correlations between PRF Understanding scale scores and peer ratings of understanding were r = .29, .50, and .16 across three college student samples (n = 40, 51, and 202, respectively). In another sample, consisting of 90 college roommates, the self-peer correlation associated with the PRF Understanding scale was r = .53.
Finally, Costa and McCrae (1992) reported self/other correlations for their Ideas facet of the Openness to Experience scale in the NEO-PI-R, which is related to the perceptiveness/depth of thought construct. They reported a self/peer correlation of r = .38 (p < .01, n = 250), a self/spouse correlation of .53 (p < .01, n = 68), and a peer/peer correlation of r = .37 (p < .01, n = 193).
2-45

Usefulness for Classification
Hogan and Blake (1996) reported correlations between the Openness to Experience measures and the six RIASEC occupational types. The correlations involving the NEO-PI Openness to Experience scale and the RIASEC occupational types ranged from r = -.26 with the Conventional occupational type to r = .52 with the Artistic occupational type. Correlations with the Realistic, Investigative, and Social occupational types ranged from r = .24 to .36. The NEO-PI Openness to Experience scale was uncorrelated with the Enterprising occupational type. The HPI Intellectance scale had correlations ranging from r = .35 to .49 with the Realistic, Investigative, and Artistic occupational types, and was relatively uncorrelated with the other occupational types.
The Borman et al. (1999) O*NET work style data indicated significant variability in analytical thinking (akin to perceptiveness/depth of thought) requirements across occupations, with a maximum cross-occupation effect size of nearly 2.0.
The Cattell et al. (1970) cross-occupation data related to the 16PF Reasoning and Abstractedness scales is also relevant to this analysis, though these scales do not overlap as closely with the perceptiveness/depth of thought construct as other scales we have discussed. The 16PF Reasoning and Abstractedness scales had standard deviations of 1.18 and 1.05, respectively, across the 10 occupations selected for this analysis. These are among the highest standard deviations of the 16 scales in the 16PF. Taken together, these data suggest that perceptiveness/depth of thought would have substantial utility as a classification tool for naval enlisted ratings.
Summary
Measures of perceptiveness/depth of thought been shown to be internally consistent and temporally stable. Scales most closely related to perceptiveness/depth of thought have also shown good criterion-related validities against theoretically related criteria. Measures of openness to experience, which is closely related to perceptiveness/depth of thought, have also been found to correlate with criteria at useful, albeit more modest, levels. Construct validity evidence for perceptiveness/depth of thought measures is generally good, although self-other correlations have varied from low to relatively high. Available data indicate the measures of perceptiveness/depth of thought would have substantial utility for classifying enlisted personnel into Navy enlisted ratings.
Willingness to Learn
Unidimensionality/Stability
The scales most relevant to the willingness to learn construct are the OPQ Conceptual and the JPI Breadth of Interest scales. The OPQ Conceptual scale had a mean internal consistency reliability of α = .74 (range: α = .67 to .78) across six samples. By far the largest of the samples (n = 2,987 individuals drawn from the British general population) had α = .75. The OPQ Conceptual scale had a 4-week test-retest reliability of r = .74 (n = 88 college undergraduates) and a 15-month test-retest reliability of r = .62
2-46

(n = 108 human resource professionals) (Saville & Holdsworth, 1993). Jackson (1994) reported that the JPI Breadth of Interest scale had internal consistency reliabilities ranging from α = .79 to .82 across four university samples ranging from 82 to 1,107, with a mean α = .80.
Criterion-Related Validity
The Detwiler and Ramanaiah (1996) joint factor analysis showed that the JPI Breadth of Interest scale loaded on their Openness factor in a manner almost exactly analogous to the JPI Complexity scale, as described above for the perceptiveness/depth of thought construct. As such, criterion-related validity evidence associated with the openness to experience/intellectance construct is also relevant to the willingness to learn construct. Indeed, all of the criterion-related validity evidence brought to bear for the perceptiveness/depth of thought construct is equally relevant to the willingness to learn construct, though it will not be repeated here.
Additional criterion-related validity evidence involved the HPI Curiosity HIC (3-item composite). The HPI Curiosity HIC correlated r = .14 (p < .05) with Navy fleet explosive ordnance disposal (EOD) diving success in a sample of 97 EOD technician trainees in the Navy (J. Hogan & R. Hogan, 1989).
The construct motivation to learn (cf. Noe & Schmitt, 1986; Noe & Wilk, 1993), which is an important construct in the training literature, is also relevant to our evaluation of willingness to learn. While not a personality trait per se, we have decided to incorporate motivation to learn into this section because of its obvious relevance and the rich nomological network in which it has been embedded. Motivation to learn has been found to be predictive of employee participation in training and development activities (Theranou, 2001) as well as several positive training outcomes, such as declarative knowledge and skill acquisition, and transfer of training (Colquitt, LePine, & Noe, 2000; Quinones, 1995).
Construct Validity
As indicated above, the willingness to learn construct, which is perhaps best operationalized by the JPI Breadth of Interest scale, is closely related to intellectance/openness to experience. In the Detwiler and Ramanaiah (1996) joint principal axis factor analysis of JPI, NEO FFI, and IASR-B5 scales, the JPI Breadth of Interest scale loaded .69 on a factor labeled Openness, and had very similar loadings with the Openness scales of the NEO-FFI (.84) and IASR-B5 (.79).
In Jackson’s (1994) multi-method factor analysis of JPI scale scores, adjective checklist ratings, self-ratings, and peer ratings, a Breadth of Interest factor did not emerge across methods (n = 70). Loadings were .17 for the JPI scale score, and .05 for adjective checklist ratings by peers, .67 for self-ratings on global trait scales, and .56 for peer-rated global trait scales. The mean of the absolute values of construct-irrelevant loadings was .11. Jackson (1994) also reported that the correlation between JPI Breadth of Interest scale scores and roommate-rated breadth of interest was r = .17 (n.s.) in a sample of 116 self-roommate pairs.
2-47

Costa and McCrae (1992) reported higher self/other correlations for the Ideas facet of the NEO-PI-R Openness to Experience scale, which is related to the willingness to learn construct. Specifically: a self/peer correlation of r = .38 (p < .01, n = 250), a self/spouse correlation of r = .53 (p < .01, n = 68), and peer/peer correlation of r = .37 (p < .01, n = 193).
Usefulness for Classification
Much of the Borman et al. (1999) and Hogan and Blake (1996) data cited with regard to the classification utility of the perceptiveness/depth of knowledge construct are also relevant to the classification utility of the willingness to learn construct. Willingness to learn should, therefore, have significant utility as a classification tool for Navy enlisted ratings, though it is certainly difficult to conceive of an enlisted rating in which willingness to learn would not play at least some role in job success.
Summary
Willingness to learn measures has been found to be internally consistent and temporally stable. Available data indicate that willingness to learn measures will be predictive of several criteria. Willingness to learn should relate most highly to training outcome criteria, which would render its measures extremely important in military settings, where enlisted personnel are virtually always in training. Construct validity evidence has been mixed for one measure relevant to willingness to learn (the JPI Breadth of Interest scale). Construct validity evidence for another measure relevant to willingness to learn (the Ideas facet of the NEO-PI-R Openness to Experience factor) has, however, has been more positive. The available evidence suggests that willingness to learn measures, while likely to be important across all Navy ratings due to the constant need for training, may also play a useful role as a classification tool.
Self-Reliance
Unidimensionality/Stability
The scales most relevant to the self-reliance construct are the CPI Femininity/Masculinity (F/M) scale and the 16PF Self-Reliance scale.
Conn and Rieke (1994) reported that the 16PF Self-Reliance scale had an internal consistency reliability of α = .78 (n = 4,660, drawn from the general population as well as undergraduate/graduate students). They further reported that the 16PF Self-Reliance scale had a 2-week test-retest reliability of r = .86 and a 2-month test-retest reliability of r = .69 (n = 159 undergraduates).
The CPI F/M scale had internal consistency reliability of α = .73 in a sample of 6,000 (3,000 males and 3,000 females), though the internal consistency reliability was only α = .43 within each gender group (due, no doubt, to restriction of range). The F/M scale showed 1-year test-retest reliability of r = .84 for 237 high school students first tested as juniors, 5-year test-retest reliability of r = .46 for 91 females first tested as college seniors, and 25-year test-retest reliability of r = .37 for 44 adult males first tested at the age of approximately 40 (Gough & Bradley, 1996).
2-48
In the unidimensionality analysis described above, Chernyshenko et al. (2001) concluded that the 16PF Self-Reliance scale met the test for unidimensionality for IRT purposes. In their confirmatory factor analysis, they reported that the 16PF Self-Reliance scale had RMSEA = .06, GFI = .97, and NFI and CFI values equal to .93.
Criterion-Related Validity
Criterion-related validity evidence for self-reliance measures is sparse. However, Hough’s (1992) rugged individualism construct is similar to our self-reliance construct, making her meta-analytic results relevant to this analysis. She reported an uncorrected mean correlation of .25 between rugged individualism measures and Combat Effectiveness criteria (k = 2, n = 595).
Construct Validity
As indicated above, the two scales most relevant to our self-reliance construct are the Self-Reliance scale of the 16PF and the F/M scale of the CPI. A construct similar to self-reliance was also incorporated into the O*NET taxonomy and labeled “Independence.”
Somewhat strangely, the 16PF Self-Reliance scale was uncorrelated with the CPI F/M scale (Gough & Bradley, 1996). Careful scrutiny of the definitions and construct validity data associated with these two scales helps illuminate this lack of correlation. The CPI F/M scale is defined as “decisive, action-oriented; shows initiative; not easily subdued; rather unsentimental; and tough-minded” (Gough & Bradley, 1996, p. 13). The high scorer on the 16PF Self-Reliance scale is defined as someone who is “self-sufficient, resourceful, prefers own decisions” (Conn & Rieke, 1994, p. 18). A difference between the two scales is that the low-end of the F/M scale of the CPI seems to emphasize high-strung, sensitive, social responsiveness, whereas the low-end of the 16PF Self-Reliance scale focuses more on being a group-oriented, group-dependent joiner.
The 16PF Self-Reliance scale correlates most highly with measures of extroversion and affiliation. For example, it correlates r = -.62 with the NEO-PI-R Gregariousness scale (n = 257), r = -.45 with the CPI Sociability scale (n = 212) and r = -.45 with the PRF Affiliation scale (n = 225) (Conn & Rieke, 1994, Table 6.4). To a somewhat lesser extent, the 16PF Self-Reliance scale is associated with lack of empathy and nurturing behavior. For example, it correlates r = -.38 with the PRF Nurturance scale (n = 225) and r = -.34 with the CPI Empathy scale (n = 212). In a joint factor analysis of the MPQ, 16PF, and PRF, the 16PF Self-Reliance scale loaded saliently and negatively on a factor labeled Communal Positive Emotionality, which consisted largely of measures at the intersection of affiliation and warmth (Tellegen & Waller, in press). These data suggest that the 16PF Self-Reliance scale is largely associated with lack of the type of positive emotions that motivate a desire to belong.
2-49

According to evidence compiled by Gough and Bradley (1996), the CPI F/M scale correlated modestly highly with other measures of masculinity/femininity. For example, it correlated r = -.53 for both males and females with the Guilford-Zimmerman Temperament Survey Masculinity scale (n = 112 males, 98 females), r = .49 and .42 with the Masculinity/Femininity scale of the Minnesota Multiphasic Personality Inventory (n = 657 males, 461 females); r = -.42 and -.33 with the Masculinity scale of the Bem Sex-Role Inventory (n = 99 males, 99 females), but only r = .22 and .19 with the Femininity scale of the Bem Sex-Role Inventory; and r = -.42 and -.52 for males and females, respectively, with the Masculinity/Femininity scale of the Spence-Helmreich Personal Attributes Questionnaire (n = 87 males, 86 females).
However, the CPI F/M scale also correlated r = .30 and .43 with PRF Harmavoidance for males and females, respectively (n = 133 males, 84 females), and r = .38 and .30 with the NEO-PI-R Neuroticism scale for males and females, respectively (n = 112 males, 122 females). These correlations are consistent with our interpretation of CPI F/M as being associated with high-strung and sensitive behavior. Indeed, the CPI F/M scale appears to include aspects of negative emotionality and constraint, using the Tellegen (1982) personality taxonomy, and appears to have much less to do with positive emotionality than the 16PF Self-Reliance scale. When viewed in this light, the lack of correlation between CPI F/M and 16PF Self-Reliance becomes clear.
Though uncorrelated, the CPI F/M scale and the 16PF Self-Reliance scale both have an impressive track record of construct validity, rendering both scales quite interpretable. Moreover, both scales have relevance to our self-reliance construct, though certain aspects of the CPI F/M scale, which is considerably broader in scope than the 16PF Self-Reliance scale, were excluded.
Usefulness for Classification
Hogan and Blake (1996) reported correlations between the 16PF Self-Reliance scale and the six RIASEC occupational types. The correlations ranged from r = -.15 with the Realistic occupational type to r = .20 and .21 with the Enterprising and Social occupational types, respectively. Correlations with the Investigative, Artistic, and Conventional occupational types were negligible.
The Cattell et al. (1970) cross-occupation data for the 16PF Self-Reliance scale had a standard deviation of .66 across the 10 occupations selected for this analysis, which was one of the lowest of the 16 scales in that instrument.
The Borman et al. (1999) O*NET work style data indicated little variability in independence requirements across occupations, with a maximum cross-occupation effect size of less than .30 standard deviation units.
Taken together, these data suggest that self-reliance will have limited utility as a classification tool for Navy enlisted ratings.
2-50
Summary
The available data indicate that self-reliance measures are internally consistent/unidimensional and temporally stable, though that internal consistency/unidimensionality and temporal stability becomes attenuated in single-gender samples, reflecting its association with masculinity/femininity measures. While criterion-related validity data for self-reliance measures is sparse, there is some meta-analytic evidence that indicates that such measures will be predictive of combat effectiveness. Existing measures of self-reliance, though uncorrelated, are well understood. In formulating our self-reliance construct, we integrated aspects of existing measures relevant to self-reliance with the intent to, among other things, avoid multidimensionality. The available evidence indicates that self-reliance will have limited utility for classification purposes.
Vigilance
Unidimensionality/Stability
Evidence relating to our vigilance construct is extremely limited; this construct is largely experimental. It is being included due to the importance that vigilant behavior plays in many naval enlisted ratings.
One source of relevant evidence that facilitates evaluation of our vigilance construct comes from the literature on antecedents of accidents. For example, Hansen (1989) developed a “Distractibility” scale derived from MMPI items that has some of the characteristics of our vigilance construct5. This was a 10-item scale, with internal consistency reliability of α = .75, based on a sample of 362 production/maintenance workers in a large chemical processing company.
Criterion-Related Validity
Hansen (1989) reported that his Distractibility scale correlated r = -.31 (p < .01) with number of accidents.
Construct Validity
Little construct validity evidence relating to our vigilance construct is available in the extant literature. Hansen’s (1989) criterion-related validity evidence supports the construct validity of his Distractibility scale but, as we indicated, this construct is largely experimental.
5 The lack of more complete overlap is due to the fact that the Distractibility scale does not get at the ability to sustain attention despite boredom.
2-51

Usefulness for Classification
There is no evidence of which we are aware that speaks to the utility of vigilance measures as a classification tool for Navy enlisted ratings.
Summary
As mentioned earlier, Ferstl et al. (2003) provided for inclusion of a small number of experimental personality constructs in the criteria they established for the NCAPS taxonomy. Vigilance is perhaps the only one of the constructs we are proposing that is predominantly experimental, so we are well within our self-imposed guidelines for taxonomy development. While there is some evidence of internal consistency and criterion-related validity for measures with some relevance to our vigilance construct, our decision to incorporate vigilance is primarily based on our professional judgment as to its importance for Navy enlisted ratings.
Summary
In this chapter, we have described methodology used to formulate an initial taxonomy of constructs to be considered for inclusion in NCAPS. A number of prominent, middle-level personality inventories/taxonomies were integrated to identify constructs and formulate operational definitions of those constructs. Middle-level inventories/taxonomies were used to ensure that the constructs would be at a level of specificity that would balance the competing requirements of measurement efficiency and precision. A thorough literature review was conducted to evaluate this initial set of constructs against taxonomic inclusion criteria specified by Ferstl et al. (2003).
Most constructs received support from the literature, albeit to varying degrees. One problematic construct was positive self-concept, which was found to be somewhat multidimensional. There was also some concern that predictive validities associated with measures of leadership orientation may attenuate over time. While the adaptability/flexibility construct did not fare especially well against our taxonomic inclusion criteria, a strong rational argument can be made for including it as part of NCAPS due to its importance in military, as well as civilian, settings due to its increasing prominence in the job performance literature, and recent improvements in our understanding of the construct, which should enhance our ability to measure it effectively. There is virtually no evidence relevant to the vigilance construct. However, we advocate its inclusion an experimental construct due to its likely importance in several Navy ratings. Ferstl et al. (2003) provided for inclusion of a limited number of experimental constructs if they seemed especially promising.
2-52

Constructs varied in their degree of likely usefulness for classification purposes. Social orientation, compassion, innovation, and perceptiveness/depth of thought appear to be the best candidates for classification utility, although the available evidence is limited.
In the next chapter, we further evaluate the constructs in this initial taxonomy for possible inclusion in NCAPS using an expert rating task. Those results will not only complement the literature review results reported in this chapter, but also provide additional valuable data regarding the likely classification utility of constructs in our provisional NCAPS taxonomy.
2-53

Chapter 2. References
Ashton, M. C. (1998). Personality and job performance: The importance of narrow traits. Journal of Organizational Behavior, 19, 289-303.
Barrick, M. R., Mount, M. K., & Judge, T. A. (2001). Personality and performance at the beginning of the new millennium: What do we know and where do we go next? International Journal of Selection and Assessment, 9, 52-69.
Borman, W. C., Kubisiak, U. C., & Schneider, R. J. (1999). Work Styles. In N. Peterson, M. Mumford, W. Borman, P. Jeanneret, & E. Fleishman (Eds.), An occupational information system for the 21st century: The development of O*NET (pp. 213-226). Washington, DC: American Psychological Association.
Cattell, R. B., Eber, H. W., & Tatsukoa, M. M. (1970). Handbook for the Sixteen Personality Factor Questionnaire. Champaign, IL: Institute for Personality and Ability Testing.
Chapin, F. S. (1942). Preliminary standardization of a social insight scale. American Sociological Review, 7, 214-225.
Chernyshenko, O. S., Stark, S., Chan, K-Y, Drasgow, F., & Williams, B. (2001). Fitting item response theory models to two personality inventories: Issues and insights. Multivariate Behavioral Research, 36, 523-562.
Colquitt, J. A., LePine, J. A., & Noe, R. A. (2000). Toward an integrative theory of training motivation: A meta-analytic path analysis of 20 years of research. Journal of Applied Psychology, 85, 678-707.
Conn, S. R., & Rieke, M. (Eds.). (1994). The 16PF fifth edition technical manual. Champaign, IL: Institute for Personality and Ability Testing.
Costa, P. T., Jr. & McCrae, R. R. (1992). Revised NEO Personality Inventory (NEO-PI-R) and NEO Five-Factor Inventory (NEO-FFI): Professional manual. Odessa, FL: Psychological Assessment Resources, Inc.
Detwiler, F. R. J., & Ramanaiah, N. V. (1996). Structure of the Jackson Personality Inventory from the perspective of the five-factor model. Psychological Reports, 79, 411-416.
Ferstl, K. L., Schneider, R. J., Hedge, J. W., Houston, J. S., Borman, W. C., & Farmer, W. L. (2003). Following the roadmap: Evaluating potential predictors for Navy selection and classification (Institute Report #421). Minneapolis: Personnel Decisions Research Institutes, Inc.
Gough, H. G., & Bradley, P. (1996). CPI manual (3rd ed.). Palo Alto, CA: Consulting Psychologists Press.
Hakstian, A. R., Woolsey, L. K., & Schroeder, M. L. (1987). Validity of a large-scale assessment battery in an industrial setting. Educational and Psychological Measurement, 47, 165-178.
2-54

Hansen, C. P. (1989). A causal model of the relationship among accidents, biodata, personality, and cognitive factors. Journal of Applied Psychology, 74, 81-90.
Harter, J. K., Schmitt, F. L. & Hayes, T. L. (2002). Business-unit-level relationship between employee satisfaction, employee engagement, and business outcomes: A meta-analysis. Journal of Applied Psychology, 87, 268-279.
Hogan, J., & Hogan, R. (1989). Noncognitive predictors of performance during explosive ordinance disposal training. Military Psychology, 1, 117-133.
Hogan, R. (1986). The Hogan Personality Inventory manual. Tulsa, OK: Hogan Assessment Systems.
Hogan, R., & Blake, R. (1996). Vocational interests: Matching self-concept with the work environment. In K. R. Murphy (Ed.), Individual differences and behavior in organizations (pp. 89-144). San Francisco: Jossey-Bass.
Hogan, R., & Hogan, J. (1995). The Hogan Personality Inventory manual (2nd ed.). Tulsa, OK: Hogan Assessment Systems.
Holland, J. L. (1973). Making vocational choices: A theory of careers. Englewood Cliffs, NJ: Prentice-Hall.
Hough, L. M. (1992). The “big five” personality variables – construct confusion: Description versus prediction. Human Performance, 5, 139-155.
Hough, L. M. (1998). Personality at work: Issues and evidence. In M. Hakel (Ed.), Beyond multiple choice: Evaluating alternatives to traditional testing for selection (pp. 131-166). Mahwah, NJ: Erlbaum.
Hough, L. M., Eaton, N. K., Dunnette, M. D., Kamp, J. D., & McCloy, R. A. (1990). Criterion-related validities of personality constructs and the effect of response distortion on those validities [Monograph]. Journal of Applied Psychology, 75, 581-696.
Hough, L. M., & Schneider, R. J. (1996). Personality traits, taxonomies, and applications in organizations. In K. R. Murphy (Ed.), Individual differences and behavior in organizations (pp. 31-88). San Francisco: Jossey-Bass.
Jackson, D. N. (1999). Personality Research Form manual (3rd ed.). Port Huron, MI: Sigma Assessment Systems, Inc.
Jackson, D. N. (1994). Jackson Personality Inventory-Revised manual. Port Huron, MI: Sigma Assessment Systems, Inc.
Johnson, J. W. (2003). Toward a better understanding of the relationship between personality and individual job performance. In M. R. Barrick & A. M. Ryan (Eds.), Personality and work: Reconsidering the role of personality in organizations (pp. 83-120). New York: Jossey-Bass.
Judge, T. A. & Bono, J. E. (2001). Relationship of core self-evaluations traits – self-esteem, generalized self-efficacy, locus of control, and emotional stability – with job satisfaction and job performance: A meta-analysis. Journal of Applied Psychology, 86, 80-92.
2-55

Judge, T. A., Heller, D., & Mount, M. K. (2002). Five-factor model of personality and job satisfaction: A meta-analysis. Journal of Applied Psychology, 87, 530-541.
Judge, T. A., Erez, A., & Bono, J. E. (1998). The power of being positive: The relation between positive self-concept and job performance. Human Performance, 11, 167-187.
Kamp, J. (1991). Job Candidate Profile technical manual (2nd ed). St. Paul, Minnesota: Behavioral Science Technology, Inc.
Lorr, M. (1986). Interpersonal Style Inventory (ISI) manual. Los Angeles: Western Psychological Services.
Mikulay, S. M., & Goffin, R. D. (1998). Measuring and predicting counterproductivity in the laboratory using integrity and personality testing. Educational and Psychological Measurement, 58, 768-790.
Moorefield, R., & Kofman, F. (2000). Stability and factor structure of the Jackson Personality Inventory – Revised. Psychological Reports, 86, 421-428.
Mount, M. K., & Barrick, M. R. (1995). The Big Five personality dimensions: Implications for research and practice in human resource management. Research in Personnel and Human Resources Management, 13, 153-200.
Mount, M. K., Barrick, M. R., Stewart, G. L. (1998). Five-factor model of personality and performance in jobs involving interpersonal interactions. Human Performance, 11, 145-165.
Noe, R. A., & Schnitt, N. (1986). The influence of trainee attitudes on training effectiveness: Test of a model. Personnel Psychology, 39, 497-523.
Noe, R. A., & Wilk, S.L. (1993). Investigation of the factors that influence employees’ participation in development activities. Journal of Applied Psychology, 78, 291-302.
O’Sullivan, M., & Guilford, J. P. (1976). Four factor tests of social intelligence (behavioral cognition): Manual of instructions and interpretations. Palo Alto: Sheridan Psychological Services.
Pulakos, E. D., Arad, S., Donovan, M. A., & Plamondon, K. E. (2000). Adaptability in the workplace: Development of a taxonomy of adaptive performance. Journal of Applied Psychology, 85, 612-624.
Quinones, M. A. (1995). Pretraining context effects: Training assignment as feedback. Journal of Applied Psychology, 80, 226-238.
Randolph, D. L., & Wood, T. S. (1998). Efficacy of the Personality Research Form as a discriminator of vocational preference inventory categories. Journal of Social Behavior and Personality, 13, 593-610.
Reise, S. P., & Waller, N. G. (1990). Fitting the 2-parameter model to personality data. Applied Psychological Measurement, 14, 45-58.
Robertson, I. T., & Kinder, A. (1993). Personality and job competencies: The criterion-related validity of some personality variables. Journal of Occupational and Organizational Psychology, 66, 225-244.
2-56

Salgado, J. F. (1998). Big five personality dimensions and job performance in army and civil occupations: A European perspective. Human Performance, 11, 271-288.
Saucier, G., & Ostendorf, F. (1999). Hierarchical subcomponents of the Big Five personality factors: A cross-language replication. Journal of Personality and Social Psychology, 76, 613-627.
Saville & Holdsworth (1993). Occupational Personality Questionnaire manual. Escher, UK: Saville & Holdsworth.
Schmit, M. J., Kihm, J. A., & Robie, C. (2000). Development of a global measure of personality. Personnel Psychology, 53, 153-193.
Schneider, R. J. (1998). PDRI Social Competence Inventory. Unpublished instrument, Personnel Decisions Research Institutes, Inc., Minneapolis, Minnesota.
Schneider, R. J. (2001). PDRI Social Competence Inventory (Version 2). Unpublished instrument, Personnel Decisions Research Institutes, Inc., Minneapolis, Minnesota.
Schneider, R. J., Roberts, R. D., & Heggestad, E. D. (2002, April). Exploring the structure and construct validity of a self-report social competence inventory. In L. M. Hough (Chair), Compound traits: The next frontier of I/O psychology research. Symposium presented at the 17th Annual Conference of the Society for Industrial and Organizational Psychology, Toronto, Ontario, Canada.
Schneider, R. J., and Johnson, J. W. (2004). Development and empirical evaluation of a theory of socially competent job performance for United States Army junior commissioned officers (Institute Report #468). Minneapolis: Personnel Decisions Research Institutes, Inc.
Tellegen, A. (1982). Brief manual for the Multidimensional Personality Questionnaire. Unpublished manuscript, University of Minnesota, Minneapolis.
Tellegen. A., & Waller, N. G. (2000). Exploring personality through test construction: Development of the Multidimensional Personality Questionnaire. Minneapolis: University of Minnesota Press.
Tett, R. P., & Meyer, J. P. (1993). Job satisfaction, organizational commitment, turnover intention, and turnover: Path analyses based on meta-analytic findings. Personnel Psychology, 46, 259-293.
Tharenou, P. (2001). The relationship of training motivation to participation in training and development. Journal of Occupational and Organizational Psychology, 74, 599-622.
Trapnell, P. D., & Wiggins, J. S. (1990). Extension of the Interpersonal Adjective Scales to include the Big Five dimensions of personality. Journal of Personality and Social Psychology, 59, 781-790.
Vanden Bosch, K. L., & Oswald, F. L. (2002). The relationship between social competence and occupational preferences. Unpublished manuscript.
Vickers, R.R. (1995). Using personality assessment for leadership selection (Report No. 95-16). San Diego, CA: Naval Health Research Center.
2-57

White, L. A., Gregory, E. L., Kilcullen, R. N., Galloway, E., & Nedegaard, R. (2001). New maturity assessment tools for U.S. Army correctional specialists. Paper presented at the annual meeting of the American Psychological Association, San Francisco, CA.
White, L. A., Young, M. C., & Rumsey, M. G. (2001). ABLE implementation issues and related research. In J. P. Campbell, & D. J. Knapp (Eds.), Exploring the limits of personnel selection and classification (pp. 525-558). Mahwah, N. J.: Lawrence Erlbaum.
White, L. A., Borman, W. C., Penney, L., Kubisiak, C., Horgan, K., Bowles, S., & Mills, L. (2002). Concurrent validation of new measures for predicting Army recruiter sales performance. Paper presented at the Annual Meeting of the American Psychological Association, Chicago, IL.
Wiggins, J. S., Trapnell, P., & Phillips, N. (1988). Psychometric and geometric characteristics of the Revised Interpersonal Adjective Scales (IAS-R). Multivariate Behavioral Research, 23, 517-530.
2-58

Chapter 3. Selecting the Final Set of NCAPS Constructs (Janis Houston and Michael Cullen, PDRI)
In order to help make the final selection of constructs for inclusion in NCAPS, we prepared an expert judgment task, to be completed by individuals who had experience and expertise in I/O Psychology (specifically in testing and validation) and/or who were very knowledgeable about the Navy jobs for which NCAPS is targeted.
Ratings of Importance/Relevance for Performance in Navy Jobs
We wanted to evaluate the extent to which each of the constructs identified by the literature review as being potentially important was, in fact, related to and predictive of job performance in Navy jobs. Rating forms were developed for this task and appear in Appendix A. These forms included: (1) a set of detailed instructions for making the ratings; (2) a document showing the 19 personality constructs and their definitions; and (3) the rating matrix to be completed (not appearing in the appendix are the actual descriptions of the 79 Navy jobs used during evaluation). The rating scale we used for these judgments follows.
0 = characteristic has no importance or relevance for the Navy rating 1 = characteristic has little importance or relevance for the Navy rating 2 = characteristic has some importance and relevance for the Navy rating 3 = characteristic has a lot of importance and relevance for the Navy rating 4 = characteristic is critically important and relevant for the Navy rating
Twenty-six experts made the ratings requested, 22 from PDRI and 4 from NPRST. Estimates of interrater agreement were computed, resulting in an Rwg of .67 for all 26 raters, and an ICC (2, 26) of .95. To check for outliers, we performed a number of analyses, including correlating each individual’s ratings with the mean ratings across individuals. These analyses indicated that one rater was a potential outlier. The correlations were all in the 60s and 70s except for this individual, whose ratings correlated only .49 with the mean ratings. This rater was deleted from further analysis and Rwg was recalculated to be .69.
Appendix B contains the mean importance/relevance ratings for the 19 personality constructs for the 79 Navy jobs. The bottom row of this matrix shows, for each construct, the total number of jobs for which the importance rating is greater than 3.00. We wanted to investigate the extent to which some constructs, while perhaps not critically important across all 79 jobs, might be critically important for a few jobs, suggesting they could be useful for classification purposes. In fact, Vigilance is one such construct. The mean importance across all jobs is not very high (mean of 2.20), but it is critically important for nine jobs (ratings above 3.00).
3-1

Table 3.1 contains the mean importance/relevance ratings and standard deviations for the 19 personality constructs across all 79 Navy jobs. Recall that we had already developed and pilot tested items for three of these constructs: Achievement, Social Orientation, and Stress Tolerance. Fortunately, the mean ratings for these constructs are all over 2.00, and all three are among the highest-rated constructs.
Table 3-1 Mean and SDs for 19 constructs across 79 Navy
jobs (N=25 raters)
Personality Construct Mean SD Achievement 2.54 .52 Adaptability/Flexibility 2.34 .34 Adventurous/Courageous 1.77 .55 Attention to Detail 3.25 .32 Compassion 1.06 .52 Dependability 3.32 .47 Dutifulness/Integrity 2.86 .86 Energy Level 2.18 .45 Self-Control 2.33 .74 Innovation 1.71 .44 Leadership Orientation 1.42 .48 Perceptiveness/Depth of Thought 1.97 .44 Positive Self-Concept 1.95 .59 Self-Reliance 2.73 .48 Social Astuteness 1.70 .50 Social Orientation 2.29 .53 Stress Tolerance 2.33 .45 Vigilance 2.19 .43 Willingness to Learn 2.48 .29
Additional “Overall” Ratings
In addition to the ratings made of the relevance/importance of each construct to job performance, we asked experts to evaluate each construct on two other variables: (1) the importance of the construct for success in the Navy in general; and (2) the extent to which low standing on the construct is a potential disqualifier for entry into the Navy. The rating scale used for both of these “overall” ratings was:
0 = strongly disagree with this statement 1 = disagree with this statement 2 = neither agree nor disagree with this statement 3 = agree with this statement 4 = strongly agree with this statement
3-2

Eighteen of the 25 raters making ratings for Navy jobs made the two overall ratings. The means and SDs for these ratings are shown in Table 3.2.
Table 3-2 Means and SDs for overall ratings (N=18)
Importance for Success in Navy Mean SD
Low Standing as a Disqualifier Mean SD
Achievement 3.61 0.50 Achievement 2.50 0.79 Adaptability/Flexibility 3.28 0.57 Adaptability/Flexibility 2.39 0.98 Adventurous/Courageous 2.61 0.78 Adventurous/Courageous 1.33 0.91 Attention to Detail 3.22 0.65 Attention to Detail 2.17 1.15 Compassion 1.39 0.61 Compassion 0.89 0.58 Dependability 3.83 0.38 Dependability 3.28 0.83 Dutifulness/Integrity 3.89 0.32 Dutifulness/Integrity 3.44 0.78 Energy Level 3.06 0.80 Energy Level 2.06 1.00 Self-Control 2.89 0.90 Self-Control 2.61 1.04 Innovation 1.94 0.80 Innovation 0.67 0.59 Leadership Orientation 2.39 0.85 Leadership Orientation 1.17 0.62 Perceptiveness/Depth of Thought 1.89 0.68
Perceptiveness/Depth of Thought 0.83 0.62
Positive Self-Concept 2.39 0.92 Positive Self-Concept 1.72 1.18 Self-Reliance 3.06 0.42 Self-Reliance 2.17 0.92 Social Astuteness 2.00 0.69 Social Astuteness 1.06 0.80 Social Orientation 2.53 0.62 Social Orientation 1.29 0.92 Stress Tolerance 3.35 0.70 Stress Tolerance 2.94 0.90 Vigilance 2.59 0.94 Vigilance 1.65 1.17 Willingness to Learn 3.41 0.51 Willingness to Learn 2.65 1.06
A summary of all three types of expert judgments is shown in Table 3.3. This table shows which constructs received the highest ratings of: (1) their importance/relevance across the 79 Navy jobs; (2) their importance for success in the Navy; and (3) the extent to which low standing on them would be a disqualifier. There are nine constructs that consistently receive high ratings, three of which are the constructs already included in NCAPS.
3-3

Table 3-3 Summary of construct ratings
Construct
Mean Importance Across 79 Jobs Top
9 Constructs
Mean Importance for Success in Navy Top
9 Constructs
Mean Rating on Low Standing as
Disqualifier Top 9 Constructs
Dependability 3.32 3.83 3.28 Attention to Detail 3.25 3.22 2.17 Dutifulness/Integrity 2.86 3.89 3.44 Self-Reliance 2.73 3.06 2.17 Achievement 2.54 3.61 2.50 Willingness to Learn 2.48 3.41 2.65 Adaptability/Flexibility 2.34 3.28 2.39 Stress Tolerance 2.33 3.35 2.94 Social Orientation 2.29 ⎯ ⎯ Energy Level ⎯ 3.06 ⎯ Self Control ⎯ ⎯ 2.61
Final Selection of Constructs for NCAPS
The decision was made to add seven constructs to the NCAPS measure, the six with the highest importance/relevance and overall ratings, and Vigilance, since it appears to be critically important for a subset of the Navy jobs. Thus, the full set of constructs to be measured by NCAPS is:
• Achievement
• Adaptability/Flexibility
• Attention to Detail
• Dependability
• Dutifulness/Integrity
• Self-Reliance
• Social Orientation
• Stress Tolerance
• Vigilance
• Willingness to Learn
Table 3.4 shows these ten constructs and their definitions. We turn now to the development of items for these constructs.
3-4

Table 3-4 NCAPS personality taxonomy
Construct and Definition High Scorers . . . Low Scorers . . .
Achievement (AV): likes to set and achieve challenging goals, works hard, and persist in the face of significant obstacles; strives for excellence; confident in ability to perform well.
Like to set challenging goals; work hard, over long periods of time when necessary, to achieve goals; persist in the face of significant obstacles that would cause others to give up; strive for excellence in everything; are confident in their ability to perform well.
Avoid challenging goals and projects; prefer to work only as hard as necessary to complete projects and tasks; give up easily when confronted with obstacles; feel little personal involvement in work; doubt their ability to perform well; display little ambition.
Adaptability/Flexibility (ADF): willing to change his/her approach to tasks and projects; likes variety in work; able to work effectively with many different types of people in many different types of situations and/or with differing organizational constraints.
Are willing to change their approach to tasks and projects; like considerable variety at work; are able to work effectively with many different types of people in many different types of situations; adapt readily to changes in their environment, including additional constraints, multiple demands, and unanticipated adversity.
Like to do things the way they have always done them; have difficulty adjusting to new people, situations, and environments; do not adapt well to changes in their environment involving additional constraints, multiple demands, or unanticipated adversity.
Attention to Detail (ADL): is exacting, precise, accurate, neat, and thorough; spots minor imperfections or errors; is meticulous in his/her approach to tasks.
Are exacting, precise, and accurate; spot minor imperfections or errors; are meticulous and thorough in their approach to tasks; dislike clutter; enjoy developing methods for keeping materials methodically organized.
Are sloppy and imprecise; miss important details; make careless errors; frequently maintain their personal effects in a state of disarray.
Dependability (DEP): reliable, well organized, orderly and planful; not easily distracted or bored by routine tasks; does not procrastinate, even when tasks are unpleasant or unexciting.
Are reliable, well organized, orderly and planful; use their time efficiently; prioritize tasks; stay on schedule; are not easily distracted or bored by routine tasks; do not procrastinate, even when tasks are unpleasant or unexciting.
Are unreliable and undependable; fall behind in assignments or duties; miss deadlines; put off unpleasant tasks and are easily distracted while working on them; often lose things; rarely do any planning before undertaking tasks and assignments.
3-5

Table 3-4 NCAPS personality taxonomy
Construct and Definition High Scorers . . . Low Scorers . . .
Dutifulness/Integrity (DUT): does what is right and ethical; accepts authority and follows laws and regulations; is honest and trustworthy.
Have a strong sense of duty and moral obligation; try to do what is right and ethical; accept authority and follow laws, rules, and regulations; are honest and trustworthy; fulfill their obligations and commitments; accept responsibility for the consequences of their actions.
Are rebellious and contemptuous of laws, rules, and regulations; cannot be trusted; break promises; refuse to be held accountable for their own actions; are undisciplined and self-indulgent.
Self-Reliance (SRL): self-sufficient, resourceful, and able to make own decisions when appropriate; does not become dependent on others to get things done.
Are self-sufficient, resourceful, and like to make their own decisions; avoid becoming dependent on others to get things done.
Frequently rely on others to get things done; easily become dependent on others for advice and reassurance, and may feel insecure or helpless without that support; often take up receptive listeners’ time by confiding difficulties to them and seeking support.
Social Orientation (SO): outgoing, sociable, warm, likable, cooperative, and participative; likes to work with others rather than alone; likes and accepts people readily and values connections with others; establishes and maintains friendships easily.
Are outgoing, sociable, warm, likable, cooperative, and participative; like to work with others rather than alone; like and accept people readily; value connections with others; establish and maintain friendships easily; are sensitive to others’ needs and feelings; are understanding and helpful; increase cohesiveness in groups in which they participate.
Are shy, reserved, and aloof; prefer to be alone; are insensitive to others’ needs and feelings; are critical and generally unaccepting of others; create friction when around others.
Stress Tolerance (ST): Maintains composure and retains ability to think clearly and take effective action when confronted with stressful situations; can readily put aside worries to get the job done; accepts criticism without becoming upset.
Maintain composure and retain ability to think clearly and take effective action when confronted with stressful situations; can readily put aside worries and feelings of guilt; accept criticism without becoming upset.
Become indecisive or make poor decisions in times of stress due to loss of composure; are prone to feelings of worry, guilt, and vulnerability; are easily upset; tend to ruminate about troubling events and perceived failures; do not take criticism well.
3-6

Table 3-4 NCAPS personality taxonomy
Construct and Definition High Scorers . . . Low Scorers . . .
Vigilance (VIG): constantly scans the environment for things that require attention, even when no action may be required for long periods of time (e.g., staying alert to possible safety hazards).
Are able to constantly scan the environment for things that require attention, even when no action may be required for long periods of time (e.g., staying alert to possible safety hazards).
Experience lapses in attention when required to scan the environment for low frequency, but critical, actions or events over long periods of time.
Willingness to Learn (WTL): demonstrates an interest in and willingness to learn, e.g., in a classroom environment or on the job, or in general, and to apply that material in new situations; learns from mistakes, takes useful advice, and asks questions when unsure about something.
Demonstrate a willingness to learn new material in a classroom environment or on the job and to apply that material in new work situations; learn from mistakes, take useful advice, and ask questions when they are unsure about something; actively seek out learning opportunities; are interested in learning many different things.
Avoid training opportunities; do not apply what they learn in training to new work situations; do not learn from mistakes or listen to others’ advice; do not seek clarification when they fail to understand something in a training situation; have a narrow range of interests.
Note: Highlighted phrases were not included in definitions for the expert judgment task (mapping traits to Navy ratings).
3-7


Chapter 4. Developing and Scaling NCAPS Items (Kerri Ferstl and Janis Houston, PDRI)
Since items had already been developed, scaled, and pilot tested for three of the ten constructs selected for final inclusion in NCAPS, seven constructs remained: Adaptability/Flexibility (ADF), Attention to Detail (ADL), Dependability (DEP), Dutifulness/Integrity (DUT), Self-Reliance (SRL), Vigilance (VIG), and Willingness to Learn (WTL).
The following activities were conducted to accomplish our item writing/scaling objectives for these seven constructs:
• Facet identification—although NCAPS was not intended to include scorable facets, we divided the construct definitions into distinct subcomponents. The resulting facets were used to aid item development.
• Item writing—PDRI personnel wrote 1,403 new NCAPS items, targeting different trait levels to cover all facets of each target construct.
• Item review—all items were carefully reviewed, resulting in revision, deletion and addition of NCAPS items.
• Trait level scaling—following the same processes used in Phase 1, personality experts provided ratings used to scale each NCAPS item according to the level of the trait it represents. Items were reviewed again, based on the scaling results.
• Trait Level Coverage Assessment—we summarized item trait levels across the entire, final item bank, to ensure adequate coverage of all 10 constructs measured by NCAPS.
Each of these activities is described below.
Facet Identification
The NCAPS taxonomy was purposely constructed at a moderate level of trait specificity. In other words, we wanted constructs that were broad enough to allow for efficient measurement, but narrow enough not to obscure meaningful distinctions between traits (Ferstl, Schneider, Hedge, Houston, Borman, & Farmer, 2003). Thus, NCAPS was designed to yield 10 construct (or scale) scores, but not narrower facet scores.
Although we did not intend to develop scorable facets, it was useful to divide the trait definitions into their component parts for item development purposes. In Phase 1 development, we classified Achievement, Social Orientation, and Stress Tolerance items according to facets (Houston, Schneider, Ferstl, Borman, Hedge, Farmer, & Bearden, 2003). In Phase 1, we assigned items to facets after those items were written and scaled. Facets were then used to assess how well each trait was covered by existing items, and focus additional item writing efforts according to existing gaps.
4-1

Because the facets proved useful in Phase 1, we used them again in Phase 2. In Phase 2, however, we divided each construct definition into facets before writing items. Thus, facets served as a guide for item writers to help them to cover all elements of each trait. After the items were scaled for trait level, facets were used to assess how well each trait was covered, and focus additional item writing efforts according to existing gaps. The facets for all 10 constructs are shown in Table 4.1
Item Writing
Background and Instructions for Item Writers
NCAPS uses a computer-adaptive, forced-choice format (see Ferstl et al., 2003). When administered, NCAPS presents pairs of statements reflecting different levels of the same construct or trait. The test-taker indicates which of the two statements is more descriptive of him or her.
Nine PDRI researchers served as item writers.6 Item writers were given the NCAPS taxonomy (see Table 4.1) and were trained according to the background information and instructions included in Appendix C. Briefly, each item was to be a statement tapping one facet of a construct, at a particular trait level. As they did in Phase 1, item writers used the following 7-point scale to classify their items according to target trait level:
A person who agrees with this statement has a(n) _____ level of [the target trait].
1 – Extremely low 2 – Low 3 – Slightly low 4 – Moderate 5 – Slightly high 6 – High 7 – Extremely high
6 The project team thanks item writers Caroline Cochran, Michael Cullen, Kerri Ferstl, Jeff Johnson, Steve Lammlein, Liz Lentz, Vicky Pace, Amy Stellmack, and Shonna Waters.
4-2

Table 4-1 NCAPS facets used in item development
Achievement (AV)
AV1 Ambitious
AV2 Challenging goals
AV3 Confident in Abilities
AV4 Persists Despite Obstacles
AV5 Strives for Excellence
AV6 Works Hard
Adaptability/Flexibility (ADF)
ADF1 Adjusts Approach
ADF2 Likes Variety
ADF3 Diversity
ADF4 Adjusts to Environment
Attention to Detail (ADL)
ADL1 Accurate
ADL2 Detects Errors
ADL3 Organizes Belongings
Dependability (DEP)
DEP1 Planful
DEP2 On Schedule
DEP3 Handles Routine
DEP4 Doesn’t Procrastinate
Dutifulness/Integrity (DUT)
DUT1 Sense of Duty
DUT2 Follows Rules
DUT3 Trustworthy
DUT4 Accountable
Self-Reliance (SRL)
SRL1 Self-sufficient
SRL2 Makes Own Decisions
Social Orientation (SO)
SO1 Affiliation
SO2 Agreeable
SO3 Likes Teamwork
SO4 Sensitive
SO5 Team Player
Stress Tolerance (ST)
ST1 Maintains Composure
ST2 Accepts Criticism
ST3 Puts Aside Worries and Guilt
Vigilance (VIG)
VIG1 Vigilance
Willingness to Learn (WTL)
WTL1 Seeks knowledge
WTL2 Accepts Feedback
WTL3 Gets Clarification
WTL4 Broad Interests
4-3
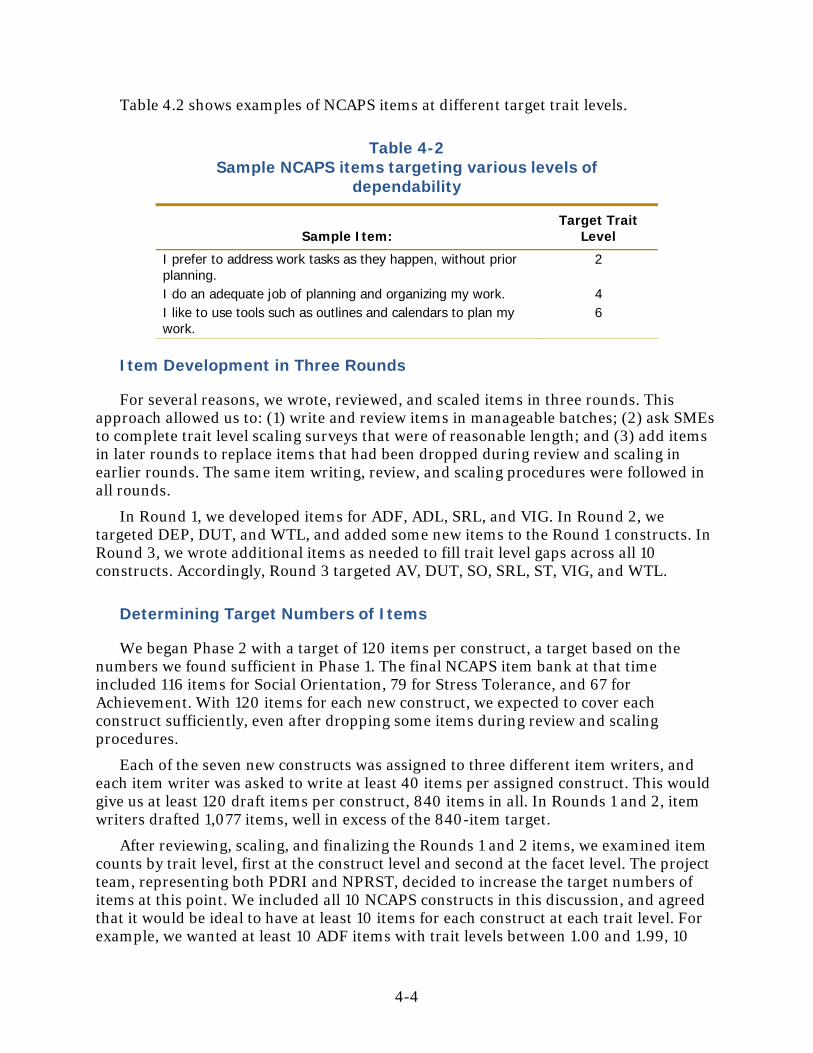
Table 4.2 shows examples of NCAPS items at different target trait levels.
Table 4-2 Sample NCAPS items targeting various levels of
dependability
Sample Item: Target Trait
Level
I prefer to address work tasks as they happen, without prior planning.
2
I do an adequate job of planning and organizing my work. 4 I like to use tools such as outlines and calendars to plan my work.
6
Item Development in Three Rounds
For several reasons, we wrote, reviewed, and scaled items in three rounds. This approach allowed us to: (1) write and review items in manageable batches; (2) ask SMEs to complete trait level scaling surveys that were of reasonable length; and (3) add items in later rounds to replace items that had been dropped during review and scaling in earlier rounds. The same item writing, review, and scaling procedures were followed in all rounds.
In Round 1, we developed items for ADF, ADL, SRL, and VIG. In Round 2, we targeted DEP, DUT, and WTL, and added some new items to the Round 1 constructs. In Round 3, we wrote additional items as needed to fill trait level gaps across all 10 constructs. Accordingly, Round 3 targeted AV, DUT, SO, SRL, ST, VIG, and WTL.
Determining Target Numbers of Items
We began Phase 2 with a target of 120 items per construct, a target based on the numbers we found sufficient in Phase 1. The final NCAPS item bank at that time included 116 items for Social Orientation, 79 for Stress Tolerance, and 67 for Achievement. With 120 items for each new construct, we expected to cover each construct sufficiently, even after dropping some items during review and scaling procedures.
Each of the seven new constructs was assigned to three different item writers, and each item writer was asked to write at least 40 items per assigned construct. This would give us at least 120 draft items per construct, 840 items in all. In Rounds 1 and 2, item writers drafted 1,077 items, well in excess of the 840-item target.
After reviewing, scaling, and finalizing the Rounds 1 and 2 items, we examined item counts by trait level, first at the construct level and second at the facet level. The project team, representing both PDRI and NPRST, decided to increase the target numbers of items at this point. We included all 10 NCAPS constructs in this discussion, and agreed that it would be ideal to have at least 10 items for each construct at each trait level. For example, we wanted at least 10 ADF items with trait levels between 1.00 and 1.99, 10
4-4

ADF items with trait levels between 2.00 and 2.99, and so on up to 10 ADF items with trait levels between 6.00 and 7.00. Some constructs are broader than others, so our item targets were even higher in some cases. We used the facet level item counts (by trait level) to identify, more specifically, where we wanted to add items. Although we decided not to set rigid targets at the facet level, we did aim to fill each and every facet-by-trait-level cell with a bare minimum of 2 items. With these guiding principles, we specified target numbers of items by facet and trait level. These targets then became the item writers’ assignments for the third and final round of item writing. Across all of Phase 2, we wrote a total of 1,403 new draft items for NCAPS. Table 4.3 shows the breakdown of drafted items by round and by construct.
Table 4-3 Count of draft items written in Phase 2, by round and construct
Construct Round 1 Round 2 Round 3 Total
ADF 150 54 0 204 AV 0 0 44 44 ADL 120 72 0 192 DEP 0 195 0 195 DUT 0 135 37 172 SO 0 0 29 29 SRL 165 34 11 210 ST 0 0 42 42 VIG 88 44 24 156 WTL 0 142 17 159
Grand Total 523 676 204 1,403 Note. The AV, SO, and ST scales were initially developed in Phase 1. We added small numbers of items to those
scales in Phase 2.
Item Review Based on Content
One member of the project team reviewed every draft item before proceeding with the scaling process. Items were checked for grammar and clarity, although few of the items needed revisions in those areas. The primary focus of this initial review was to ensure that item content was indeed a reflection of the intended construct and facet. This exercise highlighted the places where our constructs overlap with one another. For example, ADL3 (Organizing Belongings) bears some similarity to DEP2 (On Schedule). Part of the item review was to make sure that items about keeping work materials, personal belongings, documents, and so on organized were assigned to ADL3. Items about being well-organized in terms of time, schedules, and deadlines, however, belonged to DEP2. Some overlap across constructs is to be expected in a personality taxonomy, and does not present any particular problem. We did take steps, nonetheless, to write and classify our items carefully so that each item would be most germane to its own construct’s definition. The item reviewer developed a tool during this process, to help ensure consistent classification across similar facets. This tool is included as Appendix D.
4-5

Trait Level Scaling
SME Rating Task
All items written in Phase 2 were scaled by SMEs: experts in the domain of personality research. The SMEs independently rated the trait level of each of the 1,403 draft items. Because items were developed in three rounds, there were also three trait level surveys, administered at different times (containing 523, 676, and 204 new items each, respectively). At least 20 SMEs participated in each trait level survey: 8 or more representing NPRST and 12 or more representing PDRI. Each trait level survey contained the items to be rated along with the instructions and rating scale shown in Figure 4.1.
You will read and provide trait level ratings for statements representing various target traits. Definitions of the target traits are provided on the pages where you will make your ratings. Please make your ratings according to the following scale:
A p[th
1 –2 –3 –4 –5 –6 –7 –n/atra
erson who agrees with this statement has a(n) _____ level of e target trait].
Extremely low Low Slightly low Moderate Slightly high High Extremely high – This statement does not seem to be relevant to the target it.
We do not expect to see a large number of “n/a” ratings, but you should select “n/a” if you believe that the statement does not measure the target trait. Notice that the lowest rating, a “1,” indicates that the statement indicates a very low level of the target trait, and not that the statement is a poor indicator of the target trait.
Figure 4.1. Trait Level rating task: instructions.
4-6

Rater Screening
Trait level ratings were analyzed for anomalous responding by individual raters. Interrater reliability was very good, ranging from .82 to .88 (ICC 2, k; corrected to one rater) across the three trait level surveys. NCAPS methodology requires that trait level ratings of each statement be very precise, so we conducted further analyses and used stringent criteria to determine whether the data provided by any of the expert raters should be eliminated from the data set used to estimate the trait level of NCAPS items.
Following procedures from Phase 1, we compared raters’ profiles of trait level ratings to the profile of mean trait level ratings (computed across all other raters). Marked differences between a rater’s profile and the average profile would be evidence of anomalous responding. To make these comparisons, we computed the: (1) correlation between each rater’s profile and the profile of trait level means; and (2) Euclidean distance between each rater’s profile and the profile of trait level means. The correlation is an index of the extent to which a given rater’s profile has the same shape as the profile of trait level means. Euclidean distance is an index of the extent to which a given rater’s profile deviates from the profile of trait level means.
These analyses indicated that some raters had rating profiles that differed from the profile of trait level means to a substantially greater degree than did the profiles of the other raters. Further analyses were conducted to examine the extent to which these raters’ data accounted for outliers in the ratings, and to what extent their data affected the trait level estimates of the NCAPS items. Results of these analyses led to a conclusion that it would be prudent to exclude these raters in some cases. Specifically, we excluded one rater from the second survey, one rater from the third survey, and no raters from the first survey. Detailed accounts of rater screening processes and conclusions are provided in Appendices C, D, and E (one appendix for each survey). A summary of the numbers of SMEs used and the final interrater reliabilities is shown in Table 4.4.
Table 4-4 SMEs and interrater reliability, Trait Level scaling
Round 1 Round 2 Round 3
SMEs from NPRST 10 9 8 SMEs from PDRI 17 14 12 SMEs Excluded Based on Rater Screening 0 1 1 Final Number of SMEs Used to Scale NCAPS Items 27 22 19 Number of New Items Rated 523 676 204 Final ICC (2, k) Corrected to 1 Rater .88 .88 .84
4-7

Item Review Based on Trait Level Ratings
After dropping SME raters as indicated in the previous section, we calculated descriptive statistics for all items. We examined these results to identify items and individual ratings to be dropped.
The first step here was to identify outlier ratings. As in Phase 1, we defined “outlier” as a rating that was separated from the nearest rating by more than one scale point with a frequency equal to 0. For example, if one rater gave the item a 2 and all the other ratings were 4s and 5s, the 2 was considered to be an outlier. Combining all three rounds of item scaling, there were 28,519 individual ratings. Of these, 119 ratings (0.42%) were outliers. The outliers were assumed to be rater errors or data entry errors. As such, the individual outlier ratings were dropped from the data set and item statistics were recalculated.
Next, we applied the same criteria used in Phase 1 to identify problematic items. All items meeting one or more of the following criteria were flagged for further review:
• The item was rated as not relevant to the construct (n/a) by 10 percent or more of the raters
• Trait level standard deviation ≥ .90
• Trait level range ≥ 5 (range = maximum – minimum + 1)
Using these criteria, we flagged 252 items (18% of the item pool) for further review.
The 1,151 items that were not flagged for review using these criteria were considered final and added to the NCAPS item pool. The mean trait level across all retained trait level ratings (after excluding outlier ratings and raters as detailed above) became the final trait level for each of these items.
Two researchers examined flagged items for content and trait level statistics, then reached consensus about whether to keep or drop each item. Of the 252 flagged items, we dropped 139 (88 in Round 1, 34 in Round 2, and 17 in Round 3). In some cases, “dropped” items were revised and carried over to the next round to be rated again.
The remaining 113 flagged items were kept, as is. In most cases, these items only met one of the three criteria, and often met that criterion only narrowly. For example, some items were rated as not relevant to the construct by two raters, but the item content looked reasonable and the remaining trait level ratings had a small range and SD. Other items were retained despite having SD ≥ .90, because the SDs were < 1.0, the ranges were acceptable (i.e., < 5), and the content also appeared to be acceptable.
Final NCAPS Item Bank
At the conclusion of Phase 2, we had developed, scaled, and finalized 1,264 items for NCAPS. These were combined with the 259 items developed in Phase 1 (the pilot test version of NCAPS). Examining the item bank one final time, the project team identified 29 additional items to drop from the item bank. Most of these were dropped due to ambiguous content or unnecessary duplication.
4-8

The final NCAPS item bank contains 1,494 items. Each item has a trait level value ranging from 1.0 to 7.0, equal to the mean trait level value resulting from the scaling procedures described above. The standard deviations for these trait levels range from 0 to 1.27, with a mean of 0.64. Tables 6 and 7 include item counts by construct and facet, respectively.
Assessing Trait Level Coverage
NCAPS requires a large number of items to measure each construct in order for the adaptive, CARS methodology to work properly and to ensure a sufficient number of items all along the trait continuum for each construct. Recall that our item writing target numbers were based on this consideration. As a final check, we examined the distribution of trait levels represented in the item bank. Each distribution is based on the full and final item bank used in NCAPS, across both phases of item development. Table 4.5 shows item counts by construct and trait level; Table 4.6 shows counts at the facet level.
Trait level distributions were similar for each of the 10 constructs, with item counts greatest at the highest and lowest trait levels. The middle of each trait level continuum was represented by smaller numbers of items, but was still represented well enough for NCAPS to function and score people properly. In other words, it is not the case that there aren’t enough items in the middle of each scale; rather, there are more items than necessary at the extremes of each scale. In sum, it appears that the coverage of the entire trait domain from individual constructs is reasonable.
Table 4-5 Final NCAPS Item Bank: Item counts by trait level and construct
Construct Trait Level
1.00 to
1.99
2.00 to
2.99
3.00 to
3.99
4.00 to
4.99
5.00 to
5.99
6.00 to
7.00
Total Item Count
Achievement (AV) 21 24 8 13 20 22 108 Adaptability/Flexibility (ADF) 34 46 17 17 37 40 191 Attention to Detail (ADL) 32 39 11 14 31 37 164 Dependability (DEP) 35 50 16 12 31 41 185 Dutifulness/Integrity (DUT) 31 38 8 15 30 30 152 Self-Reliance (SRL) 33 67 18 12 33 36 199 Social Orientation (SO) 19 21 17 13 17 27 114 Stress Tolerance (ST) 19 26 10 20 20 24 119 Vigilance (VIG) 19 21 6 7 32 21 106 Willingness to Learn (WTL) 27 30 14 15 29 41 156 Total Item Count 270 362 125 138 280 319 1494
4-9

Table 4-6 Final NCAPS Item Bank: Item counts by trait level and facet
Construct Trait Level
1.00 to
1.99
2.00 to
2.99
3.00 to
3.99
4.00 to
4.99
5.00 to
5.99
6.00 to
7.00
Total Item Count
AV1: challenging goals 5 4 0 1 2 1 13 AV2: works hard/long time 3 7 2 3 1 4 20 AV3: persists despite obstacles 7 2 2 2 4 2 19 AV4: strives for excellence 1 4 0 1 6 5 17 AV5: confident in abilities 1 3 3 2 0 5 14 AV6: ambitious 4 4 1 4 7 5 25 ADF1: new approaches 10 10 5 2 9 6 42 ADF2: variety 9 9 3 6 9 6 42 ADF3: diversity 5 10 2 4 10 5 36 ADF4: environment 10 17 7 5 9 23 71 ADL1: accurate 13 18 5 4 10 18 68 ADL2: notice errors 5 7 0 5 7 9 33 ADL3: organized 14 14 6 5 14 10 63 DEP1: plans work 4 5 3 7 11 11 41 DEP2: reliable 15 13 5 3 6 14 56 DEP3: routine tasks 11 22 6 1 10 10 60 DEP4: does not procrastinate 5 10 2 1 4 6 28 DUT1: ethical 7 6 1 5 7 12 38 DUT2: follows rules 11 14 3 3 7 2 40 DUT3: trustworthy 6 9 2 3 10 9 39 DUT4: accountable 7 9 2 4 6 7 35 SRL1: works independently 9 22 8 6 17 15 77 SRL2: makes own decisions 24 45 10 6 16 21 122 SO1: affiliation 10 11 4 2 8 16 51 SO2: agreeable 3 7 1 3 4 2 20 SO3: likes teamwork 2 2 8 2 2 3 19 SO5: team player 4 1 4 6 3 6 24 ST1: composure 8 11 4 8 4 14 49 ST2: put aside worries/guilt 2 5 3 4 6 5 25 ST3: criticism 9 10 3 8 10 5 45 VIG1: vigilant 19 21 6 7 32 21 106 WTL1: wants to learn 12 3 3 7 6 15 46 WTL2: learns from feedback 7 7 5 2 6 6 33 WTL3: gets clarification 4 8 4 2 9 5 32 WTL4: broad interests 4 12 2 4 8 15 45 Total Item Count 270 362 125 138 280 319 1494
4-10
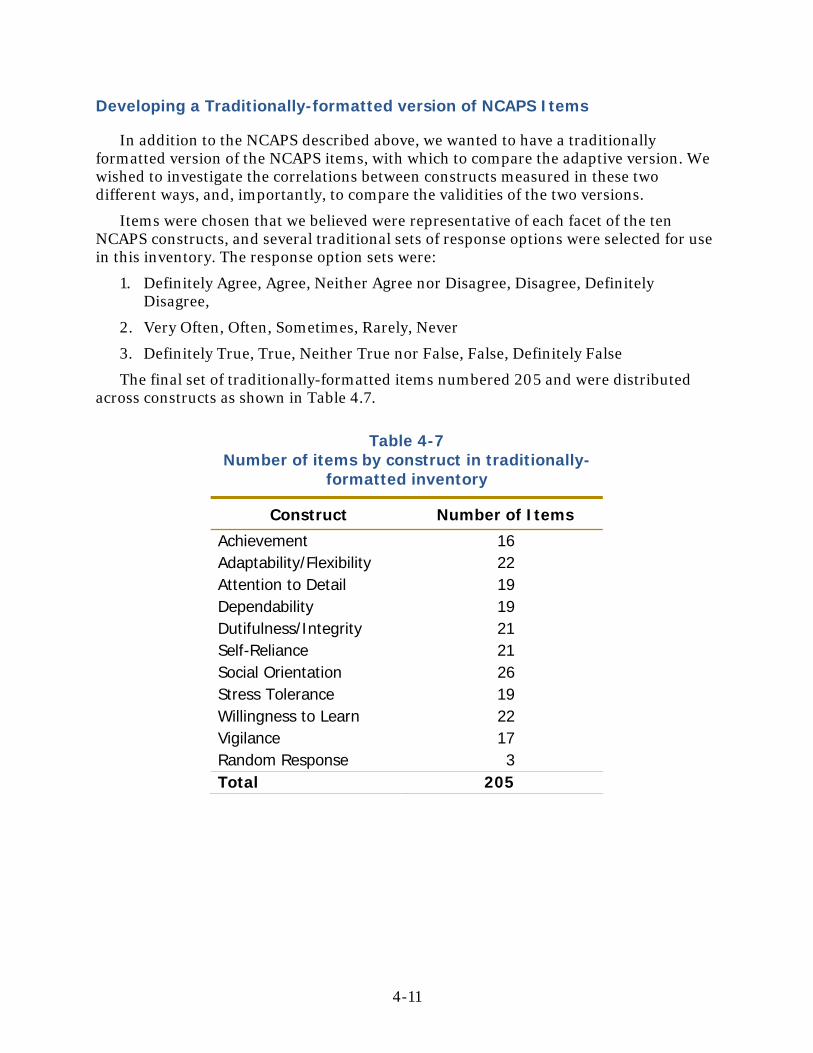
Developing a Traditionally-formatted version of NCAPS Items
In addition to the NCAPS described above, we wanted to have a traditionally formatted version of the NCAPS items, with which to compare the adaptive version. We wished to investigate the correlations between constructs measured in these two different ways, and, importantly, to compare the validities of the two versions.
Items were chosen that we believed were representative of each facet of the ten NCAPS constructs, and several traditional sets of response options were selected for use in this inventory. The response option sets were:
1. Definitely Agree, Agree, Neither Agree nor Disagree, Disagree, Definitely Disagree,
2. Very Often, Often, Sometimes, Rarely, Never
3. Definitely True, True, Neither True nor False, False, Definitely False
The final set of traditionally-formatted items numbered 205 and were distributed across constructs as shown in Table 4.7.
Table 4-7 Number of items by construct in traditionally-
formatted inventory
Construct Number of Items
Achievement 16 Adaptability/Flexibility 22 Attention to Detail 19 Dependability 19 Dutifulness/Integrity 21 Self-Reliance 21 Social Orientation 26 Stress Tolerance 19 Willingness to Learn 22 Vigilance 17 Random Response 3 Total 205
4-11

Chapter 4. References
Ferstl, K. L, Schneider, R. J, Hedge, J. W., Houston, J. S., Borman, W. C., & Farmer, W. L. (2003). Following the Roadmap: Evaluating Potential Predictors for Navy Selection and Classification. (Technical Report No. 421). Minneapolis: Personnel Decisions Research Institutes, Inc.
Houston, J. S., Schneider, R. J., Ferstl, K. L., Borman, W. C., Hedge, J. W., Farmer, W. L., & Bearden, R. M. (2003). NCAPS: Development of the Enlisted Computer Adaptive Personality Scales for the United States Navy (Institute Report #449). Minneapolis: Personnel Decisions Research Institutes, Inc.
Shrout, P. E., & Fleiss , J. L. (1979). Intraclass correlations: Uses in assessing rater reliability. Psychological Bulletin, 86, 420-428.
4-12

Chapter 5. Initial Validation of NCAPS (Rob Schneider, Walter Borman and Janis Houston, PDRI)
Overview
In this chapter, we describe methodology used to analyze Adaptive and Traditional NCAPS data, work performance data, and the relationship between NCAPS and work performance data. We report and interpret results of that analysis, with special emphasis on comparing Adaptive and Traditional NCAPS. Of particular interest is the number of items and length of time required to attain asymptotic levels of validity for Adaptive versus Traditional NCAPS. We also investigate gender and race/ethnicity subgroup differences on Adaptive versus Traditional NCAPS scales and the extent to which the Adaptive NCAPS item pool is fully utilized. Follow-on research ideas designed to yield information useful to the Navy’s understanding of Adaptive NCAPS are also suggested.
Analysis of Examinee Data
Description of Examinee Sample
The characteristics of the examinee sample are presented in Tables 5.1 and 5.2. The NCAPS validity data set consists of 305 individuals. Of these, 51 cases are missing demographic data. Of the remaining 254 examinees, the sample is 73 percent male and 27 percent female. There are 63 percent Caucasian; 24 percent African-American; and 6 percent is Asian/Native Hawaiian/Other Pacific Islander, American Indian/Alaska Native, or missing. The mean age of the examinees at the time of testing was 23.2 years (SD = 3.3 years). As shown in Table 5.2, the examinees represent 70 naval enlisted ratings, with the most prevalent being AN, AA, ADAN, AEAN, AMAN, and AR.
Table 5-1 Background characteristics of examinee sample
N Percent Gender Female 69 27.2
Male 185 72.8 Total 254 1.0
Race White 161 63.4 Black or African-American 63 24.8
Asian, Native Hawaiian or Other Pacific Islander 6 2.4
American Indian/Alaska Native 8 3.1 Declined to Respond 14 5.5 Missing 2 .7 Total 254 100.0
Mean SD Min Max N Age at Time of Testing
23.2 3.3 19 37 249
5-1

Table 5-2 Frequency distribution for examinees’ Naval
enlisted ratings
Rating n Percent AA 20 7.9 ABH3 1 .4 ABHAA 1 .4 ABHAN 1 .4 AC3 1 .4 AD3 3 1.2 ADAA 5 2.0 ADAN 18 7.1 AE2 1 .4 AE3 6 2.4 AEAA 5 2.0 AEAN 16 6.3 AEAR 1 .4 AM3 7 2.8 AMAA 7 2.8 AMAN 12 4.7 AMAR 1 .4 AMEAA 1 .4 AN 23 9.1 AOAA 1 .4 AOAN 2 .8 AR 12 4.7 AS3 1 .4 ASAA 2 .8 ASAN 3 1.2 AT3 2 .8 ATAA 4 1.6 ATAN 9 3.5 ATAR 1 .4 AZ3 2 .8 AZAN 2 .8 AZAR 1 .4 EM3 5 2.0 EMFN 2 .8 EN3 2 .8 ENFN 2 .8 ET2 1 .4 ET3 3 1.2
ETSA 2 .8
5-2

Table 5-2 Frequency distribution for examinees’ Naval
enlisted ratings
Rating n Percent ETSR 1 .4 FA 2 .8 GSE3 2 .8 GSM3 5 2.0 GSMFN 2 .8 HN 1 .4 HT2 2 .8 HT3 2 .8 ISSN 1 .4 IT3 1 .4 ITSN 1 .4 MM3 5 2.0 MMFA 1 .4 MMFN 2 .8 MS3 1 .4 OSSN 2 .8 PR3 2 .8 PRAN 4 1.6 PRAR 1 .4 SA 7 2.8 SKSA 1 .4 SKSN 2 .8 SN 6 2.4 SR 2 .8 STS3 1 .4 STSSA 1 .4 STSSN 1 .4 YN3 3 1.2 YNSN 1 .4 YNSR 1 .4
Data Screening Analyses
We conducted several data screens to eliminate low quality data from subsequent analyses. We screened Traditional and Adaptive NCAPS data using the following methodology:
5-3

Traditional NCAPS Screening.
Missing Data Screen. The first of these data screens was based on the amount of missing data in the examinees’ responses. Given that the Adaptive NCAPS program required examinees to respond to each item-pair before being allowed to move on, this screen was applied only to Traditional NCAPS. There was very little missing data. Two hundred ninety-six examinees had no missing responses, one examinee had 16 (7.8%) missing responses, and eight examinees had 183 or more missing responses. No examinee had between 16 and 183 missing responses. Given this distribution of missing responses, we eliminated an examinee’s record from further analyses if she/he had 183 or more missing responses. This eliminated four examinees’ records (excluding four examinees who had no Traditional NCAPS data.)
Random Response Screen. The second data quality screen was used to analyze responses to items we included in Traditional NCAPS to detect random responding. These items read as follows: “This item is for data processing purposes only. Please mark ‘__’.” There were three such items that varied according to the response option examinees were instructed to select. Examinees were instructed to mark response options ‘a,’ ‘c,’ and ‘e,’ respectively. Examinees were allowed one random response without having their data eliminated from further analyses. Fifteen examinees (5.0%) had two random responses and seven (2.3%) examinees had three random responses. This screen therefore eliminated a total of 22 examinees (7.3%).
Non-Variable Responding Screen. We computed standard deviations across Traditional NCAPS items for each examinee to determine if any had selected the same response an unlikely number of times (e.g., due to lack of interest). The frequency distribution of standard deviations across Traditional NCAPS responses revealed that two examinees had standard deviations of zero. This was due to the fact that virtually all of their responses were missing. These examinees’ data would therefore have been eliminated from further analyses due to the missing data screen described above. The remaining examinees’ standard deviations ranged from .34 to 1.94. We carefully scrutinized the records of the three examinees with standard deviations between .34 and .50, as these were a bit low and represented a slight break from the other standard deviations in the frequency distribution. In one case, an examinee’s data were screened out based on other screens. We found no evidence of anomalous responding in the case of the other two examinees, and therefore retained their data. Thus, a total of three examinees’ data was eliminated based on the non-variable responding screen.
Response Latency Screen. The NCAPS computer program captured the amount of time that elapsed between the presentation of each item (for Traditional NCAPS) or item-pair (for Adaptive NCAPS) and the examinees’ responses to those items/item-pairs. This time interval is known as “response latency.” Among other things, response latency data allowed us to identify examinees responding at a rate of speed that would make it extremely unlikely that they were providing accurate data. We computed the mean response latency across the 205 Traditional NCAPS items for each examinee. Inspection of these data revealed that, among examinees with mean response latencies less than 4 seconds (n = 12), 7 had Random Response scale scores of 2 or 3 and/or standard deviations equal to 0; and 11 had Random Response scale scores of 1 or more and/or standard deviations equal to 0. Similar anomalies occurred very infrequently,
5-4

however, for examinees with mean response latencies greater than 4 seconds. This strongly suggested that examinees with Traditional NCAPS mean response latencies less than 4 seconds should have their Traditional NCAPS data eliminated from further analyses7.
While we were most concerned about the data with excessively low response latencies across items, excessively long latencies maintained over a large set of items was also a source of some concern. While intermittent long latencies may be due to daydreaming, bathroom breaks, or asking questions of test administrators, sustained latencies of excessive length may suggest confusion, perturbability, or “untraitedness” (i.e., possessing a trait to a limited extent relative to others; cf. Britt, 1993; Tellegen, 1988). Inspection of the frequency distribution of response latency means for Traditional NCAPS revealed a break between the second highest and the highest values. We conducted a nonparametric outlier analysis (nonparametric, due to the highly skewed nature of the frequency distribution) to determine if the examinee whose mean latency fell above this break in the distribution was an outlier. Scores that fall above the 75th percentile plus three times the interquartile range (IQR) constitute “extreme outliers” in this type of analysis (Devore & Peck, 1986). This cutoff value for an “extreme outlier” is 16.6 seconds for Traditional NCAPS, which falls between the last two entries in the frequency distribution of mean response latencies (15.99 and 19.0). On the basis of the foregoing, we deleted the Traditional NCAPS data for the examinee with the mean response latency of 19.0 seconds.
Adaptive NCAPS Screening
We screened Adaptive NCAPS data using the following methodology:
Response Latency Screen. A somewhat higher minimum mean response latency seemed indicated for Adaptive NCAPS than for Traditional NCAPS. This is because, with Adaptive NCAPS, examinees must read and compare two statements with respect to self-relevance, rather than just reading one statement.
To determine how much higher the minimum mean latency should be for Adaptive NCAPS than for Traditional NCAPS, we inspected the frequency distributions of mean response latencies for both Adaptive and Traditional NCAPS. To determine an appropriate escalation factor for Adaptive NCAPS, we computed the ratio of mean latencies at the 25th percentiles of those frequency distributions. Our rationale was that, since we were interested in establishing a minimum mean latency cutoff, it would make the most sense to look at the ratio for those who tend to respond quickly, but not so quickly that their data would be questionable. The ratio of mean response latencies at the 25th percentiles for Adaptive versus Traditional NCAPS was 8.18/6.22 = 1.3. We then multiplied 3.87, which was the operational cutoff point for Traditional NCAPS mean latencies, by 1.3 and got approximately 5.1. We therefore instituted a screening rule that a mean response latency of 5.0 seconds would be the cutoff for Adaptive NCAPS.
7 The cutoff was actually at 3.87 seconds, as there was no one who had a mean response latency score between 3.87 and 4 seconds.
5-5

No-SSN Screen. Two cases were eliminated from further analyses because they had no social security number data, making it impossible for us to match their data across data sets.
Scoring Traditional NCAPS Responses
Examinees responded to the Traditional NCAPS items on a 5-point Likert-type scale ranging from Strongly Disagree to Strongly Agree. Personality tests using this response scale are typically scored by assigning five points for the response of Strongly Agree, four points for the response of Agree, and so on (with the scores reversed for negatively-worded items). This type of scoring was not appropriate for Traditional NCAPS, however, because the item statements represented the full trait continuum for each NCAPS construct. As such, many items were not clear exemplars of the high and low end of the trait continua. Moreover, even among those items that clearly represented positive or negative exemplars of a given trait, differing degrees of high and low were represented. It was, therefore, necessary to devise a scoring system that incorporated trait level information. Houston et al. (2003) developed a method for converting the 5-point Likert-type scale response options to NCAPS item scores. That method is captured in the matrix of trait level information-by-response scale options shown in Table 5.3. The trait levels are based on a consensus of experts, and range from 2 to 8. This trait level information and the 1-5 response scale jointly determine an examinee’s Traditional NCAPS item score. Those item scores can range from 0 to 6. While the Traditional NCAPS response scale can only assume integer values between 1 and 5, Traditional NCAPS trait levels are not limited to integers. As such, it was necessary to develop an algorithm that would enable us to interpolate Traditional NCAPS item scores for non-integer trait level values. We therefore developed equations to convert each NCAPS response scale level to an item score. Specifically, we conducted five regressions, one for each of the five Traditional NCAPS response scale values. We regressed a variable consisting of the seven possible Adaptive NCAPS trait level values (ranging from 2 to 8) on a variable comprised of the seven re-scaled values found in the row of Table 5.3 associated with the Traditional NCAPS response scale value for which the conversion equation was being developed.
Table 5-3 Score values assigned to Traditional NCAPS Items, by trait level and
response
Traditional NCAPS Response Scale Item Trait Level
2 3 4 5 6 7 8 Strongly Disagree 1 6.0 5.0 4.0 3.0 2.0 1.0 0.0
Disagree 2 4.5 4.0 3.5 3.0 2.5 2.0 1.5 Neither Agree Nor Disagree 3 3.0 3.0 3.0 3.0 3.0 3.0 3.0
Agree 4 1.5 2.0 2.5 3.0 3.5 4.0 4.5 Strongly Agree 5 0.0 1.0 2.0 3.0 4.0 5.0 6.0
Note. Trait levels are based on expert ratings and can assume any value between 2.0 and 8.0 (i.e., trait levels are not limited to integers).
5-6

These conversion equations are as follows:
If response = 1, x = 8 – TL (1)
If response = 2, x = 5.5 - (TL/2) (2)
If response = 3, x = 3 (3)
If response = 4, x = 0.5 + (TL/2) (4)
If response = 5, x = TL – 2, (5)
where x is converted Traditional NCAPS item score and TL is trait level.
Descriptive Statistics, Reliability Analyses, and Intercorrelations
Traditional NCAPS Scales
We examined corrected item-scale correlations within each of the Traditional NCAPS scales to identify items the removal of which would enhance the psychometric properties of the scales. As a general rule, items that correlated r < .20 with their scale were dropped. Two items with corrected item-scale correlations between .15 and .20 were retained, however, in order to avoid depleting certain facets of the Achievement scale. Eighteen items were eliminated based on this screen.
Items were also eliminated if they had very low standard deviations, such that they contributed virtually no variance to their scale scores. Sixteen items with SDs below .15 were eliminated based on this criterion. As expected, many of these items were also eliminated by the low corrected item-scale correlation screen. A total of 27 items (13.2%) were eliminated from the 205 Traditional NCAPS items based on these item revision screens.
As one would expect, the standard deviations and alpha coefficients increased somewhat as a result of the revision process. Item means were largely unaffected, with the exception of the means for the Dependability and Vigilance scales, which increased somewhat. Histograms for the revised Traditional NCAPS scales are shown in Appendix H. These histograms show an approximate normal distribution for most Traditional NCAPS scales.
Table 5.4 shows descriptive statistics and internal consistency reliabilities (coefficient alpha) for Traditional NCAPS scales before and after revision based on item analyses (see below). The post-item revision means for the 10 Traditional NCAPS scales range from 3.29 to 3.66, which is slightly above the midpoint of the 0 to 6 Traditional NCAPS (converted) trait level scale. The variability around the mean scores is adequate. The internal consistency reliabilities range from .75 to .85 (median = .80) and are, therefore, all acceptably high.
5-7

Table 5-4 Descriptive statistics and internal consistency reliabilities for Traditional
NCAPS
Pre-Item Revision Post-Item Revision
Scale
Number of
Items Mean SD Alpha
Number of
Items Mean SD Alpha
Adaptability/ Flexibility 21 3.26 .32 .79 17 3.31 .39 .80 Attention to Detail 19 3.40 .40 .82 16 3.49 .47 .83 Achievement 16 3.58 .41 .81 15 3.63 .43 .81 Dependability 19 3.49 .40 .82 15 3.61 .51 .84 Dutifulness 21 3.59 .36 .76 19 3.63 .39 .77 Social Orientation 26 3.49 .42 .85 25 3.54 .46 .85 Self-Reliance 20 3.26 .29 .75 16 3.29 .37 .75 Stress Tolerance 18 3.29 .52 .84 18 3.31 .55 .84 Vigilance 17 3.48 .34 .77 13 3.66 .45 .79 Willingness to Learn 22 3.61 .34 .75 18 3.66 .39 .77 Note. NCAPS scale scores have been converted from a 1 to 5 to a 0 to 6 scale. For means and SDs, n = 257 to 267 prior to item
revision and n = 258 to 268 subsequent to item revision. For alpha coefficients, n = 229 to 256 prior to item revision and n = 229 to 257 subsequent to item revision.
Traditional NCAPS Facets
Table 5.5 shows descriptive statistics and internal consistency reliabilities for the Traditional NCAPS facets8. Facets are organized by scale. In general, the facets show internal consistency reliabilities that are about what one would expect given the number of items that comprise them. The facets on which the examinees scored highest were Reliable/Efficient with Time (Dependability facet) and Honest/Trustworthy/Fulfills Obligations (Dutifulness facet), and Willing to Learn/Actively Seeks Learning Opportunities (Willingness to Learn facet). The facets on which examinees scored lowest were Likes Teamwork (Social Orientation facet), Puts Aside Worries/Guilt (Social Tolerance facet), Not Dependent (Self-Reliance facet), and Adapt to New Situations (Adaptability/Flexibility facet).
8 Although the adaptive NCAPS item pool includes items from all facets, Adaptive NCAPS does not yield facet-level measurement due to the prohibitively large number of items that would have been required. Facets were created primarily to facilitate appropriate sampling of items across personality trait sub-domains, though the Traditional NCAPS facet scales also shed light on some of our findings and are therefore reported and discussed.
5-8

Traditional NCAPS Items
Traditional NCAPS item-level descriptive statistics are presented in Appendix I.
Adaptive NCAPS Scales
Table 5.6 shows descriptive statistics for Adaptive NCAPS scales. Statistics are shown for the expected a posteriori estimate (EAP), the posterior standard deviation (PSD), the conditional standard error of measurement (SEM), and test information for each of the 10 NCAPS scales. EAP is a measure of trait level, PSD and SEM are measures of standard error around EAP, and test information is a measure of the amount of information relevant to an examinee’s trait level that is being gathered at each point along the trait level (θ) continuum.
The mean EAP ranges from 5.58 for Self-Reliance to 6.25 for Willingness to Learn. PSD and SEM are very similar across the 10 NCAPS scales. Test information is also quite similar across the NCAPS scales, ranging from 9.63 (Willingness to Learn) to 10.53 (Self-Reliance). Histograms for the trait level (EAP) estimates for each of the 10 Adaptive NCAPS scales are shown in Appendix J. These histograms reveal excellent variability across examinees within each construct, with a bit of a negative skew.
Table 5-5 Descriptive statistics and internal consistency reliabilities of Traditional
NCAPS facets
Facet Scale No. of Items Minimum Maximum Mean SD Alpha
Adaptability/Flexibility Facets Willing to Change Task/ Project Approach
4 1.81 4.88 3.40 .54 .45
Likes Variety 4 1.77 4.38 3.34 .43 .42 Work with Different People 5 1.86 4.43 3.35 .40 .51 Adapt to New Situations 5 1.36 4.76 3.18 .62 .65 Attention to Detail Facets Exacting/Precise 5 1.88 4.78 3.59 .52 .62 Spot Imperfections/Errors 4 1.09 5.18 3.50 .73 .67 Neat/Organized 7 2.07 4.55 3.41 .47 .64 Achievement Facets Ambitious 3 1.29 4.88 3.37 .60 .40 Challenging Goals 2 2.17 4.66 3.58 .55 .22 Confident in Abilities 2 2.22 4.57 3.60 .54 .35 Persists Despite Obstacles 2 1.40 4.89 3.71 .63 .33 Strives for Excellence 3 1.96 5.03 3.84 .64 .43 Works Hard/Long Time 3 2.02 4.70 3.64 .56 .43
5-9

Table 5-5 Descriptive statistics and internal consistency reliabilities of Traditional
NCAPS facets
Facet Scale No. of Items Minimum Maximum Mean SD Alpha
Dependability Facets Orderly/Planful/Prioritizes 4 1.88 4.40 3.30 .53 .64 Reliable/Efficient with Time 4 1.91 5.18 4.15 .61 .61 Not Easily Distracted/Bored 4 1.31 5.03 3.52 .69 .64 Doesn’t Procrastinate 3 1.16 5.16 3.39 .72 .47 Dutifulness Facets Sense of Duty/Moral Obligation 3 1.32 5.51 3.57 .69 .27 Accepts Authority/Follows Rules 6 1.66 4.63 3.39 .51 .68 Honest/Trustworthy/Fulfills Obligations
6 2.74 4.73 3.90 .44 .61
Accepts Responsibility 4 1.78 4.98 3.64 .56 .47 Social Orientation Facets Affiliation 11 1.88 5.03 3.68 .55 .76 Agreeable 4 2.30 4.33 3.42 .40 .39 Likes Teamwork 3 .90 5.10 3.07 .74 .35 Team Player 5 1.54 5.40 3.59 .66 .64 Self-Reliance Facets Not Dependent 6 2.30 4.24 3.17 .41 .47 Self-Sufficient/Resourceful 10 1.55 4.54 3.36 .42 .69 Stress Tolerance Composure 10 1.22 5.12 3.42 .64 .77 Accepts Criticism 2 1.58 4.73 3.34 .67 .23 Puts Aside Worries/Guilt 6 1.51 4.92 3.10 .66 .70 Willingness to Learn Facets Willing to Learn/Actively Seeks Learning Opportunities
5 2.13 4.56 3.89 .39 .60
Learns from Mistakes/ Takes Good Advice
4 1.66 4.77 3.53 .50 .40
Asks Clarifying Questions 4 1.91 4.87 3.78 .57 .56 Broad Interests 5 1.81 4.96 3.43 .66 .53 Note. n = 252-268. Facets consisting of two items have Pearson product-moment correlations in the “Alpha” column.
5-10

Table 5-6 Descriptive statistics for Adaptive NCAPS scales
Minimum Maximum Mean SD
Expected A Posteriori (Trait Level) Estimate
Adaptability/Flexibility 2.79 7.30 5.73 .84 Attention to Detail 2.82 7.12 5.86 .83 Achievement 2.93 7.26 5.91 .76 Dependability 2.95 7.49 5.79 .99 Dutifulness 3.27 7.36 6.10 .78 Social Orientation 2.82 7.30 5.65 .82 Self-Reliance 2.85 7.39 5.58 .77 Stress Tolerance 2.76 7.41 5.76 1.02 Vigilance 2.85 7.48 5.86 .92 Willingness to Learn 3.78 7.38 6.25 .75 Posterior Standard Deviation (PSD)
Adaptability/Flexibility .28 .47 .31 .04 Attention to Detail .28 .42 .30 .02 Achievement .28 .47 .31 .04 Dependability .29 .44 .31 .02 Dutifulness .28 .46 .32 .04 Social Orientation .28 .46 .30 .03 Self-Reliance .28 .40 .30 .02 Stress Tolerance .28 .42 .31 .03 Vigilance .28 .46 .31 .02 Willingness to Learn .28 .46 .32 .03 Conditional Standard Error of Measurement
Adaptability/Flexibility .29 .62 .32 .06 Attention to Detail .29 .43 .31 .02 Achievement .29 .61 .33 .07 Dependability .29 .56 .32 .04 Dutifulness .29 .61 .33 .06 Social Orientation .29 .59 .32 .05 Self-Reliance .29 .56 .31 .04 Stress Tolerance .29 .58 .33 .06 Vigilance .29 .61 .32 .05 Willingness to Learn .29 .58 .33 .06 Test Information Adaptability/Flexibility 2.62 11.85 10.05 1.88 Attention to Detail 5.33 11.69 10.39 1.02 Achievement 2.70 11.96 10.11 2.26
5-11

Table 5-6 Descriptive statistics for Adaptive NCAPS scales
Minimum Maximum Mean SD
Dependability 3.20 11.72 10.00 1.74 Dutifulness 2.68 11.97 9.77 2.02 Social Orientation 2.83 11.98 10.43 1.77 Self-Reliance 3.22 11.84 10.53 1.39 Stress Tolerance 3.01 12.07 9.82 2.03 Vigilance 2.68 12.05 10.06 1.79 Willingness to Learn 2.94 11.93 9.63 1.98 Note. n = 262
Computation of the reliability of Adaptive NCAPS is complicated somewhat by the fact that reliability is conditional upon trait level (θ). However, the reliability formula is very similar to that found in classical test theory:
ρ = 1 – σ2e*, (6)
where ρ is reliability and σ2e* is the variance of the error of estimation of θ (Thissen, 2000). Reliability is contingent on θ because σ2e* varies as a function of θ. As such, item response theory (on which Adaptive NCAPS is based) has no direct analogue to coefficient alpha in classical test theory. In the Adaptive NCAPS data, however, σ2e* is very similar across θ levels, which means that the reliability of each Adaptive NCAPS scale can, to a large extent, be summarized by a single reliability coefficient. Nevertheless, Table 5.7 shows the reliability of each Adaptive NCAPS scale at different points along the PSD distribution (PSD2 = σ2e*). This table shows that, between the lowest value and the 90th percentile value of the PSD distribution, the reliability estimates differ by no more than .05 across scales. The reliabilities are uniformly high and are good even at the highest PSD level. Indeed, the reliability of Adaptive NCAPS exceeds that of Traditional NCAPS, even after item revision of the Traditional NCAPS scales.
5-12

Table 5-7 Reliability of Adaptive NCAPS by scale at various points along the
posterior standard deviation (PSD) distribution
NCAPS Scale Lowest
PSD Median
PSD
90th Percentil
e PSD Highest
PSD Adaptability/Flexibility .92 .91 .88 .78 Attention to Detail .92 .91 .90 .82 Achievement .92 .91 .88 .78 Dependability .92 .91 .89 .81 Dutifulness .92 .91 .87 .79 Social Orientation .92 .91 .89 .79 Self-Reliance .92 .91 .90 .84 Stress Tolerance .92 .91 .87 .82 Vigilance .92 .91 .89 .79 Willingness to Learn .92 .91 .87 .79 Median Reliability Across Scales .92 .91 .89 .79 Note. n = 254.
Relationship Between EAP (Adaptive NCAPS Trait Level) and Test Information/Conditional Standard Error of Measurement
Appendix K contains scatterplots showing the relationships between trait level and test information for each of the 10 Adaptive NCAPS scales. Appendix L contains scatterplots showing the relationships between trait level and conditional standard error of measurement for each of the 10 Adaptive NCAPS scales. These scatterplots show that test information decreases sharply and conditional SEM increases sharply for examinees scoring very high or very low on EAP (trait level) for each Adaptive NCAPS scale. Also, there is substantially greater density of higher PSD and lower test information data points at high trait levels than at low trait levels.
NCAPS Scale Intercorrelations
Intercorrelations between Traditional NCAPS scales, intercorrelations between Adaptive NCAPS scales, and correlations between Traditional and Adaptive NCAPS scales are shown in Table 5.8. Intercorrelations between Traditional NCAPS scales are higher than those between Adaptive NCAPS scales. Traditional NCAPS intercorrelations range from .19 to .73 (median = .53), and Adaptive NCAPS intercorrelations range from -.13 to .57 (median = .37). These data suggest that Adaptive NCAPS provides more construct-valid intercorrelation estimates than Traditional NCAPS. For example, the “Big-Five” personality dimensions are all represented in the NCAPS taxonomy, which is inconsistent with positive manifold (e.g., Ones, Viswesvaran, & Reiss, 1996). The fact that the Adaptive NCAPS scale intercorrelations exhibit positive manifold to a much lesser extent than the Traditional NCAPS scale intercorrelations is evidence in favor of greater construct validity for Adaptive NCAPS scales.
5-13

5-14
That said, the construct validity of both Traditional and Adaptive NCAPS scales is supported by the convergent validity coefficients between Traditional and Adaptive NCAPS measures of the same construct in Table 5.8. Convergent validities range from r = .53 to .74 (median r = .64). Only one out of ten convergent validity coefficients (for Willingness to Learn) was lower than the highest discriminant validity coefficient for the construct in question. This pattern of convergent and discriminant validities provides additional support for the Adaptive NCAPS measurement approach.
Analysis of Performance Rating Data
Performance ratings were available for 249 of the examinees in this study, and were obtained from 254 raters. Examinees were rated by a mean of 2.9 raters each (SD = 2.0), with a range of 1 to 11 raters per examinee. Raters rated a mean of 2.9 examinees each (SD = 1.4), with a range of 1 to 6 examinees per rater.

Table 5-8 Intercorrelations between traditional NCAPS scales, between Adaptive NCAPS scales,
and between Traditional and Adaptive NCAPS scales
1 2 3 4 5 6 7 8 9 10 11 12 13 14 15 16 17 18 19 20 Traditional NCAPS 1. Adaptability/Flexibility ⎯ 2. Attention to Detail .53 ⎯ 3. Achievement .58 .71 ⎯ 4. Dependability .52 .73 .68 ⎯ 5. Dutifulness .55 .59 .56 .69 ⎯ 6. Social Orientation .57 .43 .44 .41 .48 ⎯ 7. Self-Reliance .49 .33 .42 .48 .42 .19 ⎯ 8. Stress Tolerance .63 .47 .46 .56 .50 .41 .59 ⎯ 9. Vigilance .61 .66 .62 .72 .59 .41 .50 .61 ⎯ 10. Willingness to Learn .58 .51 .49 .53 .63 .48 .37 .54 .55 ⎯ Adaptive NCAP S 11. Adaptability/Flexibility .70 .41 .43 .41 .48 .49 .41 .56 .48 .55 ⎯ 12. Attention to Detail .38 .63 .46 .54 .52 .32 .22 .38 .52 .46 .42 ⎯ 13. Achievement .46 .52 .65 .51 .41 .31 .50 .42 .54 .45 .43 .42 ⎯ 14. Dependability .44 .57 .54 .62 .55 .32 .36 .40 .59 .39 .40 .56 .46 ⎯ 15. Dutifulness .32 .38 .33 .44 .57 .19 .25 .33 .44 .36 .30 .50 .27 .56 ⎯ 16. Social Orientation .50 .31 .27 .27 .37 .70 .15 .35 .29 .47 .46 .34 .21 .28 .16 ⎯ 17. Self-Reliance .13 .16 .23 .26 .08 -.09 .57 .26 .32 .05 .14 .13 .35 .24 .13 -.13 ⎯
18. Stress Tolerance .56 .38 .37 .45 .48 .40 .42 .71 .51 .48 .57 .37 .34 .42 .37 .37 .18 ⎯ 19. Vigilance .54 .54 .51 .59 .49 .34 .44 .51 .74 .52 .53 .53 .53 .55 .48 .28 .30 .49 ⎯
Note. n = 246-262. Correlations > .12 are statistically significant at p < .05. Convergent validities between Adaptive and Traditional NCAPS are in bold type. ⎯ 20. Willingness to Learn .41 .33 .30 .38 .40 .24 .33 .46 .35 .53 .49 .37 .41 .35 .35 .33 .16 .46 .49
5-15

Data Screening
We conducted several data quality screens on the performance rating data to eliminate low-quality data from further analyses.
Multiple Ratings Screen
If an examinee was given more than one rating on a given performance dimension, the rating for that performance dimension was recoded as missing.
Insufficient Acquaintanceship Screen
In certain cases, data collectors noted that a rater did not know the individuals he/she was rating well. In some cases, no ratings were even made (i.e., those individuals were not officially deemed “raters” in this study). In two cases, however, ratings were made. One of these two raters gave only 3 out of 10 ratings for each of the examinees that he rated. Since this was consistent with lack of adequate acquaintanceship, his data were eliminated from further analyses (and would have been screened out on the basis of excessive missing data anyway). The second rater provided complete sets of ratings for each examinee that he rated. Those data were carefully scrutinized, particularly with respect to consistency with the rating data provided by other raters of the same examinees. For each examinee, this rater’s ratings were consistent with those provided by the other raters. As such, his data were retained for further analyses.
We also checked to see if each rater identified as possibly having inadequate acquaintanceship with the performance of his/her examinees had served as an examinee in this study, and been rated by others. We reasoned that, if a rater did not know the performance of the individuals he/she was rating, those who rated that rater’s performance might suffer from a similar lack of acquaintanceship. Of the six individuals identified as having a possibly inadequate acquaintanceship with their examinees, only one served as an examinee in this study and had been rated by others. Those data were carefully scrutinized, judged to be free of anomalies, and retained for further analyses.
Hostility to the Rating Process
One rater was noted as having a “bad attitude” in the notes provided by our data collectors. As such, this individual’s ratings were carefully scrutinized. We noted that this rater gave all “1s” to one of the examinees, and that other raters gave the same examinee much higher ratings. This was consistent with the notion that the rater was hostile to the rating process, and unlikely to provide accurate ratings of examinees. As such, this rater’s rating data were eliminated from further analyses for all examinees that he rated.
5-16

Missing Data
As with the examinee data, we computed the number of missing responses for each rater-examinee combination. Out of 734 total rater-examinee combinations, 714 (97.3%) had no missing ratings, ten had one missing rating, one had three missing ratings, three had seven missing ratings, and six had ten missing ratings. While one, or even three, missing ratings is acceptable, seven missing ratings is not. We therefore eliminated rater-examinee records with more than three missing ratings from further analyses.
Non-Variability
Again, as with the examinee data, we computed the standard deviation across the 10 performance dimension ratings for each rater to identify cases with an improbable lack of variability in those ratings. Six rater-examinee records had standard deviations of zero across the 10 dimension ratings. However, only one of these six raters’ sets of ratings was inconsistent with other raters’ ratings of the same examinee, and only that rater’s data were eliminated from further analyses based on this screen.
Interrater Reliability and Agreement
To evaluate rater quality and further screen the performance rating data, we computed interrater reliability using ICC (2, k) (Shrout & Fleiss, 1979) and interrater agreement using rwg (James, Demaree, & Wolf, 1984), for each examinee rated by at least two raters. ICC (2, k) is a measure of the similarity of the pattern of ratings across raters (including both consistency and agreement), and rwg measures agreement in the absolute level of the ratings. The mean rwg, as well as rwg for an Overall Performance composite across rating dimensions, both including and excluding the Overall Potential rating, are shown in Appendix M. The intra-class correlations were low in many cases, but it is important to remember that, in this screening context, ICC (2, k) was computed across only 10 data points. By contrast, rwg was quite high. No rater-examinee data were eliminated solely on the basis of low ICC (2, k). So long as there was adequate interrater agreement, based on the rwg statistic for the performance dimension composites, data were retained. ICC (2, k) data were primarily utilized to evaluate whether removal of certain subsets of raters within examinee substantially improved interrater reliability (as well as rwg). Subsets of one or more such raters were identified by examining corrected item-total correlations with raters serving as “items” and the full set of raters who rated a given examinee serving as the “scale”. Our intent was to remove as much error variance in the ratings as possible while simultaneously preserving as much of the performance rating data as possible. This interrater reliability/agreement screen resulted in elimination of all rating data for 13 examinees and of six additional rater-examinee records (i.e., without eliminating all rating data for those additional six examinees).
After screening the rating data, the mean number of examinees per rater changed to 2.7 (SD = 1.3) and the mean number of raters per examinee was unchanged at 2.9 (SD = 2.0).
5-17
5-18
Descriptive Statistics and Intercorrelations
The performance rating data were next aggregated to the examinee level, such that the item scores for each examinee represented the mean rating of her/his raters. Means, standard deviations, and intercorrelations between the performance dimensions are shown in Table 5.9. On our 1 to 7 scale, mean dimension ratings ranged from 4.80 to 5.16, and the global Overall Potential rating was 5.23. Intercorrelations (excluding the global Overall Potential rating) exhibited substantial positive manifold, ranging from .41 to .72, with a median of .59.
Reliability of Performance Dimension Ratings
To evaluate the interrater reliability of the performance dimension ratings, we computed ICC (1, k) (Shrout & Fleiss, 1979). ICC (1, k) is the appropriate model because each target was rated by a different set of k raters, randomly selected from a larger population of raters. ICC (1, k) for each dimension is also shown in Table 5.9. Interrater reliabilities for the 10 performance dimensions ranged from .30 to .55, with a median of .47. These are the reliability estimates that we used when correcting criterion-related validities for unreliability in the work performance rating dimensions.
Factor Analysis of Performance Dimension Ratings
To evaluate the dimensionality of the performance dimension ratings, we performed a principal axis factor analysis. This was done using the mean performance dimension ratings across raters within examinees. We conducted a parallel analysis (Hayton, Allen, & Scarpello, 2004; Horn, 1965) to determine an appropriate number of factors to extract. Parallel analysis is based on the notion that factors should be retained if they have eigenvalues larger than parallel factors extracted from a random-data correlation matrix, where the random correlation matrix is computed from data having the same sample size and number of variables. Put another way, factors should be retained if they represent more signal than noise. Parallel analysis methodology has been shown to be a more accurate method of determining the number of factors to extract in a factor analysis than other popular factor retention methods, such as the eigenvalue-greater-than-one criterion and the scree plot inspection method (Hayton et al. 2004).

Table 5-9 NCAPS Performance rating dimensions: means, standard deviations, interrater reliabilities, and
intercorrelations
NCAPS Performance Rating Dimension Mean SD 1 2 3 4 5 6 7 8 9 10 1. Cooperating/Working Well with Others 4.98 1.01 .42 2. Task Proficiency and Productivity 4.96 1.00 .59 .51 3. Adaptability/ Flexibility 4.82 .95 .64 .67 .38 4. Initiative and Self-Development 4.82 1.14 .54 .72 .62 .48 5. Knowledge and Support of Unit/Command
Objectives 4.80 .92 .41 .59 .53 .64 .38
6. Problem Solving and Decision Making 4.86 .94 .53 .69 .60 .71 .53 .45 7. Integrity/Honesty 5.16 1.12 .62 .64 .59 .62 .52 .55 .52 8. Work Ethic 5.07 1.15 .64 .69 .65 .66 .49 .58 .69 .49 9. Communicating Effectively 4.91 .92 .59 .56 .58 .54 .53 .57 .57 .56 .30 10. Overall Potential 5.23 .97 .62 .71 .67 .72 .55 .65 .70 .72 .62 .55 Note. n = 235. The rating scale for the performance ratings ranges from 1 to 7. All correlations are statistically significant at p < .01. Interrater reliabilities [ICC (1,k)] for
each performance rating dimension are on the diagonal of the intercorrelation matrix incorporated into this table.
5-19

The parallel analysis results are shown in Table 5.109. Comparison of the real and random eigenvalues indicates a 1-factor solution. This conclusion is based on: (1) the similarity of the 95th percentile random eigenvalue to the real eigenvalue for the 2nd root, (2) the large ratio of the eigenvalues for the 1st and 2nd roots, (3) the small magnitude of 2nd eigenvalue, and (4) visual inspection of performance dimension intercorrelation matrix. Based on these factor analysis results, we created a unit-weighted performance rating composite, which represented overall work performance.
Table 5-10 Parallel analysis results for principal axis factor analysis
of criterion rating data
Root Random Eigenvalue Real Eigenvalue
1 .26/.32 5.38 2 .19/.24 .26 3 .12/.16 .08 4 .07/.11 .04
Note: n = 235. Numbers to the left of the slashes in the random eigenvalue column are the mean eigenvalues associated with each root and the numbers to the right of the slashes are the 95th percentile eigenvalues associated with each root, based on factoring of 100 sets of random normal data.
Generalizability Study to Determine Reliability of Unit-Weighted Overall Performance Composite
We used generalizability theory to estimate the interrater reliability of the Overall Performance composite10. Generalizability theory is based on analysis of variance and allows researchers to estimate multiple sources of error variance (e.g., items, raters) within a single design called a generalizability study. The generalizability coefficient, or G-coefficient, represents the ratio of true score variance to true score variance plus all sources of error. The difference between a G-coefficient and a typical reliability coefficient is that many sources of error can be estimated at once, as opposed to estimating only once source of error at a time (DeShon, 2002).
In our study, we had two sources of error variance in the Overall Performance composite: (1) variance due to items; and (2) variance due to raters. The generalizability study design that most closely fit our data was (r : p) × i, or raters nested within ratees and crossed with items. This design is appropriate for situations where each ratee is rated by a unique set of raters on the same set of items.
9 There is presently some disagreement in the literature regarding whether to use the 50th percentile eigenvalue or the 95th percentile eigenvalue when conducting a parallel analysis (Hayton, Allen, & Scarpello, 2004). We therefore report results based on both. 10 It was not possible to implement the type of generalizability study we conducted for the Overall Performance composite at the performance dimension level, since each performance dimension consists of only a single rating.
5-20

To compute the G-coefficient, we conducted an analysis of variance to break the variance in the ratings into the following components: (1) variance due to ratees; (2) variance due to items; (3) variance due to the ratee × item interaction; (4) variance due to the combined rater main effect and ratee × rater interaction; and (5) variance due to an undifferentiated rater × item plus ratee × rater × item plus residual effect. We were most interested in the consistency of the relative ranking of examinees across conditions, so we computed a G-coefficient based on a relative definition of error rather than an absolute definition of error (DeShon, 2002). The relative error term is computed using the following formula (Shavelson & Webb, 1991):
ri
epriri
r
prr
i
pilRe nnnn
2,,
2,
22 σσσ
σ ++= , (7)
where is relative error variance, is variance due to the ratee × item interaction, is variance due to the combined rater main effect and ratee × rater interaction,
is variance due to the undifferentiated rater × item plus ratee × rater × item plus residual effect, ni is number of items, and nr is number of raters. Because examinees were rated by different numbers of raters, we used the mean number of raters as the value for nr.
2lReσ 2
piσ2, prrσ
2,, epririσ
The G-coefficient is computed using the following formula (DeShon, 2002):
22
22
lRep
p
σσσ
ρ+
= . (8)
To estimate the variance components necessary to carry out this study, it was necessary to break the data set into approximately equal random halves. This is because SPSS would not run the variance components analysis on the entire NCAPS data set. We therefore split the data set into two halves, computed the relevant generalizability study statistics separately on each half, and took the mean of the two G-coefficients.
Table 5.11 contains G-coefficients and variance components for each sub-sample for the unit-weighted Overall Performance composite. The G-coefficient for sub-sample 1 was .62, and the G-coefficient for sub-sample 2 was .54. The mean of these two G-coefficients is .58. This is the reliability estimate that we used when correcting criterion-related validities for unreliability in the unit-weighted Overall Performance composite.
5-21

5-22
Table 5-11 Variance components and G-Coefficients for unit-weighted
overall performance composite
Component Description of
Component Sub-Sample
1 Sub-Sample
2
σp Variance due to ratees .35 .26 σi Variance due to items
(dimension ratings) .02 .02
σpi Variance due to interaction of ratees and items
.04 .07
σr,pr Variance due to the combined rater main effect and ratee × rater interaction
.53 .52
σri,pri,e Variance due to the undifferentiated rater × item plus ratee × rater × item plus residual effect
.75 .69
# Items 9 9 Mean Number of Raters Per Examinee 2.96 2.82 G-coefficient .62 .54 Note. p = Ratee, i = Item, r = Rater.
Validity Analyses
Uncorrected Zero-Order Correlations Between NCAPS Scales and Peer-Rated Performance Dimensions
Table 5.12 shows uncorrected validity coefficients between Traditional and Adaptive NCAPS scales and the 10 performance rating dimensions. In general, the validity coefficients are quite good. Each Traditional NCAPS scale had an uncorrected validity coefficient of .20 or higher for one or more performance dimension. Five out of ten Adaptive NCAPS scales had validity coefficients of .20 or higher with one or more performance dimension, and eight out of ten Adaptive NCAPS scales had validity coefficients that were statistically significant for one or more performance dimension. Each performance dimension was predicted at both statistically and practically significant levels by one or more NCAPS scales in both the Traditional and Adaptive formats. The most predictable performance dimensions for both Traditional and Adaptive NCAPS were Cooperating/Working Well with Others, Task Proficiency and Productivity, and Communicating Effectively. The global Overall Potential rating was also predicted well by both Traditional and Adaptive NCAPS scales.

Table 5-12 Uncorrected zero-order correlations between Traditional and Adaptive NCAPS scales and peer ratings on
work performance dimensions
Coo
pera
tin
g/
Wor
kin
g W
ell w
ith
O
ther
s
Task
Pro
fici
ency
an
d P
rodu
ctiv
ity
Ada
ptab
ility
/ Fl
exib
ility
Init
iati
ve a
nd
Self
-D
evel
opm
ent
Kn
owle
dge/
Su
ppor
t of
Un
it/
Com
man
d O
bjec
tive
s
Pro
blem
Sol
vin
g an
d D
ecis
ion
M
akin
g
Inte
grit
y/H
ones
ty
Wor
k Et
hic
Com
mu
nic
atin
g Ef
fect
ivel
y
Ove
rall
Pot
enti
al
(Glo
bal R
atin
g)
NCAPS Scale T A T A T A T A T A T A T A T A T A T A Adaptability/Flexibility .15 .12 .19 .12 .15 .12 .13 .09 .11 .08 .11 .07 .13 .09 .06 .00 .20 .16 .16 .11 Attention to Detail .20 .24 .24 .26 .24 .16 .21 .19 .25 .17 .13 .12 .11 .18 .11 .16 .22 .25 .21 .25 Achievement .25 .24 .29 .25 .19 .18 .22 .26 .16 .15 .15 .23 .15 .16 .15 .19 .23 .25 .16 .28 Dependability .30 .25 .34 .19 .27 .14 .27 .17 .22 .10 .18 .08 .21 .16 .19 .14 .28 .24 .22 .17 Dutifulness .19 .15 .29 .19 .18 .04 .18 .13 .11 .04 .12 .08 .15 .14 .11 .13 .18 .13 .13 .12 Social Orientation .22 .09 .16 .12 .23 .14 .14 .10 .17 .15 .10 .08 .16 .15 .10 .02 .21 .21 .16 .11 Self-Reliance .15 .00 .24 .05 .15 -.02 .16 .08 .07 -.04 .20 .12 .16 -.01 .12 .01 .10 .03 .20 .11 Stress Tolerance .27 .27 .21 .20 .23 .20 .20 .15 .18 .08 .18 .14 .21 .16 .12 .09 .25 .21 .20 .17 Vigilance .18 .19 .22 .17 .13 .12 .18 .14 .13 .08 .09 .11 .15 .14 .10 .06 .18 .19 .19 .18 Willingness to Learn .17 .08 .17 .06 .09 .00 .19 .09 .20 .11 .06 .06 .14 .03 .07 -.02 .23 .05 .11 .16Note. n = 190 to 197 for Traditional NCAPS and n = 195 for Adaptive NCAPS. Correlations > .14 are statistically significant at p < .05. T refers to validity coefficients for Traditional
NCAPS and A refers to validity coefficients for Adaptive NCAPS.
5-23

For some NCAPS scales, there were clear differences in validity coefficients favoring Traditional over Adaptive NCAPS, whereas for other NCAPS scales differences were relatively minimal. In still other cases, Adaptive NCAPS out-predicted Traditional NCAPS for certain performance dimensions. Traditional NCAPS out-predicted Adaptive NCAPS most clearly in the case of Self-Reliance and Willingness to Learn. On the other hand, Adaptive NCAPS out-predicted Traditional NCAPS in the case of Attention to Detail and Achievement. Most dramatically, the Adaptive NCAPS Achievement scale correlated .28 (p < .01) with the Overall Potential rating, whereas Traditional NCAPS correlated only .16 (p < .05) with Overall Potential. For some constructs, there were large differences between Adaptive and Traditional NCAPS validities for some criteria but not for others. For example, the Traditional NCAPS Social Orientation scale correlated .22 (p < .01) with Cooperating/Working Well with Others, whereas the Adaptive NCAPS Social Orientation scale correlated only .09 (ns) with that dimension.
It is noteworthy that the two highest correlations with the global Overall Potential rating involved Adaptive rather than Traditional NCAPS scales: Attention to Detail (r = .25, p < .01) and Achievement (r = .28, p < .01). It is also noteworthy that the Traditional NCAPS Achievement and Dependability scales correlated .29 and .34, respectively (both p < .01), with Task Proficiency and Productivity and that four Adaptive NCAPS scales correlated .25 (p < .01) or higher with one or more individual performance rating dimensions. These results are very good for uncorrected validity coefficients against peer-rated performance data.
Table 5.13 compares the validities of the Traditional and Adaptive NCAPS scales against the unit-weighted Overall Performance composite and the global Overall Potential rating. In general, Traditional NCAPS out-predicted Adaptive NCAPS against the unit-weighted Overall Performance composite. Again, the largest differences involved the Self-Reliance, Willingness to Learn, and Dependability scales. On the other hand, there was no difference in the correlations between the Attention to Detail scales and the unit-weighted Overall Performance composite for Adaptive versus Traditional NCAPS. As in the case of the Overall Potential rating, the Adaptive NCAPS Achievement scale out-predicted the Traditional NCAPS Achievement scale against the Overall Performance composite, albeit to a lesser extent.
5-24

Table 5-13 Uncorrected zero-order correlations between Traditional
and Adaptive NCAPS scales and peer ratings of overall performance and potential
Unit-Weighted Overall Performance
Composite Global Overall
Potential Rating NCAPS Scale Traditional Adaptive Traditional Adaptive Adaptability/Flexibility .17 .12 .16 .11 Attention to Detail .24 .24 .21 .25 Achievement .25 .27 .16 .28 Dependability .31 .20 .22 .17 Dutifulness .21 .14 .13 .12 Social Orientation .21 .14 .16 .11 Self-Reliance .19 .03 .20 .11 Stress Tolerance .26 .21 .20 .17 Vigilance .19 .17 .19 .18 Willingness to Learn .18 .07 .16 .05 Note. n = 195 for Adaptive NCAPS correlations; n = 190-197 for Traditional NCAPS correlations.
Correlations > .14 are statistically significant at p < .05.
Facet-Level Validities
Table 5.14 shows validities between Traditional NCAPS facets and performance rating dimensions. The data in this table, however, need to be interpreted with some caution. Some validities are low because certain facets are measured with a smaller number of items than other facets, which limits their reliability and, therefore, their validity. We report these data because they reveal certain information that scale-level correlations mask. For example, we regarded it as a bit strange that the Adaptability/Flexibility scale did not correlate very highly with Adaptability/Flexibility performance ratings. The facet-level data show that two of the four Adaptability/Flexibility NCAPS facets do in fact correlate quite well with the Adaptability/Flexibility performance ratings. On the other hand, the Work with Different People facet of NCAPS Adaptability/Flexibility is uncorrelated with Adaptability/ Flexibility performance ratings, which accounts for the unexpectedly low scale-level correlation. Another striking finding was that the Composure facet of Stress Tolerance scale correlates much more highly across all performance rating dimensions than the other two facets of Stress Tolerance. While the lower correlations of the Accepts Criticism facet can be accounted for by its smaller number of items (and associated lower alpha coefficient), the same cannot be said of the Puts Aside Worries/Guilt facet. Indeed, Composure shows remarkably high uncorrected validities across all criterion rating dimensions: 5 out of 10 uncorrected validity coefficients were over .30!
5-25

Table 5.16 compares the corrected validities of the Traditional and Adaptive NCAPS scales against the unit-weighted Overall Performance composite and the global Overall Potential rating. The estimate of criterion reliability used to correct the validity coefficients was the ICC (1, k) interrater reliability estimate of .55 for the global Overall Potential rating. The estimate of criterion reliability used to correct the unit-weighted Overall Performance composite was the G-coefficient of .58 from our generalizability study.
The estimates of criterion reliability used to correct the validity coefficients were the ICC (1, k) interrater reliability estimates. While the comparison of validities between Adaptive and Traditional NCAPS are basically unaffected by these corrections (since the same reliability estimates are applied to both Traditional and Adaptive NCAPS validity coefficients), it is useful to inspect the magnitude of the Adaptive NCAPS validities to get a better sense of the effectiveness of this method of measuring personality traits. Seventeen Adaptive NCAPS corrected validity coefficients exceed .30. Forty-nine corrected Adaptive NCAPS validity coefficients equal or exceed .20. Thus 49 out of 100 total validity coefficients for Adaptive NCAPS—almost exactly half—reach a validity level indicative of practical significance. While Adaptive NCAPS validities tend not to be as high as Traditional NCAPS validities, these data provide strong support for the Adaptive NCAPS approach to personality assessment. Corrected facet-level validities are shown in Appendix N.
Table 5.15 shows validity coefficients between Traditional and Adaptive NCAPS scales and peer ratings of work performance, corrected for criterion unreliability. These validity coefficients provide a better estimate of the true operational validity of Traditional and Adaptive NCAPS scales against performance criteria. Validity corrections were made using the following formula (Ghiselli, Campbell, & Zedeck, 1981, p. 290):
Corrected Zero-Order Correlations Between NCAPS Scales/Facets and Peer-Rated Work Performance
5-26
yy
xyxyc r
rr =
xycr
xyr
yyr = reliability of criterion measure
= observed validity coefficient
where = corrected validity coefficient
, (9)

Table 5-14 Uncorrected zero-order correlations between Traditional NCAPS facets and peer ratings of work
performance
NCAPS Facet Coo
pera
tin
g/
Wor
kin
g W
ell w
ith
O
ther
s
Task
Pro
fici
ency
an
d P
rodu
ctiv
ity
Ada
ptab
ility
/ Fl
exib
ility
Init
iati
ve a
nd
Self
-D
evel
opm
ent
Kn
owle
dge/
Supp
ort
of U
nit
/Com
man
d O
bjec
tive
s
Pro
blem
Sol
vin
g an
d D
ecis
ion
Mak
ing
Inte
grit
y/H
ones
ty
Wor
k Et
hic
Com
mu
nic
atin
g Ef
fect
ivel
y
Ove
rall
Pot
enti
al
(Glo
bal R
atin
g)
Cri
teri
on C
ompo
site
(U
nit
-Wei
ghte
d C
ompo
site
)
Adaptability/Flexibility Willing to Change Task/ Project Approach .16 .11 .17 .15 .10 .06 .10 .07 .15 .14 .15 Likes Variety .16 .15 .12 .13 .11 .09 .11 .06 .17 .11 .15 Work with Different People -.02 .03 -.07 -.09 -.05 -.06 -.01 -.08 .08 -.01 -.04 Adapt to New Situations .15 .25 .21 .17 .15 .18 .19 .09 .22 .21 .22
Attention to Detail
5-27 Exacting/Precise .16 .21 .19 .19 .21 .12 .12 .10 .22 .15 .21 Spot Imperfections/Errors .18 .24 .24 .19 .23 .16 .12 .11 .21 .25 .23 Neat/Organized .18 .18 .19 .14 .20 .06 .07 .07 .16 .13 .17
Achievement Ambitious .22 .26 .14 .20 .18 .18 .14 .12 .27 .20 .24 Challenging Goals .11 .11 .01 .02 .01 .02 -.01 -.01 .09 .02 .05 Confident in Abilities .22 .25 .15 .18 .07 .20 .16 .10 .18 .17 .21 Persists Despite Obstacles .11 .17 .07 .08 .04 .03 .09 .02 .08 .02 .10 Strives for Excellence .24 .24 .20 .23 .22 .10 .17 .21 .18 .11 .25 Works Hard/Long Time .14 .23 .18 .20 .09 .13 .10 .12 .21 .16 .20

Table 5-14 Uncorrected zero-order correlations between Traditional NCAPS facets and peer ratings of work
performance
NCAPS Facet Coo
pera
tin
g/
Wor
kin
g W
ell w
ith
O
ther
s
Task
Pro
fici
ency
an
d P
rodu
ctiv
ity
Ada
ptab
ility
/ Fl
exib
ility
Init
iati
ve a
nd
Self
-D
evel
opm
ent
Kn
owle
dge/
Supp
ort
of U
nit
/Com
man
d O
bjec
tive
s
Pro
blem
Sol
vin
g an
d D
ecis
ion
Mak
ing
Inte
grit
y/H
ones
ty
Wor
k Et
hic
Com
mu
nic
atin
g Ef
fect
ivel
y
Ove
rall
Pot
enti
al
(Glo
bal R
atin
g)
Cri
teri
on C
ompo
site
(U
nit
-Wei
ghte
d C
ompo
site
)
Dependability Orderly/Planful/Prioritizes .26 .26 .23 .24 .20 .16 .13 .16 .22 .21 .26 Reliable/Efficient with Time .27 .27 .23 .25 .22 .15 .21 .16 .26 .17 .28 Not Easily Distracted/Bored .28 .35 .26 .23 .18 .18 .23 .19 .27 .21 .30 Doesn’t Procrastinate .14 .17 .12 .15 .14 .09 .12 .10 .15 .11 .16
Dutifulness Sense of Duty/Moral Obligation .09 .15 .07 .04 .02 -.01 .03 .03 .06 .09 .07 Accepts Authority/Follows Rules .12 .21 .15 .10 .08 .08 .09 .07 .20 .04 .15 Honest/Trustworthy/ Fulfills Obligations
.20 .28 .21 .21 .12 .20 .19 .15 .14 .20 .24
Accepts Responsibility tion
.17 .22 .08 .19 .09 .10 .15
5-28
.10 .15 .09 .18 Social Orienta Affiliation .18 .09 .18 .11 .15 .07 .13 .08 .14 .14 .16 Agreeable .13 .07 .06 .03 .11 .03 .11 .07 .13 .02 .10 Likes Teamwork .12 .08 .15 .07 .10 .00 .07 .07 .17 .03 .11 Team Player .17 .17 .21 .09 .10 .10 .13 .05 .18 .16 .16
Self-Reliance Not Dependent .10 .14 .12 .10 .02 .17 .15 .14 .05 .20 .14 Self-Sufficient/ Resourceful .15 .24 .14 .16 .08 .17 .13 .08 .10 .16 .17
Stress Toleran ce

Table 5-14 Uncorrected zero-order correlations between Traditional NCAPS facets and peer ratings of work
performance
NCAPS Facet Coo
pera
tin
g/
Wor
kin
g W
ell w
ith
O
ther
s
Task
Pro
fici
ency
an
d P
rodu
ctiv
ity
Ada
ptab
ility
/ Fl
exib
ility
Init
iati
ve a
nd
Self
-D
evel
opm
ent
Kn
owle
dge/
Supp
ort
of U
nit
/Com
man
d O
bjec
tive
s
Pro
blem
Sol
vin
g an
d D
ecis
ion
Mak
ing
Inte
grit
y/H
ones
ty
Wor
k Et
hic
Com
mu
nic
atin
g Ef
fect
ivel
y
Ove
rall
Pot
enti
al
(Glo
bal R
atin
g)
Cri
teri
on C
ompo
site
(U
nit
-Wei
ghte
d C
ompo
site
)
Composure .33 .30 .32 .27 .22 .27 .27 .19 .30 .28 .34 Accepts Criticism .05 .01 .01 .01 .01 -.03 -.02 -.07 .12 -.02 .01 Puts Aside Worries/Guilt .12 .07 .06 .06 .08 .02 .09 .02 .08 .06 .08
Willingness to Learn Willing to Learn/Actively Seeks Learning Opportunities
.25 .17 .13 .20 .18 .06 .18 .14 .26 .16 .22
Learns from Mistakes .10 .16 .11 .15 .28 -.03 .11 .06 .16 .11 .15 Takes Good Advice .16 .13 .06 .11 .14 .03 .08 .02 .15 .08 .12 Asks Clarifying Questions .07 .11 .05 .15 .12 .15 .12 .06 .17 .16 .14 5-29
Note. n = 187-198. Correlations > .14 are statistically significant at p < .05.

Table 5-15 Corrected zero-order correlations between Traditional and Adaptive NCAPS scales and peer ratings on
work performance dimensions
Coo
pera
tin
g/
Wor
kin
g W
ell w
ith
O
ther
s
Task
Pro
fici
ency
an
d P
rodu
ctiv
ity
Ada
ptab
ility
/ Fl
exib
ility
Init
iati
ve a
nd
Self
-D
evel
opm
ent
Kn
owle
dge/
Su
ppor
t of
Un
it/
Com
man
d O
bjec
tive
s
Pro
blem
Sol
vin
g an
d D
ecis
ion
M
akin
g
Inte
grit
y/H
ones
ty
Wor
k Et
hic
Com
mu
nic
atin
g Ef
fect
ivel
y
Ove
rall
Pot
enti
al
(Glo
bal R
atin
g)
NCAPS Scale T A T A T A T A T A T A T A T A T A T A
Adaptability/Flexibility .23 .19 .27 .17 .24 .19 .19 .13 .18 .13 .16 .10 .18 .12 .09 .00 .37 .29 .22 .15 Attention to Detail .31 .37 .34 .36 .39 .26 .30 .27 .41 .28 .19 .18 .15 .25 .16 .23 .40 .46 .28 .34 Achievement .39 .37 .41 .35 .31 .29 .32 .38 .26 .24 .22 .34 .21 .22 .21 .27 .42 .46 .22 .38 Dependability .46 .39 .48 .27 .44 .23 .39 .25 .36 .16 .27 .12 .29 .22 .27 .20 .51 .44 .30 .23 Dutifulness .29 .23 .41 .27 .29 .06 .26 .19 .18 .06 .18 .12 .21 .19 .16 .19 .33 .24 .18 .16 Social Orientation .34 .14 .22 .17 .37 .23 .20 .14 .28 .24 .15 .12 .22 .21 .14 .03 .38 .38 .22 .15 Self-Reliance .23 .00 .34 .07 .24 -.03 .23 .12 .11 -.06 .30 .18 .22 -.01 .17 .01 .18 .05 .27 .15 Stress Tolerance .42 .42 .29 .28 .37 .32 .29 .22 .29 .13 .27 .21 .29 .22 .17 .13 .46 .38 .27 .23 Vigilance .28 .29 .31 .24 .21 .19 .26 .20 .21 .13 .13 .16 .21 .19 .14 .09 .33 .35 .26 .24 Willingness to Learn .26 .12 .24 .08 .15 .00 .27 .13 .32 .18 .09 .09 .19 .04 .10 -.03 .42 .20 .22 .07 Note. n = 190 to 197 for Traditional NCAPS and n = 195 for Adaptive NCAPS. Correlations > .14 are statistically significant at p < .05. T refers to validity coefficients for Traditional
NCAPS and A refers to validity coefficients for Adaptive NCAPS.
5-30

Table 5-16 Corrected zero-order correlations between Traditional and Adaptive NCAPS scales and measures of peer-rated unit-
weighted overall performance composite and global overall potential rating
NCAPS Scale
Unit-Weighted Overall Performance
Composite Global Overall Potential
Rating
Traditional Adaptive Traditional Adaptive
Adaptability/Flexibility .22 .16 .22 .15 Attention to Detail .32 .32 .28 .34 Achievement .33 .35 .22 .38 Dependability .41 .26 .30 .23 Dutifulness .28 .18 .18 .16 Social Orientation .28 .18 .22 .15 Self-Reliance .25 .04 .27 .15 Stress Tolerance .34 .28 .27 .23 Vigilance .25 .22 .26 .24 Willingness to Learn .24 .09 .22 .07 Note. n = 195 for Adaptive NCAPS correlations; n = 190-197 for Traditional NCAPS correlations.
The unit-weighted Overall Performance composite was more predictable than the global Overall Potential rating by Traditional NCAPS scales, and the two criteria were predicted about equally by Adaptive NCAPS. The median corrected correlation between Traditional NCAPS scales and the unit-weighted Overall Performance composite is .28 (range: = .22 to .41); the median correlation between Adaptive NCAPS scales and the unit-weighted Overall Performance composite is .20 (range: .04 to .35); the median corrected correlation between Traditional NCAPS scales and the global Overall Potential rating is .24 (range: .18 to .30); and the median corrected correlation between Adaptive NCAPS scales and the global Overall Potential rating is .20 (range: .07 to .38). Two of the Adaptive NCAPS corrected correlations with the unit-weighted Overall Performance composite exceeded .30, and four of the Adaptive NCAPS corrected correlations with the unit-weighted Overall Performance composite exceeded .25. Two of the Adaptive NCAPS corrected correlations with the Overall Potential rating exceeded .30 and five of the Adaptive NCAPS corrected correlations with the Overall Potential rating equaled or exceeded .23.
5-31

Overlap Between Predictor Space and Criterion Space
In order to determine the degree of overlap between the personality scales measured by NCAPS and overall performance, we computed a unit-weighted composite of the 10 NCAPS scales for both the Traditional and Adaptive formats. The Traditional and Adaptive NCAPS composites had uncorrected correlations with the unit-weighted Overall Performance composite of .30 and .24, respectively (both p < .05). When corrected for criterion unreliability, those validities rise to .39 and .32, respectively.
To complement the analysis based on a unit-weighted NCAPS composite, we also applied a regression-weighting algorithm whereby we regressed the unit-weighted Overall Performance composite on the 10 NCAPS scales. Two regressions were executed, one for the set of 10 Traditional NCAPS scales and the other for the set of 10 Adaptive NCAPS scales. When computing regression coefficients in a sample, the multiple R obtained is an overestimate of the true relationship between the set of predictors and the criterion in the population. This is because the regression weights are optimal for the sample in which they were derived, and capitalize on idiosyncrasies in the sample that favor a high R. This phenomenon is referred to as shrinkage. Cattin (1980a, b) showed that the following formula produces the least biased estimate of the shrunken multiple correlation:
kkNkN
c+ρ−−
ρ+ρ−−=ρ 2
24
)22()3(ˆ (10)
where:
cρ̂ = estimated population cross-validated multiple correlation,
N = number of people in the sample,
k = number of predictors in the regression equation, and
ρ2 = population squared multiple correlation.
ρ must be estimated using the following formula from Wherry (1931):
)1(1
11ˆ 22 RkN
N−
−−−
−=ρ , (11)
where R2 is the squared multiple correlation in the sample and N and k are as defined above. This is the value that is printed by SPSS in its regression output and labeled “Adjusted R2,” but the statistic of interest when estimating a shrunken multiple correlation is the value computed by equation 10, the estimated population cross-validated multiple correlation.
The shrunken multiple correlations (i.e., the estimated population cross-validated multiple correlations) are .20 for Traditional NCAPS and .23 for Adaptive NCAPS. After correcting for criterion unreliability, these values rise to .26 for Traditional NCAPS and .30 for Adaptive NCAPS. Higher regression coefficients for the Adaptive version
5-32

compared to Traditional NCAPS are likely due to the lower scale correlations for Adaptive NCAPS. The degree of predictor and criterion space overlap thus remains fairly similar to that found for the unit-weighted composite of Adaptive NCAPS scales, but is considerably lower in the case of Traditional NCAPS.
Comparative Validity Analysis of Adaptive and Traditional NCAPS for Differing Numbers of Items/Item-Pairs
Having evaluated the validities of Traditional and Adaptive NCAPS scales against work performance criteria, we next compared the validities of Adaptive and Traditional NCAPS for different numbers of items (in the case of Traditional NCAPS) and item-pairs (in the case of Adaptive NCAPS). We hypothesized that Adaptive NCAPS’ greater measurement precision would yield asymptotic reliability and validity levels for NCAPS scales more quickly than Traditional NCAPS.
To evaluate this hypothesis, we computed criterion-related validities, using the unit-weighted Overall Performance composite as our criterion, for NCAPS subscales ranging from 1 to 15 items/item-pairs for each Adaptive and Traditional NCAPS scale. For Adaptive NCAPS, this was a relatively straightforward process, since EAP (trait level) is recomputed after each item-pair is presented for each examinee. For Traditional NCAPS, we computed subscales as follows:
1. For each Traditional NCAPS scale, we selected 10 random subsets of items for each subscale. This process was repeated for subscales ranging from 1 to 15 items11.
2. For each examinee, we computed the mean for each random subset of items for each subscale. These mean-scores were computed only if there was non-missing data for all items in a given random item subset.
3. We computed criterion-related validities for each random subset of subscale items.
4. We computed the mean of these criterion-related validities across the 10 random subsets of subscale items to arrive at a validity estimate for each subscale for each examinee. Thus, for each Traditional NCAPS scale, we computed the mean criterion-related validity across the 10 random 1-item subscales, the 10 random 2-item subscales, the 10 random 3-item subscales, …, the 10 random 15-item subscales (with the exception of Vigilance, for which the maximum subscale contained 13 items).
These mean Traditional NCAPS criterion-related validities were then graphed for each number of subscale items for each NCAPS scale. Superimposed on these graphs were the corresponding Adaptive NCAPS criterion-related validities associated with EAP estimates based on each possible number of item-pairs (ranging from 1 to 15), for each NCAPS scale. These graphs are shown in Figures 1 through 10. There are several important points to be made about these figures:
11 For the Vigilance scale, the highest number of items in a subscale is 13, since the Traditional NCAPS Vigilance scale contains only the 13 items.
5-33

5-34
1. Contrary to our hypothesis, Traditional NCAPS tends to out-predict Adaptive NCAPS across subscales of most lengths, particularly once asymptotic validity levels have been reached.
2. An exception to this is the Attention to Detail scale, where Adaptive NCAPS out-predicted Traditional NCAPS across subscales ranging from 1 to 15 items/item-pairs.
3. Relatively stable, near-maximum validity levels tend to be reached fairly quickly for both Traditional and Adaptive NCAPS for most scales. It appears that six or seven items result in near-maximum validity levels for most Traditional NCAPS scales, and that eight or nine item-pairs are necessary to achieve near-maximum validity levels for most Adaptive NCAPS, though there are exceptions to this for certain scales.
4. Whereas Traditional NCAPS always seems to trend toward higher criterion-related validities, Adaptive NCAPS trends downward, or first upward and then downward, for several NCAPS scales; specifically, Social Orientation, Self-Reliance, Stress Tolerance, and Vigilance.
Note that the validities based on the terminal number of items/item-pairs (i.e., 15) for Adaptive and Traditional NCAPS are not identical to the criterion-related validities between NCAPS scales and the unit-weighted Overall Performance composite reported in Table 5.13. For Traditional NCAPS, this is probably occurring because most Traditional NCAPS scales have more than 15 items. It could also be an artifact of the methodology used to generate the mean validity coefficients for Figures 1 through 10.
There are at least two possible reasons for the discrepancy between Table 5.13 and Figures 1 through 10 for Adaptive NCAPS validities. First, the validity coefficients reported in Table 5.13 are based on the number of item-pairs necessary to trigger the Adaptive NCAPS stopping criterion (i.e., to meet the accuracy requirements incorporated into the Adaptive NCAPS algorithm). However, in Figures 1 through 10, the validity coefficients associated with, say, seven item-pairs pools data from examinees for whom seven item-pairs was sufficient to provide an accurate trait level estimate with data from examinees for whom more than seven item-pairs were required to obtain accurate trait level estimates.

0.00
0.02
0.04
0.06
0.08
0.10
0.12
0.14
0.16
0.18
0.20
1 2 3 4 5 6 7 8 9 10 11 12 13 14 15Number of Items/Item-Pairs
valid
ity
coef
fici
ent
Adaptive
Traditional
5-35
Figure 5-1. Validities associated with different numbers of items/item-pairs (adaptability/flexibility).

0.00
0.05
0.10
0.15
0.20
0.25
0.30
0.35
1 2 3 4 5 6 7 8 9 10 11 12 13 14 15
Number of Items/Item-Pairs
valid
ity
coef
fici
ent
Adaptive
Traditional
5-36
Figure 5-2. Validities associated with different numbers of items/item-pairs (attention to detail).

0.00
0.05
0.10
0.15
0.20
0.25
0.30
1 2 3 4 5 6 7 8 9 10 11 12 13 14 15
Number of Items/Item-Pairs
valid
ity
coef
fici
ent
Adaptive
Traditional
5-37
Figure 5-3. Validities associated with different numbers of items/item-pairs (achievement).

0.00
0.05
0.10
0.15
0.20
0.25
0.30
0.35
1 2 3 4 5 6 7 8 9 10 11 12 13 14 15
Number of Items/Item-Pairs
valid
ity
coef
fici
ent
Adaptive
Traditional
5-38
Figure 5-4. Validities associated with different numbers of items/item-pairs (dependability).

0.00
0.05
0.10
0.15
0.20
0.25
0.30
1 2 3 4 5 6 7 8 9 10 11 12 13 14 15
Number of Items/Item-Pairs
valid
ity
coef
fici
ent
Adaptive
Traditional
5-39
Figure 5-5. Validities associated with different numbers of items/item-pairs (dutifulness).

0.00
0.05
0.10
0.15
0.20
0.25
1 2 3 4 5 6 7 8 9 10 11 12 13 14 15
Number of Items/Item-Pairs
valid
ity
coef
fici
ent
Adaptive
Traditional
5-40
Figure 5-6. Validities associated with different numbers of items/item-pairs (social orientation).

-0.05
0.00
0.05
0.10
0.15
0.20
0.25
1 2 3 4 5 6 7 8 9 10 11 12 13 14 15
Number of Items/Item-Pairs
valid
ity
coef
fici
ent
Adaptive
Traditional
5-41
Figure 5-7. Validities associated with different numbers of items/item-pairs (self-reliance).

0.00
0.05
0.10
0.15
0.20
0.25
0.30
1 2 3 4 5 6 7 8 9 10 11 12 13 14 15
Number of Items/Item-Pairs
valid
ity
coef
fici
ent
Adaptive
Traditional
5-42
Figure 5-8. Validities associated with different numbers of items/item-pairs (vigilance).

0.00
0.05
0.10
0.15
0.20
0.25
1 2 3 4 5 6 7 8 9 10 11 12 13 14 15Number of Items/Item-Pairs
valid
ity
coef
fici
ent
Adaptive
Traditional
Figure 5-9. Validities associated with different numbers of items/item-pairs (willingness to learn).
5-43

5-44
Another potential cause of discrepancies between Adaptive NCAPS validities shown in Table 5.13 and in Figures 1 through 10 relates to scales where Adaptive NCAPS validities fall off as the number of item-pairs increases. This may indicate that examinees requiring a larger number of item-pairs to trigger the NCAPS stopping criterion constituted a different subgroup from examinees requiring fewer numbers of item-pairs to trigger the NCAPS stopping criterion. For example, perhaps examinees requiring a larger number of item-pairs are less certain of their trait level (i.e., are less “traited;” cf. Britt, 1993; Tellegen, 1988). Another possibility is that individuals requiring a larger number of item-pairs are engaging in some type of socially desirable responding, whether due to impression management or self-deception (e.g., Paulhus, 2002). Both lack of traitedness and socially desirable responding could attenuate the Adaptive NCAPS validity coefficients, and explain the curvilinearity we sometimes found.
While these reasons help explain discrepancies between Table 5.13 and Figures 5.1 through 10, they do not directly address why Traditional NCAPS often out-predicted Adaptive NCAPS. We explore the latter question in more detail in the following section.
Investigation of Possible Reasons for Higher Validities of Traditional NCAPS
The higher validities of Traditional NCAPS relative to Adaptive NCAPS, while not ubiquitous, were frequently enough observed to merit further investigation. We had hypothesized that Adaptive NCAPS would equal or exceed Traditional NCAPS, and with fewer items, due to the superior reliability of Adaptive NCAPS, a finding consistent with previous results obtained using the computerized adaptive job performance rating scales that formed the basis for the Adaptive NCAPS algorithm (Borman, Buck, Hanson, Motowidlo, Stark, & Drasgow, 2001). In the following sections, we explore two possible reasons why Traditional NCAPS outperformed Adaptive NCAPS in many cases, and why the results differed across scales.
Relationship Between Item Validities and Frequency of Presentation
One possible explanation was that the item statements with higher criterion-related validities against the Overall Performance composite are disproportionately represented among those that were presented most frequently. The item-level validities vary enough that this was a legitimate possibility, and there was in fact a modest negative correlation between the item validities and the frequency with which they were presented to examinees (r = -.19, p < .01, n = 195). Table 5.17 sheds additional light on this negative correlation by looking at various item validity statistics associated with deciles of the frequency distribution for number of times Adaptive NCAPS statements were presented to examinees.

Table 5-17 Criterion-related validity statistics associated with Adaptive NCAPS statements differing in frequency of
presentation to examinees
Number of Times Adaptive NCAPS Statement Presented to Examinees
Statistic x < 1 2 < x <
4 5 < x <
9 10 < x <
18 19 < x <
30 31 < x <
52 53 < x <
77 78 < x <
108 108 < x <
152 x > 152
n 17 18 9 20 14 20 26 28 18 25
Mean r .09 .09 .07 .16 .09 .12 .11 .11 .10 .03
SD r .07 .09 .05 .08 .08 .08 .09 .10 .08 .09
Minimum r -.08 -.08 -.02 .04 -.06 .01 -.09 -.12 -.03 -.15
25th Percentile r .05 .00 .03 .08 .04 .06 .06 .02 .05 -.05
50th Percentile r .08 .12 .08 .17 .10 .13 .10 .13 .09 .04
75th Percentile r .13 .18 .11 .23 .16 .19 .17 .19 .16 .11
Maximum r .21 .20 .14 .32 .20 .27 .31 .29 .23 .18 Note. “x” is number of times Adaptive NCAPS statement was presented to examinees. Each range corresponds to a decile in the frequency distribution (i.e., the number on the right
corresponds to the 10th, 20th, 30th,…,100th percentiles.
5-45

The mean item-level validity is highest among those item statements presented between 10 and 18 times across examinees, and is lowest among those items presented more than 152 times across examinees. The same result occurs with the minimum item-level validity, the 25th percentile item-level validity, and the 75th percentile item-level validity.
Departure from Unidimensionality
The modest negative relationship between item-level criterion-related validities and frequency of item-pair presentation, though interesting, does not really provide an explanation for why Traditional NCAPS should out-predict Adaptive NCAPS. Moreover, it does not speak to why Adaptive NCAPS out-predicts Traditional NCAPS for certain scales and Traditional NCAPS out-predicts Adaptive NCAPS for other scales. One hypothesis that seemed worthy of exploration was that, the more the items in the item pool for a given scale depart from unidimensionality, the more Traditional NCAPS would out-predict Adaptive NCAPS. The rationale for this hypothesis is that: (1) Adaptive NCAPS is based on an IRT model that assumes unidimensionality; (2) the Adaptive NCAPS algorithm does not provide a mechanism for ensuring proportional representation of items statements representing all facets within a given scale, whereas Traditional NCAPS was specifically developed to ensure adequate representation of all facets; and (3) the more multidimensionality that is present in a given scale, the greater the advantage that will be conferred on Traditional NCAPS due to its more complete representation of facets within a given scale.
We conducted the following analyses to evaluate the degree of multidimensionality present in each NCAPS scale, and to determine if that multidimensionality is associated with the degree to which Traditional NCAPS out-predicts Adaptive NCAPS:
1. We computed the eigenvalues for the first and second roots of a principal axis factor analysis of the items making up each Traditional NCAPS scale.
2. We computed the mean and 95th percentile eigenvalues for the first and second roots of principal axis factor analyses of random-data intercorrelation matrices with the same sample size and number of variables as the intercorrelation matrices associated with each Traditional NCAPS scale.
3. We computed the ratio of real to random eigenvalues associated with the first root.
4. We computed the ratio of real to random eigenvalues associated with the second root.
5. We computed the difference between the ratios described in Steps 3 and 4. The smaller the difference, the more multidimensional the scale. This is because small differences will be caused by larger ratios of real-to-random eigenvalues associated with the first root and smaller ratios of real-to-random eigenvalues associated with the second root. If the ratio of real-to-random eigenvalues associated with the second root is larger, this will reflect a stronger second factor, and therefore a greater degree of multidimensionality in the scale.
5-46

5-47
6. We computed the differences between each Traditional and Adaptive NCAPS scale’s criterion-related validities against the unit-weighted Overall Performance composite.
7. We correlated the difference computed in Step 6 with the difference computed in Step 5.
The results of these analyses are shown in Table 5.18. Using the mean random eigenvalue, the correlation described in Step 7 is r = -.50 (p = .14, n = 10); using the 95th percentile random eigenvalue, the correlation described in Step 7 is r = -.46 (p = .18, n = 10). These correlation coefficients do not reach statistical significance due to the limited power resulting from the small number of data points across which the correlations were computed. They are, however, strongly suggestive of the hypothesized effect; namely, that scales with greater departures from unidimensionality are associated with larger differences in criterion-related validities favoring Traditional NCAPS over Adaptive NCAPS.
Possible Ways to More Fully Realize the Potential Advantages of Adaptive NCAPS Based on this Discussion
It appears, then, that the potential advantages of Adaptive NCAPS can be more fully realized in several different ways. For example, it would be helpful to modify the Adaptive NCAPS algorithm to ensure (1) that more valid items are more frequently administered, and (2) the facets within each scale are more proportionally represented within Adaptive NCAPS than is presently the case. Another possibility would be to strive to create scales with greater unidimensionality. However, this would result in failure to measure constructs and/or facets of significant importance to the Navy, and would therefore seem undesirable. Finally, it may make sense to incorporate different stopping rules based on the point where maximum validity is reached (with a minimum item-pair requirement to eliminate spikes associated with extremely small numbers of item-pairs). Such revised stopping rules would, however, require cross-validation.

Table 5-18 Evaluation of hypothesis that greater scale multidimensionality is associated with greater differences
between Traditional and Adaptive NCAPS validities
Ratio of Real to Random Eigenvalues for First Root
Ratio of Real to Random Eigenvalues for Second
Root
Differences Between Ratios of Real to Random Eigenvalues for First and
Second Roots
NCAPS Scale
Mean Random
Eigenvalue
95th Percentile Random
Eigenvalue
Mean Random
Eigenvalue
95th Percentile Random
Eigenvalue
Mean Random
Eigenvalue
95th Percentile Random
Eigenvalue
Difference Between
Traditional and
Adaptive NCAPS
Validities
Adaptability/Flexibility 8.12 7.26 3.27 2.86 4.85 4.39 .05
Attention to Detail 8.70 7.65 2.17 1.92 6.53 5.73 .00
Achievement 8.00 6.95 1.54 1.26 6.45 5.69 -.02
Dependability 8.39 7.20 2.54 2.05 5.85 5.15 .11
Dutifulness 5.96 5.41 2.93 2.58 3.03 2.83 .07
Social Orientation 7.76 7.28 2.13 1.95 5.63 5.34 .07
Self-Reliance 6.34 5.53 4.54 4.03 1.81 1.50 .16
Stress Tolerance 8.40 7.52 2.80 2.56 5.60 4.96 .05
Vigilance 3.69 2.61 1.20 .88 2.48 1.73 .02
Willingness to Learn .11 7.43 6.39 2.90 2.58 4.53 3.82
5-48

Follow-on Research Directed Toward Fuller Realization of Adaptive NCAPS’ Potential
In addition to the relatively obvious suggestion regarding cross-validation of the maximum-validity stopping rule, the foregoing discussion suggests several potential avenues for useful follow-on research. It would be interesting, for example, to investigate the relationship between socially desirable responding and number of item-pairs required to trigger the Adaptive ENAPS stopping rule. It would also be interesting to compute examinees’ traitedness on NCAPS scales (e.g., standard deviations within examinee of standardized item responses across items measuring Traditional NCAPS scales; Tellegen, 1988) or response latency-based measures of trait schematicity (e.g., Siem, 1998) and relate them to number of item-pairs required to trigger the Adaptive NCAPS stopping rule.
Gender and Race/Ethnicity Subgroup Difference Comparisons
We investigated gender and race/ethnicity differences on NCAPS scale scores to determine whether Traditional and Adaptive NCAPS would show different effect sizes. Due to sample size limitations, our investigation of race/ethnicity effects was limited to comparisons of whites and blacks. Results of this analysis are shown in Table 5.19 and Appendix O. Table 5.19 shows effect size comparisons involving gender and race and Appendix O shows means, standard deviations, and sample sizes by scale for both gender and race/ethnicity subgroups. In general, differences in effect sizes between Traditional and Adaptive NCAPS were not large. The largest gender-related difference was d = .25 (Social Orientation) and the largest race/ethnicity-related difference was d = .34 (Vigilance). While the magnitude of the effect size differences was similar for Traditional and Adaptive NCAPS across gender and race/ethnicity for some NCAPS scales, it was quite different for other scales, making it difficult to draw clear conclusions from this comparative analysis. One might have hypothesized that the more multidimensional scales identified in our previous analysis would show the largest differences between Traditional and Adaptive NCAPS, but this was not consistently observed. For example, Vigilance had very similar effect sizes for gender but had the largest effect size difference between Traditional and Adaptive NCAPS for race/ethnicity. Dutifulness, another relatively multidimensional scale, had similar effect sizes for race/ethnicity, but different effect sizes for gender. Self-Reliance, the scale with the greatest multidimensionality based on our analysis, had moderately different effect sizes for both gender and race. On the other hand, Achievement, one of the most unidimensional NCAPS scales, showed modest differences between Traditional and Adaptive NCAPS that were of greater magnitude than other scales with greater degrees of multidimensionality.
5-49

Table 5-19 Gender and race effect size comparisons for Traditional and Adaptive NCAPS
scales
Gender Effect Size Race Effect Size (White/Black)
NCAPS Scale Traditional Adaptive Difference Traditional Adaptive Difference
Adaptability /Flexibility -.07 -.09 .02 -.05 -.08 .03
Attention to Detail -.16 -.17 .01 -.08 -.08 .00 Achievement .30 .39 -.09 .21 .34 -.13 Dependability -.07 -.03 -.04 .05 .01 .04 Dutifulness -.32 -.11 -.21 -.07 -.05 -.02 Social Orientation .17 -.08 .25 .07 -.12 .19 Self-Reliance .24 .14 .10 .17 .07 .10 Stress Tolerance .35 .39 -.04 .09 -.03 .12 Vigilance .25 .26 -.01 -.03 .31 -.34 Willingness to Learn .02 -.03 .05 .27 -.02 .29
Note. Positive effect sizes indicate higher scores for whites and males.
Response Latency Analyses
One of the advantages of adaptive testing within the cognitive ability domain has been its efficiency. It typically takes less time to obtain an accurate trait estimate. We therefore conducted analyses to compare response latencies for Traditional and Adaptive NCAPS. Those analyses are described in the following sections.
Supplemental Screening of Response Latency Data
As described above, for purposes of computing trait level scores, the overall pattern of response latencies maintained over an entire inventory is much more relevant for screening purposes than the latencies associated with specific item responses. More stringent screening criteria are, however, required in order to accurately compute the response latency of NCAPS scales and of the NCAPS inventory as a whole. That said, supplemental screening of item-level response latencies should involve only latencies that are highly improbable.
Nonparametric outlier analysis did not identify outliers at the low-end of the response latency frequency distribution due to the large positive skew. It was therefore necessary to fall back on the literature to suggest an appropriate cutoff. Research by Stricker and Alderton (1999), which involved a large sample of naval enlisted recruits’ responses to personality data, suggested that a good low-end response latency cutoff for personality items would be approximately two seconds. We therefore instituted a screening rule that, for purposes of computing response latencies for NCAPS scales, we would recode response latencies less than 2.0 seconds as missing. The corresponding
5-50

figure for Adaptive NCAPS was a 2.5 second minimum. The response latency cutoff for Adaptive NCAPS was based on the approximately 1.3 escalation factor described above.
At the high-end of the response latency frequency distribution, we computed the cutoff point for an “extreme outlier” for each of the 205 Traditional NCAPS items, and then computed a frequency distribution of the 205 extreme outlier cutoff points. The median extreme outlier cutoff point was about 20 seconds. The maximum extreme outlier cutoff point across the 205 Traditional NCAPS items was approximately 40 seconds. Twenty seconds did not seem reasonable as a cutoff point. Maintained across a set of 205 items a 20-second mean latency would indeed be cause for concern. But for one specific response, 20 seconds simply seems too low to screen out response latency data. Forty seconds has often been used in the literature as a high-end response latency cutoff for single personality items (e.g., Fekken & Holden, 1992; Holden, 1995; Siem, 1996, 1998). Given this literature, coupled with the fact that ours is a less educated sample than is typically used in the literature to which the 40 second cutoff has historically been applied, we elected to institute a 40-second maximum response latency for screening Traditional NCAPS response latency data.
One could argue that the maximum upper response latency limits for Adaptive versus Traditional NCAPS should not differ by very much, and that creating different response latency-based screening cutoffs is primarily relevant to the lower end of the response latency frequency distribution. Still, it seemed reasonable that Adaptive NCAPS should have a slightly higher screening-related cutoff than Traditional NCAPS due to the additional cognitive processing that appears to be required. The 1.3 escalation factor that we have been using would result in an upper-limit response latency cutoff of 52 seconds, using the 40-second cutoff instituted for Traditional NCAPS. However, inspection of the frequency distribution of response latencies for Adaptive NCAPS across examinees and constructs (n = 43,091) reveals that the 99.5th percentile of the Adaptive NCAPS response latency distribution for item-pairs is 44 seconds. The upper 0.5 percent of the distribution is approximately four standard deviations above the mean, which is more than sufficient to constitute an outlier. This, coupled with the fact that there is a natural break in the Adaptive NCAPS response latency frequency distribution at approximately 45 seconds, led us to institute an upper-limit response latency screen of 45 seconds for Adaptive NCAPS response latency data.
Comparison of Adaptive and Traditional NCAPS Latencies
Table 5.20 compares the response latencies for Adaptive and Traditional NCAPS on each of the 10 NCAPS scales. For Adaptive NCAPS, the mean response latencies ranged from 2.47 minutes for the Achievement scale to 2.94 minutes for the Self-Reliance scale (median = 2.7 minutes). For Traditional NCAPS, the mean response latencies ranged from 1.75 minutes for the Vigilance scale to 2.89 minutes for the Social Orientation scale (median = 2.3 minutes). Given that (1) the number of items varies considerably across the Traditional NCAPS scales, and (2) the number of Adaptive NCAPS item-pairs that are presented varies from examinee to examinee, a more useful comparison of Adaptive and Traditional NCAPS response latencies would be to compute and compare mean latencies per item-pair (for Adaptive NCAPS) with mean latencies per item (for Traditional NCAPS). For Adaptive NCAPS, the mean latency per item-pair ranged from 9.9 seconds to 11.8 seconds (median = 10.7 seconds). For Traditional NCAPS, the mean
5-51

5-52
latency per item ranged from 6.8 seconds to 9.9 seconds (median = 7.7 seconds). Interestingly, Achievement had the lowest mean latency per item-pair for Adaptive NCAPS and the highest mean latency per item for Traditional NCAPS.
The lower mean latency for Traditional NCAPS appears to be the result of the fact that examinees must read and process one item statement rather than the two item statements that they must read and process for Adaptive NCAPS. We had not regarded this as inevitably leading to lower response latencies for Traditional NCAPS items. It was plausible, for example, that when responding to a Traditional NCAPS item, examinees would actually make five self-comparisons after reading and processing a given statement: one for each response option on the Traditional NCAPS rating scale. By contrast, one might argue that examinees are making only one comparison when responding to an Adaptive NCAPS item-pair: Which statement is more self-descriptive? What appears to have occurred, however, is that examinees automatized the application of the five-point rating scale used for Traditional NCAPS, resulting in very little additional response time after reading and processing the item statement. The key factor in determining response latency appears, then, to be the number of item statements that must be read and processed. This is especially plausible in the present research, since item statements were presented no more than twice to a given examinee.
Before accepting the conclusion that Traditional NCAPS items have lower response latencies than Adaptive NCAPS item-pairs, it was necessary to rule out the alternate hypothesis that the greater response time associated with Adaptive NCAPS is simply an artifact of the screening process. We had, after all, applied lower response latency cutoffs when screening Traditional NCAPS response latency data precisely because we believed that Adaptive NCAPS item-pairs would require more reading/processing time than Traditional NCAPS items. Could it be that we had created a self-fulfilling prophecy?

Table 5-20 Comparison of response latencies for Adaptive and Traditional NCAPS scales and items by scale
Adaptive NCAPS (Original Screening
Rules1) (n = 181-215)
Adaptive NCAPS (Revised Screening
Rules2) (n = 200-243)
Traditional NCAPS (n = 267-268)
NCAPS Scale
Mean Cumulative
Latency (in
minutes)
Mean Latency Per Item-Pair
(in seconds)
Mean Cumulative
Latency (in
minutes)
Mean Latency Per Item-Pair
(in seconds)
Mean Latency (in minutes)
Number of Items in
Scale
Mean Latency Per
Item (in
seconds)
Adaptability/Flexibility 2.82 11.3 2.69 10.8 2.31 18 7.7 Attention to Detail 2.65 10.6 2.54 10.2 1.81 16 6.8
2.47 9.9 2.38 9.5 1.77 15 9.9 Achievement Dependability 2.81 11.2 2.72 10.9 1.84 15 7.4 Dutifulness 2.65 10.6 2.55 10.2 2.26 19 7.1 Social Orientation 2.51 10.0 2.40 9.6 2.89 24 7.2 Self-Reliance 2.94 11.8 2.82 11.3 2.30 16 8.6 Stress Tolerance 2.69 10.8 2.61 10.4 2.29 18 7.6
2.56 10.2 2.52 10.1 1.75 13 8.1 8.4
Vigilance Willingness to Learn 2.75 11.0 2.66 10.6 2.53 18 1 Original screening rules: (1) response latencies less than or equal to 2.5 seconds or greater than 45 seconds for one or more item-pairs on a given construct result in
elimination of an examinee’s data on that construct only; (2) a mean latency across all Adaptive NCAPS item-pairs that is less than or equal to 5 seconds per item-pair results in elimination of all Adaptive NCAPS data for a given examinee; and (3) A Traditional NCAPS Random Response scale score of two or more results in elimination of all Adaptive NCAPS data a given examinee.
2 Revised screening rules: (1) response latencies less than or equal to 2.0 seconds or greater than 40 seconds for one or more item-pairs on a given construct result in elimination of an examinee’s data on that construct only; (2) a mean latency across all Adaptive NCAPS item-pairs that is less than or equal to 4 seconds per item-pair results in elimination of all Adaptive NCAPS data for a given examinee; and (3) no screening based on Traditional NCAPS Random Response scale scores.
5-53

To evaluate this alternate hypothesis, we recomputed mean response latencies for Adaptive NCAPS using the same response latency-based cutoffs as were used for Traditional NCAPS. We relaxed the screening rules further by not screening out any Adaptive NCAPS data-based on examinees’ Traditional NCAPS Random Response scale scores. Since random responding is generally associated with extremely low response latencies, this would have the effect of stacking the deck even further in favor of finding lower response latencies for Adaptive NCAPS relative to Traditional NCAPS. Results based on these revised screening rules are also shown in Table 5.20. These results reveal that, while applying the revised screening rules reduces the response latencies for Adaptive NCAPS slightly from the original screening rules, the revised screening rules do not result in response latencies that are nearly as low as those found for Traditional NCAPS. The mean response latency across scales for Adaptive NCAPS, with revised screening rules, is 10.3 seconds per item-pair, as compared to 7.7 seconds per item for Traditional NCAPS.
Appendix P contains the mean response latencies and cumulative mean latencies by item-pair by scale for Adaptive NCAPS using both the original and revised screening rules. These data are noteworthy in that they show: (1) that the first item-pair always has the highest response latency; and (2) the response latencies tend to decrease as each new item–pair is presented. Appendix Q contains mean item-level response latencies for Traditional NCAPS.
The most critical comparison between Adaptive and Traditional NCAPS, of course, is the total amount of time required to obtain measures of the 10 NCAPS scales. For Adaptive NCAPS, the mean response latency for the test as a whole was 23.3 minutes12
(median = 23.6 minutes; SD = 7.0 minutes). For Traditional NCAPS, the mean response latency for the test as a whole was 26.3 minutes (median = 25.2 minutes; SD = 6.4 minutes). Thus, Traditional NCAPS took longer for examinees to complete. This may seem odd given the shorter latencies associated with Traditional NCAPS. It must be remembered, however, that most of the Traditional NCAPS scales consist of more than 15 items, whereas 15 item-pairs is the maximum for Adaptive NCAPS.
Frequency of Adaptive NCAPS Item-Pair Presentation
One concern regarding Adaptive NCAPS was the possibility that the item pool would not be well utilized. This would occur, for example, if a large number of the items in the pool were never presented to examinees due to unanticipated anomalies in the Adaptive NCAPS algorithm or psychometric deficiencies in the items. Table 5.21 presents data that speak to this concern. This table shows that the mean number of times that item statements were presented across examinees ranged from approximately 44 (for Self-Reliance) to approximately 82 (for Vigilance). Table 5.21 shows that a few items were indeed administered quite frequently. The maximum number of times a given item statement was presented across examinees within a given scale ranged from 240 (for Dependability) to 401 (for Vigilance). Perhaps most importantly, however, Table 5.21 also shows that only a small percentage of item statements were never administered to any examinee. Moreover, the vast majority of item statements were administered at 12Based on examinee records consisting of responses to at least 60 item-pairs.
5-54

5-55
least 10 times; a substantial number of item statements were administered at least 50 times; and, for most scales, more items were administered 100 times or more than were administered once or less. The Adaptive NCAPS item pool was well utilized.
Incorporation of Supervisor Rating Data
Although the validity results reported above were encouraging, we were somewhat surprised that Adaptive NCAPS did not outperform Traditional NCAPS. While we put forth several explanations for why this occurred, another possibility was that the peer ratings were not optimal work performance criteria due to systematic or idiosyncratic biases. Originally, we had hoped to collect both supervisor and peer rating data, but supervisors were not available to us at the time of data collection. Given, however, that the outcome of the validation analyses reported above was largely contrary to our hypotheses, we decided to further explore the possibility of obtaining supervisor rating data for examinees who had previously taken NCAPS. Ultimately, we were able to obtain supervisor rating data, and we report here the results of validation of Traditional and Adaptive NCAPS against those supervisor rating data.
These analyses are not as extensive as those involving the peer rating data, given the limitations of our current contract with NPRST. Our intent, rather, is to determine whether the basic conclusion regarding the relative validities of Adaptive and Traditional NCAPS changes when supervisor rating data replace peer rating data. If so, then more elaborate validity and testing efficiency investigations might be undertaken under a subsequent contract.

Table 5-21 Frequency with which Adaptive NCAPS statements were presented to examinees
Number of Times Statements were
Presented Percent of Statements Presented…
NCAPS Scale Number of Statements Mean SD Maximum Never Once
At Least10 Times
At Least50 Times
At Least100
Times
Adaptability/Flexibility 191 45.0 53.0 252 7.9 7.9 64.9 36.1 12.6
Attention to Detail 164 53.6 61.4 259 6.7 5.5 65.9 49.0 2.1
Achievement 108 78.3 85.4 385 4.6 1.9 75.0 5.9 3.6
Dependability 185 46.9 56.4 240 13.5 4.3 62.2 34.6 17.8
Dutifulness 152 56.1 7.3 326 11.2 7.9 63.8 38.2 19.7
Social Orientation 114 75.7 72.9 298 2.6 1.8 86.0 48.2 35.2
Self-Reliance 199 43.7 6.2 316 13.1 3.0 59.8 27.6 16.1
Stress Tolerance 119 72.1 59.7 306 1.7 1.7 89.1 56.3 31.9
Vigilance 106 81.8 88.3 401 2.8 1.9 85.8 5.9 27.4
Willingness to Learn 156 55.0 61.3 276 16.0 6.4 61.5 42.9 23.1
5-56

Analysis of Supervisor Performance Rating Data
Supervisor performance ratings were available for 138 of the examinees in this study, and ratings were obtained from 68 supervisors. Examinees were rated by a mean of 1.2 supervisors each (SD = 0.48), with a range of 1 to 4 supervisors per examinee. Supervisors rated a mean of 2.4 examinees each (SD = 1.6), with a range of 1 to 7 examinees per supervisor.
Data Screening
We conducted several data quality screens on the performance rating data to eliminate low-quality data from further analyses.
Missing Data. As with the peer rating data, we computed the number of missing responses for each supervisor-examinee combination. Only one out of 165 supervisor-examinee combinations had missing data, and in that case, only two out of 10 ratings were missing. Therefore, no data were eliminated from further analyses based on excessive missing data.
Non-Variability. Again, as with the peer rating data, we computed the standard deviation across the 10 performance dimension ratings for each supervisor to identify cases with an improbable lack of variability in those ratings. All supervisor-examinee records had standard deviations reflecting acceptably high levels of variability, with the exception of one. That supervisor-examinee record had a standard deviation of zero across the 10 dimension ratings, and was therefore carefully scrutinized. This supervisor’s set of ratings was consistent with the set of ratings of the same examinee provided by another supervisor. Therefore, we chose to retain those ratings, despite their lack of variability. As such, no data were eliminated from further analyses based on non-variability.
Insufficient Acquaintanceship Screen. Supervisors were asked to indicate how long they had known the examinees whose performance they were rating. Data provided by supervisors who had known the examinees less than two months were eliminated from further analyses. This eliminated 15 data records (9.1%). Another 23 data records (13.9%) were provided by supervisors who did not respond to the question regarding the length of time they had known an examinee. It was unclear whether they did not respond because they had not known the examinees very long, or simply due to carelessness. Given that 23 data records was a fairly substantial percentage of the total, we chose to continue our analysis of these data, at least for the moment, both with these records retained and again with these records eliminated. If the results differed substantially, this would be evidence that missing length of acquaintanceship data tended to reflect lack of acquaintanceship, and should therefore be eliminated from further analyses.
5-57

5-58
Reliability of Performance Dimension Ratings
We evaluated the interrater reliability of the performance dimension ratings, by computing ICC (1, k) (Shrout & Fleiss, 1979). ICC (1, k) is the appropriate model because each examinee was rated by a different set of k supervisors, randomly selected from a larger population of supervisors. When missing data for length of acquaintanceship were included, the median interrater reliability coefficient was .25. When missing data for length of acquaintanceship were excluded, the median interrater reliability coefficient was .43. These reliability data suggested that we should focus on results based on the data set in which missing length of acquaintanceship data were excluded, which we did.
Descriptive Statistics and Intercorrelations
The supervisors whose rating data were retained for further analysis reported knowing the examinees they rated for a mean of 8.4 months (SD = 6.5). The performance rating data were next aggregated to the examinee level, such that the item scores for each examinee represented the mean rating of her/his supervisors. Means, standard deviations, and intercorrelations between the performance dimensions are shown in Table 5.22. On our 1 to 7 rating scale, mean dimension ratings ranged from 4.07 to 4.60, and the global Overall Potential rating was 4.69. Intercorrelations (excluding the global Overall Potential rating) exhibited substantial positive manifold, ranging from .39 to .71, with a median of .57. The intercorrelations were slightly higher than those associated with the peer ratings, for which the median was .47.
Predictably, the mean supervisor ratings were higher than the mean peer ratings of the examinees. The median standardized mean-score difference across the 10 work performance dimensions was d = .55, and ranged from d = .34 (Cooperating/Working Well with Others) to d = .76 (Problem-Solving and Decision-Making).
Factor Analysis of Performance Dimension Ratings
As with the peer rating data, we conducted a principal axis factor analysis to evaluate the dimensionality of the supervisors’ performance dimension ratings and used parallel analysis results to determine an appropriate number of factors to extract. The parallel analysis results are shown in Table 5.23. Consistent with the peer rating data results, comparison of the real- and random-data eigenvalues indicates that a unifactor solution is most appropriate. Based on these factor analysis results, we created a unit-weighted supervisor performance rating composite, which represents the overall work performance domain. ICC (1, k) for the supervisors’ unit-weighted Overall Performance composite is .53.

Table 5-22 NCAPS supervisor performance rating dimensions:
Means, Standard Deviations, Interrater Reliabilities, and Intercorrelations
NCAPS Performance Rating Dimension Mean SD 1 2 3 4 5 6 7 8 9 10
1. Cooperating/Working Well with Others
4.60 1.32 .68
2. Task Proficiency and Productivity 4.37 1.08 .55 .76 3. Adaptability/ Flexibility 4.20 1.19 .62 .62 .16 4. Initiative and Self-Development 4.23 1.35 .60 .71 .61 -.04 5. Knowledge and Support of Unit/
Command Objectives 4.07 1.14 .42 .56 .49 .62 .39
6. Problem Solving and Decision Making
4.07 1.23 .44 .57 .60 .65 .62 .34
7. Integrity/Honesty 4.53 1.39 .65 .50 .50 .60 .48 .44 .01 8. Work Ethic 4.53 1.30 .64 .60 .59 .71 .56 .56 .67 .62 9. Communicating Effectively 4.30 1.14 .39 .50 .48 .59 .54 .59 .53 .58 .48 10. Overall Potential 4.69 1.31 .69 .65 .68 .76 .58 .62 .67 .76 .59 .62 Note. n = 111. The rating scale for the performance ratings ranges from 1 to 7. All correlations are statistically significant at p < .01. Interrater reliabilities [ICC (1,k)] for
each performance rating dimension are on the diagonal of the intercorrelation matrix incorporated into this table.
5-59

Table 5-23 Parallel analysis results for principal axis factor analysis of
supervisor rating data
Root Random Eigenvalue Real Eigenvalue
1 .53/.74 5.13 2 .35/.50 .38 3 .25/.36 .18 4 .13/.22 .03
Note. n = 111. Numbers to the left of the slashes in the random eigenvalue column are the mean eigenvalues associated with each root and the numbers to the right of the slashes are the 95th percentile eigenvalues associated with each root, based on factoring of 100 sets of random normal data.
Validity Analyses
Uncorrected Zero-Order Correlations between NCAPS Scales and Supervisor-Rated Performance Dimensions
Table 5.24 shows uncorrected validity coefficients between Traditional and Adaptive NCAPS scales and the 10 work performance rating dimensions. These results show that Adaptive NCAPS scales are substantially more predictive than Traditional NCAPS scales against supervisor rating data, and are quite different from the validity data involving peer ratings. Out of 120 possible validity coefficients, 28 Adaptive NCAPS validities were > .20 (p < .05, 1-tailed). By contrast, only 12 of the Traditional NCAPS validities reached r > .20. Since not every NCAPS scale was expected to correlate with every work performance dimension, a more telling analysis would be to compare Traditional and Adaptive NCAPS scale validities for specific NCAPS scale-work performance dimension cells. We therefore counted the number of times that Adaptive NCAPS was: (1) statistically significant, or very close to statistical significance; and (2) exceeded the correlation coefficient associated with Traditional NCAPS by at least .05. We then counted the number of times that these conditions held, but with Traditional NCAPS validities exceeding Adaptive NCAPS validities by at least .05.
We found that Adaptive NCAPS scale validities exceeded Traditional NCAPS scale validities 31 times, whereas Traditional NCAPS scale validities exceeded Adaptive NCAPS scale validities only eight times (a ratio of 3.9 to 1). Often, the differences were very large, especially for the NCAPS Achievement and Social Orientation scales. For example, the Adaptive NCAPS Achievement scale has an uncorrected correlation of .34 against Task Proficiency and Productivity ratings, compared to an uncorrected correlation of .14 for the Traditional NCAPS Achievement scale. Similarly, the Adaptive NCAPS Social Orientation scale has an uncorrected correlation of .28 against Cooperating/Working Well with Others ratings, compared to an uncorrected correlation of .04 for the Traditional NCAPS Social Orientation scale. As with the peer rating data, however, the Traditional NCAPS Willingness to Learn scale correlates higher with several work performance dimensions then its Adaptive NCAPS Willingness to Learn counterpart scale.
5-60

5-61
In general, the Adaptive NCAPS scales that are most predictive of supervisor ratings on the various work performance dimensions are Achievement, Dependability, Social Orientation, and Stress Tolerance. Adaptive NCAPS scales that are least predictive of the various work performance dimensions are Adaptability/Flexibility, Dutifulness, and Self-Reliance.
Table 5.25 compares the validities of the Traditional and Adaptive NCAPS scales against the unit-weighted Overall Performance composite. Once again, Adaptive NCAPS out-predicted Traditional NCAPS. Using the same evaluation method we found that 5 out of 10 Adaptive NCAPS scales out-predicted Traditional NCAPS scales, whereas only one Traditional NCAPS scale out-predicted its counterpart Adaptive NCAPS scale. The most pronounced difference involved the Achievement scale, where Adaptive NCAPS correlated r = .35 (p < .05), but Traditional NCAPS correlated only r = .07 (n.s.). Adaptive NCAPS Dependability, Social Orientation, and Stress Tolerance, all out-predicted their Traditional NCAPS scale counterparts by large margins. Traditional NCAPS only out-predicted Adaptive NCAPS in the case of Willingness to Learn.
In comparing the data reported in Table 5.25 with the equivalent validity data for peer-rated performance, one finds that, whereas the validity coefficients associated with supervisor ratings are somewhat higher for Adaptive NCAPS scales (substantially higher in a few cases), the biggest difference is that the Traditional NCAPS validity coefficients based on supervisor rating data are much lower than they are when peer ratings serve as the criteria.

Table 5-24 Uncorrected zero-order correlations between Traditional and Adaptive NCAPS scales and supervisor ratings
on work performance dimensions
Coo
pera
tin
g/
Wor
kin
g W
ell w
ith
O
ther
s
Task
Pro
fici
ency
an
d P
rodu
ctiv
ity
Ada
ptab
ility
/ Fl
exib
ility
Init
iati
ve a
nd
Sel
f-D
evel
opm
ent
Kn
owle
dge/
Su
ppor
t of
Un
it/
Com
man
d O
bjec
tive
s
Pro
ble
m S
olvi
ng
and
Dec
isio
n
Mak
ing
Inte
grit
y/H
ones
ty
Wor
k Et
hic
Com
mu
nic
atin
g Ef
fect
ivel
y
Ove
rall
Pot
enti
al
(Glo
bal
Rat
ing)
NCAPS Scale T A T A T A T A T A T A T A T A T A T A
Adaptability/Flexibility .06 .08 .14 .16 .11 .14 .08 .05 .16 .12 .10 .07 .06 .00 .11 .01 .05 .09 .08 .01 Attention to Detail .10 .20 .17 .16 .05 .06 .10 .21 .06 .08 .10 .10 .11 .13 .15 .14 -.02 .06 -.03 .11 Achievement .10 .32 .14 .34 .03 .26 .04 .32 -.02 .23 .03 .30 .01 .24 .13 .26 .02 .21 -.01 .19 Dependability .15 .27 .23 .20 .07 .16 .09 .25 -.01 .03 .06 .17 .05 .17 .18 .28 -.09 .03 .05 .19 Dutifulness .19 .12 .24 .12 .05 -.04 .07 .19 -.03 -.02 -.03 .06 .12 .08 .15 .13 -.03 -.03 .00 .04 Social Orientation .04 .28 .13 .18 .05 .18 -.04 .17 .08 .21 -.04 .12 .04 .24 -.01 .06 -.05 .13 -.01 .20 Self-Reliance .03 -.04 .18 .13 -.01 -.03 .17 .16 .08 .04 .12 .08 -.09 -.11 .16 .12 .05 .04 .00 -.03 Stress Tolerance .03 .20 .12 .26 -.07 .05 .09 .23 .07 .15 .01 .15 -.10 -.01 .08 .16 -.03 .07 -.01 .07 Vigilance .13 .13 .20 .21 -.07 .13 .04 .12 -.04 .09 -.03 .20 -.01 -.06 .09 .07 -.11 .07 -.06 .02 Willingness to Learn .29 .06 .23 .14 .21 .19 .21 .21 .25 .23 .21 .15 .24 .21 .02 .27 .03 .27 .23 .11 Note. n = 85 for Adaptive NCAPS correlations; n = 78 for Traditional NCAPS correlations. For Adaptive NCAPS, correlations > .18 are statistically significant at p < .05, 1-tailed. For
Traditional NCAPS, correlations > .19 are statistically significant at p < .05, 1-tailed. T refers to validity coefficients for Traditional NCAPS and A refers to validity coefficients for Adaptive NCAPS.
5-62

Corrected Zero-Order Correlations between NCAPS Scales and Supervisor-Rated Performance
Table 5.25 also shows validity coefficients between Traditional and Adaptive NCAPS scales and the supervisor unit-weighted Overall Performance composite, corrected for criterion unreliability. The estimate of criterion reliability used to correct the validity coefficients was the ICC (1, k) interrater reliability estimate of .53. The median correlation between Adaptive NCAPS scales and the unit-weighted Overall Performance composite is .24 (range: .07 to .48); and the median corrected correlation between Traditional NCAPS scales and the unit-weighted Overall Performance composite is .14 (range: = .03 to .40). Three of the Adaptive NCAPS corrected correlations with the unit-weighted Overall Performance composite exceeded r = .30, and five exceeded r = .25. By contrast, only one of the Traditional NCAPS corrected correlations reached r = .25. The largest difference in validity coefficients involved The NCAPS Achievement scale: Adaptive NCAPS Achievement correlated r = .48 with the Overall Performance composite, whereas Traditional NCAPS Achievement correlated only r = .10.
Table 5-25 Uncorrected and corrected zero-order correlations between
Traditional and Adaptive NCAPS scales and supervisor ratings of overall performance
Uncorrected Unit-Weighted Overall Performance
Composite
Unit-Weighted Overall Performance
Composite, Corrected for Criterion Unreliability
NCAPS Scale Traditional Adaptive Traditional Adaptive
Adaptability/Flexibility .12 .10 .16 .14 Attention to Detail .12 .17 .16 .23 Achievement .07 .35 .10 .48 Dependability .10 .23 .14 .32 Dutifulness .11 .09 .15 .12 Social Orientation .02 .22 .03 .30 Self-Reliance .10 .05 .14 .07 Stress Tolerance .03 .18 .04 .25 Vigilance .03 .13 .04 .18 Willingness to Learn .29 .19 .40 .26 Note. n = 85 for Adaptive NCAPS correlations; n = 78 for Traditional NCAPS correlations. For Adaptive NCAPS,
correlations > .18 are statistically significant at p < .05, 1-tailed. For Traditional NCAPS, correlations > .19 are statistically significant at p < .05, 1-tailed.
5-63

Overlap between Predictor Space and Criterion Space Based on Supervisor Ratings
In order to determine the degree of overlap between the personality scales measured by NCAPS and supervisor-rated overall performance, we correlated unit-weighted composites of the 10 NCAPS scales for both the Traditional and Adaptive formats against the unit-weighted Overall Performance composite. The Traditional and Adaptive NCAPS composites had uncorrected correlations with the unit-weighted Overall Performance composite of r = .13 (n.s.) and r = .27 (p < .05), respectively (the difference between these two correlations is statistically significant at p < .01). When corrected for criterion unreliability, those validities rise to .18 and .37, respectively13. Once again, Adaptive NCAPS substantially out-predicted Traditional NCAPS.
Summary
When the validity of Traditional and Adaptive NCAPS scales is evaluated against supervisor rating data, Adaptive NCAPS out-predicts Traditional NCAPS, often by very large margins. The Adaptive NCAPS scales that out-predict their Traditional NCAPS counterpart scales to the greatest extent are Achievement, Dependability, Social Orientation, and Stress Tolerance. Traditional NCAPS out-predicts Adaptive NCAPS only in the case of Willingness to Learn.
Certainly, the validity results reported in this chapter supplement strongly suggest that Adaptive NCAPS is indeed superior to Traditional NCAPS, even though higher-validity items were disproportionately represented in the Traditional NCAPS scales relative to their Adaptive NCAPS counterpart scales. Further investigations, including analysis of the number of item-pairs necessary to achieve asymptotic validity levels relative to Traditional NCAPS, seem clearly warranted based on this new evidence.
It is not clear why the supervisor rating data resulted in larger validity coefficients for Adaptive than for Traditional NCAPS, whereas the opposite result was found in the peer rating data. The greater reliability of Adaptive NCAPS, the smaller positive manifold associated with Adaptive NCAPS, the successful use of methodology similar to Adaptive NCAPS within the performance rating domain (i.e., CARS), and the compelling argument made by Borman and his colleagues (for CARS and, by extension, for Adaptive NCAPS) that the Adaptive NCAPS algorithm would be more likely to approximate interval-level measurement than Traditional NCAPS all converged on the hypothesis that Adaptive NCAPS would out-predict Traditional NCAPS.
Despite the smaller sample size, it is likely that the supervisor ratings are more accurate than the peer ratings, and that the supervisor-based results better reflect the true state of affairs. The supervisors were undoubtedly far more accustomed to rating others’ work performance and, in the present case, were actually involved in development of the rating scales that were used. As such, they were using dimensions
13We did not evaluate the overlap between the predictor space and the supervisor-rated criterion space using multiple regression, as we did in the case of the peer-rating data, due to the fact that the smaller sample size associated with the supervisor rating data was not sufficient to produce meaningful regression results.
5-64

and rating scales with which they were more familiar, and to which they were therefore more highly calibrated. Moreover, our experience, accumulated over many years, strongly suggests that supervisors provide performance ratings that are superior to those provided by other rating sources.
In conclusion, then, our hypothesis that Adaptive NCAPS would yield more precise estimates of personality that would out-predict Traditional NCAPS against work performance ratings for Naval enlisted personnel received strong support in the supervisor rating data set. Therefore, notwithstanding the peer rating results, this research has shown that the Adaptive NCAPS technology has great promise. Since Adaptive NCAPS takes less time to administer than Traditional NCAPS, the superior validities shown by Adaptive NCAPS will be gained in less time than Traditional NCAPS validities. Determining how many item-pairs Adaptive NCAPS scales require to produce near-maximum validity levels is a critical next step in the NCAPS research program.
5-65

Chapter 5 References
Borman, W. C., Buck, D. E., Hanson, M. A., Motowidlo, S. J., Stark, S., & Drasgow, F. (2001). An examination of the comparative reliability, validity, and accuracy of performance ratings made using computerized adaptive rating scales. Journal of Applied Psychology, 86, 965-973.
Britt, T. W. (1993). Metatraits: Evidence relevant to the validity of the construct and its implications. Journal of Personality and Social Psychology. 65, 554-562.
Cattin, P. (1980a). Note on the estimation of the squared cross-validated multiple correlation of a regression model. Psychological Bulletin, 87, 63-65.
Cattin, P. (1980b). Estimating the predictive power of a regression model. Journal of Applied Psychology, 65, 407-414.
DeShon, R. P. (2002). Generalizability theory. In F. Drasgow & N. Schmitt (Eds.), Measuring and analyzing behavior in organizations (pp. 189-220). San Francisco: Jossey-Bass.
Devore, J., & Peck, R. (1986). Statistics: The exploration and analysis of data. St. Paul: West.
Fekken, G. C., & Holden, R. R. (1992). Response latency evidence for viewing personality traits as schema indicators. Journal of Research in Personality, 26, 103-120.
Ghiselli, E., Campbell, J., & Zedeck, S. (1981). Measurement theory for the behavioral sciences. San Francisco, CA: W. H. Freeman and Company.
Hayton, J. C., Allen, D. G., & Scarpello, V. (2004). Factor retention decisions in exploratory factor analysis: A tutorial on parallel analysis. Organizational Research Methods, 7, 191-205.
Holden, R. R (1995). Response latency detection of fakers on personnel tests. Canadian Journal of Behavioural Science, 27, 343-355.
Horn, J. L. (1965). A rationale and test for the number of factors in factor analysis. Psychometrika, 32, 179-185.
Houston, J. S., Schneider, R. J., Ferstl, K. L., Borman, W. C., Hedge, J. W., Farmer, W. L., & Bearden, R. M. (2003). NCAPS: Development of the Enlisted Computer Adaptive Personality Scales for the United States Navy (Institute Report #449). Minneapolis: Personnel Decisions Research Institutes, Inc.
James, L. R., Demaree, R. G., & Wolf, G. (1984). Estimating within-group interrater reliability with and without response bias. Journal of Applied Psychology, 69, 85-98.
Ones, D. S., Viswesvaran, C., & Reiss, A. D. (1996). Role of social desirability in personality testing for personnel selection: The red herring. Journal of Applied Psychology, 82, 660-679.
5-66

Paulhus, D. L. (2002). Socially desirable responding: The evolution of a construct. In H. Braun, D.N. Jackson, & D.E. Wiley (Eds.), The role of constructs in psychological and educational measurement (pp. 67-88). Hillsdale, NJ: Erlbaum.
Shavelson, R. J., & Webb, N. M. (1991). Generalizability theory: A primer. Newbury Park, CA: Sage.
Shrout, P. E., & Fleiss, J. L. (1979). Intraclass correlations: Uses in assessing rater reliability. Psychological Bulletin, 86, 420-428.
Siem, F. M. (1996). The use of response latencies to enhance self-report personality measures. Military Psychology, 8, 15-27.
Siem, F. M. (1998). Metatraits and self-schemata: Same or different? Journal of Personality, 66, 783-803.
Stricker, L. J., & Alderton, D. L. (1999). Using response latency measures for a biographical inventory. Military Psychology, 11, 169-188.
Tellegen, A. (1988). The analysis of consistency in personality. Journal of Personality, 56, 621-663.
Thissen, D. (2000). Reliability and measurement precision. In H. Wainer (Ed.), Computerized adaptive testing: A primer (2nd ed., pp. 159-184). Mahwah, NJ: Erlbaum.
Wherry, R. J. (1931). A new formula for predicting the shrinkage of the coefficient of multiple correlation. Annals of Mathematical Statistics, 2, 440-457.
5-67


A-0
Appendix A: Expert Judgment Rating Forms


A-1
Instructions for Making Expert Judgments of Personality Characteristics’ Relevance for Performance in Navy Jobs
We are asking you to serve as an expert rater for the Navy ENCAPS (Enlisted Computer Adaptive Personality Scales) Project (for PDRIer timesheets, project #14500). Your knowledge and expertise in the area of predicting job performance, and/or personality predictors/theory, and/or Navy ratings is essential to the success of this effort.
Purpose of Project
The goal of this project is to develop and validate a non-cognitive inventory to supplement the ASVAB for selecting and classifying Navy applicants into entry-level jobs. As its name implies, the non-cognitive inventory employs a computer adaptive format and, as such, will be considerably more efficient in terms of administration time than traditional non-cognitive measures and should yield even more precise estimates of applicants’ standing on the traits measured.
To date, an initial draft of ENCAPS has been developed and successfully pilot tested. This version measures three constructs thought to be highly relevant for selecting and classifying Navy recruits: Achievement, Social Orientation, and Stress Tolerance. It is time now to define the remaining constructs or characteristics that ENCAPS should measure. In order to determine which non-cognitive characteristics would be most useful to include, we need your expert judgments about how each of the proposed constructs in the attached document are related to performance in Navy jobs.
Your Task
You are being asked to evaluate the extent to which you believe each of a number of different personality, or “non-cognitive” characteristics is related to and predictive of job performance in various Navy jobs, or “ratings,” as they are referred to. We ask that you make your evaluations by filling in the cells on the attached matrix showing Personality Characteristics across the top, and entry-level Navy Ratings down the left side. There are two additional documents providing important information for this task:
• Definitions of Personality Characteristics
• Descriptions of Navy Ratings
First, we recommend that you read through all of the Definitions of Personality Characteristics. Then focus on one Navy Rating at a time to make your ratings. Carefully read the information available for the first Navy Rating in the Descriptions of Navy Ratings document, then evaluate the extent to which you believe each Personality Characteristic is important for, relevant to, and predictive of job performance in this Navy Rating. Please use the following scale to make your ratings:

A-2
0 = characteristic has no importance or relevance for the Navy rating 1 = characteristic has little importance or relevance for the Navy rating 2 = characteristic has some importance and relevance for the Navy rating 3 = characteristic has a lot of importance and relevance for the Navy rating 4 = characteristic is critically important and relevant for the Navy rating
In the Navy Ratings document, the majority of the material consists of one-page (occasionally, two-page) job descriptions, presented in the same alphabetical order (by acronym) as the rating matrix. In addition you will notice placed first in this stack of material, three General Information documents: one to describe ratings that involve Submarine duty, one to describe ratings that involve working in the Nuclear field, and one describing work in the Advanced Electronics/Computer Field (AECF). There are a number of Navy jobs that have a submarine or nuclear or AECF version of the job and a non-submarine, non-nuclear, or non-AECF version of the job. You will be asked to rate these jobs separately, but we do not always have a separate job description for the submarine, nuclear, or AECF version. Please extrapolate the information in the General Information documents to help you make these ratings.
FYI, individuals have so far been taking between 2 ½ to 4 ½ hours to complete these ratings. When you have made all your ratings, please return the completed matrix to Janis Houston at PDRI via email (Janis.Houston@ pdri.com) or fax (612-623-7614). If possible, we would like to have all ratings returned by 9 January 2004. We would greatly appreciate it if you could notify us if you will not be able to make these ratings by this deadline. And, of course, we would love it if as many of you as possible can do this task well before deadline, so we can process the ratings as they come in! Again, our heartfelt thanks.

A-3
Expert Judgment Rating Matrix
0 = no importance or relevance 1 = little importance or relevance 2 = some importance and relevance 3 = a lot of importance and relevance 4 = critically important and relevant
Navy Rating Achi
evem
ent
Adap
tabi
lity/F
lexib
ility
Adve
ntur
ous/C
oura
geou
s
Atte
ntio
n to
Det
ail
Com
pass
ion
Depe
ndab
ility
Dutif
ulne
ss/In
tegr
ity
Ener
gy L
evel
Self-
Cont
rol
Inno
vatio
n
Lead
ersh
ip O
rient
atio
n
Perc
eptiv
enes
s/Dep
th o
f Tho
ught
Posit
ive S
elf-C
once
pt
Self-
Relia
nce
Socia
l Ast
uten
ess
Socia
l Orie
ntat
ion
Stre
ss T
oler
ance
Vigi
lance
Willi
ngne
ss to
Lea
rn
1. Aviation Boatswains Mate (ABE, ABF, ABH)
2. Air Traffic Controller (AC)
3. Aviation Machinist’s Mate (AD)
4. Aviation Electrician’s Mate (AE)
5. Aerographer’s Mate (AG)
6. Aircrew Program (AIRC, AIRR)
7. Aviation Structural Mechanic (AM, AME)
8. Aviation Ordnanceman (AO)
9. Aviation Support Equipment Technician (AS)

A-4
0 = no importance or relevance 1 = little importance or relevance 2 = some importance and relevance 3 = a lot of importance and relevance 4 = critically important and relevant
Navy Rating Achi
evem
ent
Adap
tabi
lity/F
lexib
ility
Adve
ntur
ous/C
oura
geou
s
Atte
ntio
n to
Det
ail
Com
pass
ion
Depe
ndab
ility
Dutif
ulne
ss/In
tegr
ity
Ener
gy L
evel
Self-
Cont
rol
Inno
vatio
n
Lead
ersh
ip O
rient
atio
n
Perc
eptiv
enes
s/Dep
th o
f Tho
ught
Posit
ive S
elf-C
once
pt
Self-
Relia
nce
Socia
l Ast
uten
ess
Socia
l Orie
ntat
ion
Stre
ss T
oler
ance
Vigi
lance
Willi
ngne
ss to
Lea
rn
10. Aviation Electronics Technician (AT)
11. Aviation Antisubmarine Warfare Operator (AW)
12. Aviation Maintenance Administration (AZ)
13. Boatswains Mate (BM)
14. Builder (BU)
15. Construction Electrician (CE)
16. Construction Mechanic (CM)
17. Crytologic Technician, Administrative (CTA)
18. Crytologic Technician, Interpretive (CTI)
19. Crytologic Technician, Maintenance (CTM)

A-5
0 = no importance or relevance 1 = little importance or relevance 2 = some importance and relevance 3 = a lot of importance and relevance 4 = critically important and relevant
Navy Rating Achi
evem
ent
Adap
tabi
lity/F
lexib
ility
Adve
ntur
ous/C
oura
geou
s
Atte
ntio
n to
Det
ail
Com
pass
ion
Depe
ndab
ility
Dutif
ulne
ss/In
tegr
ity
Ener
gy L
evel
Self-
Cont
rol
Inno
vatio
n
Lead
ersh
ip O
rient
atio
n
Perc
eptiv
enes
s/Dep
th o
f Tho
ught
Posit
ive S
elf-C
once
pt
Self-
Relia
nce
Socia
l Ast
uten
ess
Socia
l Orie
ntat
ion
Stre
ss T
oler
ance
Vigi
lance
Willi
ngne
ss to
Lea
rn
20. Crytologic Technician, Communications (CTO)
21. Crytologic Technician, Collection (CTR)
22. Crytologic Technician, Technical (CTT)
23. Damage Controlman (DC)
24. Disbursing Clerk (DK)
25. Diver
26. Draftsman (DM)
27. Dental Technician (DT)
28. Engineering Aide (EA)
29. Electrician’s Mate (EM)
30. Electrician’s Mate, Nuclear (EM-NUC)

A-6
0 = no importance or relevance 1 = little importance or relevance 2 = some importance and relevance 3 = a lot of importance and relevance 4 = critically important and relevant
Navy Rating Achi
evem
ent
Adap
tabi
lity/F
lexib
ility
Adve
ntur
ous/C
oura
geou
s
Atte
ntio
n to
Det
ail
Com
pass
ion
Depe
ndab
ility
Dutif
ulne
ss/In
tegr
ity
Ener
gy L
evel
Self-
Cont
rol
Inno
vatio
n
Lead
ersh
ip O
rient
atio
n
Perc
eptiv
enes
s/Dep
th o
f Tho
ught
Posit
ive S
elf-C
once
pt
Self-
Relia
nce
Socia
l Ast
uten
ess
Socia
l Orie
ntat
ion
Stre
ss T
oler
ance
Vigi
lance
Willi
ngne
ss to
Lea
rn
31. Engineman (EN, EN-ATF)
32. Equipment Operator (EO)
33. Explosive Ordnance Disposal Challenge (EOD)
34. Electronics Technician (ET, ET-ATF)
35. Electronics Technician, Nuclear (ET-NUC)
36. Electronics Technician, Sub (ET-SS)
37. Fire Controlman (FC)
38. Fire Control Technician, Sub (FT-SS)
39. Gunner’s Mate (GM)
40. Gas Turbine Systems Technician, Electrical (GSE)

A-7
0 = no importance or relevance 1 = little importance or relevance 2 = some importance and relevance 3 = a lot of importance and relevance 4 = critically important and relevant
Navy Rating Achi
evem
ent
Adap
tabi
lity/F
lexib
ility
Adve
ntur
ous/C
oura
geou
s
Atte
ntio
n to
Det
ail
Com
pass
ion
Depe
ndab
ility
Dutif
ulne
ss/In
tegr
ity
Ener
gy L
evel
Self-
Cont
rol
Inno
vatio
n
Lead
ersh
ip O
rient
atio
n
Perc
eptiv
enes
s/Dep
th o
f Tho
ught
Posit
ive S
elf-C
once
pt
Self-
Relia
nce
Socia
l Ast
uten
ess
Socia
l Orie
ntat
ion
Stre
ss T
oler
ance
Vigi
lance
Willi
ngne
ss to
Lea
rn
41. Gas Turbine Systems Technician, Mechanical (GSM)
42. Hospital Corpsman (HM)
43. Hull Maintenance Technician (HT, HT-ATF)
44. Interior Communications Electrician (IC, IC-ATF)
45. Intelligence Specialist (IS)
46. Information Technology Specialist (IT)
47. Journalist (JO)
48. Lithographer (LI)
49. Legalman (LN)
50. Master at Arms (MA)

A-8
0 = no importance or relevance 1 = little importance or relevance 2 = some importance and relevance 3 = a lot of importance and relevance 4 = critically important and relevant
Navy Rating Achi
evem
ent
Adap
tabi
lity/F
lexib
ility
Adve
ntur
ous/C
oura
geou
s
Atte
ntio
n to
Det
ail
Com
pass
ion
Depe
ndab
ility
Dutif
ulne
ss/In
tegr
ity
Ener
gy L
evel
Self-
Cont
rol
Inno
vatio
n
Lead
ersh
ip O
rient
atio
n
Perc
eptiv
enes
s/Dep
th o
f Tho
ught
Posit
ive S
elf-C
once
pt
Self-
Relia
nce
Socia
l Ast
uten
ess
Socia
l Orie
ntat
ion
Stre
ss T
oler
ance
Vigi
lance
Willi
ngne
ss to
Lea
rn
51. Machinist’s Mate (MM, MM-ATF)
52. Machinist’s Mate, Nuclear (MM-NUC)
53. Machinist’s Mate, Submarines MM(SS)
54. Mineman (MN)
55. Machinery Repairman (MR)
56. Mess Management Specialist, Surface (MS)
57. Mess Management Specialist, Submarines MS(SS)
58. Missile Technician (MT)
59. Navy Counselor (NC)
60. Operations Specialist (OS)
61. Postal Clerk (PC)

A-9
0 = no importance or relevance 1 = little importance or relevance 2 = some importance and relevance 3 = a lot of importance and relevance 4 = critically important and relevant
Navy Rating Achi
evem
ent
Adap
tabi
lity/F
lexib
ility
Adve
ntur
ous/C
oura
geou
s
Atte
ntio
n to
Det
ail
Com
pass
ion
Depe
ndab
ility
Dutif
ulne
ss/In
tegr
ity
Ener
gy L
evel
Self-
Cont
rol
Inno
vatio
n
Lead
ersh
ip O
rient
atio
n
Perc
eptiv
enes
s/Dep
th o
f Tho
ught
Posit
ive S
elf-C
once
pt
Self-
Relia
nce
Socia
l Ast
uten
ess
Socia
l Orie
ntat
ion
Stre
ss T
oler
ance
Vigi
lance
Willi
ngne
ss to
Lea
rn
62. Photographer’s Mate (PH)
63. Personnelman (PN)
64. Aircrew Survival Equipmentman (PR)
65. Quartermaster (QM)
66. Religious Program Specialist (RP)
67. SEAL
68. Ship’s Serviceman (SH)
69. Storekeeper, Surface (SK)
70. Storekeeper, Submarines SK(SS)
71. Signalman (SM)
72. Sonar Technician, Surface (STG, STG–AEF)

A-10
0 = no importance or relevance 1 = little importance or relevance 2 = some importance and relevance 3 = a lot of importance and relevance 4 = critically important and relevant
Navy Rating Achi
evem
ent
Adap
tabi
lity/F
lexib
ility
Adve
ntur
ous/C
oura
geou
s
Atte
ntio
n to
Det
ail
Com
pass
ion
Depe
ndab
ility
Dutif
ulne
ss/In
tegr
ity
Ener
gy L
evel
Self-
Cont
rol
Inno
vatio
n
Lead
ersh
ip O
rient
atio
n
Perc
eptiv
enes
s/Dep
th o
f Tho
ught
Posit
ive S
elf-C
once
pt
Self-
Relia
nce
Socia
l Ast
uten
ess
Socia
l Orie
ntat
ion
Stre
ss T
oler
ance
Vigi
lance
Willi
ngne
ss to
Lea
rn
73. Sonar Technician, Submarine (STS-SEF)
74. Steelworker (SW)
75. SWCC
76. Torpedoman’s Mate, Surface (TM)
77. Utilitiesman (UT)
78. Yeoman (YN)
79. Yeoman, Submarines YN(SS)

A-11
Definitions of Personality Characteristics for use with Expert Judgment Task
1. Achievement: likes to set and achieve challenging goals, work hard, persist in the face of significant obstacles; strive for excellence, perfectionism; confident in ability to perform well.
2. Adaptability/Flexibility: willing to change his/her approach to tasks and projects; able to work effectively with many different types of people in many different types of situations and/or with differing organizational constraints.
3. Adventurous/Courageous: daring and brave; unafraid of exposing self to possible attack or injury; enjoys the excitement of a dangerous situation; likes to take chances.
4. Attention to Detail: is exacting, precise, accurate, neat, and thorough; spots minor imperfections or errors; is meticulous in his/her approach to tasks.
5. Compassion: demonstrates concern, consideration, and caring; enjoys taking care of others in need; often provides sympathy, comfort and assistance to others; identifies closely with others and with their problems.
6. Dependability: reliable, well organized, orderly and planful; not easily distracted or bored by routine tasks; does not procrastinate, even when tasks are unpleasant or unexciting.
7. Dutifulness/Integrity: accepts authority and follows laws and regulations.
8. Energy level: active; possesses reserves of strength; does not tire easily; capable of intense work activity for long periods of time.
9. Self-Control: thinks through possible consequences before taking action; does not act on the “spur of the moment;” has no difficulty controlling emotions and behavior he/she knows to be inappropriate.
10. Innovation: able to come up with new ideas for, and answers to, work-related problems; does not stick to old, less effective or inefficient approaches simply because things have always been done that way.
11. Leadership orientation: willing to lead, take charge, offer opinions and direction, and take responsibility for guiding others’ actions; able to mobilize others to act; is confident and decisive.
12. Perceptiveness/Depth of Thought: interested in pursuing topics in depth; enjoys abstract thought and has a need to understand how things work; enjoys searching for patterns in data and understanding the “big picture;” knowledgeable about many things; perceptive and insightful.
13. Positive Self-Concept: feels good about self, mentally and physically; self-assured; optimistic about the future; believes that one controls one’s own fate.
14. Self-Reliance: self-sufficient, resourceful, and able to make own decisions when appropriate; does not become dependent on others to get things done.

A-12
15. Social Astuteness: understands the underlying motives, feelings, and intentions of others and can accurately predict their behavior based on that understanding.
16. Social Orientation: outgoing, sociable, warm, likable, cooperative and participative; likes to work with others rather than alone; likes and accepts people readily and values connections with others; establishes and maintains friendships easily.
17. Stress Tolerance: maintains composure and retains ability to think clearly and take effective action when confronted with stressful situations; can readily put aside worries to get the job done.
18. Vigilance: constantly scans the environment for things that require attention, even when no action may be required for long periods of time (e.g., staying alert to possible safety hazards).
19. Willingness to Learn: demonstrates an interest in and willingness to learn, e.g., in a classroom environment or on the job, or in general, and to apply that material in new situations; learns from mistakes, takes useful advice, and asks questions when unsure about something.

B-0
Appendix B: Means and SDs of Ratings of Importance for 19
Constructs for 79 Navy Jobs


B-1
Means and SDs for 19 Personality Constructs for 79 Navy Jobs
Navy Job Achi
evem
ent
Adap
tabi
lity/F
lexib
ility
Adve
ntur
ous/C
oura
geo
us
Atte
ntio
n to
Det
ail
Com
pass
ion
Depe
ndab
ility
Dutif
ulne
ss/In
tegr
ity
Ener
gy L
evel
Self-
Cont
rol
Inno
vatio
n
Lead
ersh
ip O
rient
atio
n
Perc
eptiv
enes
s/Dep
th
of T
houg
ht
Posit
ive S
elf-C
once
pt
Self-
Relia
nce
Socia
l Ast
uten
ess
Socia
l Orie
ntat
ion
Stre
ss T
oler
ance
Vigi
lance
Willi
ngne
ss to
Lea
rn
Mean 2.52 2.44 2.84 3.68 0.92 3.56 2.80 3.16 2.68 1.20 2.24 1.44 1.84 2.68 1.36 2.08 3.48 3.40 2.40 1. Aviation Boatswains Mate (ABE, ABF, ABH) SD 0.77 0.87 1.11 0.56 0.70 0.58 1.16 0.80 0.90 0.82 1.05 0.71 0.85 0.75 0.76 1.12 0.65 0.71 0.58
Mean 3.16 2.64 1.56 3.92 0.76 3.72 3.04 2.32 3.52 1.68 1.76 2.40 2.04 3.12 1.48 1.96 3.88 3.84 2.84 2. Air Traffic Controller (AC) SD 0.85 0.76 0.87 0.28 0.78 0.46 1.02 0.63 0.59 0.90 0.78 0.96 0.94 0.73 1.00 1.06 0.33 0.47 0.69
Mean 2.52 2.20 1.48 3.76 0.64 3.64 2.84 2.32 2.20 1.64 1.28 1.64 1.88 3.16 1.32 2.28 2.24 2.56 2.40 3. Aviation Machinist’s Mate (AD) SD 0.71 0.58 0.77 0.44 0.57 0.57 1.18 0.63 0.96 0.76 0.74 0.81 0.73 0.75 0.95 1.02 0.72 0.87 0.50
Mean 2.68 2.52 1.84 3.56 0.72 3.44 2.84 2.20 2.40 1.84 1.32 1.96 1.92 3.00 1.32 2.12 2.44 2.40 2.72 4. Aviation Electrician’s Mate (AE) SD 0.69 0.77 0.80 0.51 0.68 0.51 1.11 0.71 0.91 0.85 0.63 1.02 0.81 0.76 0.90 1.05 0.65 0.76 0.61
Mean 2.76 2.08 0.88 3.28 0.80 3.32 2.52 1.56 1.92 1.84 1.36 2.68 1.64 2.80 1.44 2.04 1.84 2.44 2.68 5. Aerographer’s Mate (AG) SD 0.72 0.81 0.53 0.61 0.65 0.63 1.12 0.58 0.86 0.75 0.70 0.90 0.95 0.82 0.71 1.02 0.62 0.87 0.63
Mean 3.28 3.08 3.44 2.96 1.80 3.44 2.88 3.36 3.00 1.92 2.12 1.72 2.52 3.40 1.96 2.60 3.52 2.92 2.96 6. Aircrew Program (AIRC, AIRR) SD 0.84 0.64 0.82 0.61 1.19 0.65 1.05 0.76 0.76 0.81 0.97 0.79 1.00 0.58 0.89 0.65 0.71 0.81 0.68
Mean 2.32 2.24 1.56 3.48 0.64 3.56 2.60 2.20 2.16 1.60 1.28 1.64 1.88 2.84 1.60 2.28 2.20 2.76 2.36 7. Aviation Structural Mechanic (AM, AME) SD 0.90 0.66 0.96 0.59 0.57 0.51 1.16 0.65 1.03 0.65 0.61 0.81 0.73 0.69 0.87 0.94 0.50 0.83 0.49
Mean 2.32 2.16 2.12 3.60 0.64 3.48 2.76 2.32 2.32 1.32 1.60 1.48 1.80 2.64 1.56 2.32 2.52 2.64 2.24 8. Aviation Ordnanceman (AO) SD 0.95 0.62 1.05 0.58 0.64 0.59 1.13 0.69 1.15 0.63 0.87 0.71 0.82 0.91 0.92 0.85 0.71 0.70 0.52
Mean 2.24 2.20 1.20 3.20 0.64 3.32 2.44 2.08 2.12 1.44 1.36 1.36 1.72 2.60 1.52 2.32 2.00 2.24 2.08 9. Aviation Support Equipment Technician (AS) SD 0.83 0.65 0.76 0.65 0.70 0.63 1.19 0.70 0.97 0.65 0.81 0.64 0.79 0.76 0.87 0.80 0.71 0.78 0.49
Mean 2.80 2.48 1.56 3.48 0.72 3.48 2.72 2.24 2.36 2.08 1.32 2.36 1.88 2.96 1.60 2.36 2.24 2.44 3.04 10. Aviation Electronics Technician (AT) SD 0.76 0.51 0.96 0.65 0.74 0.59 1.14 0.60 1.00 0.86 0.69 0.81 0.78 0.68 0.91 0.86 0.52 0.71 0.61

B-2
Means and SDs for 19 Personality Constructs for 79 Navy Jobs
Navy Job Achi
evem
ent
Adap
tabi
lity/F
lexib
ility
Adve
ntur
ous/C
oura
geo
us
Atte
ntio
n to
Det
ail
Com
pass
ion
Depe
ndab
ility
Dutif
ulne
ss/In
tegr
ity
Ener
gy L
evel
Self-
Cont
rol
Inno
vatio
n
Lead
ersh
ip O
rient
atio
n
Perc
eptiv
enes
s/Dep
th
of T
houg
ht
Posit
ive S
elf-C
once
pt
Self-
Relia
nce
Socia
l Ast
uten
ess
Socia
l Orie
ntat
ion
Stre
ss T
oler
ance
Vigi
lance
Willi
ngne
ss to
Lea
rn
Mean 2.60 2.56 2.40 3.32 0.72 3.40 2.80 2.00 2.48 1.60 1.60 2.00 1.92 2.60 1.52 1.84 2.92 2.84 2.48 11. Aviation Antisubmarine Warfare Operator (AW) SD 0.87 0.65 1.19 0.48 0.74 0.50 1.12 0.71 1.00 0.71 0.76 1.00 0.70 0.71 0.77 0.69 0.76 1.14 0.51
Mean 2.20 1.72 0.92 3.32 0.88 3.28 2.68 1.72 1.88 1.32 1.28 1.64 1.76 2.20 1.88 2.44 1.52 1.96 2.08 12. Aviation Maintenance Administration (AZ) SD 0.91 0.84 0.70 0.75 0.73 0.61 0.99 0.74 0.88 0.75 0.79 0.86 0.72 0.87 0.88 0.82 0.71 0.98 0.49
Mean 2.04 2.28 1.96 2.44 0.88 3.08 2.64 2.36 2.28 0.96 1.40 1.24 1.96 2.20 1.68 2.12 2.40 2.44 2.08 13. Boatswains Mate (BM) SD 0.79 0.68 0.94 0.92 0.53 0.64 1.00 0.91 1.02 0.54 0.87 0.72 0.74 0.82 0.63 0.73 0.91 1.08 0.81
Mean 2.32 2.16 1.24 3.12 0.56 3.20 2.52 2.60 1.84 1.80 1.16 1.52 1.76 2.72 1.16 2.00 1.84 1.72 2.16 14. Builder (BU) SD 0.80 0.80 0.78 0.78 0.58 0.71 1.16 0.76 0.90 0.87 0.55 0.82 0.72 0.79 0.55 0.76 0.75 0.89 0.55
Mean 2.36 2.28 1.84 3.20 0.60 3.20 2.52 2.56 1.96 1.68 1.16 1.76 1.76 2.72 1.32 2.28 2.12 2.00 2.32 15. Construction Electrician (CE) SD 0.64 0.68 0.94 0.71 0.58 0.71 1.12 0.82 0.94 0.69 0.55 0.93 0.88 0.68 0.85 0.74 0.53 1.00 0.48
Mean 2.20 2.16 1.28 3.04 0.56 3.16 2.52 2.36 1.84 1.76 1.24 1.72 1.68 2.40 1.36 2.24 2.00 1.84 2.24 16. Construction Mechanic (CM) SD 0.71 0.55 0.61 0.74 0.58 0.75 1.09 0.81 0.94 0.66 0.52 0.94 0.75 0.82 0.81 0.72 0.76 0.90 0.44
Mean 2.64 2.36 1.20 3.44 0.88 3.48 3.28 1.84 2.40 1.88 1.80 2.40 1.80 2.84 1.72 2.08 1.92 2.08 2.80 17. Crytologic Technician, Administrative (CTA) SD 0.86 0.76 0.82 0.58 0.78 0.65 0.89 0.55 1.04 0.83 0.96 0.96 0.76 0.75 0.89 0.81 0.76 0.95 0.71
Mean 3.32 3.08 1.68 3.72 0.84 3.56 3.72 1.88 2.68 2.20 1.48 3.40 1.96 3.08 2.16 2.24 2.32 2.36 3.72 18. Crytologic Technician, Interpretive (CTI) SD 0.63 0.81 0.85 0.46 0.69 0.58 0.54 0.60 0.90 0.87 0.87 0.65 0.89 0.81 0.94 0.83 0.99 1.00 0.46
Mean 2.60 2.32 1.36 3.48 0.56 3.36 3.28 1.88 2.20 2.04 1.28 2.36 1.72 2.76 1.24 1.72 1.84 2.16 3.04 19. Crytologic Technician, Maintenance (CTM) SD 0.82 0.48 0.70 0.59 0.58 0.70 0.89 0.53 0.96 0.74 0.74 0.64 0.84 0.78 0.72 0.61 0.75 0.80 0.68
Mean 2.68 2.44 1.40 3.56 0.64 3.48 3.40 1.80 2.32 2.16 1.20 2.60 1.76 2.76 1.64 2.28 2.08 2.44 2.92 20. Crytologic Technician, Communications (CTO) SD 0.75 0.65 0.87 0.58 0.64 0.65 0.87 0.58 0.99 0.80 0.76 0.76 0.72 0.72 0.95 1.02 0.95 0.92 0.64

B-3
Means and SDs for 19 Personality Constructs for 79 Navy Jobs
Navy Job Achi
evem
ent
Adap
tabi
lity/F
lexib
ility
Adve
ntur
ous/C
oura
geo
us
Atte
ntio
n to
Det
ail
Com
pass
ion
Depe
ndab
ility
Dutif
ulne
ss/In
tegr
ity
Ener
gy L
evel
Self-
Cont
rol
Inno
vatio
n
Lead
ersh
ip O
rient
atio
n
Perc
eptiv
enes
s/Dep
th
of T
houg
ht
Posit
ive S
elf-C
once
pt
Self-
Relia
nce
Socia
l Ast
uten
ess
Socia
l Orie
ntat
ion
Stre
ss T
oler
ance
Vigi
lance
Willi
ngne
ss to
Lea
rn
Mean 3.00 2.92 1.64 3.68 0.76 3.56 3.48 1.80 2.60 2.12 1.28 3.00 2.00 2.72 1.64 2.40 2.32 2.72 3.28 21. Crytologic Technician, Collection (CTR) SD 0.58 0.70 1.04 0.48 0.72 0.58 0.71 0.58 0.76 0.78 0.68 0.91 0.76 0.84 0.95 0.87 0.75 0.98 0.61
Mean 3.20 2.80 1.60 3.76 0.68 3.72 3.60 1.88 2.68 2.00 1.40 3.04 1.96 2.92 1.44 1.88 2.48 3.20 3.24 22. Crytologic Technician, Technical (CTT) SD 0.65 0.50 0.87 0.44 0.69 0.54 0.58 0.60 0.95 0.71 0.71 0.74 0.68 0.86 0.71 0.73 0.65 0.96 0.52
Mean 2.84 2.88 2.84 3.12 1.60 3.40 2.92 3.12 2.76 2.08 2.88 1.96 2.28 3.00 2.28 3.12 3.36 2.76 2.72 23. Damage Controlman (DC) SD 0.94 0.60 1.07 0.53 1.00 0.71 1.12 0.78 0.78 0.86 0.78 0.79 0.94 0.71 0.84 0.78 0.76 0.72 0.61
Mean 1.88 1.64 0.84 3.48 1.44 3.32 3.36 1.44 2.00 1.00 0.84 1.24 1.60 2.24 1.92 2.68 1.52 1.28 1.84 24. Disbursing Clerk (DK) SD 0.60 0.70 0.55 0.59 0.82 0.63 0.81 0.65 1.12 0.58 0.69 0.78 0.87 0.88 0.81 1.03 0.71 0.89 0.55
Mean 3.12 3.04 3.64 2.68 0.92 3.20 2.80 3.52 2.64 1.92 1.72 1.68 2.48 3.40 1.36 1.68 3.28 2.72 2.64 25. Diver SD 0.78 0.79 0.57 0.63 0.81 0.76 1.04 0.59 0.95 1.00 1.02 0.80 1.05 0.65 0.57 0.69 0.79 0.89 0.64
Mean 2.64 1.84 0.76 3.40 0.64 2.96 2.64 1.52 1.92 2.84 0.88 2.28 1.80 2.68 1.16 1.60 1.40 1.00 2.48 26. Draftsman (DM) SD 0.91 0.62 0.52 0.58 0.70 0.79 1.22 0.51 1.04 0.94 0.67 0.79 0.65 0.75 0.69 0.91 0.71 0.71 0.65
Mean 2.40 1.88 0.84 3.08 2.84 3.20 2.68 1.68 2.12 1.60 1.12 1.44 1.88 2.40 2.56 3.16 1.80 1.52 2.40 27. Dental Technician (DT) SD 0.58 0.60 0.75 0.64 0.94 0.71 1.07 0.75 1.05 0.76 0.73 0.58 0.78 0.82 0.82 0.94 0.82 1.00 0.58
Mean 2.36 2.32 0.96 3.32 0.64 3.16 2.48 1.76 1.84 1.96 1.12 2.04 1.76 2.48 1.20 1.64 1.80 1.64 2.40 28. Engineering Aide (EA) SD 0.70 0.75 0.61 0.69 0.57 0.80 1.16 0.72 0.90 0.74 0.83 0.89 0.66 0.77 0.58 0.70 0.87 0.91 0.58
Mean 2.28 2.24 1.32 3.20 0.60 3.28 2.52 1.84 2.00 1.72 0.96 1.84 1.80 2.60 1.20 1.76 1.84 1.96 2.60 29. Electrician’s Mate (EM) SD 0.68 0.88 0.80 0.65 0.58 0.68 1.16 0.75 1.12 0.79 0.74 0.80 0.76 0.91 0.50 0.72 0.80 0.94 0.82
Mean 2.80 2.48 1.96 3.24 0.60 3.48 2.96 2.04 2.40 1.58 1.17 2.13 2.00 2.63 1.38 1.87 2.63 2.42 2.83 30. Electrician’s Mate, Nuclear (EM-NUC) SD 0.82 0.77 0.98 0.66 0.58 0.51 0.94 0.84 1.00 0.78 0.70 0.80 0.78 0.92 0.65 0.74 0.65 0.93 0.70

B-4
Means and SDs for 19 Personality Constructs for 79 Navy Jobs
Navy Job Achi
evem
ent
Adap
tabi
lity/F
lexib
ility
Adve
ntur
ous/C
oura
geo
us
Atte
ntio
n to
Det
ail
Com
pass
ion
Depe
ndab
ility
Dutif
ulne
ss/In
tegr
ity
Ener
gy L
evel
Self-
Cont
rol
Inno
vatio
n
Lead
ersh
ip O
rient
atio
n
Perc
eptiv
enes
s/Dep
th
of T
houg
ht
Posit
ive S
elf-C
once
pt
Self-
Relia
nce
Socia
l Ast
uten
ess
Socia
l Orie
ntat
ion
Stre
ss T
oler
ance
Vigi
lance
Willi
ngne
ss to
Lea
rn
Mean 2.28 2.16 1.48 2.84 0.52 3.20 2.44 2.20 2.00 1.40 1.08 1.60 1.84 2.80 1.28 2.00 2.28 2.12 2.24 31. Engineman (EN, EN-ATF) SD 0.79 0.75 0.82 0.75 0.65 0.71 1.19 0.76 1.08 0.58 0.70 0.71 0.80 0.71 0.68 0.91 0.84 0.83 0.44
Mean 1.92 1.96 1.60 2.68 0.72 3.04 2.52 2.36 2.16 1.28 0.96 1.16 1.80 2.32 1.20 1.92 1.96 1.80 1.88 32. Equipment Operator (EO) SD 0.81 0.68 0.91 0.95 0.68 0.94 1.16 0.81 0.99 0.74 0.61 0.69 0.82 0.99 0.65 0.95 0.79 0.96 0.53
Mean 3.28 3.32 3.72 3.68 1.12 3.48 2.80 3.20 3.20 2.76 2.12 2.40 2.64 3.36 1.60 2.24 3.84 2.96 3.12 33. Explosive Ordnance Disposal Challenge (EOD) SD 0.84 0.75 0.54 0.48 0.83 0.65 1.12 0.76 0.96 0.88 1.01 0.96 0.95 0.70 0.82 0.97 0.55 0.98 0.83
Mean 3.08 2.54 1.83 3.33 0.58 3.38 2.67 2.00 2.37 2.04 1.46 2.42 2.00 2.65 1.13 1.52 2.30 2.13 3.09 34. Electronics Technician (ET, ET-ATF) SD 0.88 0.72 1.01 0.48 0.58 0.71 1.20 0.78 0.88 0.91 0.78 0.65 0.72 0.78 0.63 0.67 0.82 0.76 0.67
Mean 3.43 2.74 2.39 3.43 0.57 3.48 3.00 2.13 2.78 2.13 1.48 2.65 2.09 2.78 1.35 1.83 2.91 2.48 3.35 35. Electronics Technician, Nuclear (ET-NUC) SD 0.84 0.69 1.12 0.51 0.51 0.67 1.13 0.87 0.74 0.92 0.79 0.65 0.85 0.67 0.65 0.65 0.60 0.73 0.71
Mean 3.48 2.78 2.61 3.39 0.74 3.48 2.96 2.13 2.78 2.17 1.52 2.57 2.13 2.83 1.57 2.00 2.96 2.43 3.30 36. Electronics Technician, Sub (ET-SS) SD 0.73 0.74 1.08 0.50 0.62 0.67 1.22 0.87 0.80 0.94 0.79 0.73 0.87 0.65 0.73 0.74 0.56 0.73 0.70
Mean 3.00 2.67 2.67 3.29 0.67 3.54 2.96 2.17 2.67 1.79 1.58 2.13 2.13 2.74 1.48 1.91 2.96 2.61 2.83 37. Fire Controlman (FC) SD 0.83 0.76 1.01 0.55 0.64 0.51 1.12 0.76 1.01 0.78 0.83 0.80 0.74 0.69 0.59 0.60 0.83 0.72 0.78
Mean 3.09 2.82 3.00 3.27 0.82 3.55 3.00 2.27 2.73 1.82 1.59 2.14 2.23 2.77 1.73 2.23 3.14 2.45 2.82 38. Fire Control Technician, Sub (FT-SS) SD 0.92 0.73 1.16 0.55 0.73 0.51 1.07 0.77 0.99 0.80 0.73 0.83 0.75 0.69 0.70 0.69 0.89 0.74 0.80
Mean 2.60 2.60 2.64 3.16 0.64 3.40 3.24 2.24 2.68 1.36 1.72 1.64 2.04 2.60 1.32 2.00 3.04 2.32 2.40 39. Gunner’s Mate (GM) SD 0.71 0.82 1.00 0.62 0.64 0.76 0.93 0.78 1.03 0.76 0.94 0.81 0.79 0.76 0.63 0.71 0.79 0.85 0.50
Mean 2.44 2.32 1.68 3.12 0.56 3.16 2.48 2.16 2.12 1.60 1.20 2.00 1.72 2.72 1.16 1.80 2.36 2.21 2.54 40. Gas Turbine Systems Technician, Electrical (GSE) SD 0.65 0.69 0.90 0.67 0.51 0.69 1.12 0.75 1.01 0.65 0.82 0.76 0.79 0.68 0.62 0.71 0.81 0.72 0.51

B-5
Means and SDs for 19 Personality Constructs for 79 Navy Jobs
Navy Job Achi
evem
ent
Adap
tabi
lity/F
lexib
ility
Adve
ntur
ous/C
oura
geo
us
Atte
ntio
n to
Det
ail
Com
pass
ion
Depe
ndab
ility
Dutif
ulne
ss/In
tegr
ity
Ener
gy L
evel
Self-
Cont
rol
Inno
vatio
n
Lead
ersh
ip O
rient
atio
n
Perc
eptiv
enes
s/Dep
th
of T
houg
ht
Posit
ive S
elf-C
once
pt
Self-
Relia
nce
Socia
l Ast
uten
ess
Socia
l Orie
ntat
ion
Stre
ss T
oler
ance
Vigi
lance
Willi
ngne
ss to
Lea
rn
Mean 2.44 2.28 1.68 3.04 0.56 3.20 2.44 2.24 2.12 1.56 1.20 1.96 1.76 2.72 1.12 1.76 2.36 2.25 2.54 41. Gas Turbine Systems Technician, Mechanical (GSM) SD 0.65 0.68 0.90 0.68 0.51 0.71 1.19 0.78 1.01 0.65 0.82 0.74 0.78 0.68 0.60 0.72 0.81 0.74 0.51
Mean 2.88 2.72 1.92 3.28 3.68 3.60 3.16 2.76 2.84 2.00 1.84 2.44 2.40 3.00 3.32 3.56 2.88 2.32 3.16 42. Hospital Corpsman (HM) SD 0.67 0.68 0.70 0.54 0.56 0.58 0.75 0.72 0.80 0.91 0.94 0.92 0.71 0.71 0.69 0.87 0.67 0.85 0.62
Mean 2.20 2.20 1.80 2.92 0.56 3.24 2.48 2.36 2.00 1.56 1.04 1.36 1.72 2.84 1.16 1.64 2.00 1.92 2.08 43. Hull Maintenance Technician (HT, HT-ATF) SD 0.65 0.41 0.76 0.70 0.51 0.72 1.16 0.81 1.04 0.71 0.68 0.49 0.79 0.69 0.69 0.91 0.71 0.81 0.49
Mean 2.36 2.00 1.36 2.96 0.68 3.12 2.52 1.84 1.96 1.84 1.28 1.96 1.72 2.72 1.52 2.24 1.76 1.88 2.52 44. Interior Communications Electrician (IC, IC-ATF) SD 0.76 0.50 0.70 0.74 0.56 0.88 1.26 0.69 1.06 0.69 0.74 0.74 0.74 0.74 0.71 1.01 0.60 0.83 0.71
Mean 3.24 2.60 1.76 3.76 0.80 3.44 3.56 1.96 2.52 2.64 1.76 3.68 2.12 3.16 2.24 2.24 2.36 2.80 3.24 45. Intelligence Specialist (IS) SD 0.78 0.65 0.78 0.44 0.65 0.58 0.65 0.61 0.87 0.86 0.93 0.48 0.78 0.75 1.05 0.97 0.64 0.76 0.66
Mean 2.56 2.28 1.08 3.40 0.68 3.24 2.68 1.76 2.00 2.24 1.36 2.44 1.84 2.60 1.56 2.20 1.92 1.76 2.80 46. Information Technology Specialist (IT) SD 0.65 0.74 0.81 0.58 0.63 0.66 1.22 0.60 1.12 0.97 0.86 0.82 0.80 0.76 0.87 0.96 0.76 0.83 0.71
Mean 2.76 2.68 1.40 3.12 2.12 3.04 3.00 2.12 2.52 2.52 1.48 3.20 2.28 3.20 2.92 3.08 2.20 1.44 2.80 47. Journalist (JO) SD 0.60 0.69 0.71 0.73 0.73 0.79 0.96 0.83 1.09 0.82 0.77 0.71 0.94 0.76 0.81 1.04 0.87 1.04 0.65
Mean 2.20 1.80 0.92 3.28 0.60 2.92 2.32 1.80 1.72 2.20 0.84 1.40 1.60 2.68 1.28 1.80 1.52 1.32 2.00 48. Lithographer (LI) SD 0.76 0.65 0.70 0.46 0.58 0.86 1.31 0.82 0.89 1.04 0.55 0.76 0.76 0.90 0.68 0.91 0.82 0.90 0.50
Mean 2.80 2.28 0.76 3.48 2.36 3.36 3.36 1.64 2.24 1.52 1.68 2.76 1.76 2.68 2.44 2.84 2.16 1.36 2.96 49. Legalman (LN) SD 0.76 0.74 0.52 0.65 0.49 0.49 0.70 0.64 0.97 0.65 0.90 0.72 0.52 0.80 0.77 0.62 0.80 0.81 0.68
Mean 2.40 2.64 2.68 2.72 1.96 3.36 3.60 2.52 3.12 1.48 2.76 2.00 2.44 3.08 2.64 2.96 3.08 2.96 2.24 50. Master at Arms (MA) SD 0.71 0.76 0.85 0.79 0.89 0.81 0.71 0.59 0.73 0.65 0.97 0.82 0.71 0.64 0.91 0.89 0.70 0.79 0.52

B-6
Means and SDs for 19 Personality Constructs for 79 Navy Jobs
Navy Job Achi
evem
ent
Adap
tabi
lity/F
lexib
ility
Adve
ntur
ous/C
oura
geo
us
Atte
ntio
n to
Det
ail
Com
pass
ion
Depe
ndab
ility
Dutif
ulne
ss/In
tegr
ity
Ener
gy L
evel
Self-
Cont
rol
Inno
vatio
n
Lead
ersh
ip O
rient
atio
n
Perc
eptiv
enes
s/Dep
th
of T
houg
ht
Posit
ive S
elf-C
once
pt
Self-
Relia
nce
Socia
l Ast
uten
ess
Socia
l Orie
ntat
ion
Stre
ss T
oler
ance
Vigi
lance
Willi
ngne
ss to
Lea
rn
Mean 2.24 2.00 1.76 2.72 0.68 3.08 2.48 2.48 1.96 1.48 1.00 1.52 1.76 2.68 1.20 2.00 2.20 2.04 2.32 51. Machinist’s Mate (MM, MM-ATF) SD 0.72 0.65 0.66 0.68 0.56 0.70 1.12 1.00 0.98 0.71 0.65 0.71 0.78 0.75 0.65 1.00 0.76 0.94 0.75
Mean 2.63 2.21 2.08 2.88 0.71 3.33 2.83 2.54 2.29 1.58 1.08 1.75 1.92 2.79 1.25 2.08 2.46 2.33 2.71 52. Machinist’s Mate, Nuclear (MM-NUC) SD 0.88 0.66 0.83 0.61 0.55 0.56 1.05 0.98 1.04 0.78 0.65 0.74 0.72 0.59 0.68 0.93 0.83 0.82 0.75
Mean 2.56 2.20 2.24 3.08 0.72 3.40 2.84 2.52 2.32 1.52 1.12 1.68 1.96 2.76 1.48 2.24 2.56 2.44 2.56 53. Machinist’s Mate, Submarines MM(SS) SD 0.77 0.65 1.01 0.64 0.68 0.58 1.11 1.00 1.03 0.71 0.78 0.85 0.68 0.66 0.71 0.88 0.82 0.96 0.58
Mean 2.44 2.60 3.08 3.76 0.76 3.44 2.80 2.32 2.84 1.76 1.28 2.08 2.12 2.84 1.44 2.12 3.12 2.88 2.52 54. Mineman (MN) SD 0.71 0.71 0.95 0.44 0.72 0.58 1.08 0.90 1.07 0.78 0.74 0.81 0.78 0.75 0.82 1.01 0.93 1.13 0.51
Mean 2.20 1.88 1.48 3.16 0.72 3.20 2.44 2.24 1.88 1.72 1.04 1.64 1.68 2.40 1.28 2.00 1.76 1.92 2.12 55. Machinery Repairman (MR) SD 0.65 0.60 1.00 0.62 0.54 0.87 1.16 0.83 0.93 0.74 0.68 0.91 0.75 0.96 0.68 0.87 0.72 0.91 0.44
Mean 2.04 1.88 0.88 2.96 1.80 3.00 2.64 1.92 1.92 2.12 1.36 1.44 1.88 2.24 2.24 2.96 1.72 1.08 1.80 56. Mess Management Specialist, Surface (MS) SD 0.89 0.78 0.67 0.74 1.08 0.76 1.19 0.76 1.00 1.01 0.95 0.77 0.73 0.97 0.97 0.94 0.68 0.95 0.58
Mean 2.36 2.16 1.64 3.04 1.80 3.08 2.76 1.92 1.96 2.20 1.52 1.48 2.00 2.32 2.44 3.04 2.08 1.16 1.88 57. Mess Management Specialist, Submarines MS(SS) SD 0.70 0.80 1.08 0.68 1.08 0.81 1.05 0.70 0.98 1.00 1.00 0.71 0.82 0.95 0.92 0.79 0.91 0.99 0.60
Mean 2.92 2.36 2.56 3.56 0.72 3.40 3.04 2.16 2.76 1.48 1.32 2.32 2.04 2.60 1.60 2.24 2.72 2.64 2.76 58. Missile Technician (MT) SD 0.76 0.91 1.00 0.58 0.74 0.58 1.06 0.85 1.05 0.71 0.80 0.90 0.84 1.00 0.71 0.88 0.79 1.00 0.72
Mean 2.72 2.48 0.80 2.64 3.24 2.96 3.32 1.72 2.60 1.80 2.24 3.08 2.44 2.80 3.64 3.64 1.96 1.20 2.60 59. Navy Counselor (NC) SD 0.68 0.82 0.76 0.81 0.60 0.74 0.80 0.89 0.96 0.87 0.93 0.57 0.87 0.82 0.64 0.70 0.94 0.87 0.76
Mean 2.88 2.44 1.72 3.52 0.92 3.36 3.04 2.12 2.56 1.56 1.96 2.68 2.00 2.76 1.80 2.40 2.64 3.00 2.52 60. Operations Specialist (OS) SD 0.83 0.65 0.74 0.59 0.76 0.49 1.02 0.83 0.96 0.71 1.06 1.07 0.76 0.78 0.91 0.91 0.81 0.96 0.71

B-7
Means and SDs for 19 Personality Constructs for 79 Navy Jobs
Navy Job Achi
evem
ent
Adap
tabi
lity/F
lexib
ility
Adve
ntur
ous/C
oura
geo
us
Atte
ntio
n to
Det
ail
Com
pass
ion
Depe
ndab
ility
Dutif
ulne
ss/In
tegr
ity
Ener
gy L
evel
Self-
Cont
rol
Inno
vatio
n
Lead
ersh
ip O
rient
atio
n
Perc
eptiv
enes
s/Dep
th
of T
houg
ht
Posit
ive S
elf-C
once
pt
Self-
Relia
nce
Socia
l Ast
uten
ess
Socia
l Orie
ntat
ion
Stre
ss T
oler
ance
Vigi
lance
Willi
ngne
ss to
Lea
rn
Mean 1.80 1.68 0.72 3.08 1.32 3.24 3.00 1.84 1.96 0.80 0.88 0.92 1.52 2.12 1.80 2.68 1.52 1.08 1.56 61. Postal Clerk (PC) SD 0.76 0.85 0.68 0.64 0.90 0.66 0.91 0.55 1.02 0.71 0.60 0.70 0.71 0.97 0.71 0.90 0.71 0.76 0.51
Mean 2.32 2.68 1.84 2.80 1.56 2.84 2.60 2.04 2.00 2.40 1.24 2.08 2.00 3.08 2.04 2.68 2.12 1.44 2.20 62. Photographer’s Mate (PH) SD 0.85 0.69 1.07 0.71 0.92 0.80 1.16 0.89 0.96 1.00 0.78 0.91 0.65 0.81 0.68 0.85 0.97 0.92 0.65
Mean 2.20 2.08 0.68 2.88 3.12 3.08 3.00 1.56 2.36 1.28 1.56 2.20 2.28 2.52 2.84 3.24 1.80 1.12 2.16 63. Personnelman (PN) SD 0.76 0.76 0.56 0.88 0.93 0.76 0.87 0.87 1.00 0.68 0.96 0.87 0.79 0.65 1.03 1.01 0.76 0.83 0.55
Mean 2.20 2.08 1.84 3.80 1.28 3.64 3.00 2.04 2.16 1.28 0.96 1.36 1.92 2.48 1.68 2.12 2.08 2.32 1.96 64. Aircrew Survival Equipmentman (PR) SD 0.82 0.81 0.99 0.41 0.98 0.57 1.08 0.74 1.07 0.74 0.61 0.70 0.70 0.87 0.90 0.93 0.81 1.22 0.61
Mean 2.36 2.40 1.52 3.16 1.04 3.44 2.96 2.04 2.52 1.52 1.64 1.92 2.04 2.48 1.68 2.24 2.28 2.68 2.36 65. Quartermaster (QM) SD 0.81 0.82 0.77 0.75 1.02 0.65 1.10 0.68 0.92 0.87 1.00 1.04 0.74 0.77 0.75 0.93 0.84 0.90 0.64
Mean 2.16 2.52 1.00 2.76 3.08 3.20 3.60 1.92 2.72 1.60 1.76 2.08 2.24 2.76 3.00 3.32 1.80 1.20 2.16 66. Religious Program Specialist (RP) SD 0.90 0.77 0.87 0.93 0.95 0.76 0.76 0.81 0.89 0.91 1.01 0.86 0.83 0.66 0.76 0.75 0.76 0.87 0.69
Mean 3.84 3.64 4.00 3.04 1.08 3.56 3.40 3.92 3.40 2.60 2.88 2.20 3.36 3.64 2.12 2.28 3.96 3.20 3.44 67. SEAL SD 0.37 0.57 0.00 0.74 1.00 0.65 0.96 0.28 0.58 0.91 1.01 0.87 0.86 0.64 0.93 0.94 0.20 0.87 0.71
Mean 1.92 1.88 1.00 3.00 1.84 3.04 2.84 2.08 2.16 1.28 1.20 1.12 1.88 2.32 2.36 3.28 1.60 1.16 1.88 68. Ship’s Serviceman (SH) SD 0.91 0.93 0.65 0.76 1.03 0.61 0.94 0.86 1.03 0.79 0.82 0.60 0.78 1.03 0.86 0.74 0.65 0.90 0.60
Mean 2.04 1.96 0.96 3.36 1.12 3.12 2.76 1.68 2.04 1.20 1.32 1.36 1.64 2.64 1.76 2.56 1.88 1.12 1.76 69. Storekeeper, Surface (SK) SD 0.84 0.79 0.74 0.76 1.01 0.60 1.13 0.75 1.02 0.76 0.85 0.70 0.76 0.86 0.88 1.00 0.83 0.83 0.66
Mean 2.20 2.12 1.68 3.44 1.08 3.16 2.84 1.88 2.20 1.32 1.36 1.56 1.76 2.76 1.76 2.72 2.20 1.28 1.88 70. Storekeeper, Submarines SK(SS) SD 0.82 0.83 0.99 0.65 1.00 0.55 1.18 0.88 1.04 0.85 0.95 0.77 0.72 0.78 0.97 0.94 0.87 0.79 0.73
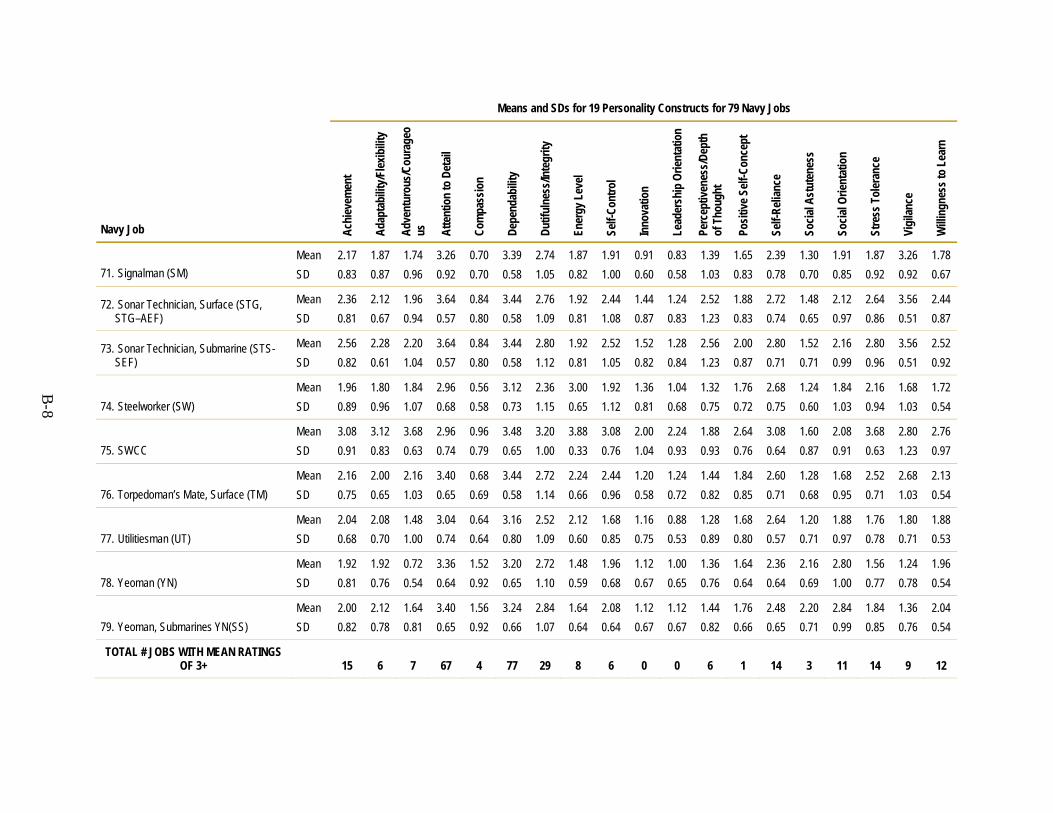
B-8
Means and SDs for 19 Personality Constructs for 79 Navy Jobs
Navy Job Achi
evem
ent
Adap
tabi
lity/F
lexib
ility
Adve
ntur
ous/C
oura
geo
us
Atte
ntio
n to
Det
ail
Com
pass
ion
Depe
ndab
ility
Dutif
ulne
ss/In
tegr
ity
Ener
gy L
evel
Self-
Cont
rol
Inno
vatio
n
Lead
ersh
ip O
rient
atio
n
Perc
eptiv
enes
s/Dep
th
of T
houg
ht
Posit
ive S
elf-C
once
pt
Self-
Relia
nce
Socia
l Ast
uten
ess
Socia
l Orie
ntat
ion
Stre
ss T
oler
ance
Vigi
lance
Willi
ngne
ss to
Lea
rn
Mean 2.17 1.87 1.74 3.26 0.70 3.39 2.74 1.87 1.91 0.91 0.83 1.39 1.65 2.39 1.30 1.91 1.87 3.26 1.78 71. Signalman (SM) SD 0.83 0.87 0.96 0.92 0.70 0.58 1.05 0.82 1.00 0.60 0.58 1.03 0.83 0.78 0.70 0.85 0.92 0.92 0.67
Mean 2.36 2.12 1.96 3.64 0.84 3.44 2.76 1.92 2.44 1.44 1.24 2.52 1.88 2.72 1.48 2.12 2.64 3.56 2.44 72. Sonar Technician, Surface (STG, STG–AEF) SD 0.81 0.67 0.94 0.57 0.80 0.58 1.09 0.81 1.08 0.87 0.83 1.23 0.83 0.74 0.65 0.97 0.86 0.51 0.87
Mean 2.56 2.28 2.20 3.64 0.84 3.44 2.80 1.92 2.52 1.52 1.28 2.56 2.00 2.80 1.52 2.16 2.80 3.56 2.52 73. Sonar Technician, Submarine (STS-SEF) SD 0.82 0.61 1.04 0.57 0.80 0.58 1.12 0.81 1.05 0.82 0.84 1.23 0.87 0.71 0.71 0.99 0.96 0.51 0.92
Mean 1.96 1.80 1.84 2.96 0.56 3.12 2.36 3.00 1.92 1.36 1.04 1.32 1.76 2.68 1.24 1.84 2.16 1.68 1.72 74. Steelworker (SW) SD 0.89 0.96 1.07 0.68 0.58 0.73 1.15 0.65 1.12 0.81 0.68 0.75 0.72 0.75 0.60 1.03 0.94 1.03 0.54
Mean 3.08 3.12 3.68 2.96 0.96 3.48 3.20 3.88 3.08 2.00 2.24 1.88 2.64 3.08 1.60 2.08 3.68 2.80 2.76 75. SWCC SD 0.91 0.83 0.63 0.74 0.79 0.65 1.00 0.33 0.76 1.04 0.93 0.93 0.76 0.64 0.87 0.91 0.63 1.23 0.97
Mean 2.16 2.00 2.16 3.40 0.68 3.44 2.72 2.24 2.44 1.20 1.24 1.44 1.84 2.60 1.28 1.68 2.52 2.68 2.13 76. Torpedoman’s Mate, Surface (TM) SD 0.75 0.65 1.03 0.65 0.69 0.58 1.14 0.66 0.96 0.58 0.72 0.82 0.85 0.71 0.68 0.95 0.71 1.03 0.54
Mean 2.04 2.08 1.48 3.04 0.64 3.16 2.52 2.12 1.68 1.16 0.88 1.28 1.68 2.64 1.20 1.88 1.76 1.80 1.88 77. Utilitiesman (UT) SD 0.68 0.70 1.00 0.74 0.64 0.80 1.09 0.60 0.85 0.75 0.53 0.89 0.80 0.57 0.71 0.97 0.78 0.71 0.53
Mean 1.92 1.92 0.72 3.36 1.52 3.20 2.72 1.48 1.96 1.12 1.00 1.36 1.64 2.36 2.16 2.80 1.56 1.24 1.96 78. Yeoman (YN) SD 0.81 0.76 0.54 0.64 0.92 0.65 1.10 0.59 0.68 0.67 0.65 0.76 0.64 0.64 0.69 1.00 0.77 0.78 0.54
Mean 2.00 2.12 1.64 3.40 1.56 3.24 2.84 1.64 2.08 1.12 1.12 1.44 1.76 2.48 2.20 2.84 1.84 1.36 2.04 79. Yeoman, Submarines YN(SS) SD 0.82 0.78 0.81 0.65 0.92 0.66 1.07 0.64 0.64 0.67 0.67 0.82 0.66 0.65 0.71 0.99 0.85 0.76 0.54
TOTAL # JOBS WITH MEAN RATINGS OF 3+ 15 6 7 67 4 77 29 8 6 0 0 6 1 14 3 11 14 9 12

C-0
Appendix C: Background and Instructions for ENCAPS Item Writers


C-1
ENCAPS Background for Item Writers
• ENCAPS will be used for selection and classification of cadets in the US Navy. • Currently, ENCAPS has items to measure three constructs: Stress Tolerance (81
items), Social Orientation (121 items), and Achievement (78 items).
• ENCAPS is a forced-choice, computer adaptive test. A description, adapted from TR449, follows:
ENCAPS presents pairs of items from the same construct, while alternating constructs from one pair of items to the next. The instructions for respondents are to read each pair of statements carefully “and decide which of the two statements more accurately describes you. Pick the statement that more accurately describes you as you generally are now, not as you wish to be in the future.” Respondents then click on one of the items in each pair presented.
The ENCAPS program uses an algorithm (similar to that used for CARS) to select pairs of items that maximize item information. As respondents choose one of the pair presented, the program uses that information (the trait level value) to determine the next pair to present, a pair that will again maximize item information. The process continues until a stable trait level estimate for the respondent is reached, or until 25 item pairs have been presented. [There is a 25 item pair maximum per construct.]

C-2
Instructions for ENCAPS Item Writers
1. Project Number. Bill your time to 14590.
2. Item Template. There is an item writing template in the resource: M:\Data\14590\Item Writing\Item Writing Template. For each item you write, include the following information: Item ID number, Item, Construct, Facet, and Target Trait Level.
3. File Names. Include the construct abbreviation, your initials, and the version number. Example: DEP MC V1.doc. Update the version number any time there are significant changes to the file.
4. Submitting Items. Place your items in M:\Data\14590\Item Writing\Draft Items. (If you are in Tampa, you may not have access to the resource and can just e-mail your items to Kerri as you finish them.) When you have a set of items ready for review, please e-mail your file to Kerri ([email protected]). (Refer to the schedule for assignments and deadlines.)
5. General Item Formatting. Phrase items as statements (rather than questions). Use the first person for all items. Example: I like to set challenging goals for myself.
General belief-type items are fine, but must also be phrased in the first person. (This is important because items are randomly paired and the respondent indicates which is more true of him or her. For example, we revised the item “Life is too short to worry so much about getting ahead.” It’s awkward to pair that with something like “I set very difficult goals for myself,” then ask the respondent which statement is more true of him or her. The former item became, “I don’t worry much about getting ahead because life is just too short.”)
6. Reading Level. We don’t have a specific target reading level, but the existing ENCAPS items are at about a 5th or 6th grade level, on average. Avoid unnecessary cognitive load, e.g., by using unusual words or complicated phrasing.
7. Sample Tests. You will be given sample scales from other tests, related to the construct(s) for which you write items. Use these sample scales as models only – don’t plagiarize.
8. Trait Level Defined. The trait level of an item refers to the degree to which an individual possesses the trait in question, if the individual agrees that the item is true of him or her. Use the following rating scale to indicate the Target Trait Level of each of your items:

C-3
A person who agrees with this statement has a(n) _____ level of [the target trait]. 1 Extremely low 2 Low 3 Slightly low 4 Moderate 5 Slightly high 6 High 7 Extremely high
9. Item Examples. The following examples are actual ENCAPS items for two of the Achievement facets. (Note: The trait levels in these examples are not target trait levels, but are actual trait levels based on the average rating across a group of SMEs.) [Examples omitted for technical report.]
10. Desired Trait Level Distribution. Ideally, we would have a near-uniform distribution of trait levels for each facet, and for each trait. Our objective is to write items targeted at all points along the trait continuum. If you were writing a total of 40 items for a construct, then, you would try to write about 5 or 6 items at each point along the 7-point scale. (Some parts of the scale will be easier to target than others.)
11. Constructs and Facets. It is more important to aim for a near-uniform distribution of trait levels by Construct than by Facet. Some Facets won’t lend themselves easily to items at all levels along the trait continuum. The Facets are nothing more than a rough breakdown of the definition into its parts; they will not be used to define subscales. Rather, the facets are intended to serve as a guide for item writing and for summarizing how well the full continuum of trait level is covered by the item set. Item writers are free to suggest a different breakdown of facets, but should confer with other item writers working on the same construct. We can make changes to the facets, as long as everyone working on that construct is using the same system.
12. Repeated Phrases. It is acceptable to repeat words or phrases across your items, in order to obtain various trait levels. For example, one item can be “It’s not all that important that people like me,” and another, “It is very important that people like me.”
13. Social Desirability. Try to write low and moderate trait level items that might not be totally transparent and fakable in terms of social desirability. (This is always difficult – it’s more of an ideal than an objective.)
14. Trait Level Ratings. After we have written all of our items, a group of SMEs (which will include as many of the item writers as are willing to participate) will be asked to rate all of the items according to trait level.


D-0
Appendix D: ENCAPS Personality Taxonomy: Similarities Across Facets
(Item Reviewer’s Tool)


D-1
ENCAPS Personality Taxonomy: Similarities Across Facets
Item Reviewer’s Tool
ADL: Attention to Detail, DEP: Dependability
Similar Facets High Scorers [Definition with Notes] Low Scorers [Definition with Notes]
ADL1 Are exacting, precise, and accurate; are meticulous and thorough in their approach to tasks Pertains to methods used to do tasks, e.g. • checking off things as they are done • attending to every detail • working carefully • reviewing work before turning it in NOT: preparation for tasks (DEP1)
Are sloppy and imprecise; make careless errors Make careless errors due to not being meticulous and thorough in the methods used to do tasks, e.g., • working too quickly / not carefully • not keeping track of what has already been done /
what has yet to be done • failing to check work before turning it in NOT: sloppy as in untidy/messy (ADL3) NOT: making errors due to being distracted (DEP3)
DEP1 Orderly and planful; prioritize tasks Pertain to preparation for tasks, e.g. • making lists • setting priorities • doing tasks in a logical sequence • outlining steps NOT: methods of doing tasks or keeping possessions or materials organized (ADL1)
Rarely do any planning before undertaking tasks and assignments
ADL3 Dislike clutter; enjoy developing methods for keeping materials methodically organized Pertains to organization of objects or materials, e.g. • keeping papers filed • keeping work and living space tidy NOT: organization of activities/tasks (DEP1)
Frequently maintain their personal effects in a state of disarray Cannot find things because work or living space is messy / not organized. Things may not be lost, just hard to find in the clutter. Emphasize misplacing things, taking a long time to find things.
DEP2 Are well organized; are reliable; use their time efficiently; stay on schedule e.g., • works efficiently • meets deadlines • does not lose things due to carelessness
Are unreliable and undependable; fall behind in assignments or duties; miss deadlines; often lose things Loses things due to carelessness. Important items or documents are (maybe irretrievably) lost. Emphasize losing things that belong or are useful to others.

D-2
ADF: Adaptability/Flexibility, ADL: Attention to Detail, DEP: Dependability, VIG: Vigilance Similar Facets
High Scorers [Definition with Notes] Low Scorers [Definition with Notes]
ADL1 Are exacting, precise, and accurate; are meticulous and thorough in their approach to tasks Pertains to methods used to do tasks, e.g. • checking off things as they are done • thinking about every detail • working carefully • reviewing work before turning it in NOT: preparation for tasks
Are sloppy and imprecise; make careless errors Make careless errors due to not being meticulous and thorough in the methods used to do tasks, e.g., • working too quickly / not carefully • not keeping track of what has already been done /
what has yet to be done • failing to check work before turning it in NOT: sloppy in the sense of being untidy/messy NOT: making errors due to being distracted
DEP3 Are not easily distracted or bored by routine tasks, e.g., • stays on task • keeps mind on task
Are easily distracted while working on unpleasant or routine tasks Do poor work and make mistakes because gets bored or distracted easily, e.g., • working too slowly • not paying attention to the task • daydreaming or socializing while working
VIG1 Are able to constantly scan the environment for things that require attention, even when no action may be required for long periods of time (e.g., staying alert to possible safety hazards). e.g., • Not easily distracted when watching for or monitoring
something • Detects low frequency events • Can focus and concentrate on environment The task requires constant attention to the environment. The person is responsible for monitoring or detecting particular events or conditions. VIG is NOT relevant to tasks such as clerical work.
Experience lapses in attention when required to scan the environment for low-frequency, but critical, actions or events over long periods of time, e.g., • driving: 10 miles go by without really noticing • 10 defective widgets went by undetected • having accidents because one is not paying enough
attention to the environment
ADF2 Like considerable variety at work Focus on liking to perform a variety of tasks, but not on learning new things. Likes variety in schedules, assignments, tasks, and skills used – but these are preferences, not because one is easily bored or distracted. NOT: liking to learn new skills or information (WTL1); broad interests (WTL4) NOT: easily bored or distracted by routines (low DEP3)
Prefer familiar tasks / little variety Likes the to do the same things every day (e.g., same schedule, assignments, tasks, skills used).

D-3
DUT: Dutifulness/Integrity, SRL: Self-Reliance, WTL: Willingness to Learn, SO: Social Orientation
Similar Facets
High Scorers [Definition with Notes] Low Scorers [Definition with Notes]
DUT4 Accept responsibility for the consequences of their actions Accountability Admitting/reporting own mistakes consequences of actions without complaint NOT: learning from mistakes/using feedback (WTL2)
Refuse to be held accountable for their own actions
WTL2 Learn from mistakes, take useful advice Willing to accept and learn from feedback and guidance about one’s work. NOT: accountability for actions (DUT4) NOT: preferring or depending on a lot of advice (low SRL)
Do not learn from mistakes or listen to others’ advice
WTL3 Ask questions when they are unsure about something Ask questions when it is best to do so. Believe that asking questions is a good way to learn; ask questions for information and clarification. NOT: seeking advice or reassurance from others when one should be able to proceed without it (low SRL2)
Do not seek clarification when they fail to understand something in a training situation
SRL1 Are resourceful; avoid becoming dependent on others to get things done Does own work When appropriate, works independently Does not need constant supervision NOT: resistant to working with others (low SO)
Frequently rely on others to get things done Overdependent on others’ help or supervision Lets others help whenever they offer Tries to get others to do own work
SRL2 Are self-sufficient and like to make their own decisions When appropriate, has the confidence and ability to make decisions on own Is confident in own judgment and decisions Can, and wants to, make personal decisions on own NOT: refusal to listen to others (low WTL / low SO) NOT: problems with authority (low DUT)
Easily become dependent on others for advice and reassurance, and may feel insecure or helpless without that support; often take up receptive listeners’ time by confiding difficulties to them and seeking support Seeks advice or reassurance when should be able to proceed without it Seeks advice on personal decisions
SO5 Is cooperative; increases cohesiveness in groups in which he/she participates
Creates friction when around others
SO3 Likes to work with others rather than alone Prefers to work alone

D-4
ADF: Adaptability/Flexibility, WTL: Willingness to Learn
Similar Facets
High Scorers [Definition with Notes] Low Scorers [Definition with Notes]
WTL1 Demonstrate a willingness to learn new material in a classroom environment or on the job and to apply that material in new work situations; actively seek out learning opportunities NOT: preference for variety in work tasks (ADF2); willingness to change approach (ADF1)
Avoid training opportunities; do not apply what they learn in training to new work situations
WTL4 Are interested in learning many different things NOT: preference for variety in work tasks (ADF2); willingness to change approach (ADF1)
Have a narrow range of interests
ADF1 Are willing to change their approach to tasks and projects Focus on willingness to change and willingness to try something new, not on the learning element NOT: liking to learn new skills or information (WTL1); broad interests (WTL4)
Like to do things the way they have always done them
ADF2 Like considerable variety at work Focus on liking to perform a variety of tasks, but not on learning new things. Likes variety in schedules, assignments, tasks, and skills used – but these are preferences, not because one is easily bored or distracted. NOT: liking to learn new skills or information (WTL1); broad interests (WTL4) NOT: easily bored or distracted by routines (low DEP3)
Prefer familiar tasks / little variety Likes the to do the same things every day (e.g., same schedule, assignments, tasks, skills used).

E-0
Appendix E: Screening of Expert Rater Data for
Round 1 Trait Level Ratings


E-1
Screening of Expert Rater Data for Round 1 Trait Level Ratings
ENCAPS Development: Phase 2, Round 1 [April 7, 2004] Results based on the 7-point trait level rating scale, 523 items Constructs: Adaptability/Flexibility (150 items), Attention to Detail (120), Self-reliance (166), Vigilance (87) PDRI Raters: A Stellmack, C Cochran, C Kubisiak, C Paullin, J Hedge, J Johnson, K Ferstl, K Horgen, L Lentz, L Penney, M Bosshardt, M Cullen, R Schneider, S Lammlein, S Waters, V Pace, W Borman NPRST Raters: Andy, Becky, Dickason, Farmer, Geoff, HC, Larson, RB, S Kewley, Underhill
ICC (2, k) Correlation With Mean Euclidean Dissimilarity Coefficient
(Compared to Means)
raw 1 rater Mean StDev Min Max Mean StDev Min Max
PDRI 17 .993 .90 0.95 0.01 0.93 0.97 12.74 1.39 10.33 14.73
NPRST 10 .982 .84 0.93 0.02 0.89 0.97 15.00 3.74 9.48 23.14
All 27 .995 .88 0.94 0.02 0.89 0.97 13.58 2.70 9.48 23.14
r with means Euclidean dissimilarity
coefficient ID Rater Org raw z raw z
101 PDRI 0.97 1.24 13.46 -0.04 102 PDRI 0.94 -0.04 14.73 0.43 103 PDRI 0.95 0.42 12.17 -0.52 104 PDRI 0.97 1.44 10.33 -1.20 105 PDRI 0.94 -0.14 13.23 -0.13 106 PDRI 0.96 0.70 12.29 -0.48 107 PDRI 0.93 -0.41 13.72 0.05 108 PDRI 0.95 0.24 14.73 0.43 109 PDRI 0.95 0.59 11.10 -0.92 110 PDRI 0.93 -0.79 14.66 0.40 111 PDRI 0.96 0.82 13.06 -0.19 112 PDRI 0.96 0.82 10.40 -1.18 113 PDRI 0.94 -0.16 12.99 -0.22 114 PDRI 0.94 -0.29 13.64 0.02 115 PDRI 0.95 0.25 11.96 -0.60 116 PDRI 0.97 1.39 11.62 -0.73 117 PDRI 0.95 0.18 12.42 -0.43 118 NPRST 0.90 -2.26 17.18 1.34 119 NPRST 0.92 -0.91 14.55 0.36 120 NPRST 0.95 0.52 11.43 -0.80 121 NPRST 0.97 1.38 9.48 -1.52 122 NPRST 0.91 -1.41 15.36 0.66 123 NPRST 0.95 0.23 12.71 -0.32 124 NPRST 0.89 -2.41 17.18 1.34 125 NPRST 0.93 -0.68 13.91 0.12 126 NPRST 0.94 0.03 23.14 3.55 127 NPRST 0.93 -0.74 15.10 0.57
Ratings from highlighted raters will be considered for deletion. Flagged raters are those with z (Euclidean distance) > 1.0.

E-2
Consider Dropping Raters for Trait Level Scaling
Euclidean distances (comparing individual raters to trait level means) Options: (a) keep all 27 raters (b) drop raters with Euclidean distance > [mean + s] ⇒ 2 raters (ID 118, 124)
Table E-1.
Shrout and Fleiss (1979) Case (2, k) intraclass correlations under the two options outlined above (corrected to single rater).
Options ICC (2, k)
keep all .879
drop 2 .885
Table E-2. A summary of the trait level standard deviations and ranges under the two options outlined above. Standard Deviations Ranges (max-min+1)
Options mean sd min max mean sd min max
keep all 0.70 0.22 0 1.53 3.60 0.70 1 7
drop 2 0.68 0.22 0 1.56 3.47 0.68 1 7
Table E-3. Range frequencies under the three options outline above. Entries are numbers of items.
Options
Range (max-min+1) (i.e., number of scale points used)
keep all drop 2 raters
1 4 4
2 58 69
3 221 242
4 159 139
5 38 35
6 28 20
7 15 14
Total 523 523

E-3
0.00
5.00
10.00
15.00
20.00
25.00
0 5 10 15 20 25 30
Figure E-1. Plot of Euclidean distances.
Figure E-1 shows the plot of Euclidean distances for all raters. There are two places where the slope changes notably. The first is after the first rater (Rater 126), and the second is after the third rater (adding Raters 118 and 124). The second and third raters in this plot are the ones flagged for exclusion based on both the correlation and distance measures of agreement. The first rater in this plot (Rater 126) has ratings that are acceptably correlated with the means (r = .94, equal to the mean across all raters). (Note: Further analyses might show why Rater 126 has this discrepancy in his standing on the two discrepancy measures. One interesting fact is that the ratings from Rater 126 show more variability than ratings from the other raters: SD = 2.79, compared to SD range from 1.73 to 2.31 for the remaining raters.)
0.890.900.910.920.930.940.950.960.970.98
0 5 10 15 20 25 30
Figure E-2. Plot of correlations.
Figure E-2 shows the plot of correlations for each set of ratings and the profile of trait level means. There are two places where the slope changes notably. The first is after the first two raters (Raters 124 and 118), and the second is after the third rater (Rater 122). The first two raters in this plot are the same two that were flagged for possible exclusion.

E-4
Outliers in the trait level ratings
As we did in the first phase of ENCAPS development, we defined an outlier rating as one that was separated from the nearest rating by one or more scale points with a frequency of zero. For example, if one rater gave the item a 2 and all the other ratings were 4s and 5s, the 2 was considered an outlier.
There were 27 raters and 523 items, yielding 14,121 individual ratings. Of these, only 15 ratings fit our definition of “outlier.” The raters flagged for possible omission (Raters 118 and 124), accounted for just 3 of the 15 outlier ratings. None of the 27 raters accounted for more than 2 of the outlier ratings. Thus, this outlier analysis does not lend support to a decision to drop any raters.
(Note: As we did in Phase 1, we will consider the 15 outlier ratings to be rater errors, and those individual ratings will be dropped even if all raters are kept.) Effect of dropping two raters on standard deviations and ranges of trait level ratings Dropping Raters 118 and 124 would have the following effect on the variability in the items’ trait level ratings:
• 15 items (2.9%) would have SD change > |.15| • 6 items (1.1%) would have range (max-min+1) change > |2| • 47 items (9.0%) would have range (max-min+1) change ≠ 0
Conclusion
The evidence does not consistently indicate that one or more raters should be dropped. Thus, all sets of ratings will be kept for subsequent analyses.

F-0
Appendix F: Screening of Expert Rater Data for
Round 2 Trait Level Ratings


F-1
Screening of Expert Rater Data for Round 2 Trait Level Ratings
ENCAPS Development: Phase 2, Round 2 [June 03, 2004] Results based on the 7-point trait level rating scale, 676 items Constructs with new and revised items based on Round 1 ratings: Adaptability/Flexibility (54 items), Attention to Detail (72), Self-reliance (34), Vigilance (44) Constructs introduced during Round 2: Dependability (195 items), Dutifulness (135), Willingness to Learn (142) PDRI Raters: A Stellmack, C Cochran, C Kubisiak, C Paullin, J Hedge, J Johnson, K Ferstl, L Lentz, M Bosshardt, M Cullen, R Schneider, S Lammlein, S Waters, V Pace NPRST Raters: Bearden, Farmer, Fedak, Hubert, Janega, Kewley, Kimberly, Lane, Underhill ICC (2, k) Correlation With Mean Euclidean Dissimilarity Coefficient
(Compared to Means)
raw 1 rater Mean StDev Min Max Mean StDev Min Max
PDRI 14 .989 .87 0.93 0.03 0.88 0.96 17.30 3.25 12.76 25.15
NPRST 9 .983 .87 0.93 0.02 0.91 0.96 16.99 3.28 13.34 23.10
All 23 .993 .86 0.93 0.02 0.88 0.96 17.79 3.32 12.76 25.15
r with means Euclidean dissimilarity
coefficient ID Rater Org raw z raw z
101 PDRI 0.95 0.93 13.58 -1.15 102 PDRI 0.91 -1.03 19.23 0.59 103 PDRI 0.88 -2.21 22.40 1.57 104 PDRI 0.93 -0.30 18.07 0.24 105 PDRI 0.95 0.70 13.99 -1.02 106 PDRI 0.92 -0.53 19.69 0.73 107 PDRI 0.96 1.20 14.99 -0.71 108 PDRI 0.94 0.32 18.42 0.34 109 PDRI 0.95 0.65 14.30 -0.92 110 PDRI 0.95 0.91 13.34 -1.22 111 PDRI 0.92 -0.61 17.69 0.12 112 PDRI 0.95 0.69 14.27 -0.93 113 PDRI 0.88 -2.32 23.10 1.78 114 PDRI 0.96 1.06 14.73 -0.79 115 NPRST 0.91 -0.97 18.96 0.51 116 NPRST 0.94 0.37 16.37 -0.29 117 NPRST 0.92 -0.62 19.10 0.55 118 NPRST 0.93 -0.06 17.05 -0.08 119 NPRST 0.96 1.02 16.15 -0.35 120 NPRST 0.93 -0.14 25.15 2.42 121 NPRST 0.93 -0.29 17.02 -0.09 122 NPRST 0.96 1.24 12.76 -1.40 123 NPRST 0.93 -0.02 17.58 0.09
Ratings from highlighted raters will be considered for deletion. Flagged raters are those with z (Euclidean distance) > 1.0.
Consider Dropping Raters for Trait Level Scaling

F-2
Euclidean distances (comparing individual raters to trait level means) Options: (a) keep all 23 raters (b) drop raters with Euclidean distance > [mean + s] ⇒ 3 raters (ID 103, 113, 120)
Table F-1.
Shrout and Fleiss (1979) Case (2, k) intraclass correlations under the two options outlined above (corrected to single rater).
Options ICC (2, k)
keep all 23 .864
drop 3 .877
Table F-2. A summary of the trait level standard deviations and ranges under the two options outlined above. Standard Deviations Ranges (max-min+1)
Options mean sd min max mean sd min max
keep all 0.71 0.23 0.21 1.99 3.60 1.17 2 7
drop 3 0.67 0.23 0.00 2.00 3.27 1.00 1 7
Table F-3. Range frequencies under the three options outline above. Entries are numbers of items.
Options
Range (max-min+1) (i.e., number of scale points used) keep all drop 3 raters
1 0 2
2 94 129
3 276 321
4 188 165
5 57 32
6 44 19
7 17 8
Total 676 676

F-3
0.00
5.00
10.00
15.00
20.00
25.00
30.00
0 5 10 15 20 25
Figure F-1. Plot of Euclidean distances.
Figure F-1 shows the plot of Euclidean distances for all raters. There are two places where the slope changes notably. The first is after the first rater (Rater 120), and the second is after the third rater (adding Raters 113 and 103). The first three raters in this plot are the ones flagged for exclusion based on both the distance measure of agreement.
0.870.880.890.900.910.920.930.940.950.960.97
0 5 10 15 20 25
Figure F-2. Plot of correlations. Figure F-2 shows the plot of correlations for each set of ratings with the profile of trait level means. There is one place where the slope changes notably: separating the first 21 raters plotted from the final 2. The final 2 raters, with the lowest correlations between their ratings and the mean, were Raters 103 and 113 – 2 of the 3 raters flagged for possible exclusion. The third rater flagged (120) has an acceptable correlation (.93, equal to the mean across all raters).

F-4
Effect of dropping three raters on standard deviations and ranges of trait level ratings
Dropping Raters 103, 113, and 120 would have the following effect on the variability in the items’ trait level ratings:
• 63 items (9.3%) would have SD change > .15
(Positive direction means SD gets smaller when raters are excluded. No items had SD change of this magnitude in the negative direction.)
• 23 items (3.4%) would have range (max-min+1) change > 2 • 147 items (21.7%) would have range (max-min+1) change > 0
(Positive direction means range gets smaller when raters are excluded. No items had a range change, of any magnitude, in the negative direction.)
Outliers in the trait level ratings
As we did in the first phase of ENCAPS development, we defined an outlier rating as one that was separated from the nearest rating by one or more scale points with a frequency of zero. For example, if one rater gave the item a 2 and all the other ratings were 4s and 5s, the 2 was considered an outlier.
There were 23 raters and 676 items, yielding 15,548 individual ratings. Of these, only 87 ratings fit our definition of “outlier.” The raters flagged for possible omission (Raters 103, 113, 120), together accounted for 39 (45%) of the outlier ratings. More specifically, these raters accounted for 14, 16, and 9 of the outlier ratings, respectively.
Of the remaining 20 raters, outlier ratings ranged from 0 to 7 for each individual. (Note: As we did in Phase 1, we will consider all outlier ratings to be rater errors, and those individual ratings will be dropped even if all raters are kept.)
Next Step
All of the evidence taken together does support dropping three raters. On the other hand, the outlier analysis suggests that the picture might change meaningfully if we remove the outlier ratings first. The next step, then, was to remove all 87 of the outlier ratings and then re-do some of the rater analyses. Results are on the following pages.

F-5
Round 2 Rater Screening: Analyses After Dropping Outlier Ratings
ICC (2, k) Correlation With Mean Euclidean Dissimilarity Coefficient
Raters Ratings raw 1rater Mean StDev Min Max Mean StDev Min Max
PDRI 14 all ratings .989 .87 0.93 0.03 0.88 0.96 17.30 3.25 12.76 25.15
PDRI 14 drop outliers .991 .88 0.94 0.02 0.91 0.96 15.03 2.11 12.03 18.02
NPRST 9 all ratings .983 .87 0.93 0.02 0.91 0.96 16.99 3.28 13.34 23.10
NPRST 9 drop outliers .985 .88 0.94 0.01 0.92 0.96 16.05 2.60 12.13 21.56
All 23 all ratings .993 .86 0.93 0.02 0.88 0.96 17.79 3.32 12.76 25.15
All 23 drop outliers .994 .88 0.94 0.01 0.91 0.96 15.43 2.31 12.03 21.56
r with means Euclidean dissimilarity coefficient all ratings drop outlier ratings all ratings drop outlier ratings
ID Org raw z raw z raw z raw z 101 PDRI 0.95 0.93 0.96 1.23 13.58 -1.15 12.03 -1.47 102 PDRI 0.91 -1.03 0.91 -2.04 19.23 0.59 18.02 1.12 103 PDRI 0.88 -2.21 0.92 -1.41 22.40 1.57 17.35 0.83 104 PDRI 0.93 -0.30 0.93 -1.10 18.07 0.24 17.29 0.81 105 PDRI 0.95 0.70 0.95 0.51 13.99 -1.02 13.22 -0.95 106 PDRI 0.92 -0.53 0.93 -0.55 19.69 0.73 17.18 0.76 107 PDRI 0.96 1.20 0.96 1.44 14.99 -0.71 13.70 -0.75 108 PDRI 0.94 0.32 0.95 0.64 18.42 0.34 16.05 0.27 109 PDRI 0.95 0.65 0.95 0.31 14.30 -0.92 13.80 -0.70 110 PDRI 0.95 0.91 0.96 0.98 13.34 -1.22 12.28 -1.36 111 PDRI 0.92 -0.61 0.93 -0.59 17.69 0.12 15.21 -0.09 112 PDRI 0.95 0.69 0.95 0.60 14.27 -0.93 13.32 -0.91 113 PDRI 0.88 -2.32 0.93 -0.92 23.10 1.78 17.23 0.78 114 PDRI 0.96 1.06 0.96 1.04 14.73 -0.79 13.69 -0.75 115 NPRST 0.91 -0.97 0.92 -1.27 18.96 0.51 16.82 0.60 116 NPRST 0.94 0.37 0.94 -0.02 16.37 -0.29 15.51 0.04 117 NPRST 0.92 -0.62 0.92 -1.36 19.10 0.55 17.79 1.02 118 NPRST 0.93 -0.06 0.94 -0.08 17.05 -0.08 15.23 -0.09 119 NPRST 0.96 1.02 0.96 1.02 16.15 -0.35 15.33 -0.04 120 NPRST 0.93 -0.14 0.95 0.41 25.15 2.42 21.56 2.65 121 NPRST 0.93 -0.29 0.94 0.16 17.02 -0.09 14.23 -0.52 122 NPRST 0.96 1.24 0.96 1.28 12.76 -1.40 12.13 -1.43 123 NPRST 0.93 -0.02 0.94 -0.26 17.58 0.09 15.81 0.17
Note: Ratings from highlighted raters will be considered for deletion: those with z (Euclidean distance) > 1.0.

F-6
Consider Dropping Raters for Trait Level Scaling, After Dropping Outlier Ratings
Euclidean distances (comparing individual raters to trait level means) Options: (a) keep all 23 raters (b) drop raters with Euclidean distance > [mean + s] ⇒ 3 raters (ID 103, 113, 120) (c) drop rater with Euclidean distance > [mean + s], before and after dropping outlier ratings ⇒ 1 rater (ID 120)
Table F-4
Shrout and Fleiss (1979) Case (2, k) intraclass correlations under the two options outlined above (corrected to single rater).
Options ICC (2, k)
keep all 23 .880
drop 3 .884
drop 1 .881
0.00
5.00
10.00
15.00
20.00
25.00
0 5 10 15 20 25
Figure F-3. Plot of Euclidean distances after dropping outlier ratings.
Figure F-3 shows the plot of Euclidean distances for all raters after outliers were deleted. There is one place where the slope changes notably, after the first rater (Rater 120). This rater was one of the raters flagged for exclusion in the first set of analyses.

F-7
0.91
0.92
0.93
0.94
0.95
0.96
0.97
0 5 10 15 20 25
Figure F-4. Plot of correlations after dropping outlier ratings.
Figure F-4 shows the plot of correlations for each set of ratings with the profile of trait level means after outliers were deleted. There is one place where the slope changes notably: separating the first 21 raters plotted from the final rater. The final rater, with the lowest correlation between their ratings and the mean, was Rater 102 (who also had one of the three highest Euclidean distances).

F-8
Conclusions
Using the Euclidean distance measure as an indicator of rater agreement with other raters, two raters who stood out in the first analyses (based on all data), 103 and 113, were in better agreement with the rest of the group in the second analyses (after dropping outlier ratings). These raters had z (Euclidean distance) > 1.0 based on all ratings data, but < 1.0 after outlier ratings were dropped. Because these individuals’ ratings were in good agreement with the others’ after outlier ratings were dropped, it is reasonable to keep these raters.
Two raters who were in acceptable agreement with the group based on all the data (i.e., z [Euclidean distance] < 1.0), actually turned out to be slightly out of bounds (z > 1.0) after the outlier ratings were dropped. Because both of these raters (103 and 113) looked fine based on the full data set, and because their z scores were only slightly higher than one after outliers were dropped, it is reasonable to keep these raters.
Only one rater (120) had z (Euclidean distance) > 1.0 in both analyses (all data, then outlier ratings dropped). In fact, not only were this rater’s z-scores greater than 1.0, they were also greater than 2.0 in both analyses. Although this individual’s ratings correlated acceptably with the means in both analyses, the distance measure is a clear outlier in both data sets. It seems reasonable to drop this rater.
Recommendations:
(1) Drop all outlier ratings (as defined earlier, and as done in previous rounds of item scaling).
(2) Drop one rater from the round 2 trait level ratings data: rater 120.
(3) Keep the other 22 raters and their remaining ratings.

G-0
Appendix G: Screening of Expert Rater Data for
Round 3 Trait Level Ratings


G-1
Screening of Expert Rater Data for Round 3 Trait Level Ratings
ENCAPS Development: Phase 2, Round 3 [August 6, 2004] Results based on the 7-point trait level rating scale, 293 items. (Prior to these analyses, 9 items were dropped based on rater comments. The Round 3 rating task had 302 items.) New items written for Round 3: AV (43), DUT (35), SO (27), SRL (11), ST (42), VIG (23), WTL (17) Old items rated for a second time (items were not revised, but included to give context to a rating task that would otherwise be dominated by items targeting the middle of the trait level continuum): AV (21), DUT (14), SO (22), SRL (9), ST (9), VIG (8), WTL (12) PDRI Raters: C Cochran, C Paullin, J Hedge, J Miller, K Ferstl, M Bosshardt, R Schneider, S Lammlein, S Waters, V Pace, W Borman, X Xu NPRST Raters: Bearden, Brown, Dickason, Eshwar, Fedak, Lane, Larson, Underhill
ICC (2, k) Correlation With Mean Euclidean Dissimilarity Coefficient
(Compared to Means)
Raw 1 rater Mean StDev Min Max Mean StDev Min Max
PDRI 12 .984 .834 0.92 0.02 0.89 0.95 9.11 1.48 7.10 11.52
NPRST 8 .974 .824 0.92 0.03 0.86 0.95 10.75 3.09 8.82 18.08
All 20 .989 .823 0.92 0.02 0.86 0.95 9.77 2.33 7.10 18.08
r with means Euclidean dissimilarity
coefficient ID Rater Org raw z raw z 01 PDRI 0.89 -1.43 11.52 0.75 02 PDRI 0.91 -0.65 11.05 0.55 03 PDRI 0.94 0.64 9.07 -0.30 04 PDRI 0.92 0.01 8.45 -0.56 05 PDRI 0.94 0.61 7.54 -0.95 06 PDRI 0.94 0.68 8.83 -0.40 07 PDRI 0.95 1.03 7.42 -1.01 08 PDRI 0.91 -0.37 9.61 -0.07 09 PDRI 0.94 0.83 8.03 -0.74 10 PDRI 0.90 -1.09 10.15 0.16 19 PDRI 0.89 -1.37 10.55 0.34 20 PDRI 0.95 1.21 7.10 -1.14 11 NPRST 0.95 1.02 8.82 -0.40 12 NPRST 0.95 1.15 8.83 -0.40 13 NPRST 0.91 -0.41 9.84 0.03 14 NPRST 0.93 0.19 10.24 0.20 15 NPRST 0.91 -0.53 11.46 0.73 16 NPRST 0.93 0.51 9.20 -0.24 17 NPRST 0.86 -2.37 18.08 3.56 18 NPRST 0.93 0.33 9.52 -0.11

G-2
Ratings from highlighted raters will be considered for deletion. Flagged raters are those with z (Euclidean distance) > 1.0.
Consider Dropping Raters for Trait Level Scaling
Euclidean distances (comparing individual raters to trait level means) Options: (a) keep all 20 raters (b) drop raters with Euclidean distance > [mean + s] ⇒ 1 rater (ID 17)
TableG-1.
Shrout and Fleiss (1979) Case (2, k) intraclass correlations under the two options outlined above (corrected to single rater).
Options ICC (2, k)
keep all 20 .823
drop 1 .843
0.002.004.006.008.00
10.0012.0014.0016.0018.0020.00
0 1 2 3 4 5 6 7 8 9 1011121314151617181920
Figure G-1. Plot of Euclidean distances. Figure G-1 shows the plot of Euclidean distances for all raters. There is one place where the slope changes dramatically: separating one rater from the other 19. The rater with the highest Euclidean Distance (relative to the mean) is Rater 117—also the only rater flagged for exclusion.

G-3
0.86
0.88
0.90
0.92
0.94
0.96
0 1 2 3 4 5 6 7 8 9 1011121314151617181920
Figure G-2. Plot of correlations.
Figure G-2 shows the plot of correlations for each set of ratings with the profile of trait level means. The place where the slope change is the greatest is between the first 19 raters plotted from the final 1. The final 1 rater, with the lowest correlations between own ratings and mean ratings, was Rater 117. Rater 117 was also the single rater flagged for possible exclusion.
Outliers in the trait level ratings
As we have done throughout ENCAPS development, we defined an outlier rating as one that was separated from the nearest rating by one or more scale points with a frequency of zero. For example, if one rater gave the item a 2 and all the other ratings were 4s and 5s, the 2 was considered an outlier.
There were 20 raters and 293 items, yielding 5,860 individual ratings. Of these, only 17 ratings fit our definition of “outlier.” The rater flagged for possible omission (Rater 117), accounted for 3 of the outlier ratings. Of the remaining 19 raters, outlier ratings ranged from 0 to 4 for each individual. The outlier analysis neither supports nor refutes the other evidence for dropping a rater. (Note: As before, we consider all outlier ratings to be rater errors. Outlier ratings were dropped from the data set before rater screening analyses were conducted.)
Conclusion
The evidence supports dropping one rater (ID 17).


H-0
Appendix H: Histograms of Trait Levels for
Traditional ENCAPS Scales


H-1
Trait Level
4.384.13
3.883.63
3.383.13
2.882.63
2.382.13
1.88
Histogram of Trait Levels
(Traditional ENCAPS Adaptability/Flexibility)40
30
20
10
0

H-2
Trait Level
4.504.25
4.003.75
3.503.25
3.002.75
2.502.25
2.00
Histogram of Trait Levels
(Traditional ENCAPS Attention to Detail)40
30
20
10
0

H-3
Trait Level
4.634.38
4.133.88
3.633.38
3.132.88
2.632.38
2.131.88
Histogram of Trait Levels
(Traditional ENCAPS Achievement)40
30
20
10
0

H-4
Trait Level
4.884.63
4.384.13
3.883.63
3.383.13
2.882.63
2.382.13
Histogram of Trait Levels
(Traditional ENCAPS Dependability)40
30
20
10
0

H-5
Trait Level
4.754.50
4.254.00
3.753.50
3.253.00
2.752.50
2.25
Histogram of Trait Levels
(Traditional ENCAPS Dutifulness)50
40
30
20
10
0

H-6
Trait Level
4.634.38
4.133.88
3.633.38
3.132.88
2.632.38
2.13
Histogram of Trait Levels
(Traditional ENCAPS Social Orientation)40
30
20
10
0

H-7
Trait Level
4.384.25
4.134.00
3.883.75
3.633.50
3.383.25
3.133.00
2.882.75
2.632.50
2.382.25
2.132.00
Histogram of Trait Levels
(Traditional ENCAPS Self-Reliance)50
40
30
20
10
0

H-8
Trait Level
4.884.63
4.384.13
3.883.63
3.383.13
2.882.63
2.382.13
1.881.63
1.38
Histogram of Trait Levels
(Traditional ENCAPS Stress Tolerance)40
30
20
10
0

H-9
Trait Level
4.754.50
4.254.00
3.753.50
3.253.00
2.752.50
2.25
Histogram of Trait Levels
(Traditional ENCAPS Vigilance)40
30
20
10
0

H-10
Trait Level
4.754.63
4.504.38
4.254.13
4.003.88
3.753.63
3.503.38
3.253.13
3.002.88
2.752.63
2.50
Histogram of Trait Levels
(Traditional ENCAPS Willingness to Learn)50
40
30
20
10
0

I-0
Appendix I: Traditional ENCAPS Item-Level Descriptive Statistics


I-1
Table I-1 Traditional ENCAPS Item-Level Descriptive
Statistics Item Minimum Maximum Mean SD
1 1.07 4.93 3.63 .96 2 1.07 4.93 4.09 .85 3 2.27 3.73 3.47 .31 4 2.22 3.78 3.37 .33 5 .09 5.91 2.95 1.63 6 2.85 3.15 2.97 .08 7 .68 5.32 3.96 1.35 8 2.05 3.95 3.05 .54 9 2.45 3.55 3.04 .28
10 1.84 5.32 4.11 .96 11 .81 5.19 3.72 .92 12 .56 5.44 4.20 1.05 13 1.41 4.59 3.38 .87 14 1.82 4.18 2.83 .59 15 .64 5.36 2.63 1.37 16 2.06 3.94 2.68 .42 17 .41 5.59 3.14 1.44 18 .45 5.55 4.48 1.21 19 1.14 4.86 3.66 .96 20 2.56 3.44 3.26 .18 21 2.00 4.00 3.24 .49 22 2.59 3.41 3.17 .14 23 .59 5.41 3.61 1.20 24 1.19 4.81 3.53 .80 25 .79 5.21 3.82 .92 26 1.62 4.38 3.87 .53 27 2.96 3.04 3.00 .02 28 1.00 5.00 3.87 1.14 29 1.84 5.32 4.01 .88 30 1.86 4.14 3.20 .53 31 2.84 3.16 3.01 .08 32 .59 5.41 3.47 1.37 33 .85 5.15 4.01 .78 34 .64 5.36 3.67 .92 35 2.72 3.28 3.01 .15

I-2
Table I-1 (Continued)
Item Minimum Maximum Mean SD 36 .41 5.59 3.45 1.19 37 1.82 5.36 3.93 .88 38 2.84 3.32 3.21 .09 39 2.61 3.79 3.51 .24 40 1.23 4.77 3.29 1.08 41 1.81 4.19 3.45 .45 42 1.33 4.67 3.88 .67 43 .65 5.35 3.81 1.13 44 2.43 3.57 2.78 .22 45 .86 5.14 3.51 1.20 46 1.73 4.27 3.63 .49 47 1.00 5.00 3.25 1.04 48 2.68 3.64 3.37 .23 49 .92 5.08 3.68 .94 50 .14 5.86 4.03 1.21 51 1.00 5.00 3.74 .96 52 2.59 3.41 2.86 .18 53 .86 5.14 4.01 .94 54 1.68 4.32 2.86 .71 55 2.29 3.36 2.61 .25 56 .78 5.22 3.37 1.17 57 1.77 4.23 3.27 .55 58 1.73 4.27 2.72 .63 59 .64 5.36 4.04 .89 60 1.36 4.64 3.57 .76 61 .82 5.18 3.45 1.13 63 .85 5.15 4.29 .79 64 2.79 3.21 3.01 .11 65 .36 5.64 3.54 1.28 66 1.00 5.00 3.13 1.07 67 .71 5.29 2.57 1.21 68 .11 5.89 3.37 1.35 69 2.67 3.33 3.15 .11 70 3.00 3.00 3.00 .00 71 1.00 5.00 2.76 .99 72 .27 5.73 4.20 1.29 73 1.18 4.82 3.32 .94

I-3
Table I-1 (Continued)
Item Minimum Maximum Mean SD 74 .91 5.09 3.88 1.06 75 .22 5.78 4.00 1.18 76 2.09 3.91 2.88 .48 77 1.66 5.68 4.80 1.04 78 1.14 4.86 4.03 .68 79 .89 5.11 3.00 1.24 80 1.23 4.77 3.34 .96 81 2.58 3.21 2.81 .15 82 .77 5.23 3.40 1.10 83 2.71 3.29 2.92 .13 84 2.64 3.36 2.90 .17 85 1.53 4.47 3.04 .75 86 2.67 3.67 3.40 .20 87 .45 5.55 2.55 1.19 88 2.44 3.56 2.80 .24 89 .95 5.05 3.87 .94 90 1.50 4.50 3.81 .54 91 1.00 5.00 2.41 .98 92 2.425 4.15 3.55 .42 93 .27 5.73 4.65 .93 94 1.05 4.95 3.17 1.00 95 .85 5.15 2.64 1.03 96 .71 5.29 4.26 .99 97 2.64 3.72 3.53 .22 98 2.32 4.36 3.74 .45 99 2.19 3.81 3.45 .33
100 1.00 5.00 2.78 1.17 101 .82 5.18 3.58 1.10 102 .15 5.85 3.97 1.24 103 1.41 4.59 3.27 .79 104 2.11 3.89 3.15 .46 105 1.77 4.23 2.92 .61 106 1.27 4.73 3.62 .84 107 2.11 3.89 3.03 .43 108 .45 5.55 2.72 1.31 109 1.50 4.50 3.75 .54 110 .36 5.64 4.37 .98

I-4
Table I-1 (Continued)
Item Minimum Maximum Mean SD 111 .23 5.77 3.65 1.14 112 .27 5.73 3.15 1.35 113 .59 5.41 3.54 .98 114 .42 5.58 3.64 1.01 115 1.73 4.27 3.04 .62 116 1.07 4.93 3.21 1.07 117 1.71 4.29 3.66 .39 118 2.28 3.72 2.80 .38 119 2.035 4.93 3.60 .77 120 .33 5.67 3.72 1.09 121 1.86 4.14 3.04 .54 122 .67 5.33 3.37 .97 123 .36 5.64 4.33 .92 124 .10 5.90 4.13 1.38 125 2.13 4.74 3.79 .65 126 1.18 4.82 3.62 .76 127 1.23 4.77 3.21 .88 128 1.24 4.76 3.51 .87 129 2.00 4.00 3.54 .32 130 .18 5.82 3.67 1.69 131 .44 5.56 3.90 1.14 132 2.18 4.64 3.70 .61 133 1.1 4.9 3.34 1.27 134 .65 5.35 3.55 1.17 136 .64 5.36 4.26 .85 137 2.19 3.81 3.03 .40 138 .95 5.05 3.76 1.03 139 .55 5.45 3.96 1.01 140 1.18 4.82 3.08 .90 141 .65 5.35 3.29 1.04 142 1.29 4.71 3.83 .53 143 1.12 4.88 2.64 .87 144 .36 5.64 4.17 1.25 145 3.00 3.00 3.00 .00 146 .95 5.05 3.44 1.33 147 1.91 4.09 3.42 .39 148 1.09 4.91 3.31 .83

I-5
Table I-1 (Continued)
Item Minimum Maximum Mean SD 149 1.04 4.96 3.91 .72 150 1.71 5.59 4.70 .97 151 1.23 4.77 3.25 1.03 152 .91 5.09 3.64 .99 153 2.26 3.74 3.11 .39 154 .38 5.62 3.23 1.39 155 1.09 4.91 3.85 .81 156 1.73 4.27 3.04 .62 157 2.36 3.64 3.03 .34 158 1.78 4.22 2.68 .57 159 1.75 5.5 3.80 .99 160 1.00 5.00 3.77 .91 161 1.68 4.32 3.18 .68 162 1.955 5.09 4.14 .68 163 2.19 3.81 3.08 .45 164 2.45 3.55 2.98 .28 165 2.23 3.77 3.31 .26 166 1.30 4.70 3.64 .91 167 .92 5.08 3.26 1.04 168 1.11 4.89 3.42 .83 169 2.95 3.05 3.02 .02 170 1.15 4.85 3.29 .91 171 .32 5.68 3.85 1.22 172 .41 5.59 4.03 1.01 173 1.67 4.33 3.57 .62 174 1.56 4.44 3.70 .60 175 2.47 3.53 3.25 .20 176 1.56 4.44 3.82 .49 177 1.77 4.23 3.51 .47 178 .55 5.45 4.02 .86 179 .37 5.63 4.22 1.13 180 1.18 4.82 3.31 1.01 181 2.05 3.95 3.38 .38 182 2.93 3.15 3.08 .05 183 1.05 4.95 3.14 .99 184 3.00 3.00 3.00 .00 185 2.00 4.00 2.99 .51

I-6
Table I-1 (Continued)
Item Minimum Maximum Mean SD 186 1.77 4.23 3.64 .51 187 .68 5.32 3.82 .87 188 2.50 4.00 3.49 .36 189 2.36 3.64 3.34 .25 190 1.74 4.26 2.88 .58 191 .18 5.82 4.33 1.18 192 1.47 4.53 3.02 .83 193 1.64 4.36 3.73 .51 194 .82 5.18 3.97 .84 196 2.94 3.06 2.98 .03 197 .36 5.64 4.15 .98 198 1.18 4.82 2.95 .79 199 1.29 4.71 2.91 .86 200 1.86 4.14 2.78 .53 201 2.05 3.95 2.98 .47 202 2.68 3.64 3.38 .21 203 1.30 4.70 2.61 .78 204 1.79 4.21 3.66 .41 205 1.44 4.56 3.54 .64
Note. n = 251-269. Random Response scale items are excluded. Scale scores have been converted from a 1-5 to a 0-6 scale.

J-0
Appendix J: Histograms of Trait Levels for
Adaptive ENCAPS Scales


J-1
Trait Level
7.257.00
6.756.50
6.256.00
5.755.50
5.255.00
4.754.50
4.254.00
3.753.50
3.253.00
2.75
Histogram of Trait Levels
(Adaptive ENCAPS Adaptability/Flexibility)60
50
40
30
20
10
0

J-2
Trait Level
7.006.75
6.506.25
6.005.75
5.505.25
5.004.75
4.504.25
4.003.75
3.503.25
3.002.75
Histogram of Trait Levels
(Adaptive ENCAPS Attention to Detail)50
40
30
20
10
0

J-3
Trait Level
7.257.00
6.756.50
6.256.00
5.755.50
5.255.00
4.754.50
4.254.00
3.753.50
3.253.00
Histogram of Trait Levels
(Adaptive ENCAPS Achievement)60
50
40
30
20
10
0

J-4
Trait Level
7.507.25
7.006.75
6.506.25
6.005.75
5.505.25
5.004.75
4.504.25
4.003.75
3.503.25
3.00
Histogram of Trait Levels
(Adaptive ENCAPS Dependability)40
30
20
10
0

J-5
Trait Level
7.257.00
6.756.50
6.256.00
5.755.50
5.255.00
4.754.50
4.254.00
3.753.50
3.25
Histogram of Trait Levels
(Adaptive ENCAPS Dutifulness)60
50
40
30
20
10
0

J-6
Trait Level
7.257.00
6.756.50
6.256.00
5.755.50
5.255.00
4.754.50
4.254.00
3.753.50
3.253.00
2.75
Histogram of Trait Levels
(Adaptive ENCAPS Social Orientation)70
60
50
40
30
20
10
0

J-7
Trait Level
7.507.25
7.006.75
6.506.25
6.005.75
5.505.25
5.004.75
4.504.25
4.003.75
3.503.25
3.002.75
Histogram of Trait Levels
(Adaptive ENCAPS Self-Reliance)70
60
50
40
30
20
10
0

J-8
Trait Level
7.507.25
7.006.75
6.506.25
6.005.75
5.505.25
5.004.75
4.504.25
4.003.75
3.503.25
3.002.75
Histogram of Trait Levels
(Adaptive ENCAPS Stress Tolerance)50
40
30
20
10
0

J-9
Trait Level
7.507.25
7.006.75
6.506.25
6.005.75
5.505.25
5.004.75
4.504.25
4.003.75
3.503.25
3.002.75
Histogram of Trait Levels
(Adaptive ENCAPS Vigilance)40
30
20
10
0

J-10
Trait Level
7.257.00
6.756.50
6.256.00
5.755.50
5.255.00
4.754.50
4.254.00
3.75
Histogram of Trait Levels
(Adaptive ENCAPS Willingness to Learn)30
20
10
0

K-0
Appendix K: Scatterplots Showing Relationship Between Trait Level
and Test Information for Adaptive ENCAPS


K-1
Scatterplot of Trait Level and Test Info
(Attention to Detail)
Trait Level
8765432
Test
Info
rmat
ion
12
11
10
9
8
7
6
5

K-2
Scatterplot of Trait Level and Test Info
(Achievement)
Trait Level
8765432
Test
Info
rmat
ion
14
12
10
8
6
4
2

K-3
Scatterplot of Trait Level and Test Info
(Dependability)
Trait Level
8765432
Test
Info
rmat
ion
12
10
8
6
4
2

K-4
Scatterplot of Trait Level and Test Info
(Dutifulness)
Trait Level
876543
Test
Info
rmat
ion
14
12
10
8
6
4
2

K-5
Scatterplot of Trait Level and Test Info
(Social Orientation)
Trait Level
8765432
Test
Info
rmat
ion
14
12
10
8
6
4
2

K-6
Scatterplot of Trait Level and Test Info
(Self-Reliance)
Trait Level
8765432
Test
Info
rmat
ion
12
10
8
6
4
2

K-7
Scatterplot of Trait Level and Test Info
(Stress Tolerance)
Trait Level
8765432
Test
Info
rmat
ion
14
12
10
8
6
4
2

K-8
Scatterplot of Trait Level and Test Info
(Vigilance)
Trait Level
8765432
Test
Info
rmat
ion
14
12
10
8
6
4
2

K-9
Scatterplot of Trait Level and Test Info
(Willingness to Learn)
Trait Level
876543
Test
Info
rmat
ion
14
12
10
8
6
4
2


L-0
Appendix L: Scatterplots Showing Relationship Between Trait Level and Posterior Standard Deviation (PSD) for
Adaptive ENCAPS


L-1
Scatterplot of Trait Level and PSD
(Adaptability/Flexibility)
Trait Level
8765432
PS
D.5
.4
.3
.2

L-2
Scatterplot of Trait Level and PSD
(Attention to Detail)
Trait Level
8765432
PS
D.44
.42
.40
.38
.36
.34
.32
.30
.28

L-3
Scatterplot of Trait Level and PSD
(Achievement)
Trait Level
8765432
PS
D.5
.4
.3
.2

L-4
Scatterplot of Trait Level and PSD
(Dependability)
Trait Level
8765432
PS
D.44
.42
.40
.38
.36
.34
.32
.30
.28

L-5
Scatterplot of Trait Level and PSD
(Dutifulness)
Dutifulness
876543
PS
D.5
.4
.3
.2

L-6
Scatterplot of Trait Level and PSD
(Social Orientation)
Trait Level
8765432
Soc
ial O
rient
atio
n.5
.4
.3
.2

L-7
Scatterplot of Trait Level and PSD
(Self-Reliance)
Trait Level
8765432
PS
D.40
.38
.36
.34
.32
.30
.28

L-8
Scatterplot of Trait Level and PSD
ST
Trait Level
87 6543 2
PSD
.44
.42
.40
.38
.36
.34
.32
.30
.28
.26

L-9
Scatterplot of Trait Level and PSD
(Vigilance)
EAP_VIG
8765432
PS
D_V
IG.5
.4
.3
.2

L-10
Scatterplot of Trait Level and PSD
(Willingness to Learn)
Trait Level
876543
PS
D.5
.4
.3
.2

M-0
Appendix M: Interrater Reliability and Agreement Statistics for
Examinees Rated by at Least Two Raters


M-1
Table M-1 Interrater Reliability and Agreement Statistics for
Examinees Rated by at Least Two Raters
Ratee ID Number of
Raters ICC (2,k) Mean rwg rwg for Criterion
Composite
rwg for Criterion Composite
(Excluding Global Overall Potential
Rating) 1 9 .56 .49 .91 .89 2 2 .11 .44 .65 .45 3 2 -.35 .61 .92 .90 4 2 .40 .81 .98 .97 6 4 .35 .61 .94 .93 7 4 .65 .84 .98 .98 8 3 -.33 .70 .94 .92 9 2 -.46 .42 .00 .00
10 2 .05 .26 .00 .00 11 4 -.09 .58 .92 .91 12 2 .09 .83 .98 .97 13 2 .53 .85 .98 .98 15 2 -.44 .77 .96 .95 16 3 .02 .57 .92 .91 17 2 -.14 .62 .94 .93 19 4 .00 .47 .87 .82 20 2 -.19 .71 .95 .95 21 5 .43 .64 .95 .94 22 3 .04 .53 .89 .87 23 2 -.15 .79 .96 .95 25 11 .47 .57 .93 .92 26 6 .10 .44 .84 .78 27 3 .28 .58 .93 .92 29 4 .07 .52 .88 .89 30 11 .17 .52 .92 .90 31 4 .07 .39 .85 .84 33 4 .14 .65 .95 .94 34 3 .00 .15 .37 .32 35 3 -.13 .54 .92 .90 36 10 .45 .28 .78 .75 37 11 -.18 .08 .00 .00 38 2 -.15 .61 .92 .90

M-2
Table M-1 (Continued)
Ratee ID Number of
Raters ICC (2,k) Mean rwg rwg for Criterion
Composite
rwg for Criterion Composite
(Excluding Global Overall Potential
Rating)
40 2 .13 .46 .82 .81 41 3 -.76 .49 .91 .89 42 4 .01 .69 .96 .96 43 3 .11 .55 .93 .90 44 2 .56 .79 .97 .97 45 3 .48 .73 .96 .97 46 2 .17 .30 .00 .00 48 2 .33 .83 .98 .97 50 2 .60 .81 .98 .97 52 2 .00 .60 .94 .92 53 3 -.24 .43 .86 .86 54 3 .64 .59 .94 .92 56 8 .02 .31 .81 .77 57 2 .37 .59 .82 .73 58 4 .31 .71 .96 .96 59 2 .00 .51 .85 .81 60 3 -.26 .64 .94 .93 61 3 -.03 .73 .96 .96 62 2 .84 .92 .99 .99 63 2 .51 .77 .97 .98 64 2 .00 .77 .97 .96 65 7 .56 .37 .85 .85 66 3 .43 .76 .97 .96 67 4 -1.03 .52 .90 .88 68 3 .14 .27 .00 .00 69 2 .02 .35 .00 .00 70 2 .10 .25 .00 .00 71 4 -.12 .61 .94 .93 72 4 -.15 .65 .95 .94 74 6 -.11 .22 .41 .15 76 4 .12 .49 .90 .89 77 5 -.12 .75 .97 .96

M-3
Table M-1 (Continued)
Ratee ID Number of
Raters ICC (2,k) Mean rwg rwg for Criterion
Composite
rwg for Criterion Composite
(Excluding Global Overall Potential
Rating)
78 2 -.55 .59 .92 .90 79 2 .20 .66 .95 .94 80 2 .07 .61 .92 .92 83 4 .57 .55 .92 .93 84 5 .41 .36 .79 .76 85 3 .28 .55 .93 .92 87 3 .40 .61 .94 .92 88 2 -.33 .59 .92 .90 89 2 .06 .14 .00 .00 90 3 .22 .71 .96 .96 92 3 .13 .71 .96 .95 93 4 .11 .37 .64 .60 94 3 -.05 .42 .75 .70 95 3 -.19 .62 .89 .85 96 4 .41 .52 .89 .88 97 2 .27 .89 .99 .99 99 2 .15 .90 .99 .99
100 2 -.25 .83 .98 .98 101 2 .45 .75 .97 .97 103 3 -.61 .58 .92 .91 105 2 .14 .44 .85 .85 107 8 .16 .45 .89 .87 108 3 .20 .52 .83 .80 109 7 .03 .68 .95 .95 111 3 -.97 .43 .79 .70 112 2 .41 .75 .97 .96 113 2 .18 .59 .92 .90 114 2 .38 .71 .95 .93 116 2 .45 .85 .98 .98 117 7 -.13 .52 .92 .90 118 2 -1.35 .31 .00 .00 119 2 -1.02 .65 .93 .91 120 2 -.23 .77 .97 .96

M-4
Table M-1 (Continued)
Ratee ID Number of
Raters ICC (2,k) Mean rwg rwg for Criterion
Composite
rwg for Criterion Composite
(Excluding Global Overall Potential
Rating)
122 2 .04 .23 .00 .00 123 4 -.06 .67 .95 .95 125 5 .28 .51 .90 .88 126 2 -.80 .85 .98 .98 127 4 .11 .44 .87 .86 128 7 .54 .47 .89 .88 129 2 -.86 .73 .92 .90 130 2 -.30 .63 .93 .90 131 4 -.69 .67 .95 .96 132 3 -.12 .44 .87 .85 133 7 .26 .65 .95 .94 135 3 -1.12 .64 .94 .93 137 2 .75 .94 .99 .99 138 2 .10 .85 .98 .98 140 4 -1.25 .62 .94 .93 141 2 .39 .87 .98 .98 145 3 -1.00 .63 .94 .93 147 3 .46 .76 .97 .96 148 6 -1.18 .62 .94 .92 150 4 .50 .65 .95 .94 152 2 .18 .81 .98 .97 155 2 -.20 .53 .86 .86 156 2 -.42 .77 .97 .97 157 3 -.26 .19 .23 .32 158 4 .52 .66 .95 .94 159 4 .18 .45 .86 .83 160 4 .01 .05 .00 .00 161 2 .12 .71 .95 .94 163 2 .19 .64 .95 .94 164 9 -.05 .59 .93 .92 165 3 -.12 .42 .86 .84 166 4 -.15 .55 .92 .91 168 4 .51 .30 .80 .78

M-5
Table M-1 (Continued)
Ratee ID Number of
Raters ICC (2,k) Mean rwg rwg for Criterion
Composite
rwg for Criterion Composite
(Excluding Global Overall Potential
Rating)
169 2 .54 .69 .96 .95 170 5 .52 .67 .95 .95 171 5 .76 .63 .94 .93 172 2 .82 .92 .99 .99 173 5 .17 .77 .97 .97 174 2 -.83 .63 .93 .91 175 6 -.21 .38 .80 .77 176 2 -1.49 .57 .91 .89 179 2 1.00 1.00 1.00 1.00 180 3 .11 .28 .60 .43 181 7 .27 .39 .84 .82 182 3 -.08 .44 .79 .70 184 3 .59 .46 .90 .87 187 5 .04 .25 .68 .59 188 2 .14 .73 .96 .96 189 2 -.55 .81 .98 .98 190 2 .12 .69 .96 .95 191 2 .35 .69 .96 .96 192 2 .36 .69 .94 .93 194 4 .20 .53 .92 .92 195 7 -.19 .19 .21 .00 196 3 -.05 .62 .94 .94 197 3 .33 .29 .63 .61 198 4 .16 .68 .95 .95 199 3 .67 .85 .98 .98 201 2 .40 .45 .75 .65 203 2 .40 .89 .99 .99 204 5 -.52 .71 .96 .96 205 5 -.07 .44 .78 .77 206 3 -.16 .42 .75 .64 207 3 .42 .62 .94 .92 208 2 -.25 .34 .79 .77 210 6 .24 .69 .96 .95

M-6
Table M-1 (Continued)
Ratee ID Number of
Raters ICC (2,k) Mean rwg rwg for Criterion
Composite
rwg for Criterion Composite
(Excluding Global Overall Potential
Rating)
213 6 .21 .32 .73 .70 215 5 .24 .52 .90 .88 216 6 .55 .71 .96 .96 218 4 .21 .16 .00 .00 219 4 .31 .35 .82 .80 221 2 .18 .43 .62 .38 222 4 .32 .74 .97 .96 223 2 .62 .89 .99 .98 224 4 .58 .84 .98 .98 225 4 .10 .67 .95 .96 226 3 .35 .54 .90 .88 228 2 -.34 .87 .98 .98 230 4 -.94 .45 .88 .86 231 5 .46 .69 .96 .96 232 7 .20 .60 .94 .93 233 2 .60 .83 .98 .97 236 3 .16 .14 .00 .00 237 5 .13 .61 .92 .90 238 2 .00 .69 .96 .95 239 2 .07 .15 .00 .00 240 5 -.15 .76 .96 .95 242 5 .31 .29 .78 .79 243 3 .17 .55 .93 .91 245 3 .80 .82 .98 .97 246 2 .28 .56 .93 .93 247 3 .18 .40 .87 .87 248 2 .10 .37 .00 .00
Note. “Number of raters” refers to number of raters with non-missing data for the ratee in question.

N-0
Appendix N: Corrected Zero-Order Correlations Between Traditional-
Format ENCAPS Facets and Peer Ratings on Work Performance Dimensions


N-1
Table N-1 Corrected zero-order correlations between Traditional-Format ENCAPS facets and peer ratings on work
performance dimensions
ENCAPS Facet Coop
erat
ing/
Wor
king
Well
with
Oth
ers
Task
Pro
ficien
cy an
d Pr
oduc
tivity
Adap
tabi
lity/
Flex
ibilit
y
Initi
ative
and
Self-
Deve
lopm
ent
Know
ledge
/ Sup
port
of
Unit/
Com
man
d Ob
jectiv
es
Prob
lem S
olvin
g an
d De
cisio
n Ma
king
Inte
grity
/Hon
esty
Wor
k Eth
ic
Com
mun
icatin
g Ef
fect
ively
Over
all P
oten
tial (
Glob
al Ra
ting)
Crite
rion
Com
posit
e (U
nit-W
eight
ed
Com
posit
e)
Adaptability/Flexibility
Willing to Change Task/ Project Approach
.32 .20 .36 .29 .21 .12 .18 .13 .37 .24 .26
Likes Variety .32 .28 .26 .25 .23 .18 .19 .11 .40 .19 .26 Work with Different People -.05 .06 -.15 -.17 -.11 -.12 -.01 -.16 .20 -.01 -.07 Adapt to New Situations .31 .46 .45 .32 .32 .36 .35 .17 .53 .38 .38 Attention to Detail Exacting/Precise .32 .39 .41 .36 .45 .24 .22 .19 .53 .27 .37 Spot Imperfections/Errors .37 .45 .52 .36 .49 .31 .22 .20 .51 .44 .39 Neat/Organized .37 .34 .41 .26 .42 .12 .12 .13 .38 .23 .29 Achievement Ambitious .45 .48 .29 .38 .39 .36 .25 .23 .66 .35 .42 Challenging Goals .22 .20 .02 .04 .02 .04 -.01 -.01 .22 .04 .09 Confident in Abilities .45 .46 .32 .35 .15 .39 .29 .19 .44 .30 .37 Persists Despite Obstacles .22 .31 .15 .16 .08 .06 .17 .04 .20 .04 .17 Strives for Excellence .49 .45 .42 .43 .47 .19 .31 .40 .44 .19 .43 Works Hard/Long Time .28 .42 .39 .38 .19 .25 .18 .23 .51 .28 .34

N-2
Table N-1 (Continued)
ENCAPS Facet Coop
erat
ing/
Wor
king
Well
with
Oth
ers
Task
Pro
ficien
cy an
d Pr
oduc
tivity
Adap
tabi
lity/
Flex
ibilit
y
Initi
ative
and
Self-
Deve
lopm
ent
Know
ledge
/ Sup
port
of
Unit/
Com
man
d Ob
jectiv
es
Prob
lem S
olvin
g an
d De
cisio
n Ma
king
Inte
grity
/Hon
esty
Wor
k Eth
ic
Com
mun
icatin
g Ef
fect
ively
Over
all P
oten
tial (
Glob
al Ra
ting)
Crite
rion
Com
posit
e (U
nit-W
eight
ed
Com
posit
e)
Dependability
Orderly/Planful/Prioritizes .52 .48 .49 .46 .42 .31 .24 .30 .53 .38 .45
Reliable/Efficient with Time .56 .50 .49 .48 .47 .30 .39 .30 .62 .30 .49
Not Easily Distracted/Bored .57 .64 .55 .43 .39 .36 .42 .36 .66 .38 .51
Doesn’t Procrastinate .28 .31 .26 .29 .29 .18 .22 .19 .37 .19 .28
Dutifulness
Sense of Duty/Moral Obligation .19 .28 .15 .07 .05 -.01 .06 .06 .15 .16 .12
Accepts Authority/Follows Rules .25 .39 .32 .19 .18 .16 .17 .13 .47 .07 .26
Honest/Trustworthy/Fulfills Obligations .40 .52 .45 .40 .26 .39 .35 .29 .33 .35 .42
Accepts Responsibility .34 .41 .18 .36 .19 .19 .28 .19 .37 .16 .32
Social Orientation
Affiliation .37 .17 .39 .20 .32 .13 .24 .16 .33 .24 .28
Agreeable .26 .13 .13 .06 .23 .06 .19 .13 .31 .04 .17
Likes Teamwork .25 .15 .32 .13 .21 .00 .12 .13 .40 .05 .18
Team Player .34 .31 .45 .17 .21 .19 .24 .10 .44 .28 .28

N-3
Table N-1 (Continued)
ENCAPS Facet Coop
erat
ing/
Wor
king
Well
with
Oth
ers
Task
Pro
ficien
cy an
d Pr
oduc
tivity
Adap
tabi
lity/
Flex
ibilit
y
Initi
ative
and
Self-
Deve
lopm
ent
Know
ledge
/ Sup
port
of
Unit/
Com
man
d Ob
jectiv
es
Prob
lem S
olvin
g an
d De
cisio
n Ma
king
Inte
grity
/Hon
esty
Wor
k Eth
ic
Com
mun
icatin
g Ef
fect
ively
Over
all P
oten
tial (
Glob
al Ra
ting)
Crite
rion
Com
posit
e (U
nit-W
eight
ed
Com
posit
e)
Self-Reliance
Not Dependent .20 .25 .26 .19 .05 .33 .28 .26 .13 .35 .24
Self-Sufficient/Resourceful .31 .45 .29 .30 .18 .33 .24 .16 .24 .28 .29
Stress Tolerance
Composure .66 .55 .68 .52 .47 .54 .50 .36 .71 .50 .59
Accepts Criticism .11 .01 .02 .01 .02 -.06 -.04 -.13 .29 -.04 .01
Puts Aside Worries/Guilt .25 .13 .13 .12 .18 .04 .17 .04 .20 .11 .14
Willingness to Learn
Willing to Learn/Actively Seeks Learning Opportunities
.51 .31 .28 .38 .39 .12 .33 .26 .62 .28 .38
Learns from Mistakes/ .20 .29 .23 .29 .60 -.06 .19 .11 .38 .19 .26
Takes Good Advice .32 .24 .13 .20 .29 .06 .15 .04 .37 .15 .21
Asks Clarifying Questions .14 .20 .11 .29 .26 .30 .22 .11 .40 .28 .24


O-0
Appendix O: Gender and Race/Ethnicity Differences on ENCAPS Scales


O-1
Table O-1 Gender differences on predictors and criteria
Males Females
Variable n Mean SD n Mean SD d
Traditional ENCAPS Scales
Adaptability/Flexibility 161 3.30 .37 62 3.33 .39 -.07
Attention to Detail 166 3.47 .47 62 3.54 .47 -.16
Achievement 157 3.66 .43 62 3.53 .45 .30
Dependability 160 3.60 .50 62 3.63 .52 -.07
Dutifulness 162 3.59 .38 62 3.71 .32 -.32
Social Orientation 160 3.55 .48 62 3.47 .40 .17
Self-Reliance 162 3.32 .33 62 3.24 .38 .24
Stress Tolerance 162 3.36 .52 62 3.18 .55 .35
Vigilance 163 3.70 .44 61 3.59 .40 .25
Willingness to Learn 160 3.66 .38 61 3.66 .40 .02
Adaptive ENCAPS Scales
Adaptability/Flexibility 163 5.71 .87 60 5.80 .80 -.09
Attention to Detail 163 5.79 .89 60 5.94 .75 -.17
Achievement 163 5.98 .72 60 5.70 .74 .39
Dependability 163 5.79 .99 60 5.83 1.00 -.03
Dutifulness 163 6.08 .81 60 6.16 .65 -.11
Social Orientation 163 5.61 .89 60 5.68 .75 -.08
Self-Reliance 163 5.63 .69 60 5.52 .88 .14
Stress Tolerance 163 5.89 .96 60 5.50 1.09 .39
Vigilance 163 5.94 .88 60 5.71 .94 .26
Willingness to Learn 163 6.25 .77 60 6.27 .63 -.03

O-2
Table O-2 Race/ethnicity differences on predictors and criteria
Whites Blacks
Variable n Mean SD n Mean SD d
Traditional ENCAPS Scales
Adaptability/Flexibility 144 3.30 .41 52 3.32 .29 -.05
Attention to Detail 148 3.48 .51 53 3.52 .41 -.08
Achievement 142 3.65 .46 51 3.56 .39 .21
Dependability 145 3.62 .53 51 3.59 .51 .05
Dutifulness 145 3.62 .39 53 3.64 .34 -.07
Social Orientation 144 3.54 .49 52 3.50 .40 .07
Self-Reliance 145 3.33 .37 52 3.27 .29 .17
Stress Tolerance 146 3.35 .55 52 3.30 .47 .09
Vigilance 147 3.68 .46 51 3.69 .37 -.03
Willingness to Learn 143 3.69 .40 51 3.58 .34 .27
Adaptive ENCAPS Scales
Adaptability/Flexibility 142 5.73 .92 56 5.80 .66 -.08
Attention to Detail 142 5.83 .88 56 5.90 .76 -.08
Achievement 142 5.98 .77 56 5.73 .58 .34
Dependability 142 5.83 1.03 56 5.82 .93 .01
Dutifulness 142 6.12 .81 56 6.16 .70 -.05
Social Orientation 142 5.61 .87 56 5.71 .77 -.12
Self-Reliance 142 5.65 .76 56 5.60 .64 .07
Stress Tolerance 142 5.80 1.04 56 5.83 .88 -.03
Vigilance 142 5.99 .92 56 5.71 .79 .31
Willingness to Learn 142 6.28 .78 56 6.29 .63 -.02

P-0
Appendix P: Adaptive ENCAPS Mean and Cumulative Response
Latencies by Scale and Number of Item-Pairs Presented Using Original and Revised Screening Rules


P-1
Table P-1 Adaptive ENCAPS mean and cumulative response latencies (in seconds) by scale and number of
item-pairs presented
Adaptability/Flexibility (n = 200-212) Attention to Detail (n = 215-217) Achievement (n = 187-208) Dependability (n = 197-208) Item-Pair
Number Mean SD Cumulative
Latency Mean SD Cumulative
Latency Mean SD Cumulative
Latency Mean SD Cumulative
Latency
1 13.79 7.92 13.79 13.07 7.35 13.07 11.44 6.73 11.44 13.99 7.70 13.99
2 12.20 6.68 25.99 11.48 6.14 24.55 1.77 6.56 22.21 13.04 7.13 27.04
3 12.42 6.54 38.41 11.53 5.40 36.08 11.47 6.02 33.68 12.41 6.20 39.44
4 12.09 6.30 5.51 11.79 6.21 47.87 1.29 5.55 43.97 12.49 6.98 51.93
5 11.07 6.08 61.58 11.55 6.24 59.41 1.28 6.17 54.25 12.13 6.33 64.06
6 12.01 6.14 73.59 11.30 5.70 7.71 1.18 5.36 64.43 11.80 5.91 75.86
7 1.78 5.22 84.38 11.00 5.49 81.71 1.32 5.67 74.75 11.05 5.96 86.91
8 11.21 6.49 95.59 1.56 5.47 92.27 1.09 5.86 84.84 1.96 5.18 97.87
9 11.45 6.27 107.04 1.19 4.51 102.47 9.75 5.77 94.59 1.33 5.62 108.20
10 11.13 6.35 118.17 1.45 6.11 112.91 9.81 5.66 104.40 1.62 5.59 118.82
11 1.81 6.70 128.98 9.18 4.77 122.09 9.57 5.38 113.97 1.90 6.90 129.72
12 1.68 5.88 139.66 9.63 5.53 131.72 8.57 5.01 122.54 9.83 5.27 139.56
13 9.86 6.10 149.52 9.50 5.55 141.23 8.62 4.51 131.16 9.87 5.74 149.43
14 1.15 6.41 159.67 8.75 4.76 149.97 8.11 4.46 139.26 9.44 5.65 158.86
15 9.30 5.28 168.96 9.21 5.86 159.18 8.98 5.29 148.25 9.50 5.94 168.37

P-2
Table P-1 (Continued)
Dutifulness (n = 181- 202) Social Orientation (n = 190-205) Self-Reliance (n = 207-213) Stress Tolerance (n = 201-219)
Pair No. Mean SD Cumulative
Latency Mean SD Cumulative
Latency Mean SD Cumulative
Latency Mean SD Cumulative
Latency
1 11.84 6.23 11.84 13.86 8.38 13.86 13.26 6.94 13.26 13.29 8.21 13.29
2 11.68 6.73 23.51 11.33 6.57 25.19 12.29 6.63 25.55 12.29 7.04 25.58
3 11.04 5.91 34.55 11.27 6.64 36.46 12.17 6.62 37.71 12.36 6.05 37.94
4 11.77 6.81 46.32 1.49 5.53 46.95 12.07 6.69 49.79 11.27 5.73 49.21
5 12.07 7.13 58.39 1.02 5.78 56.97 12.60 7.50 62.39 1.66 4.63 59.87
6 11.51 6.36 69.90 1.22 5.61 67.20 12.90 7.27 75.30 11.58 6.32 71.45
7 1.86 5.60 8.75 1.14 5.35 77.34 12.71 6.33 88.01 11.25 6.37 82.70
8 11.59 6.81 92.35 9.87 5.48 87.21 11.77 6.14 99.77 1.54 5.72 93.24
9 1.51 6.72 102.86 9.32 4.66 96.53 11.44 6.20 111.22 1.23 5.22 103.48
10 9.97 5.55 112.83 9.74 5.85 106.27 11.16 6.07 122.38 1.60 6.50 114.07
11 1.29 5.81 123.11 9.29 5.72 115.56 11.52 6.54 133.90 1.01 5.54 124.08
12 9.30 5.64 132.41 8.91 5.17 124.47 1.74 6.13 144.64 9.15 4.79 133.23
13 9.39 5.99 141.81 8.72 4.94 133.20 1.05 5.68 154.70 1.13 6.30 143.36
14 8.93 5.46 15.74 8.47 5.12 141.66 1.77 6.37 165.46 9.22 4.75 152.58
15 8.51 4.13 159.24 8.89 5.74 15.55 1.68 6.25 176.14 8.59 4.90 161.17

P-3
Table P-1 (Continued)
Vigilance (n = 211-222) Willingness to Learn (n = 196-211)
Pair No. Mean SD Cumulative
Latency Mean SD Cumulative
Latency
1 13.07 7.48 13.07 14.36 7.61 14.36
2 12.09 6.85 25.16 12.59 6.88 26.95
3 12.41 6.94 37.57 12.50 6.66 39.45
4 1.89 5.80 48.46 11.28 5.33 5.73
5 11.19 6.06 59.65 11.05 5.88 61.79
6 1.37 5.44 7.02 11.67 5.74 73.45
7 11.34 7.09 81.36 11.05 5.94 84.50
8 1.27 5.40 91.63 11.15 5.68 95.65
9 9.45 4.97 101.08 1.40 5.54 106.05
10 9.01 4.98 11.08 1.44 6.05 116.49
11 9.35 5.24 119.44 9.90 5.61 126.38
12 9.37 5.19 128.81 9.68 4.99 136.07
13 9.03 5.49 137.84 9.62 5.35 145.68
14 7.71 3.62 145.55 9.61 6.12 155.29
15 8.19 4.21 153.74 9.84 5.96 165.13
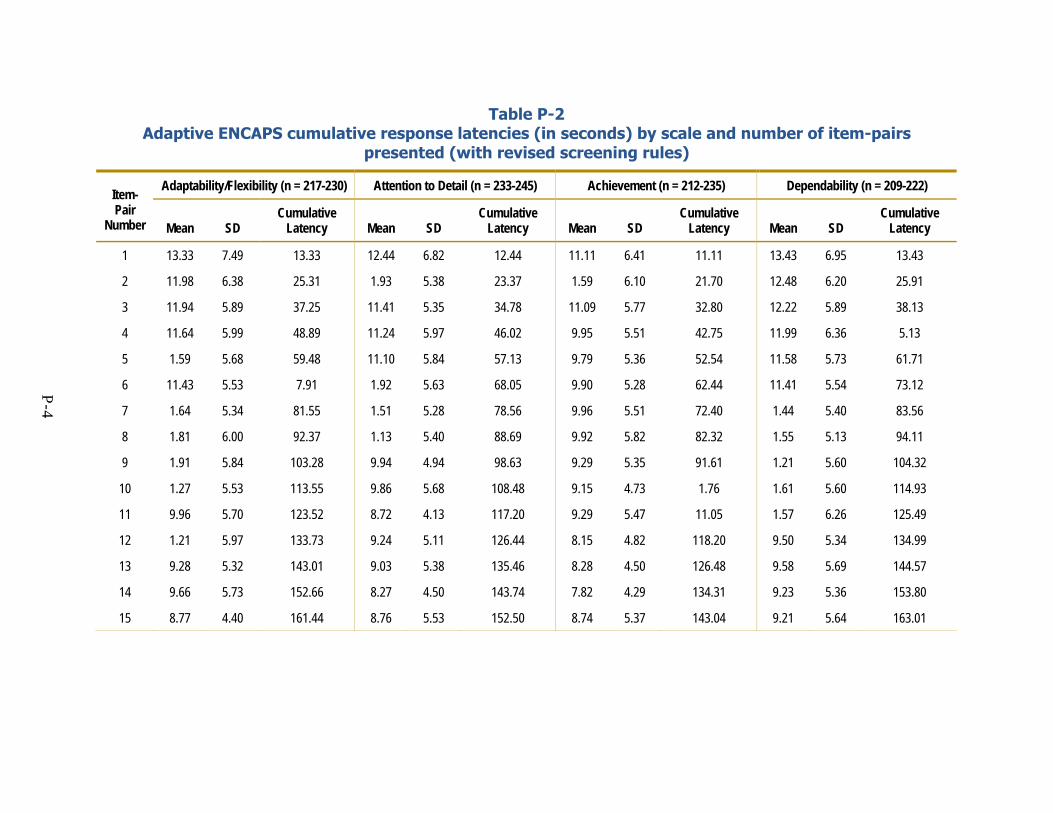
P-4
Table P-2 Adaptive ENCAPS cumulative response latencies (in seconds) by scale and number of item-pairs
presented (with revised screening rules)
Adaptability/Flexibility (n = 217-230) Attention to Detail (n = 233-245) Achievement (n = 212-235) Dependability (n = 209-222) Item-Pair
Number Mean SD Cumulative
Latency Mean SD Cumulative
Latency Mean SD Cumulative
Latency Mean SD Cumulative
Latency
1 13.33 7.49 13.33 12.44 6.82 12.44 11.11 6.41 11.11 13.43 6.95 13.43
2 11.98 6.38 25.31 1.93 5.38 23.37 1.59 6.10 21.70 12.48 6.20 25.91
3 11.94 5.89 37.25 11.41 5.35 34.78 11.09 5.77 32.80 12.22 5.89 38.13
4 11.64 5.99 48.89 11.24 5.97 46.02 9.95 5.51 42.75 11.99 6.36 5.13
5 1.59 5.68 59.48 11.10 5.84 57.13 9.79 5.36 52.54 11.58 5.73 61.71
6 11.43 5.53 7.91 1.92 5.63 68.05 9.90 5.28 62.44 11.41 5.54 73.12
7 1.64 5.34 81.55 1.51 5.28 78.56 9.96 5.51 72.40 1.44 5.40 83.56
8 1.81 6.00 92.37 1.13 5.40 88.69 9.92 5.82 82.32 1.55 5.13 94.11
9 1.91 5.84 103.28 9.94 4.94 98.63 9.29 5.35 91.61 1.21 5.60 104.32
10 1.27 5.53 113.55 9.86 5.68 108.48 9.15 4.73 1.76 1.61 5.60 114.93
11 9.96 5.70 123.52 8.72 4.13 117.20 9.29 5.47 11.05 1.57 6.26 125.49
12 1.21 5.97 133.73 9.24 5.11 126.44 8.15 4.82 118.20 9.50 5.34 134.99
13 9.28 5.32 143.01 9.03 5.38 135.46 8.28 4.50 126.48 9.58 5.69 144.57
14 9.66 5.73 152.66 8.27 4.50 143.74 7.82 4.29 134.31 9.23 5.36 153.80
15 8.77 4.40 161.44 8.76 5.53 152.50 8.74 5.37 143.04 9.21 5.64 163.01

P-5
Table P-2 (Continued)
Dutifulness (n = 200- 221) Social Orientation (n = 216-232) Self-Reliance (n = 225-232) Stress Tolerance (n = 216-236)
Pair No. Mean SD Cumulative
Latency Mean SD Cumulative
Latency Mean SD Cumulative
Latency Mean SD Cumulative
Latency
1 11.74 6.19 11.74 13.03 7.37 13.03 12.95 6.64 12.95 12.69 7.28 12.69
2 11.43 6.39 23.17 1.99 6.21 24.02 11.91 5.93 24.86 11.62 6.14 24.31
3 1.66 5.62 33.82 11.04 6.35 35.06 11.83 6.61 36.69 12.02 5.78 36.32
4 1.88 5.50 44.70 1.29 5.57 45.35 11.64 6.37 48.33 11.19 5.75 47.51
5 11.89 6.94 56.60 9.73 5.65 55.08 12.07 6.43 6.40 1.51 4.64 58.02
6 1.99 6.22 67.59 9.88 5.10 64.96 12.10 6.76 72.51 11.32 6.15 69.34
7 1.41 5.51 78.00 9.82 5.40 74.79 12.31 6.55 84.82 1.72 5.75 8.06
8 11.01 6.26 89.01 9.40 5.32 84.19 11.19 5.42 96.01 1.47 5.61 9.54
9 1.02 6.15 99.03 8.94 4.78 93.13 11.00 5.86 107.01 9.89 4.95 1.42
10 9.34 5.36 108.37 9.18 5.31 102.31 1.72 5.96 117.72 1.37 6.23 11.80
11 9.67 5.39 118.03 8.57 5.14 11.88 1.96 6.34 128.69 9.70 5.37 12.49
12 8.82 5.57 126.86 8.30 4.87 119.18 1.46 5.96 139.14 8.82 4.43 129.32
13 9.28 6.16 136.13 8.19 4.94 127.37 9.57 5.70 148.72 9.80 6.24 139.12
14 8.67 5.42 144.81 8.19 5.36 135.56 1.29 6.24 159.01 8.91 4.83 148.03
15 8.20 4.14 153.01 8.35 5.14 143.92 1.37 6.64 169.39 8.37 5.00 156.40

P-6
Table P-2 (continued)
Vigilance (n = 224-236) Willingness to Learn (n = 217-235)
Pair No. Mean SD Cumulative
Latency Mean SD Cumulative
Latency
1 12.50 6.31 12.50 14.07 7.12 14.07
2 11.95 6.52 24.46 11.84 6.15 25.91
3 12.13 6.69 36.59 12.27 6.75 38.18
4 1.67 5.71 47.26 11.08 5.20 49.26
5 11.10 6.04 58.36 1.98 5.95 6.24
6 1.14 5.10 68.50 11.56 6.25 71.81
7 11.02 6.59 79.53 1.76 6.07 82.56
8 1.14 5.33 89.67 1.55 5.34 93.11
9 9.43 4.81 99.10 1.09 5.61 103.20
10 8.93 4.87 108.03 9.82 5.46 113.02
11 9.15 5.24 117.18 9.43 5.45 122.44
12 9.38 5.54 126.56 9.29 5.29 131.73
13 8.77 4.93 135.33 9.45 5.44 141.19
14 7.79 4.01 143.12 8.94 5.27 15.13
15 8.06 4.18 151.19 9.34 5.67 159.47

Q-0
Appendix Q: Item-Level Response Latencies for Traditional ENCAPS


Q-1
Table Q-1 Item-level response latencies for Traditional ENCAPS
Response Latencies With Extreme Latencies Omitted Item Number Mean SD
1 13.75 6.58 2 6.57 3.33 3 7.73 3.91 4 7.28 3.87 5 7.68 3.98 6 10.85 5.33 7 7.70 3.68 8 5.59 3.28 9 11.90 5.91
10 6.60 3.15 11 7.26 3.77 12 8.01 5.40 13 6.91 3.64 14 7.76 4.64 15 9.30 5.23 16 9.30 5.34 17 8.68 4.20 18 8.09 3.27 19 4.92 2.15 20 6.76 3.36 21 8.43 4.67 22 6.25 3.03 23 9.68 5.24 24 8.56 4.97 25 7.74 3.52 26 6.96 4.17 27 10.96 6.70 28 9.22 4.27 29 5.51 2.97 30 10.77 5.90 31 10.28 5.22 32 8.42 4.30 33 9.98 5.40 34 8.81 4.93 35 10.59 5.70

Q-2
Table Q-1 (Continued)
Response Latencies With Extreme Latencies Omitted Item Number Mean SD
36 5.27 3.25 37 11.60 6.41 38 6.58 3.47 39 6.89 4.18 40 5.61 2.95 41 10.59 5.48 42 5.09 3.16 43 7.20 4.34 44 8.59 4.23 45 6.58 3.51 46 7.32 3.71 47 5.86 3.38 48 10.43 6.29 49 6.23 4.02 50 9.42 5.41 51 6.61 3.66 52 8.00 3.57 53 7.75 4.29 54 8.04 5.28 55 7.74 4.84 56 6.09 3.05 57 6.51 4.04 58 7.79 4.71 59 8.69 4.91 60 8.44 3.85 61 6.31 2.56 63 11.76 6.29 64 9.65 5.50 65 7.34 4.22 66 7.60 3.64 67 5.91 3.40 68 5.73 3.13 69 6.32 3.71 70 8.96 5.32

Q-3
Table Q-1 (Continued)
Response Latencies With Extreme Latencies Omitted Item Number Mean SD
71 12.30 6.21 72 6.78 3.49 73 8.37 4.71 74 5.25 3.52 75 6.18 3.28 76 8.16 4.36 77 6.04 3.04 78 6.07 3.39 79 7.72 3.79 80 7.38 3.74 81 6.11 3.35 82 7.09 3.64 83 8.31 5.18 84 7.83 4.21 85 10.55 5.47 86 5.70 2.89 87 8.54 5.07 88 11.28 6.09 89 8.41 4.19 90 8.99 4.75 91 9.40 5.90 92 5.42 3.65 93 8.34 4.78 94 8.53 4.43 95 9.44 5.03 96 4.73 2.34 97 4.77 3.02 98 6.88 4.08 99 4.38 2.33
100 6.93 4.06 101 6.53 3.34 102 8.92 5.07 103 6.35 3.29 104 6.42 3.00

Q-4
Table Q-1 (Continued)
Response Latencies With Extreme Latencies Omitted Item Number Mean SD
105 6.71 3.26 106 9.01 5.01 107 9.49 5.23 108 8.97 4.79 109 7.48 4.25 110 8.51 5.61 111 5.79 2.99 112 5.74 2.67 113 7.83 4.37 114 9.03 5.08 115 9.10 5.22 116 9.97 5.56 117 11.31 5.65 118 5.83 2.78 119 5.89 2.89 120 9.62 5.34 121 8.66 5.02 122 9.95 5.05 123 10.00 5.39 124 5.99 3.60 125 9.43 5.59 126 4.92 3.17 127 7.60 4.19 128 7.12 3.63 129 5.78 3.80 130 8.35 4.56 131 8.48 5.01 132 5.50 3.71 133 4.89 2.11 134 7.78 4.65 136 8.67 4.41 137 7.85 4.21 138 6.92 3.73 139 8.79 4.54

Q-5
Table Q-1 (Continued)
Response Latencies With Extreme Latencies Omitted Item Number Mean SD
140 10.36 5.35 141 9.61 4.80 142 6.53 4.01 143 7.90 4.68 144 8.04 4.20 145 9.12 4.93 146 6.58 3.03 147 8.31 5.26 148 8.07 4.65 149 5.59 2.77 150 5.46 2.78 151 8.57 4.52 152 6.53 3.79 153 8.09 4.71 154 7.66 4.23 155 9.18 5.46 156 9.00 5.68 157 8.87 4.67 158 9.45 5.22 159 5.12 2.95 160 9.24 5.87 161 6.88 3.88 162 4.54 2.72 163 10.86 5.65 164 10.03 5.39 165 8.93 5.54 166 5.25 3.16 167 8.45 4.68 168 8.54 4.45 169 5.21 4.05 170 8.74 5.53 171 4.96 2.57 172 6.46 2.98 173 5.53 2.71

Q-6
Table Q-1(Continued)
Response Latencies With Extreme Latencies Omitted Item Number Mean SD
174 6.25 4.00 175 7.00 3.04 176 5.50 2.89 177 4.66 2.57 178 7.01 4.43 179 6.03 3.86 180 6.32 3.76 181 4.37 2.33 182 8.57 5.71 183 8.17 4.53 184 6.35 3.32 185 8.61 5.37 186 3.63 2.17 187 10.21 5.76 188 4.14 2.23 189 5.61 3.11 190 7.19 3.80 191 6.71 3.81 192 5.58 2.54 193 4.71 3.14 194 6.10 4.05 196 8.25 4.95 197 6.94 3.68 198 7.50 3.97 199 6.07 2.45 200 6.88 3.55 201 6.46 2.95 202 4.16 2.35 203 9.32 5.71 204 4.78 2.77 205 8.73 5.00
Note. n = 274-298. ”Extreme Latencies” are defined as item responses taking less than 2 seconds or more than 40 seconds.

Distribution
AIR UNIVERSITY LIBRARY ARMY MANAGEMENT STAFF COLLEGE LIBRARY ARMY RESEARCH INSTITUTE LIBRARY ARMY WAR COLLEGE LIBRARY CENTER FOR NAVAL ANALYSES LIBRARY DEFENSE TECHNICAL INFORMATION CENTER HUMAN RESOURCES DIRECTORATE TECHNICAL LIBRARY JOINT FORCES STAFF COLLEGE LIBRARY MARINE CORPS UNIVERSITY LIBRARIES NATIONAL DEFENSE UNIVERSITY LIBRARY NAVAL HEALTH RESEARCH CENTER WILKINS BIOMEDICAL LIBRARY NAVAL POSTGRADUATE SCHOOL DUDLEY KNOX LIBRARY NAVAL RESEARCH LABORATORY RUTH HOOKER RESEARCH LIBRARY NAVAL WAR COLLEGE LIBRARY NAVY PERSONNEL RESEARCH, STUDIES, AND TECHNOLOGY SPISHOCK
LIBRARY (3) PENTAGON LIBRARY USAF ACADEMY LIBRARY US COAST GUARD ACADEMY LIBRARY US MERCHANT MARINE ACADEMY BLAND LIBRARY US MILITARY ACADEMY AT WEST POINT LIBRARY US NAVAL ACADEMY NIMITZ LIBRARY


![Personality and Preference Modeling for Adaptive Storytelling€¦ · approach, Seif El -Nasr [8] presents an interactive storytelling system where both player behavior and personality](https://img.pdfslide.us/doc/110x75/5fd98d9e0d486e30bb329352/personality-and-preference-modeling-for-adaptive-approach-seif-el-nasr-8-presents.jpg)