Embed Size (px)
Citation preview
Intercultural Communication Studies VXII: 3 2008 Song
Development of the Internet and Digital Divide in China: A Spatial Analysis
Wei Song, University of Louisville
We are in an era in which the nature of work, as measured by the industrial or occupational structure of economies, is changing dramatically, and in which the sources of income and wealth to those who create demand are shifting. The information age we currently inhabit refers to the preeminence of information as the defining component in many of the economic, social, and political actions that shape our lives (Wilson and Corey, 2000). Changes in economic systems are being fueled by the development of networks of communication. By the products and industries they directly generate, through the structural transformation they permit and provoke, information and communication technologies (ICTs) have become a powerful agent of economic development.
Digital Divide
As claimed by Beyers (2000), information-oriented businesses are, to a growing extent, forming the prime basis for future economic development in world regions. At national and international scales, information and telecommunication technologies form a fundamental part of the social and economic changes around the world, and have reconfigured the structure of social relations and the rhythms of everyday life. Studies have showed that the Internet has contributed to the expansion of civil society by pluralizing public discourse, extending the public sphere and mobilizing collective actions (Chu & Tang, 2005). Malecki (2002) suggested that urban competitiveness is sustained by networks, gathering knowledge via social interactions (soft networks) and, to a growing degree, the technological capability plugging into the Internet (hard networks). To be effective, these networks need to operate at the global, national, regional and local scales. Many international bodies and agencies such as the World Bank are also embracing information technology. Telecommunication and the Internet in particular are considered promising vehicles for development of the least developed countries (Morrison, 2000). At the local scale, digital networks have contributed to a substantial reconstruction of urban space within cities (Graham & Marvin, 1996; Mitchell, 1995), including telecommuting, the on-line provision of private and public services, entertainment, and public and private information of multiple forms. In such an environment, “being digital” is increasingly critical to knowledge, wealth, status, and power (Warf, 2001).
Despite the mythology of equal access for everyone and the stereotype that the Internet eliminates space, overcoming the friction of distance (Cairncross, 1997), the reality of the world’s established and emerging information societies, however, clearly points to the opposite. The current transformation, based on the diffusion of electronics-based systems, has not, and will not, rejuvenate all economies automatically, nor will it benefit all countries equally. Significant and troubling digital divides and vast discrepancies in access to the Internet exist at various geographical scales. The digital divide was early defined as the divide separating “information haves” and “information have-nots” (NTAI, 2000). The concept has
20
Intercultural Communication Studies VXII: 3 2008 Song
since been expanded to involve "the gap between those who have access to and can effectively use information technologies and those who cannot" (Wilhelm, 2001). The American Library Association now uses the concept to characterize differences in access to information through the Internet and other information technologies and services in the knowledge, skills, and abilities to use information, due to geography, race, economic status, gender, and physical ability (American Library Association, 2002). Selwyn (2002) and DiMaggio and Hargittai (2002) suggested that the digital divide should be constructed in more sophisticated terms. Selwyn defined the digital divide in the context of three basic forms of “technological capital” (economic capital, cultural capital, and social capital). Norris (2001) reframed the digital divide along three distinct aspects. The global divide refers to the divergence of Internet access between industrialized and developing societies. The social divide concerns the gap between information rich and poor in each nation. And lastly, the democratic divide signifies the difference between those who do, and do not, use digital resources to engage, mobilize and participate in public life.
The emergence of information-based economy has led to a new round of uneven development and spatial inequality. The global divide is manifested by the greatest Internet access in the most economically developed parts of the world, primarily North America, Europe, and Japan, with the hegemony of the U.S. particularly notable (Warf, 1995, 2001; Brunn & Dodge, 2001; Hargittai & Centeno, 2001; Townsend, 2001; Zook, 2001). The social divide is apparent concerning access on multiple dimensions – gender, age, household income, education, and race (Katz, Rice & Aspden, 2001). Socio-demographic factors are widely regarded as the leading causes of the digital divide. In the U.S., groups with higher incomes and better education, particularly whites, are in an advantaged position in adopting newer information and communication technologies (Warf, 2001). It has been pointed out that the Internet currently provides reinforcement rather than dispersion of power and patterns of gendered, racial, and occupational segregation within society (Tyner, 1998; Crowther, 2000; Lindsay, 2005). These social inequalities are clearly matched by geographical disparities (Warf, 2001; Bosman & Chakraborty, 2002; Chakraborty & Bosman, 2005). In many cases, information technologies have reinforced centralizing tendencies of large metropolitan areas where dominant shares of telecom infrastructure are maintained (Kitchin, 1998; Wheeler & O’Kelly, 1999; Graham, 2001; Grubesic & O’Kelly, 2002; Hwang, 2004), while peripheral, rural areas become increasingly disconnected from the opportunities presented by the new digital economy (Grimes, 2003).
Brunn (2000) proposed the concept of the electronic state which refers to those states that are already wired to the Internet or those proposing to implement and diffuse these technologies through a series of information highways. A tightly integrated electronic state would be one in which the above technologies are available. Further, a critical and equally important issue surrounding the concept of the electronic state is the spectrum of inclusion. An electronic state at one end of the spectrum could be one in which peripheral and core areas, rich and poor sections, and creative and laggard regions are equally connected or networked, so that all benefit from the introduction and diffusion of new goods and services in a nation. Another electronic state, at the other extreme of the spectrum, could only include those centers of wealth, corporate offices, military, and state power, while smaller and less important places on the economic and political map are excluded or perhaps only partially planned for inclusion by those with the power, prestige, and money.
21
Intercultural Communication Studies VXII: 3 2008 Song
Under the broad theoretical framework of digital divide, this paper will examine the development of information and communication technologies and the digital divide in China. Over the past decades, there has been an explosion in the development and use of information and communication technologies in China. Before the 1980s, today’s Internet activity was far beyond people’s imagination. It was not until 1987, when China successfully sent out its first email to Germany that the world’s most populous country stepped into the Internet era (Jing, 2007). Two decades have passed since that historical day, and Internet use has grown at an astonishing speed in China. A span of two decades is a short time for a country with a history of 5,000 years, but those 20 years appear destined to make a major difference in the nation, and have drastically transformed Chinese society. The Internet has contributed to China's economic development, and the new economy is transforming China's traditional production and consumption modes. China’s economy has been boosted by and become increasingly restructured around information technologies. In the social and political realm, the Internet has changed the way information is disseminated and received, and it has helped promote Chinese people’s enthusiasm for public participation. The right to know the truth, something that used to be unfamiliar to the Chinese people, has become increasingly popular, helping to foster a more democratic society. However, as the most populous and the largest developing country in the world, China faces a severe digital divide, which exists not only in the international context between China and developed nations, but also internally among its own regions and social groups. Like many other indicators of development, wide gaps exist between Chinese ICT “haves” and “have-nots.”
Based on data from China Statistical Yearbooks and Semiannual Survey Reports on Internet Development in China, this study investigates China’s digital divide related to the national system of supply and demand for Internet content, with a special focus on the geographical dimension. Specifically, using Internet user counts and the number of domain names, as well as the combination of the two indicators, an assessment of the spatial divide in the distribution of Internet content creation and demand for Internet services will be surveyed at the provincial and regional levels. Longitudinal analyses will also be conducted to examine the dynamics in the provincial and regional disparities to determine if the digital divide in China is shrinking or widening.
The rest of the paper is organized into four sections. The first section provides a brief overview of China’s development in information and telecommunication technologies and in particular the Internet. Results of the empirical analyses of China’s spatial divide in the Internet usage and the web of production will be detailed in the second section, followed by a typology of provinces and municipalities based on the functioning of Internet activities. Concluding remarks, implications, and future studies will be presented in the final section.
Telecommunication and the Internet in China: Development and the Intensification of Interactions
Over the past two decades, there has been an explosion in the use of information and
communications technologies in China. As early as the 1990s, the Chinese government identified expansion of China’s information and communications infrastructure and its usage as a key component of the national economic growth strategy (Harrington, 2007). To encourage competition, the government broke up the state-owned telecom monopoly, China
22
Intercultural Communication Studies VXII: 3 2008 Song
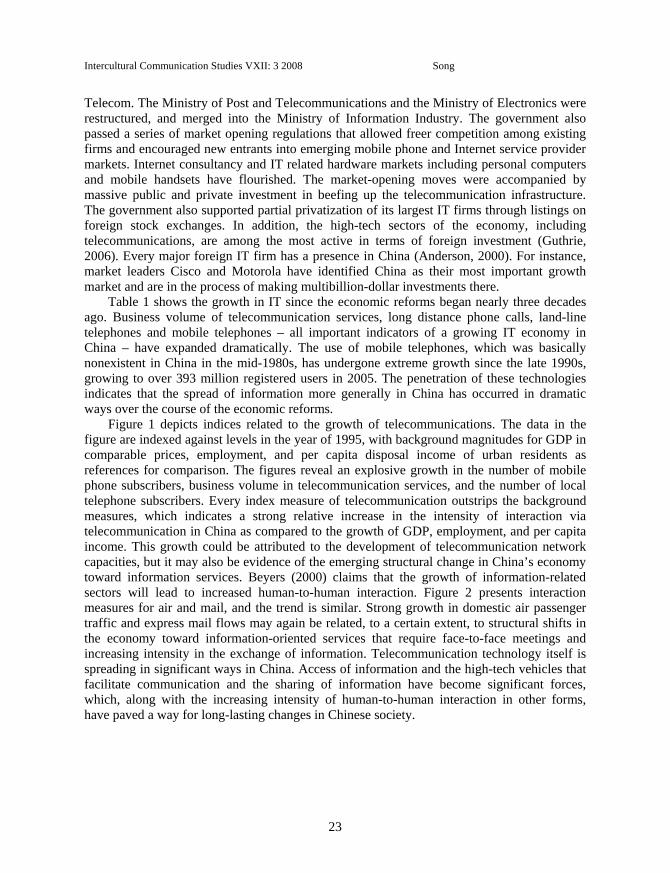
Telecom. The Ministry of Post and Telecommunications and the Ministry of Electronics were restructured, and merged into the Ministry of Information Industry. The government also passed a series of market opening regulations that allowed freer competition among existing firms and encouraged new entrants into emerging mobile phone and Internet service provider markets. Internet consultancy and IT related hardware markets including personal computers and mobile handsets have flourished. The market-opening moves were accompanied by massive public and private investment in beefing up the telecommunication infrastructure. The government also supported partial privatization of its largest IT firms through listings on foreign stock exchanges. In addition, the high-tech sectors of the economy, including telecommunications, are among the most active in terms of foreign investment (Guthrie, 2006). Every major foreign IT firm has a presence in China (Anderson, 2000). For instance, market leaders Cisco and Motorola have identified China as their most important growth market and are in the process of making multibillion-dollar investments there.
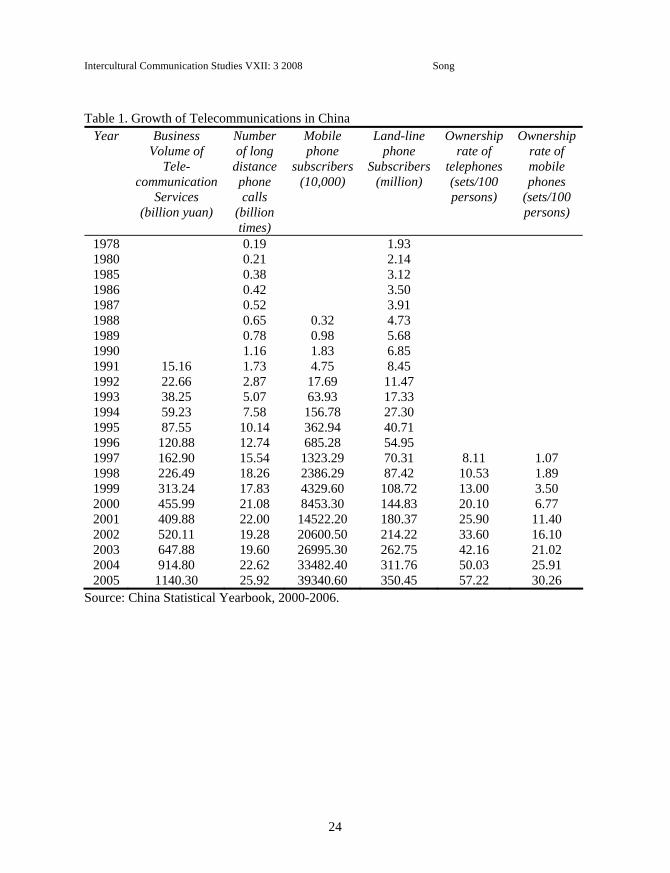
Table 1 shows the growth in IT since the economic reforms began nearly three decades ago. Business volume of telecommunication services, long distance phone calls, land-line telephones and mobile telephones – all important indicators of a growing IT economy in China – have expanded dramatically. The use of mobile telephones, which was basically nonexistent in China in the mid-1980s, has undergone extreme growth since the late 1990s, growing to over 393 million registered users in 2005. The penetration of these technologies indicates that the spread of information more generally in China has occurred in dramatic ways over the course of the economic reforms.
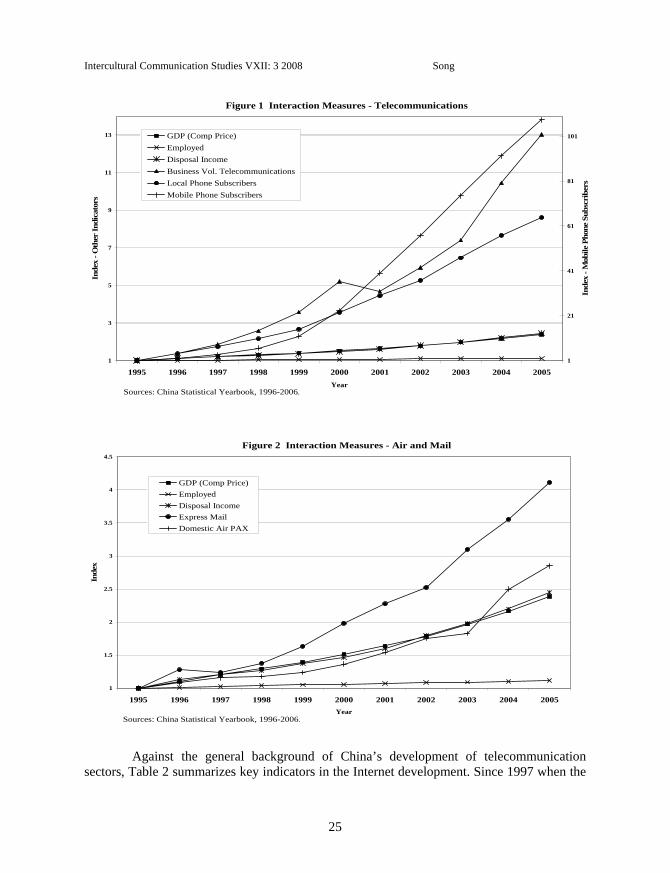
Figure 1 depicts indices related to the growth of telecommunications. The data in the figure are indexed against levels in the year of 1995, with background magnitudes for GDP in comparable prices, employment, and per capita disposal income of urban residents as references for comparison. The figures reveal an explosive growth in the number of mobile phone subscribers, business volume in telecommunication services, and the number of local telephone subscribers. Every index measure of telecommunication outstrips the background measures, which indicates a strong relative increase in the intensity of interaction via telecommunication in China as compared to the growth of GDP, employment, and per capita income. This growth could be attributed to the development of telecommunication network capacities, but it may also be evidence of the emerging structural change in China’s economy toward information services. Beyers (2000) claims that the growth of information-related sectors will lead to increased human-to-human interaction. Figure 2 presents interaction measures for air and mail, and the trend is similar. Strong growth in domestic air passenger traffic and express mail flows may again be related, to a certain extent, to structural shifts in the economy toward information-oriented services that require face-to-face meetings and increasing intensity in the exchange of information. Telecommunication technology itself is spreading in significant ways in China. Access of information and the high-tech vehicles that facilitate communication and the sharing of information have become significant forces, which, along with the increasing intensity of human-to-human interaction in other forms, have paved a way for long-lasting changes in Chinese society.
23
Intercultural Communication Studies VXII: 3 2008 Song
Table 1. Growth of Telecommunications in China
Source: China Statistical Yearbook, 2000-2006.
Year Business Volume of
Tele-communication
Services (billion yuan)
Number of long
distance phone calls
(billion times)
Mobile phone
subscribers (10,000)
Land-line phone
Subscribers (million)
Ownership rate of
telephones (sets/100 persons)
Ownership rate of mobile phones
(sets/100 persons)
1978 0.19 1.93 1980 0.21 2.14 1985 0.38 3.12 1986 0.42 3.50 1987 0.52 3.91 1988 0.65 0.32 4.73 1989 0.78 0.98 5.68 1990 1.16 1.83 6.85 1991 15.16 1.73 4.75 8.45 1992 22.66 2.87 17.69 11.47 1993 38.25 5.07 63.93 17.33 1994 59.23 7.58 156.78 27.30 1995 87.55 10.14 362.94 40.71 1996 120.88 12.74 685.28 54.95 1997 162.90 15.54 1323.29 70.31 8.11 1.07 1998 226.49 18.26 2386.29 87.42 10.53 1.89 1999 313.24 17.83 4329.60 108.72 13.00 3.50 2000 455.99 21.08 8453.30 144.83 20.10 6.77 2001 409.88 22.00 14522.20 180.37 25.90 11.40 2002 520.11 19.28 20600.50 214.22 33.60 16.10 2003 647.88 19.60 26995.30 262.75 42.16 21.02 2004 914.80 22.62 33482.40 311.76 50.03 25.91 2005 1140.30 25.92 39340.60 350.45 57.22 30.26
24
Intercultural Communication Studies VXII: 3 2008 Song
Figure 1 Interaction Measures - Telecommunications
1
3
5
7
9
11
13
1995 1996 1997 1998 1999 2000 2001 2002 2003 2004 2005Year
Inde
x - O
ther
Indi
cato
rs
1
21
41
61
81
101
Inde
x - M
obile
Pho
ne S
ubsc
ribe
rs
GDP (Comp Price)EmployedDisposal IncomeBusiness Vol. TelecommunicationsLocal Phone SubscribersMobile Phone Subscribers
Sources: China Statistical Yearbook, 1996-2006.
Figure 2 Interaction Measures - Air and Mail
1
1.5
2
2.5
3
3.5
4
4.5
1995 1996 1997 1998 1999 2000 2001 2002 2003 2004 2005Year
Inde
x
GDP (Comp Price)EmployedDisposal IncomeExpress MailDomestic Air PAX
Sources: China Statistical Yearbook, 1996-2006.
Against the general background of China’s development of telecommunication sectors, Table 2 summarizes key indicators in the Internet development. Since 1997 when the
25
Intercultural Communication Studies VXII: 3 2008 Song
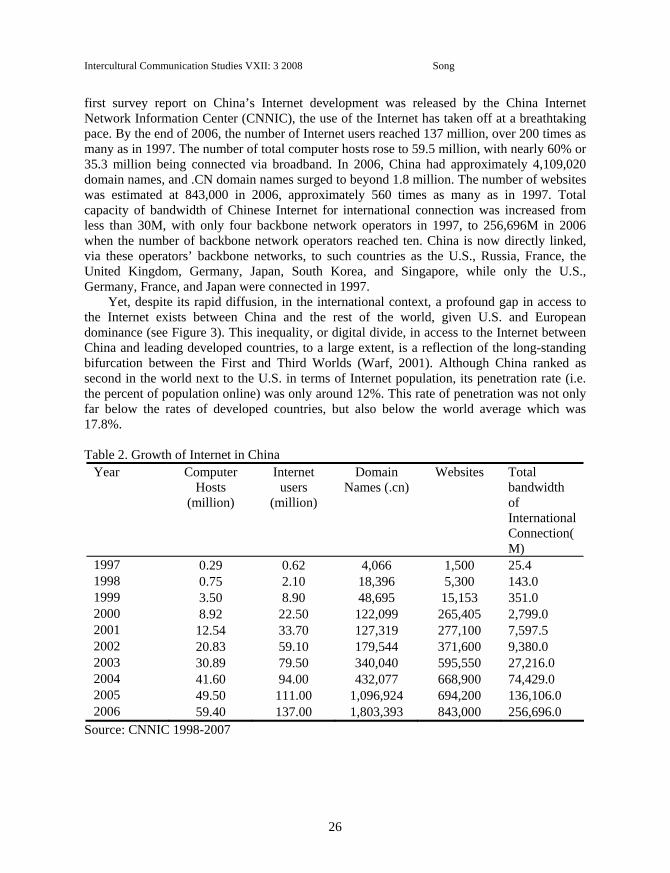
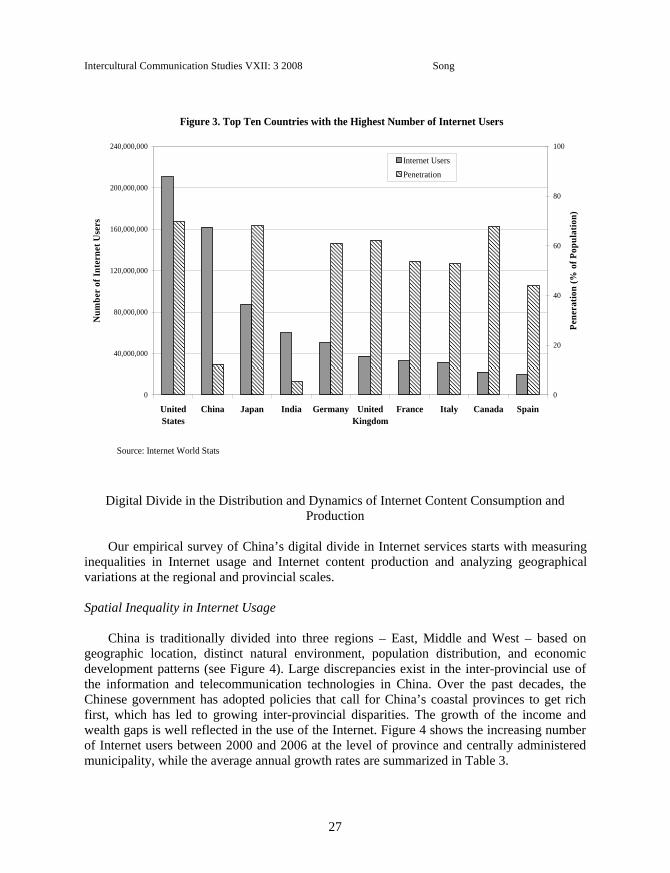
first survey report on China’s Internet development was released by the China Internet Network Information Center (CNNIC), the use of the Internet has taken off at a breathtaking pace. By the end of 2006, the number of Internet users reached 137 million, over 200 times as many as in 1997. The number of total computer hosts rose to 59.5 million, with nearly 60% or 35.3 million being connected via broadband. In 2006, China had approximately 4,109,020 domain names, and .CN domain names surged to beyond 1.8 million. The number of websites was estimated at 843,000 in 2006, approximately 560 times as many as in 1997. Total capacity of bandwidth of Chinese Internet for international connection was increased from less than 30M, with only four backbone network operators in 1997, to 256,696M in 2006 when the number of backbone network operators reached ten. China is now directly linked, via these operators’ backbone networks, to such countries as the U.S., Russia, France, the United Kingdom, Germany, Japan, South Korea, and Singapore, while only the U.S., Germany, France, and Japan were connected in 1997.
Yet, despite its rapid diffusion, in the international context, a profound gap in access to the Internet exists between China and the rest of the world, given U.S. and European dominance (see Figure 3). This inequality, or digital divide, in access to the Internet between China and leading developed countries, to a large extent, is a reflection of the long-standing bifurcation between the First and Third Worlds (Warf, 2001). Although China ranked as second in the world next to the U.S. in terms of Internet population, its penetration rate (i.e. the percent of population online) was only around 12%. This rate of penetration was not only far below the rates of developed countries, but also below the world average which was 17.8%. Table 2. Growth of Internet in China
Year Computer Hosts
(million)
Internet users
(million)
Domain Names (.cn)
Websites Total bandwidth of International Connection(M)
1997 0.29 0.62 4,066 1,500 25.4 1998 0.75 2.10 18,396 5,300 143.0 1999 3.50 8.90 48,695 15,153 351.0 2000 8.92 22.50 122,099 265,405 2,799.0 2001 12.54 33.70 127,319 277,100 7,597.5 2002 20.83 59.10 179,544 371,600 9,380.0 2003 30.89 79.50 340,040 595,550 27,216.0 2004 41.60 94.00 432,077 668,900 74,429.0 2005 49.50 111.00 1,096,924 694,200 136,106.0 2006 59.40 137.00 1,803,393 843,000 256,696.0
Source: CNNIC 1998-2007
26
Intercultural Communication Studies VXII: 3 2008 Song
Figure 3. Top Ten Countries with the Highest Number of Internet Users
0
40,000,000
80,000,000
120,000,000
160,000,000
200,000,000
240,000,000
UnitedStates
China Japan India Germany UnitedKingdom
France Italy Canada Spain
Num
ber
of In
tern
et U
sers
0
20
40
60
80
100
Pene
ratio
n (%
of P
opul
atio
n)
Internet UsersPenetration
Source: Internet World Stats
Digital Divide in the Distribution and Dynamics of Internet Content Consumption and Production
Our empirical survey of China’s digital divide in Internet services starts with measuring
inequalities in Internet usage and Internet content production and analyzing geographical variations at the regional and provincial scales. Spatial Inequality in Internet Usage
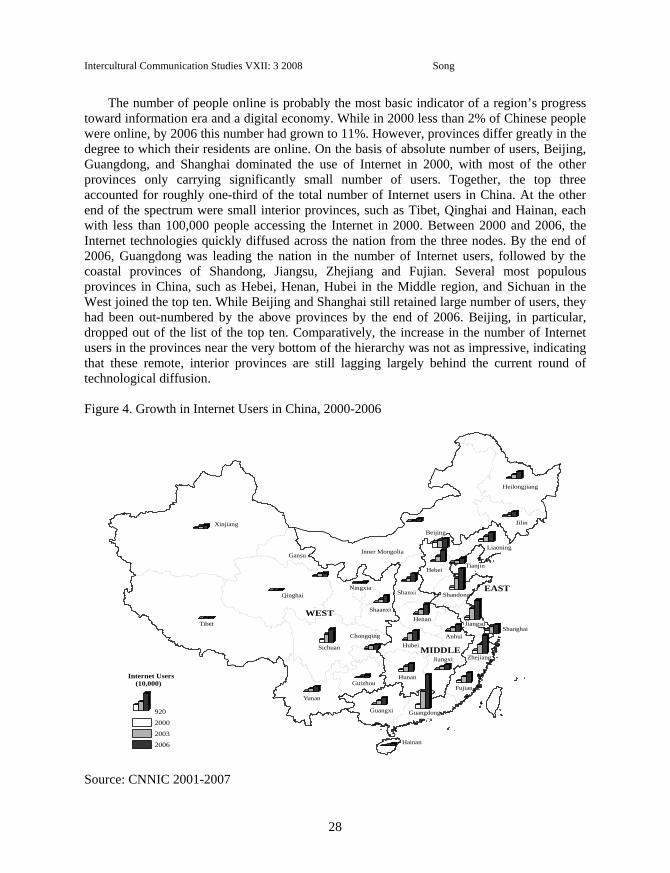
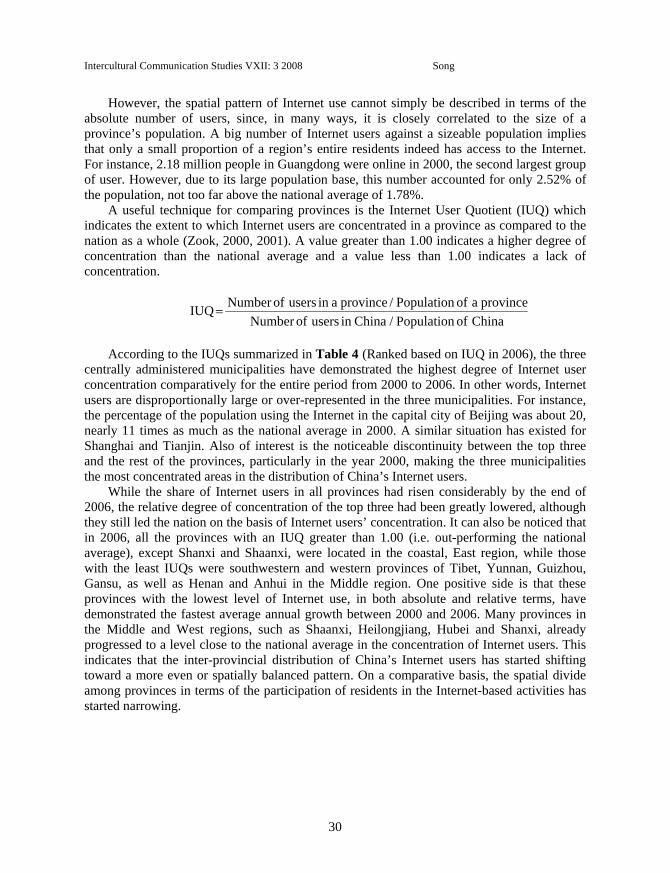
China is traditionally divided into three regions – East, Middle and West – based on geographic location, distinct natural environment, population distribution, and economic development patterns (see Figure 4). Large discrepancies exist in the inter-provincial use of the information and telecommunication technologies in China. Over the past decades, the Chinese government has adopted policies that call for China’s coastal provinces to get rich first, which has led to growing inter-provincial disparities. The growth of the income and wealth gaps is well reflected in the use of the Internet. Figure 4 shows the increasing number of Internet users between 2000 and 2006 at the level of province and centrally administered municipality, while the average annual growth rates are summarized in Table 3.
27
Intercultural Communication Studies VXII: 3 2008 Song
The number of people online is probably the most basic indicator of a region’s progress toward information era and a digital economy. While in 2000 less than 2% of Chinese people were online, by 2006 this number had grown to 11%. However, provinces differ greatly in the degree to which their residents are online. On the basis of absolute number of users, Beijing, Guangdong, and Shanghai dominated the use of Internet in 2000, with most of the other provinces only carrying significantly small number of users. Together, the top three accounted for roughly one-third of the total number of Internet users in China. At the other end of the spectrum were small interior provinces, such as Tibet, Qinghai and Hainan, each with less than 100,000 people accessing the Internet in 2000. Between 2000 and 2006, the Internet technologies quickly diffused across the nation from the three nodes. By the end of 2006, Guangdong was leading the nation in the number of Internet users, followed by the coastal provinces of Shandong, Jiangsu, Zhejiang and Fujian. Several most populous provinces in China, such as Hebei, Henan, Hubei in the Middle region, and Sichuan in the West joined the top ten. While Beijing and Shanghai still retained large number of users, they had been out-numbered by the above provinces by the end of 2006. Beijing, in particular, dropped out of the list of the top ten. Comparatively, the increase in the number of Internet users in the provinces near the very bottom of the hierarchy was not as impressive, indicating that these remote, interior provinces are still lagging largely behind the current round of technological diffusion.
Figure 4. Growth in Internet Users in China, 2000-2006
Internet Users (10,000)
920
2000
2003
2006
MIDDLE
EAST
WEST
Beijing
Tianjin
Shanghai
Heilongjiang
Jilin
Inner MongoliaLiaoning
Hebei
Jiangsu
Zhejiang
Fujian
Shandong
GuangdongGuangxi
Hainan
Yunan
Guizhou
Henan
Shanxi
Hubei
Hunan
Jiangxi
Anhui
Sichuan
Chongqing
Tibet
Qinghai
Gansu
Ningxia
Shaanxi
Xinjiang
Source: CNNIC 2001-2007
28
Intercultural Communication Studies VXII: 3 2008 Song
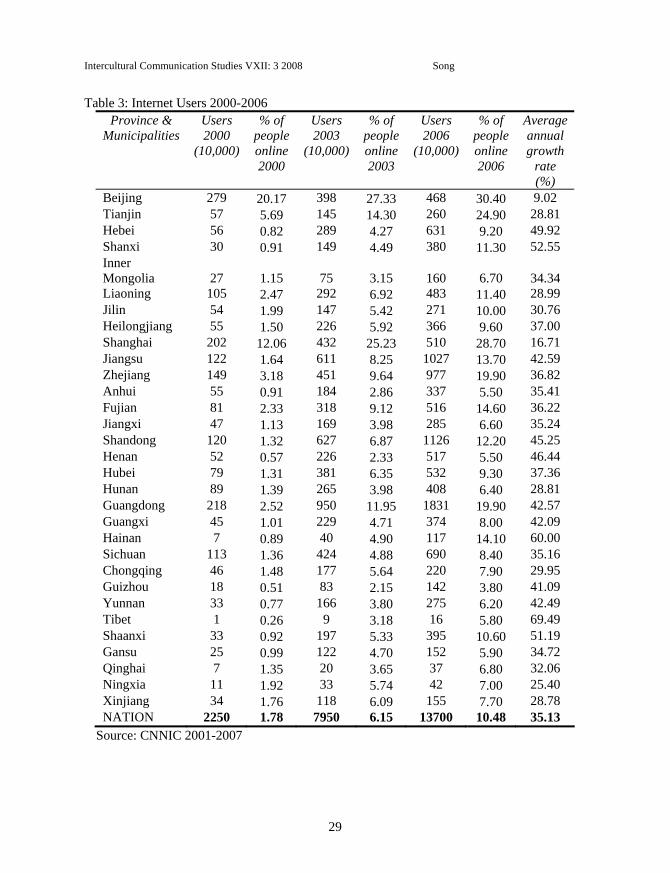
Table 3: Internet Users 2000-2006 Province &
Municipalities Users 2000
(10,000)
% of people online 2000
Users 2003
(10,000)
% of people online 2003
Users 2006
(10,000)
% of people online 2006
Average annual growth
rate (%)
Beijing 279 20.17 398 27.33 468 30.40 9.02 Tianjin 57 5.69 145 14.30 260 24.90 28.81 Hebei 56 0.82 289 4.27 631 9.20 49.92 Shanxi 30 0.91 149 4.49 380 11.30 52.55 Inner Mongolia
27 1.15
75 3.15
160 6.70
34.34
Liaoning 105 2.47 292 6.92 483 11.40 28.99 Jilin 54 1.99 147 5.42 271 10.00 30.76 Heilongjiang 55 1.50 226 5.92 366 9.60 37.00 Shanghai 202 12.06 432 25.23 510 28.70 16.71 Jiangsu 122 1.64 611 8.25 1027 13.70 42.59 Zhejiang 149 3.18 451 9.64 977 19.90 36.82 Anhui 55 0.91 184 2.86 337 5.50 35.41 Fujian 81 2.33 318 9.12 516 14.60 36.22 Jiangxi 47 1.13 169 3.98 285 6.60 35.24 Shandong 120 1.32 627 6.87 1126 12.20 45.25 Henan 52 0.57 226 2.33 517 5.50 46.44 Hubei 79 1.31 381 6.35 532 9.30 37.36 Hunan 89 1.39 265 3.98 408 6.40 28.81 Guangdong 218 2.52 950 11.95 1831 19.90 42.57 Guangxi 45 1.01 229 4.71 374 8.00 42.09 Hainan 7 0.89 40 4.90 117 14.10 60.00 Sichuan 113 1.36 424 4.88 690 8.40 35.16 Chongqing 46 1.48 177 5.64 220 7.90 29.95 Guizhou 18 0.51 83 2.15 142 3.80 41.09 Yunnan 33 0.77 166 3.80 275 6.20 42.49 Tibet 1 0.26 9 3.18 16 5.80 69.49 Shaanxi 33 0.92 197 5.33 395 10.60 51.19 Gansu 25 0.99 122 4.70 152 5.90 34.72 Qinghai 7 1.35 20 3.65 37 6.80 32.06 Ningxia 11 1.92 33 5.74 42 7.00 25.40 Xinjiang 34 1.76 118 6.09 155 7.70 28.78 NATION 2250 1.78 7950 6.15 13700 10.48 35.13
Source: CNNIC 2001-2007
29
Intercultural Communication Studies VXII: 3 2008 Song
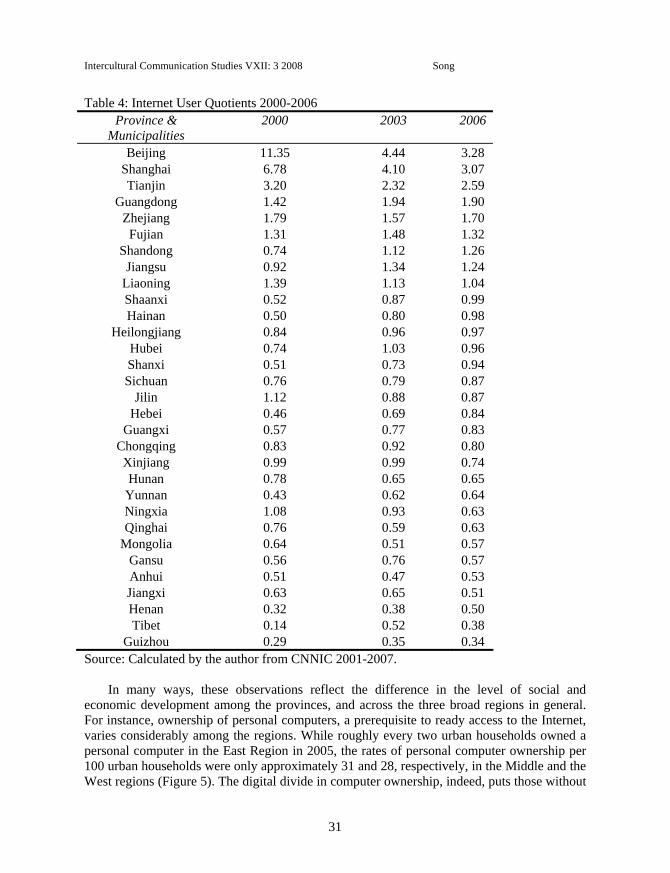
However, the spatial pattern of Internet use cannot simply be described in terms of the absolute number of users, since, in many ways, it is closely correlated to the size of a province’s population. A big number of Internet users against a sizeable population implies that only a small proportion of a region’s entire residents indeed has access to the Internet. For instance, 2.18 million people in Guangdong were online in 2000, the second largest group of user. However, due to its large population base, this number accounted for only 2.52% of the population, not too far above the national average of 1.78%.
A useful technique for comparing provinces is the Internet User Quotient (IUQ) which indicates the extent to which Internet users are concentrated in a province as compared to the nation as a whole (Zook, 2000, 2001). A value greater than 1.00 indicates a higher degree of concentration than the national average and a value less than 1.00 indicates a lack of concentration.
China of Population / Chinain users ofNumber province a of Population / province ain users ofNumber IUQ=
According to the IUQs summarized in Table 4 (Ranked based on IUQ in 2006), the three
centrally administered municipalities have demonstrated the highest degree of Internet user concentration comparatively for the entire period from 2000 to 2006. In other words, Internet users are disproportionally large or over-represented in the three municipalities. For instance, the percentage of the population using the Internet in the capital city of Beijing was about 20, nearly 11 times as much as the national average in 2000. A similar situation has existed for Shanghai and Tianjin. Also of interest is the noticeable discontinuity between the top three and the rest of the provinces, particularly in the year 2000, making the three municipalities the most concentrated areas in the distribution of China’s Internet users.
While the share of Internet users in all provinces had risen considerably by the end of 2006, the relative degree of concentration of the top three had been greatly lowered, although they still led the nation on the basis of Internet users’ concentration. It can also be noticed that in 2006, all the provinces with an IUQ greater than 1.00 (i.e. out-performing the national average), except Shanxi and Shaanxi, were located in the coastal, East region, while those with the least IUQs were southwestern and western provinces of Tibet, Yunnan, Guizhou, Gansu, as well as Henan and Anhui in the Middle region. One positive side is that these provinces with the lowest level of Internet use, in both absolute and relative terms, have demonstrated the fastest average annual growth between 2000 and 2006. Many provinces in the Middle and West regions, such as Shaanxi, Heilongjiang, Hubei and Shanxi, already progressed to a level close to the national average in the concentration of Internet users. This indicates that the inter-provincial distribution of China’s Internet users has started shifting toward a more even or spatially balanced pattern. On a comparative basis, the spatial divide among provinces in terms of the participation of residents in the Internet-based activities has started narrowing.
30
Intercultural Communication Studies VXII: 3 2008 Song
Table 4: Internet User Quotients 2000-2006 Province &
Municipalities 2000 2003 2006
Beijing 11.35 4.44 3.28 Shanghai 6.78 4.10 3.07 Tianjin 3.20 2.32 2.59
Guangdong 1.42 1.94 1.90 Zhejiang 1.79 1.57 1.70 Fujian 1.31 1.48 1.32
Shandong 0.74 1.12 1.26 Jiangsu 0.92 1.34 1.24
Liaoning 1.39 1.13 1.04 Shaanxi 0.52 0.87 0.99 Hainan 0.50 0.80 0.98
Heilongjiang 0.84 0.96 0.97 Hubei 0.74 1.03 0.96 Shanxi 0.51 0.73 0.94 Sichuan 0.76 0.79 0.87
Jilin 1.12 0.88 0.87 Hebei 0.46 0.69 0.84
Guangxi 0.57 0.77 0.83 Chongqing 0.83 0.92 0.80 Xinjiang 0.99 0.99 0.74 Hunan 0.78 0.65 0.65
Yunnan 0.43 0.62 0.64 Ningxia 1.08 0.93 0.63 Qinghai 0.76 0.59 0.63
Mongolia 0.64 0.51 0.57 Gansu 0.56 0.76 0.57 Anhui 0.51 0.47 0.53 Jiangxi 0.63 0.65 0.51 Henan 0.32 0.38 0.50 Tibet 0.14 0.52 0.38
Guizhou 0.29 0.35 0.34 Source: Calculated by the author from CNNIC 2001-2007.
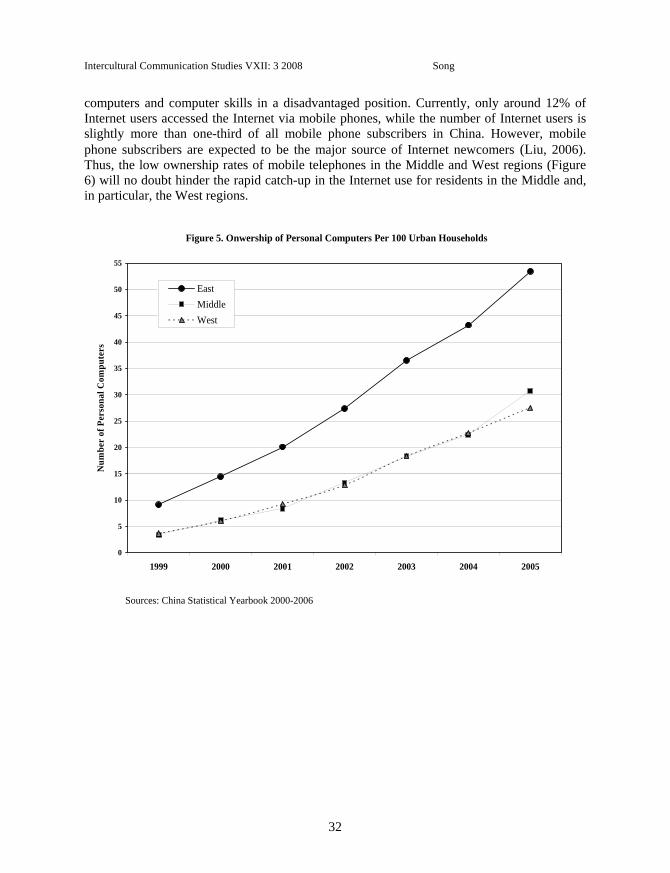
In many ways, these observations reflect the difference in the level of social and economic development among the provinces, and across the three broad regions in general. For instance, ownership of personal computers, a prerequisite to ready access to the Internet, varies considerably among the regions. While roughly every two urban households owned a personal computer in the East Region in 2005, the rates of personal computer ownership per 100 urban households were only approximately 31 and 28, respectively, in the Middle and the West regions (Figure 5). The digital divide in computer ownership, indeed, puts those without
31
Intercultural Communication Studies VXII: 3 2008 Song
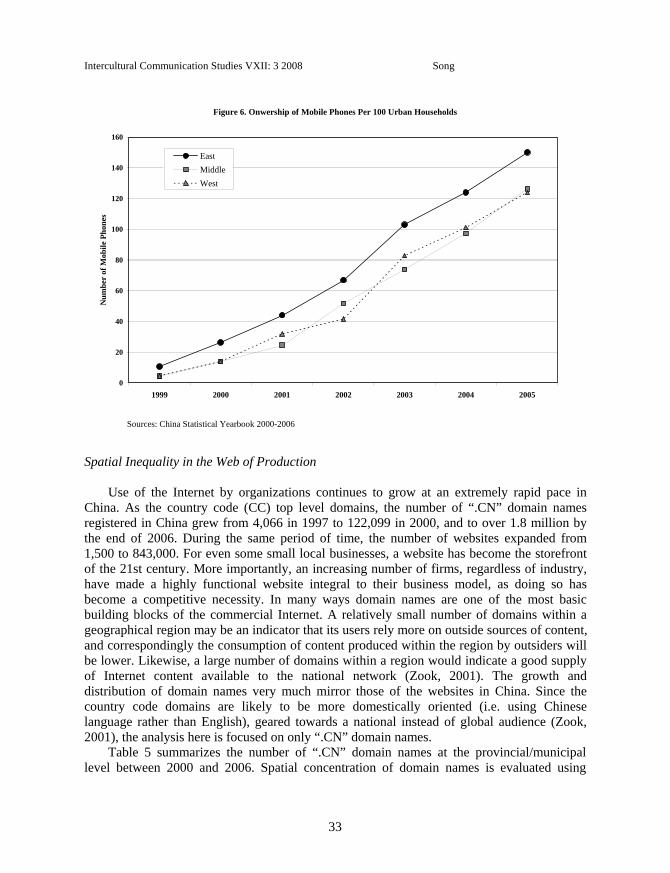
computers and computer skills in a disadvantaged position. Currently, only around 12% of Internet users accessed the Internet via mobile phones, while the number of Internet users is slightly more than one-third of all mobile phone subscribers in China. However, mobile phone subscribers are expected to be the major source of Internet newcomers (Liu, 2006). Thus, the low ownership rates of mobile telephones in the Middle and West regions (Figure 6) will no doubt hinder the rapid catch-up in the Internet use for residents in the Middle and, in particular, the West regions.
Figure 5. Onwership of Personal Computers Per 100 Urban Households
0
5
10
15
20
25
30
35
40
45
50
55
1999 2000 2001 2002 2003 2004 2005
Num
ber
of P
erso
nal C
ompu
ters
EastMiddleWest
Sources: China Statistical Yearbook 2000-2006
32
Intercultural Communication Studies VXII: 3 2008 Song
Figure 6. Onwership of Mobile Phones Per 100 Urban Households
0
20
40
60
80
100
120
140
160
1999 2000 2001 2002 2003 2004 2005
Num
ber
of M
obile
Pho
nes
EastMiddleWest
Sources: China Statistical Yearbook 2000-2006
Spatial Inequality in the Web of Production
Use of the Internet by organizations continues to grow at an extremely rapid pace in China. As the country code (CC) top level domains, the number of “.CN” domain names registered in China grew from 4,066 in 1997 to 122,099 in 2000, and to over 1.8 million by the end of 2006. During the same period of time, the number of websites expanded from 1,500 to 843,000. For even some small local businesses, a website has become the storefront of the 21st century. More importantly, an increasing number of firms, regardless of industry, have made a highly functional website integral to their business model, as doing so has become a competitive necessity. In many ways domain names are one of the most basic building blocks of the commercial Internet. A relatively small number of domains within a geographical region may be an indicator that its users rely more on outside sources of content, and correspondingly the consumption of content produced within the region by outsiders will be lower. Likewise, a large number of domains within a region would indicate a good supply of Internet content available to the national network (Zook, 2001). The growth and distribution of domain names very much mirror those of the websites in China. Since the country code domains are likely to be more domestically oriented (i.e. using Chinese language rather than English), geared towards a national instead of global audience (Zook, 2001), the analysis here is focused on only “.CN” domain names.
Table 5 summarizes the number of “.CN” domain names at the provincial/municipal level between 2000 and 2006. Spatial concentration of domain names is evaluated using
33
Intercultural Communication Studies VXII: 3 2008 Song
Domain Name Specialization Ratio (DSR), which is in a similar format as the Internet User Quotient in providing a standardized measure of the specialization of a region in domain names as compared to the nation as a whole.
China of persons Employed / Chinain namesdomain ofNumber province a of persons Employed / province ain namesdomain ofNumber DSR =
The reason to use the number of employed persons is because the phenomenon under
study is the process and the level of economic activities creating Internet content, a measure of the development of digital economy. Again, a DSR value of greater than 1.00 signifies a higher specialization than the national average, which indicates that a province or municipality is highly engaged in the development of domain names, and potentially the commercial Internet-based activities. Provinces/municipalities are ranked based on 2006 DSR values in Table 5.
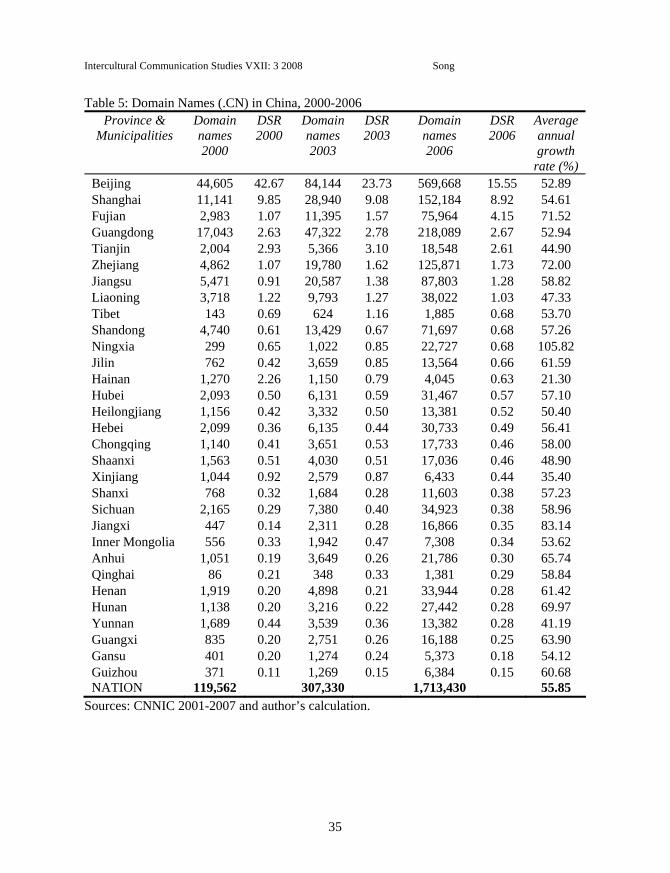
Geographical inequalities are evident among Internet providers. As one would expect, domain names are not evenly distributed, but are highly clustered in particular locations. The spatial disparity in the concentration of “.CN” domain names largely echoes that of Internet users. The variance in domain name per 10,000 employee figures is quite marked from a low of 2.1 per 10,000 employed persons in Guizhou to a high in Beijing of 212.0. Although most provinces showed clear improvement and increase over 2000 in terms of their relative shares of domain names by the end of 2006, the level of geographical concentration of domain names seems still much stronger than that of Internet users. Beijing remained the most concentrated location of domain names, with a DSR value over 15.0 in 2006, although its DSR has been lowered significantly from 42.67 in 2000. Shanghai came a close second with a DSR value near 9.0, which is roughly unchanged from 2000. Ranking the third, Fujian greatly enhanced its status as one of the key Internet service providers in China, from both absolute and relative perspectives. When combined, the number of the domain names of the top five provinces and municipalities with a value of DSR greater than 2 accounted for 60% of China’s total domain names in 2006, while only 12% of the nation’s total employment was from within these top performers. It’s clear again that all the eight provinces or municipalities with higher than the national level in the concentration of domain names are located along the coastal areas in the East region. Some similar provinces, such as Inner Mongolia, Anhui, Henan, Gansu, and Guizhou are near the bottom in the operation and dynamics of Internet activities and content production as measured by the specialization in the domain names.
34
Intercultural Communication Studies VXII: 3 2008 Song
Table 5: Domain Names (.CN) in China, 2000-2006 Province &
Municipalities Domain names 2000
DSR 2000
Domain names 2003
DSR 2003
Domain names 2006
DSR 2006
Average annual growth
rate (%) Beijing 44,605 42.67 84,144 23.73 569,668 15.55 52.89 Shanghai 11,141 9.85 28,940 9.08 152,184 8.92 54.61 Fujian 2,983 1.07 11,395 1.57 75,964 4.15 71.52 Guangdong 17,043 2.63 47,322 2.78 218,089 2.67 52.94 Tianjin 2,004 2.93 5,366 3.10 18,548 2.61 44.90 Zhejiang 4,862 1.07 19,780 1.62 125,871 1.73 72.00 Jiangsu 5,471 0.91 20,587 1.38 87,803 1.28 58.82 Liaoning 3,718 1.22 9,793 1.27 38,022 1.03 47.33 Tibet 143 0.69 624 1.16 1,885 0.68 53.70 Shandong 4,740 0.61 13,429 0.67 71,697 0.68 57.26 Ningxia 299 0.65 1,022 0.85 22,727 0.68 105.82 Jilin 762 0.42 3,659 0.85 13,564 0.66 61.59 Hainan 1,270 2.26 1,150 0.79 4,045 0.63 21.30 Hubei 2,093 0.50 6,131 0.59 31,467 0.57 57.10 Heilongjiang 1,156 0.42 3,332 0.50 13,381 0.52 50.40 Hebei 2,099 0.36 6,135 0.44 30,733 0.49 56.41 Chongqing 1,140 0.41 3,651 0.53 17,733 0.46 58.00 Shaanxi 1,563 0.51 4,030 0.51 17,036 0.46 48.90 Xinjiang 1,044 0.92 2,579 0.87 6,433 0.44 35.40 Shanxi 768 0.32 1,684 0.28 11,603 0.38 57.23 Sichuan 2,165 0.29 7,380 0.40 34,923 0.38 58.96 Jiangxi 447 0.14 2,311 0.28 16,866 0.35 83.14 Inner Mongolia 556 0.33 1,942 0.47 7,308 0.34 53.62 Anhui 1,051 0.19 3,649 0.26 21,786 0.30 65.74 Qinghai 86 0.21 348 0.33 1,381 0.29 58.84 Henan 1,919 0.20 4,898 0.21 33,944 0.28 61.42 Hunan 1,138 0.20 3,216 0.22 27,442 0.28 69.97 Yunnan 1,689 0.44 3,539 0.36 13,382 0.28 41.19 Guangxi 835 0.20 2,751 0.26 16,188 0.25 63.90 Gansu 401 0.20 1,274 0.24 5,373 0.18 54.12 Guizhou 371 0.11 1,269 0.15 6,384 0.15 60.68 NATION 119,562 307,330 1,713,430 55.85
Sources: CNNIC 2001-2007 and author’s calculation.
35
Intercultural Communication Studies VXII: 3 2008 Song
A Typology of Provinces and Municipalities Based on the Functioning of Internet Activities
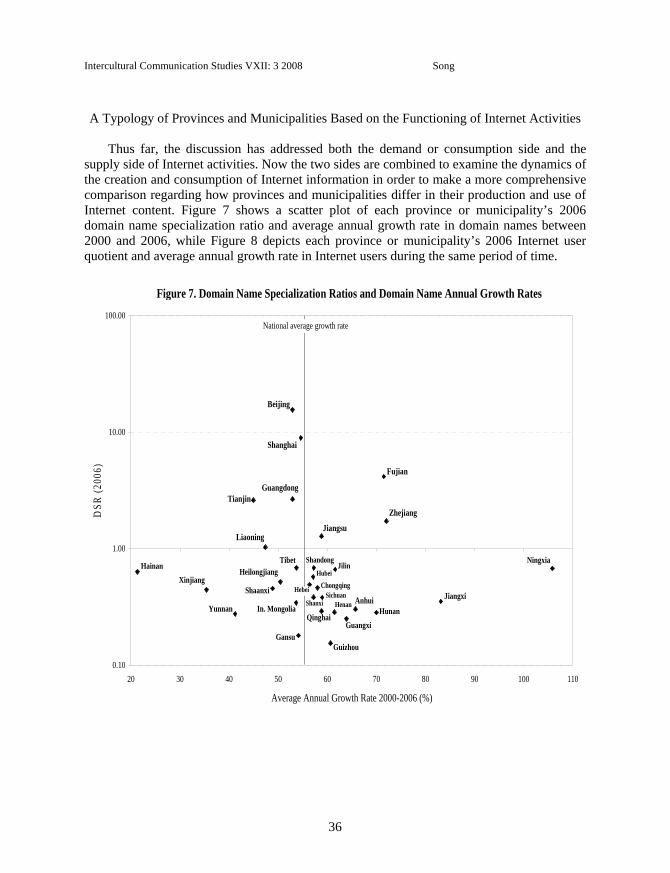
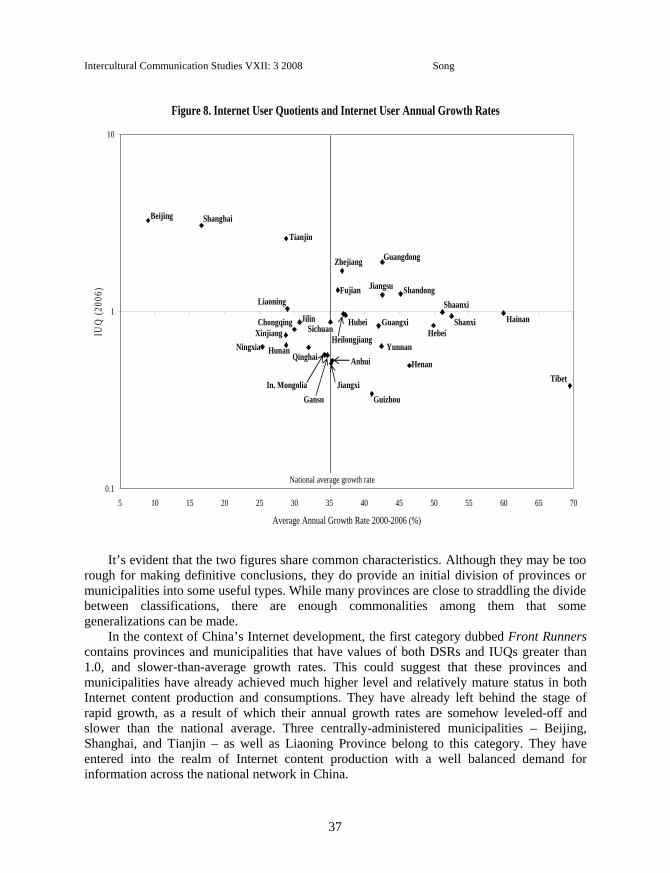
Thus far, the discussion has addressed both the demand or consumption side and the
supply side of Internet activities. Now the two sides are combined to examine the dynamics of the creation and consumption of Internet information in order to make a more comprehensive comparison regarding how provinces and municipalities differ in their production and use of Internet content. Figure 7 shows a scatter plot of each province or municipality’s 2006 domain name specialization ratio and average annual growth rate in domain names between 2000 and 2006, while Figure 8 depicts each province or municipality’s 2006 Internet user quotient and average annual growth rate in Internet users during the same period of time.
Figure 7. Domain Name Specialization Ratios and Domain Name Annual Growth Rates
0.10
1.00
10.00
100.00
20 30 40 50 60 70 80 90 100 110
Average Annual Growth Rate 2000-2006 (%)
DSR
(200
6) Fujian
Zhejiang
Beijing
Shanghai
TianjinGuangdong
JiangsuLiaoning
HainanXinjiang
Yunnan
Shaanxi
Gansu
In. Mongolia
HeilongjiangTibet Ningxia
Jiangxi
Hunan
Guizhou
Anhui
Guangxi
Jilin
Henan
Qinghai
HubeiChongqing
SichuanShanxi
Hebei
Shandong
National average growth rate
36
Intercultural Communication Studies VXII: 3 2008 Song
Figure 8. Internet User Quotients and Internet User Annual Growth Rates
0.1
1
10
5 10 15 20 25 30 35 40 45 50 55 60 65 70
Average Annual Growth Rate 2000-2006 (%)
IUQ
(200
6)
Beijing Shanghai
Tianjin
Liaoning
GuangdongZhejiang
Fujian Jiangsu Shandong
Tibet
HainanShanxi
Shaanxi
Hebei
Guizhou
Henan
Yunnan
GuangxiHubei
HeilongjiangNingxia Hunan
XinjiangChongqing Jilin
Qinghai
In. MongoliaGansu
Jiangxi
Anhui
Sichuan
National average growth rate
It’s evident that the two figures share common characteristics. Although they may be too rough for making definitive conclusions, they do provide an initial division of provinces or municipalities into some useful types. While many provinces are close to straddling the divide between classifications, there are enough commonalities among them that some generalizations can be made.
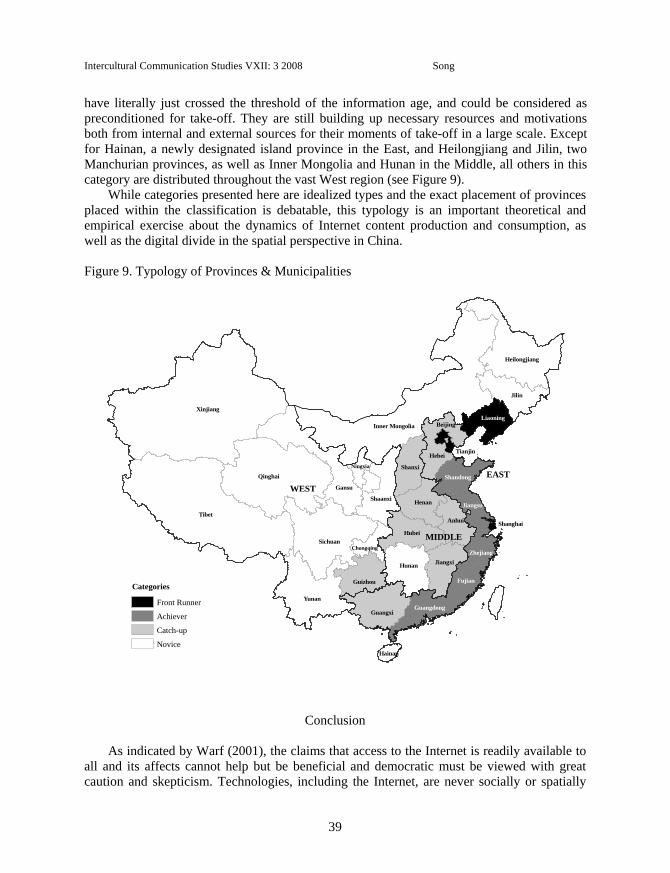
In the context of China’s Internet development, the first category dubbed Front Runners contains provinces and municipalities that have values of both DSRs and IUQs greater than 1.0, and slower-than-average growth rates. This could suggest that these provinces and municipalities have already achieved much higher level and relatively mature status in both Internet content production and consumptions. They have already left behind the stage of rapid growth, as a result of which their annual growth rates are somehow leveled-off and slower than the national average. Three centrally-administered municipalities – Beijing, Shanghai, and Tianjin – as well as Liaoning Province belong to this category. They have entered into the realm of Internet content production with a well balanced demand for information across the national network in China.
37
Intercultural Communication Studies VXII: 3 2008 Song
The next category called Achievers, is basically composed of provinces which have DSRs and/or IUQs that are greater than 1.0, and annual growth rates are faster than the national average. In other words, they are largely the provinces that appear to have achieved significant and relatively balanced Internet content production for the increasing demands of their users, but they are still in the process of driving to maturity. This category is composed of the coastal provinces of Guangdong, Fujian, Zhejiang, Jiangsu, and Shandong.
China’s Internet activities are undoubtedly dominated by the provinces and municipalities of the first two categories. They are at the top of the national hierarchy in the development and implementation of Internet technology. Geographically, they are associated with three of China’s economically most dynamic, most developed and most urbanized regions: Bohai Rim, Yangtze River Delta, and Pearl River Delta. Two centrally administered municipalities, Beijing and Tianjin, as well as Shandong and Liaoning are within the Bohai Rim, which also contains other major cities such as Qingdao, Yantai, Weihai, Dalian, Yingkou, and Jinzhou. The Yangtze River Delta consists mainly of Shanghai, the largest metropolis in China, and southern Jiangsu and northern Zhejiang provinces. Major cities also include Nanjing, Nantong, Suzhou, Hangzhou and Ningbo which have kept up high levels of economic development at a rapid pace. In close proximity to Hong Kong and Macau, the cities of Guangzhou, Shenzhen and Zhuhai are the economic powerhouses in the Pearl River Delta located in Guangdong Province. Across the strait from Taiwan, with the backing of overseas Chinese and foreign investments, the export-oriented economy of Fujian, centered on Xiamen and Fuzhou, has sustained rapid growth in the past decades. Cities in the above regions are Special Economic Zones (SEZs), open coastal cities, leading metropolitan areas, as well as the major economic, financial, political, and tourist centers from both domestic and international perspectives. As a result, each city demonstrates a great deal of spatial interactions with other areas, forming the core of provincial and regional economic development. These provinces and municipalities hold the highest per capita GDPs in China, and when combined account for around 43% of the nation’s total GDP in 2005. The trio of Bohai Rim, Yangtze River Delta, and Pearl River Delta clearly constitutes the backbone of China’s domestic telecommunication and information network. They also serve as key nodes of the Chinese Internet for international connections.
The third classification of provinces is labeled Catch-up, and consists of provinces that have both DSRs and IUQs lower than 1.0, but annual growth rates are faster than the national average in both domain names and Internet users. These provinces haven’t achieved well developed Internet content production and consumption systems, but they are experiencing the take-off at a rapid pace along both fronts. They are geared towards providing more Internet content and promoting higher online participation rates for their local residents. Eight provinces in this category include Shanxi, Hebei, Henan, Hubei, Anhui, Jiangxi, Guangxi, and Guizhou, with a majority situated in the Middle region.
The final category dubbed Novice contains the remaining provinces. They have lower levels of concentration in both domain names and Internet users, and their growth rates for Internet content production and consumption are either slower than the national average, or highly disproportionate from each other. These provinces lack a well developed and relatively balanced system for producing Internet content and for promoting local residents’ Internet demand and consumption. These provinces are lagging far behind in the process of moving towards the implementation of new information and telecommunication technology. They
38
Intercultural Communication Studies VXII: 3 2008 Song
have literally just crossed the threshold of the information age, and could be considered as preconditioned for take-off. They are still building up necessary resources and motivations both from internal and external sources for their moments of take-off in a large scale. Except for Hainan, a newly designated island province in the East, and Heilongjiang and Jilin, two Manchurian provinces, as well as Inner Mongolia and Hunan in the Middle, all others in this category are distributed throughout the vast West region (see Figure 9).
While categories presented here are idealized types and the exact placement of provinces placed within the classification is debatable, this typology is an important theoretical and empirical exercise about the dynamics of Internet content production and consumption, as well as the digital divide in the spatial perspective in China. Figure 9. Typology of Provinces & Municipalities
Categories
Front Runner
Achiever
Catch-up
Novice
MIDDLE
EASTWEST
Beijing
Tianjin
Shanghai
Heilongjiang
Jilin
Inner MongoliaLiaoning
Hebei
Jiangsu
Zhejiang
Fujian
Shandong
GuangdongGuangxi
Hainan
Yunan
Guizhou
Henan
Shanxi
Hubei
Hunan Jiangxi
Anhui
SichuanChongqing
Tibet
Qinghai
Gansu
Ningxia
Shaanxi
Xinjiang
Conclusion
As indicated by Warf (2001), the claims that access to the Internet is readily available to
all and its affects cannot help but be beneficial and democratic must be viewed with great caution and skepticism. Technologies, including the Internet, are never socially or spatially
39
Intercultural Communication Studies VXII: 3 2008 Song
neutral and universal in their impacts. The Internet is likely to reinforce or even deepen existing divisions between the “haves” and the “have-nots”.
This digital divide can be revealed by the clear and sharp spatial disparities in the level of development of the Internet in China. Given the space-transcending nature of Internet technology, significant differences in Internet content production and consumption still exist across China’s various regions. Although every Chinese province has developed its own Internet infrastructure and particular brand of Internet content, distinct inter-provincial inequalities are occurring at a considerable intensity. Regional boundaries indeed are making a difference, and access to the Internet in China is deeply conditioned by where one is. Long-standing polarized relationships, such as the divisions between developed and less developed regions, or between the coastal area and the interior, are still apparent in the realm of Internet in China.
This paper has outlined the distribution and dynamics of Internet content production and consumption in China. It is clear that the dominance of the East region, particularly those front runners such as Beijing, Tianjin, Shanghai and Guangdong, remains strong, although the Internet has diffused to other regions and provinces and some signs of the narrowing of the digital divide have emerged. As Zook (2001) pointed out, the Internet acts as complement rather than a substitute for the advantages of cities and regions. Thus domain names and Internet users remain highly concentrated in the provinces, particularly major urban areas, which already possess exceptional economic and developmental advantages. The Internet seems to further reinforce and increase the gains of the economically leading regions.
The digital divide is a multifaceted phenomenon, which is deeply rooted in the economic, social, cultural and political dimensions of society. Overall, China’s Internet users are relatively well educated, wealthy, and in professional occupations with or demanding for college degrees. The economic and educational biases are compounded by gender and age. Internet use in China is heavily gendered – roughly 60% of all Chinese Internet users were male in 2006 (CNNIC, 2007). Those between the ages of 18 to 24 make up the largest proportion of Internet users, at 35.2%, while teenagers under age 18 make up another 17.2%. Although these patterns are not truly unique in China, some unprecedented problems in Chinese society are deemed to be closely linked with the Internet. With a high prevalence of high school and college students online, some research has shown that 13.2% of young Chinese Internet users suffer from Internet addiction disorder, and another 13% have the tendency to become addicted (Jing, 2006). Furthermore, when a local low-income youth ignores his/her school work and instead spends his/her evenings playing violent videogames at a local cyber café, s/he is not really benefiting from digital technology.
Given that the majority of Chinese live in the countryside, the digital divide between urban and rural areas is astounding as well as worrying. Personal computers, which are a daily necessity to many urban residents at present, are still considered an extravagant purchase by rural people. The broadening income gap between urban and rural residents also greatly constrains rural people’s consumption of high-tech products. Low education levels and the lack of a sufficient infrastructure and channel to get information, further compound the digital divide between China’s urban and rural areas.
All these essential dimensions of the digital divide in China warrant thorough and ongoing research which will be able to provide further elaborations of the causes and social and economic implications of the Internet’s growth and diffusion. In addition, this analysis is
40
Intercultural Communication Studies VXII: 3 2008 Song
constrained by the available data which are aggregate at the level of provinces or centrally administered municipalities. If urban-level and firm-level data, particularly data of intercity interactions via the Internet, are available, future research will be able to explore the ways in which cities and localities are woven into the national even global lattices of mobility and information flows, as well as the way specific metropolis or region networks and individual firms adapt to and exploit the opportunities offered by the Internet.
References
American Library Association. (2002). What is the digital divide? Retrieved April 19, 2004, from http://www.ala.org/oitp/digitaldivide/what.html Anderson, S. (2000). China’s widening web. China Business Review, 27, 20-24. Beyers, W. (2000). Cyberspace or human space: Whither cities in the age of telecommunications? In J.Wheeler, Y. Aoyama, & B. Warf, (Eds.). Cities in the
Telecommunication Age (pp.161-180). New York and London: Routledge. Bosman, M. M. & Chakraborty, J. (2002). Regional variations in on-line job search trends:
Does race (still) matter? Papers and proceedings of the Applied Geography Conferences, 25, 350-358.
Brunn, S. D. (2000). Human rights and welfare in the electronic state. In M. Wilson & K. Corey (Eds.). Information tectonics: Space, place and technology in an electronic age (pp. 41-64). Chichester, NY: John Wiley & Sons.
Brunn, S. D. & Dodge, M. (2001). Mapping the “worlds” of the World Wide Web: (Re)Structuring global commerce through hyperlinks. American Behavioral Scientist, 44, 1717-1739.
Cairncross, F. (1997). The death of distance: How the communications revolution will change our lives. Cambridge, MA: Harvard University Press.
Chakraborty, J. & Bosman, M. M. (2005). Measuring the digital divide in the United States: Race, income, and personal computer ownership. The Professional Geographer, 57, 395-410.
China Internet Network Information Center (CNNIC). (1998-2007). Semiannual survey report on internet development in China. Beijing, China.
Chu, Y. & Tang, J. T. H. (2005). The internet and civil society: Environmental and labour organizations in Hong Kong. International Journal of Urban and Regional Research, 29, 849-866.
Crowther, D. (2000). Corporate reporting, stakeholders and the Internet: Mapping the new corporate landscape. Urban Studies, 37, 1837-1848.
DiMaggio, P. J. & Hargittai, E. (2002). From the “digital divide” to “digital inequality”: Studying Internet use as penetration increases. Working Paper 19, Center for Arts and Cultural Policy Studies, Woodrow Wilson School, Princeton University.
Graham, S. (2001). Information technologies and reconfigurations of urban space. International Journal of Urban and Regional Research, 25, 405-410.
Graham, S. & Marvin, S. (1996). Telecommunications and the city: Electronic spaces, urban places. New York, NY: Routledge.
Grimes, S. (2003). The digital economy challenge facing peripheral rural areas. Progress in Human Geography, 27, 174-193.
41
Intercultural Communication Studies VXII: 3 2008 Song
Grubesic, T. H. & O’Kelly, M. E. (2002). Using points of presence to measure accessibility to the commercial Internet. The Professional Geographer, 54, 259-278.
Guthrie, D. (2006). China and globalization: The social, economic, and political transformation of Chinese society. New York and London: Routledge.
Hargittai, E. & Centeno, M. A. (2001). Introduction: Defining a global geography. American Behavioral Scientist, 44, 1545-1560.
Harrington, J. (2007). The digital divide: Lessons from the People’s Republic of China. Retrieved December 12, 2007, from http://www.greennation.com/chidigi.pdf
Hwang, J. (2004). Digital divide in Internet use within the urban hierarchy: The case of South Korea. Urban Geography, 25, 372-389.
Internet World Stats. Internet usage statistics. Retrieved December 12, 2007, from http://www.internetworldstats.com/stats.htm
Jing, X. (2006). Entertainment generation. Beijing Review, 49, 31-33. Jing, X. (2007). Caught in the net. Beijing Review, 50, 18-20. Katz, J. E., Rice, R. E., & Aspden, P. (2001). The Internet, 1995-2000: Access, civic
involvement, and social interaction. American Behavioral Scientist, 45, 405-419. Kitchin, R. M. (1998). Towards geographies of cyberspace. Progress in Human Geography,
22, 385-406. Lindsay, C. (2005). Employability, services for unemployed job seekers and the digital
divide. Urban Studies, 42, 325-339. Liu, Y. (2006). Waiting for Web 2.0. Beijing Review, 49, 34-35. Malecki, E. J. (2002). Hard and soft networks for urban competitiveness. Urban Studies, 39,
929-945. Mitchell, W. J. (1995). City of bits: Space, place, and the infobahn. Cambridge, MA: MIT
Press. Morrison, P. (2000). A pilot implementation of Internet access for remote aboriginal
communities in the ‘Top End’ of Australia. Urban Studies, 37, 1781-1792. National Bureau of Statistics of China. (2000-2006). China statistical yearbook. Beijing,
China. National Telecommunications and Information Administration (NTAI). (2000). Falling
through the Net: Towards digital inclusion. Washington, DC: Department of Commerce.
Norris, P. (2001). Digital divide: Civic engagement, information poverty and the Internet in democratic societies. New York: Cambridge University Press.
Selwyn, N. (2002). Defining the “digital divide”: Developing a theoretical understanding of inequalities in the information age. Occasional Paper 49, School of Social Sciences, Cardiff University.
Townsend, A. M. (2001). Network cities and the global structure of the Internet. American Behavioral Scientist, 44, 1697-1716.
Tyner, J. A. (1998). Asian labor recruitment and the World Wide Web. The Professional Geographer, 50, 331-344.
Wheeler, D. C., & O’Kelly, M. E. (1999). Network topology and city accessibility of the commercial Internet. The Professional Geographer, 51, 327-339.
Wilhelm, A. G. (2001). They threw me a computer…but what I really needed was a life
42
Intercultural Communication Studies VXII: 3 2008 Song
preserver. First Monday, 6(4). Retrieved December 12, 2007, from http://www.firstmonday.org/issues/issue6_4/wilhelm/
Wilson, M. I., & Corey, K. E. (2000). Space, place and technology in an electronic age. In M. Wilson & K. Corey (Eds.), Information tectonics: Space, place and technology in an electronic age (pp. 1-6). Chichester, NY: John Wiley & Sons.
Warf, B. (1995). Telecommunications and the changing geographies of knowledge transmission in the late 20th century. Urban Studies, 32, 361-378.
Warf, B. (2001). Segueways into cyberspace: multiple geographies of the digital divide. Environment and Planning B, 28, 3-19.
Zook, M. A. (2000). The web of production: the economic geography of commercial Internet content production in the United States. Environment and Planning A, 32, 411 – 426.
Zook, M. A. (2001). Old hierarchies or new networks of centrality? The global geography of the Internet content market. American Behavioral Scientist, 44, 1679 - 1696.
43