Embed Size (px)
DESCRIPTION
Development of SPE for urine sample. hydrophobic interaction type SPE. hydrophobic interaction Interaction between hydrophobic chemicals Aromatic compounds dissolve in organic solvent effective for hydrophobic chemicals widely used for collection of the chemicals in water - PowerPoint PPT Presentation
Citation preview
112011/02011/055// 2323
Development of Development of SPE SPE
for urine samplefor urine sample
Development of Development of SPE SPE
for urine samplefor urine sample
222011/02011/055// 2323
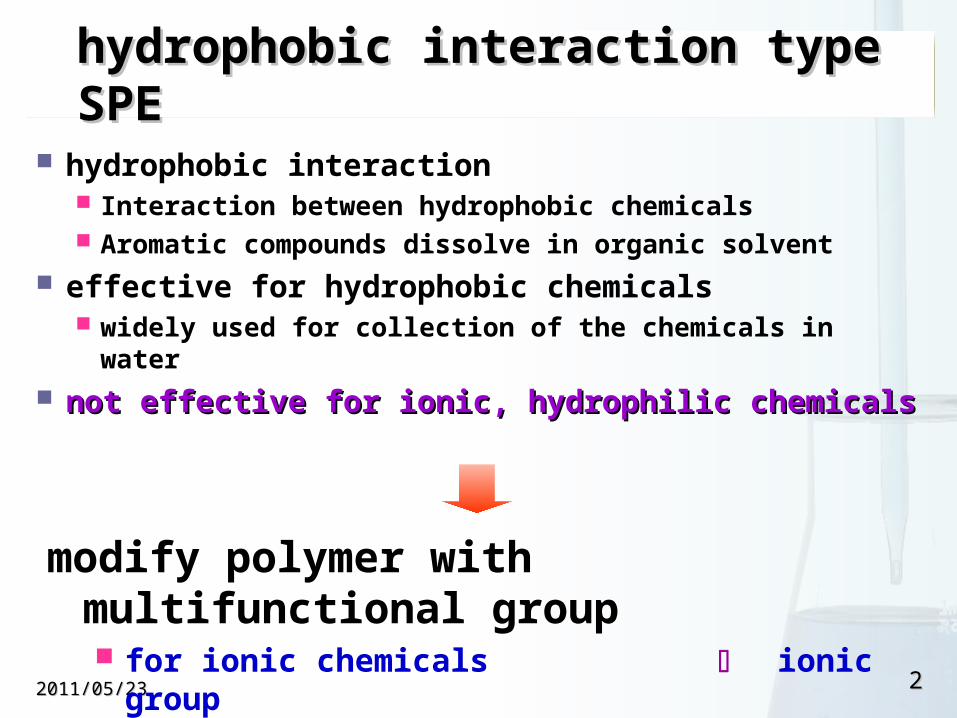
hydrophobic interaction type hydrophobic interaction type SPESPE
hydrophobic interaction Interaction between hydrophobic chemicals Aromatic compounds dissolve in organic solvent
effective for hydrophobic chemicals widely used for collection of the chemicals in water
not effective for ionic, hydrophilic not effective for ionic, hydrophilic chemicalschemicals
modify polymer with multifunctional group for ionic chemicals ionic group for hydrophilic chemicals hydrophilic
group
332011/02011/055// 2323
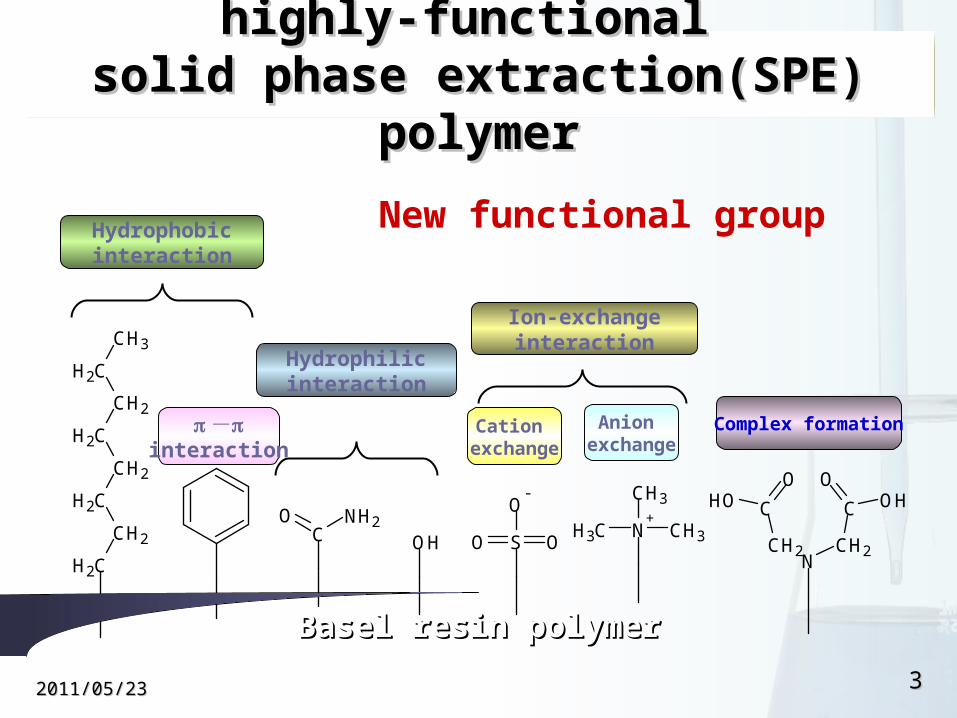
highly-functional highly-functional solid phase extraction(SPE) solid phase extraction(SPE)
polymerpolymer
CH2
CH2
CH2
CH2
CH2
CH2
CH2
CH3
CO NH2
SO O
O-
NCH2 CH2
C C
OOOH OH
N+
CH3 CH3
CH3
OH
Hydrophobicinteraction
Hydrophilicinteraction
Ion-exchangeinteraction
Complex formationCation exchange
Anion exchange
-interaction
Basel resin polymerBasel resin polymer
New functional group
442011/02011/055// 2323
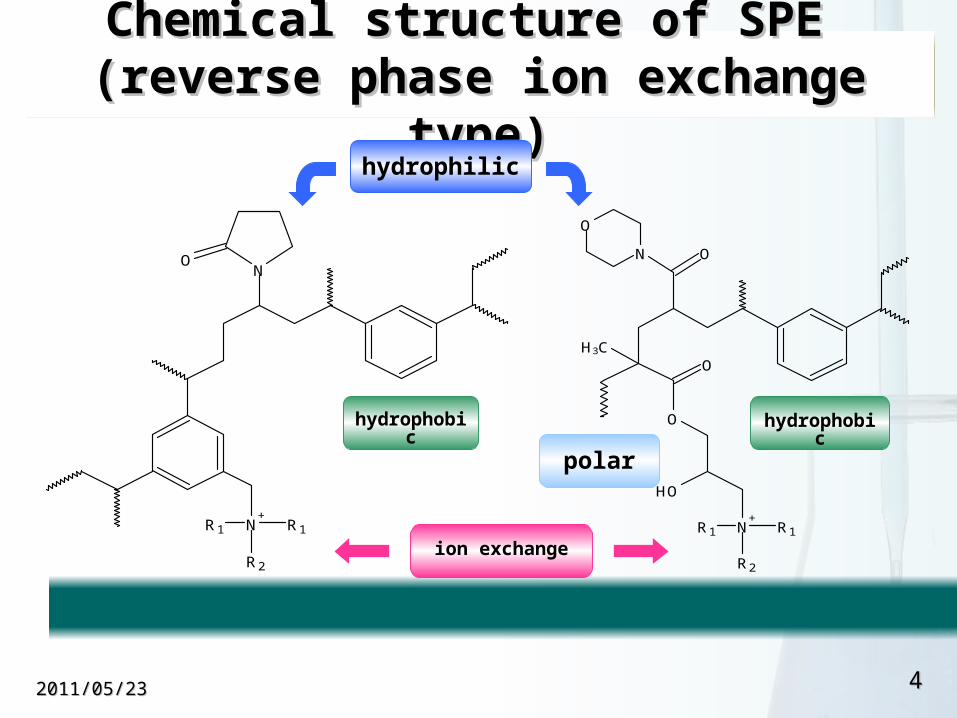
Chemical structure of SPE Chemical structure of SPE (reverse phase ion exchange (reverse phase ion exchange
type)type)
NO
N+
R1R1
R2
hydrophilic
N O
CH3
O
O
OH
O
N+
R1R1
R2ion exchange
hydrophobic hydrophobic
polar
552011/02011/055// 2323
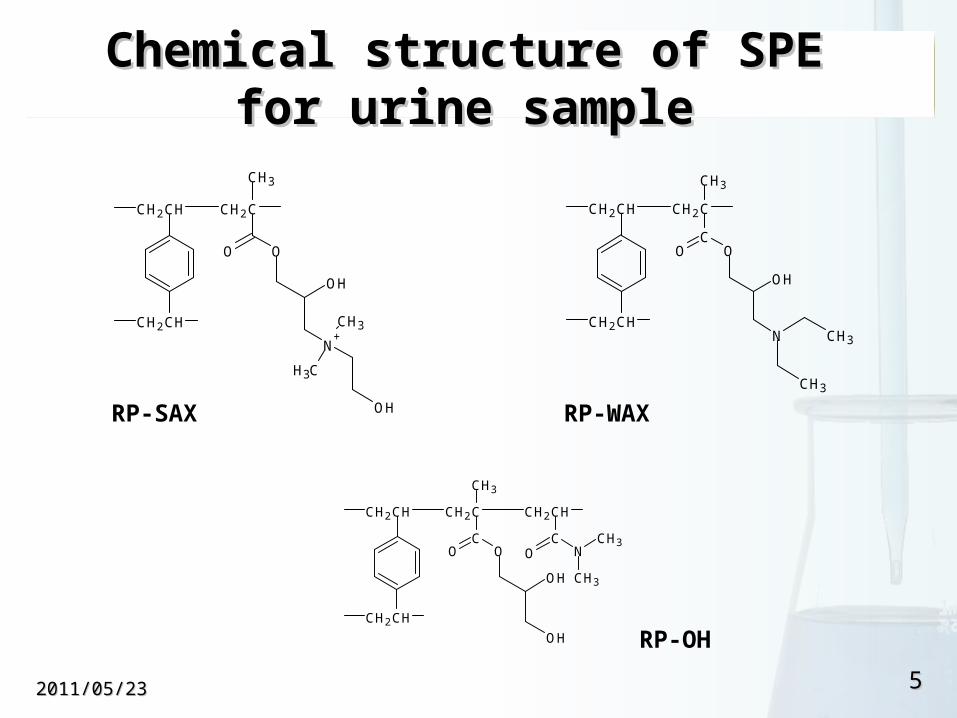
Chemical structure of SPE Chemical structure of SPE for urine sample for urine sample
CHCH2 CH2C
CHCH2
OO
CH3
OH
N+CH3
CH3
OH
CHCH2 CH2C
CHCH2
COO
CH3
OH
N CH3
CH3
CHCH2 CH2C
CHCH2
COO
CH3
CHCH2
CN
CH3
CH3
OH
OH
O
RP-SAX RP-WAX
RP-OH
662011/02011/055// 2323
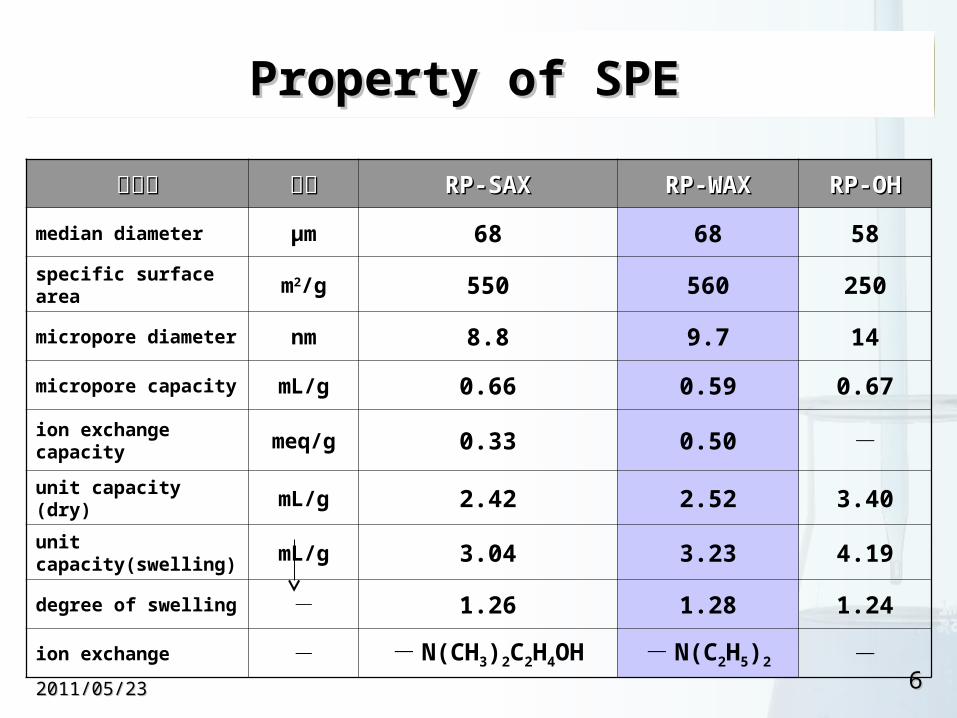
Property of SPE Property of SPE
樹脂名樹脂名 単位単位 RP-SAXRP-SAX RP-WAXRP-WAX RP-OHRP-OH
median diameter µm 68 68 58
specific surface area m2/g 550 560 250
micropore diameter nm 8.8 9.7 14
micropore capacity mL/g 0.66 0.59 0.67
ion exchange capacity meq/g 0.33 0.50 -
unit capacity (dry) mL/g 2.42 2.52 3.40
unit capacity(swelling) mL/g 3.04 3.23 4.19
degree of swelling - 1.26 1.28 1.24
ion exchange - - N(CH3)2C2H4OH - N(C2H5)2 -
772011/02011/055// 2323
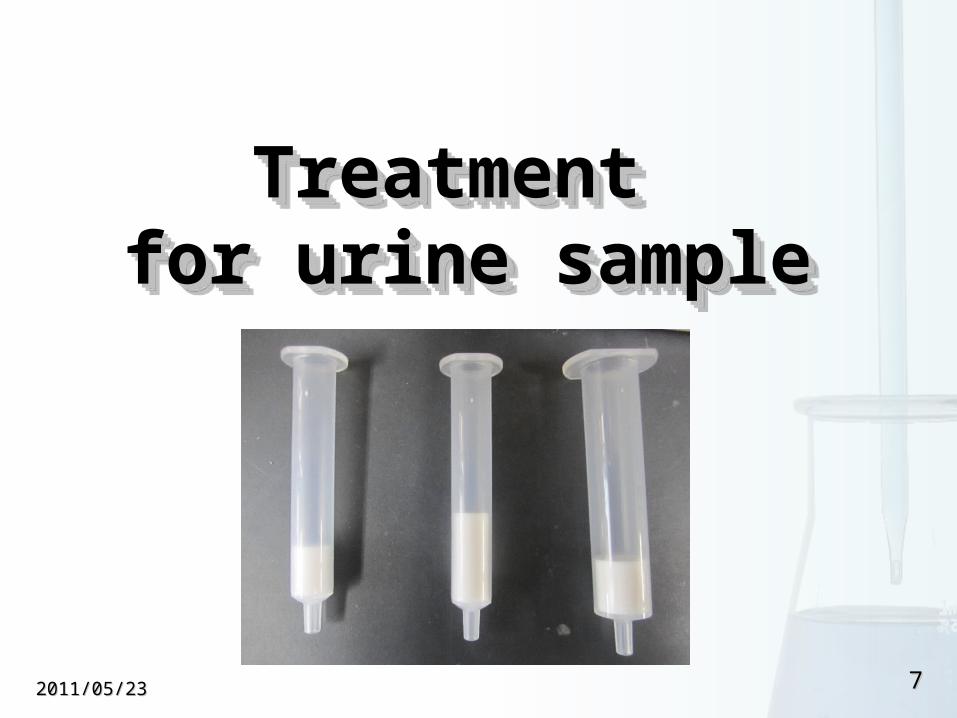
Treatment Treatment for urine samplefor urine sample
Treatment Treatment for urine samplefor urine sample
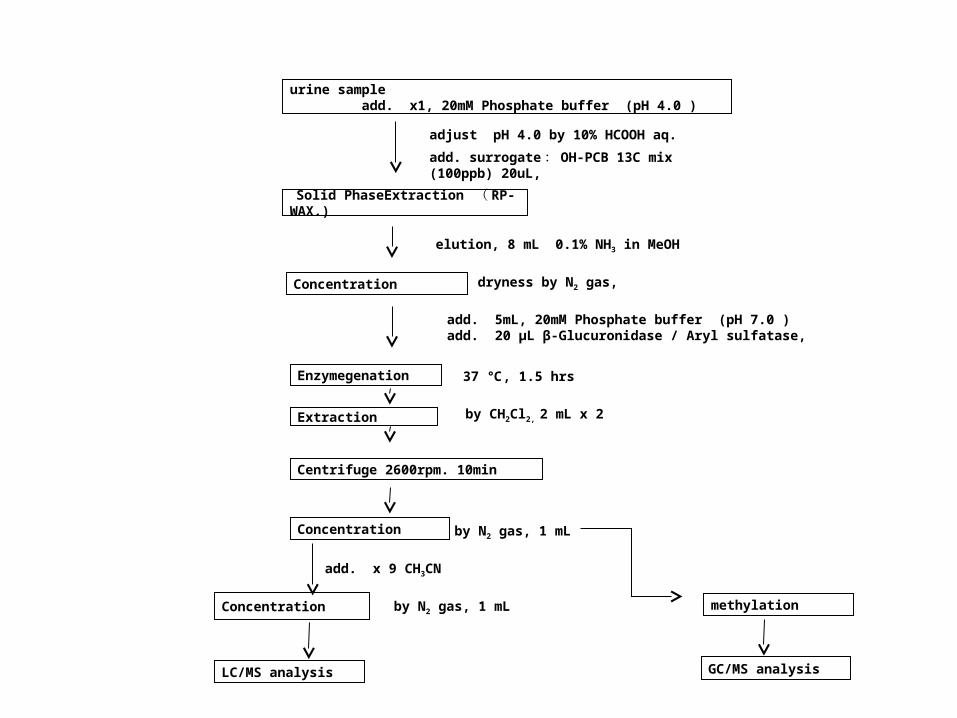
urine sample add. x1, 20mM Phosphate buffer (pH 4.0 )
add. surrogate : OH-PCB 13C mix (100ppb) 20uL,
Solid PhaseExtraction ( RP-WAX.)
Concentration
elution, 8 mL 0.1% NH3 in MeOH
adjust pH 4.0 by 10% HCOOH aq.
add. 5mL, 20mM Phosphate buffer (pH 7.0 )add. 20 μL β-Glucuronidase / Aryl sulfatase,
Enzymegenation
Extraction
Centrifuge 2600rpm. 10min
Concentration
add. x 9 CH3CN
Concentration
LC/MS analysis
by N2 gas, 1 mL
by N2 gas, 1 mL
by CH2Cl2, 2 mL x 2
37 ℃, 1.5 hrs
dryness by N2 gas,
GC/MS analysis
methylation
9 2011/05/23
LC/MS AnalysisLC/MS Analysis
Time7.00 8.00 9.00 10.00 11.00 12.00 13.00
%
0
100
7.00 8.00 9.00 10.00 11.00 12.00 13.00
%
0
100
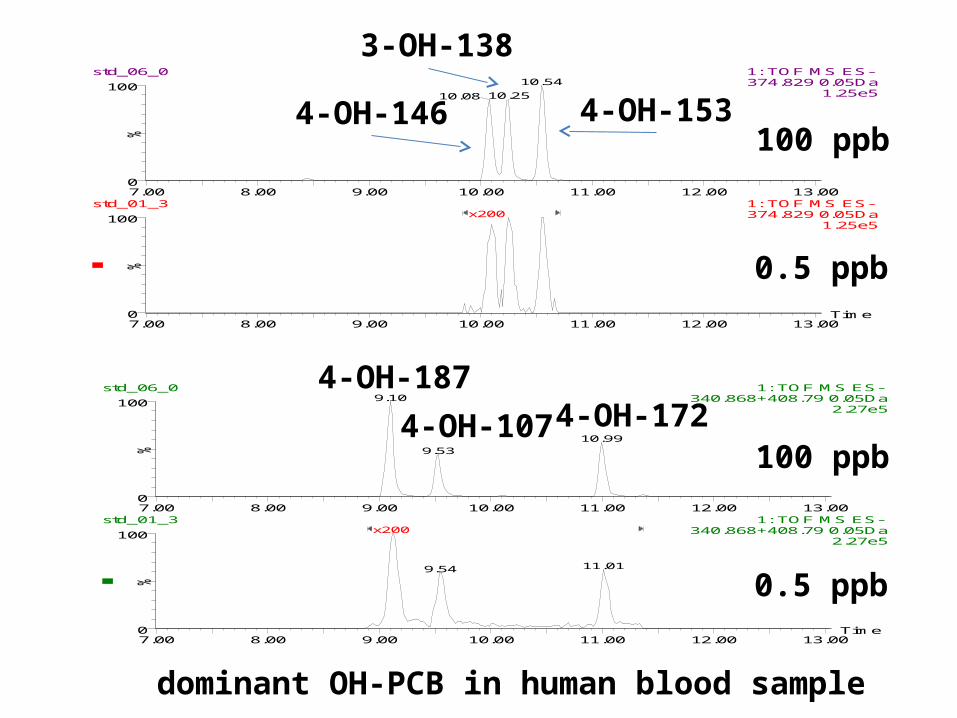
std_06_0 1: TOF MS ES- 374.829 0.05Da
1.25e510.54
10.2510.08
std_01_3 1: TOF MS ES- 374.829 0.05Da
1.25e5x200
4-OH-146
3-OH-138
4-OH-153100 ppb
0.5 ppb
Time7.00 8.00 9.00 10.00 11.00 12.00 13.00
%
0
100
7.00 8.00 9.00 10.00 11.00 12.00 13.00
%
0
100
std_06_0 1: TOF MS ES- 340.868+408.79 0.05Da
2.27e59.10
10.999.53
std_01_3 1: TOF MS ES- 340.868+408.79 0.05Da
2.27e5x200
11.019.54
4-OH-187
4-OH-107 4-OH-172100 ppb
0.5 ppb
dominant OH-PCB in human blood sample
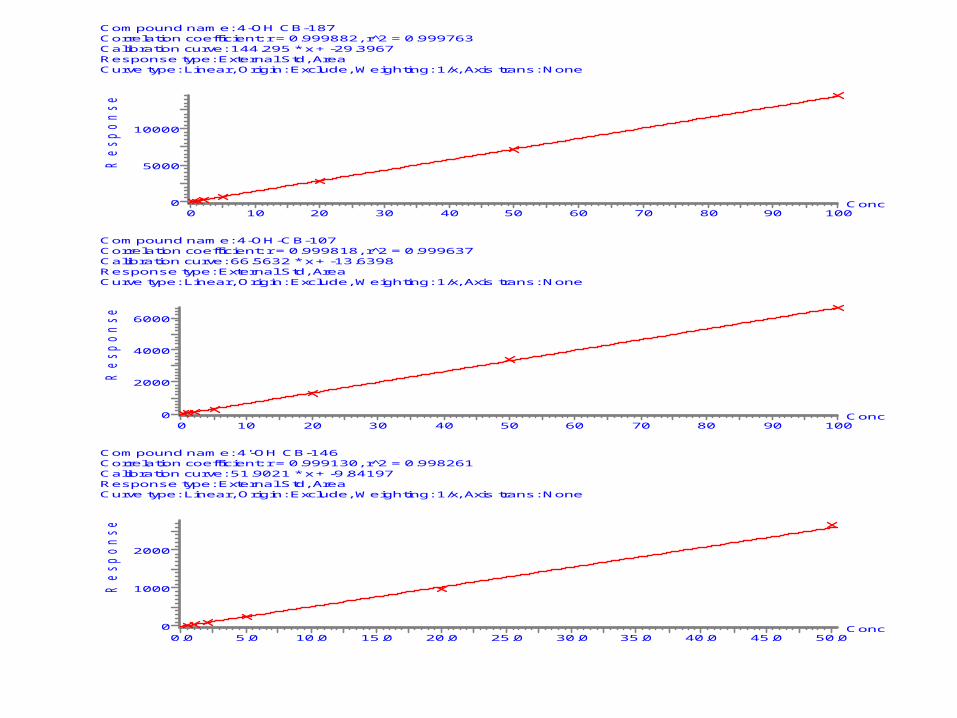
Compound name: 4-OH CB-187Correlation coefficient: r = 0.999882, r^2 = 0.999763Calibration curve: 144.295 * x + -29.3967Response type: External Std, AreaCurve type: Linear, Origin: Exclude, Weighting: 1/x, Axis trans: None
Conc0 10 20 30 40 50 60 70 80 90 100
Re
sp
on
se
0
5000
10000
Compound name: 4-OH-CB-107Correlation coefficient: r = 0.999818, r^2 = 0.999637Calibration curve: 66.5632 * x + -13.6398Response type: External Std, AreaCurve type: Linear, Origin: Exclude, Weighting: 1/x, Axis trans: None
Conc0 10 20 30 40 50 60 70 80 90 100
Re
sp
on
se
0
2000
4000
6000
Compound name: 4'-OH CB-146Correlation coefficient: r = 0.999130, r^2 = 0.998261Calibration curve: 51.9021 * x + -9.84197Response type: External Std, AreaCurve type: Linear, Origin: Exclude, Weighting: 1/x, Axis trans: None
Conc0.0 5.0 10.0 15.0 20.0 25.0 30.0 35.0 40.0 45.0 50.0
Re
sp
on
se
0
1000
2000
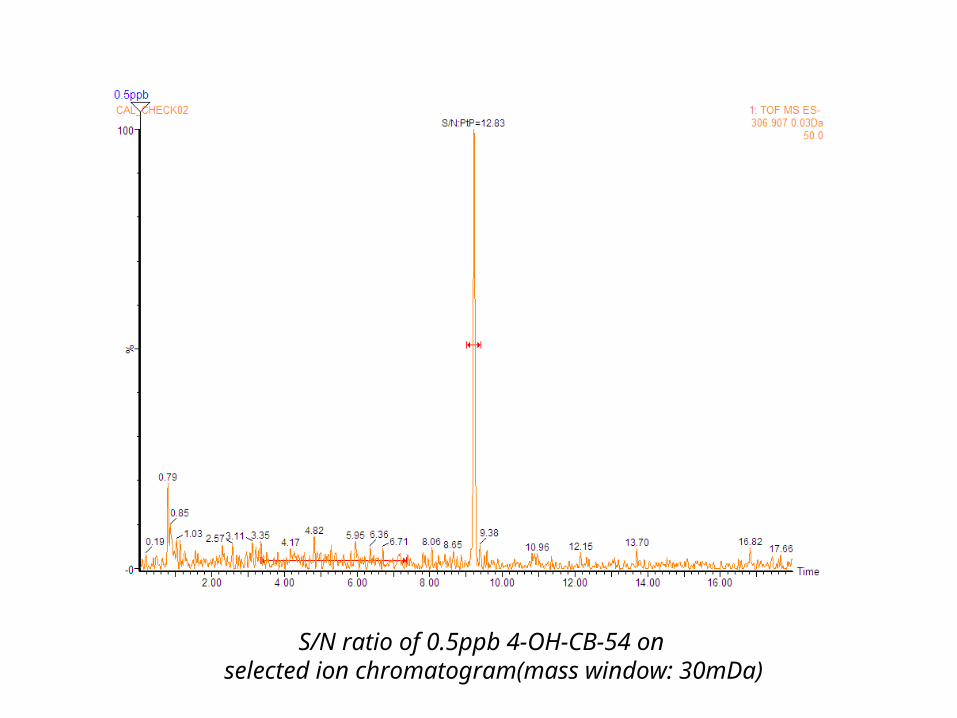
S/N ratio of 0.5ppb 4-OH-CB-54 on selected ion chromatogram(mass window: 30mDa)
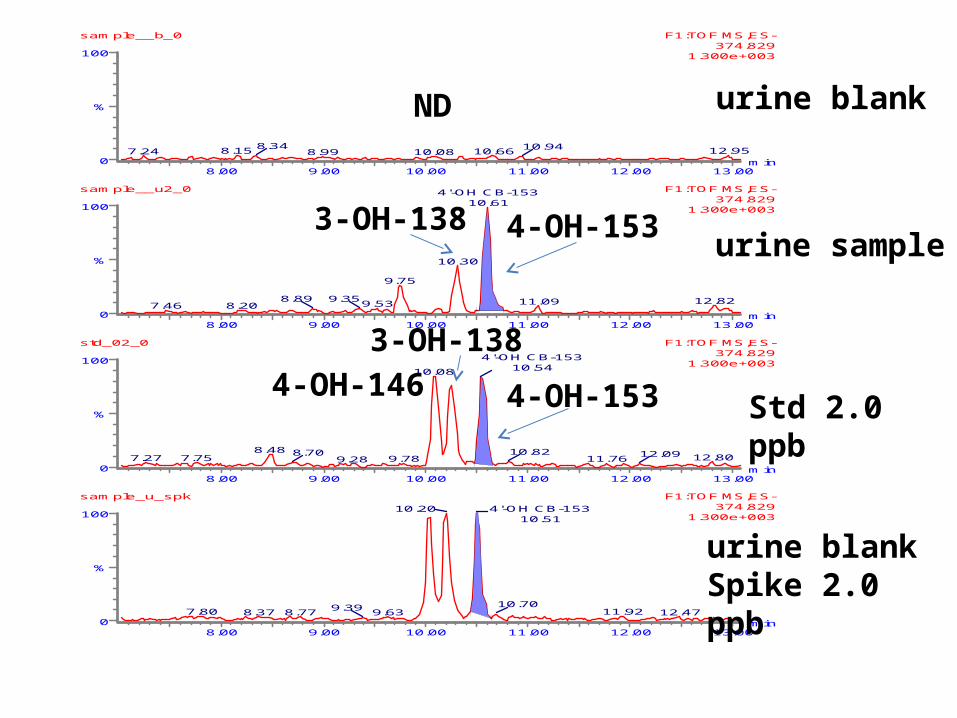
min8.00 9.00 10.00 11.00 12.00 13.00
%
0
100
F1:TOF MS,ES-374.829
sample__b_0
1.300e+003
8.157.24 12.9510.668.34
8.99 10.0810.94
min8.00 9.00 10.00 11.00 12.00 13.00
%
0
100
F1:TOF MS,ES-374.829
std_02_0
1.300e+00310.08
8.487.27 7.75
8.709.789.28
4'-OH CB-15310.54
10.8212.8011.76
12.09
min8.00 9.00 10.00 11.00 12.00 13.00
%
0
100
F1:TOF MS,ES-374.829
sample_u_spk
1.300e+0034'-OH CB-153
10.5110.20
7.80 8.37 9.638.779.39 10.70
11.92 12.47
min8.00 9.00 10.00 11.00 12.00 13.00
%
0
100
F1:TOF MS,ES-374.829
sample__u2_0
1.300e+003
4'-OH CB-15310.61
10.30
9.75
9.539.358.89
8.207.4612.8211.09
Std 2.0 ppb
urine blankSpike 2.0 ppb
urine sample
urine blank
4-OH-146
3-OH-138
4-OH-153
4-OH-1533-OH-138
ND
Std.2.0 ppb
Urea blankSpike 2.0 ppb
Urea sample
Urea blank
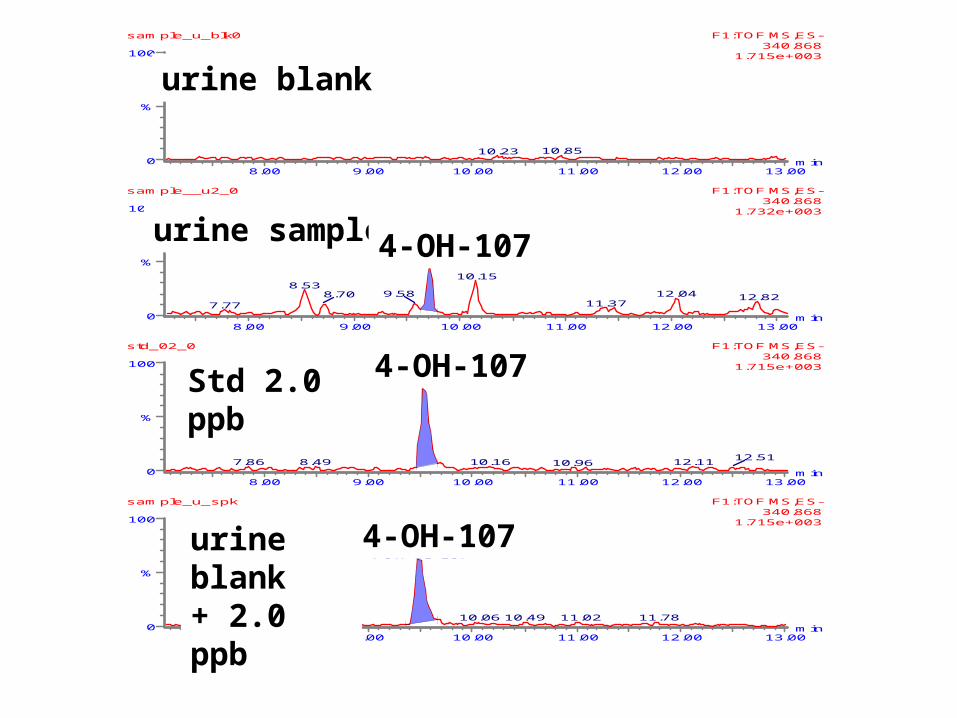
min8.00 9.00 10.00 11.00 12.00 13.00
%
0
100
F1:TOF MS,ES-340.868
std_02_0
1.715e+003
4-OH-CB-107
8.497.86 10.16 12.1110.9612.51
min8.00 9.00 10.00 11.00 12.00 13.00
%
0
100
F1:TOF MS,ES-340.868
sample_u_blk0
1.715e+003
10.8510.23
min8.00 9.00 10.00 11.00 12.00 13.00
%
0
100
F1:TOF MS,ES-340.868
sample_u_spk
1.715e+003
4-OH-CB-107
8.427.58 7.96 10.06 10.49 11.02 11.78
min8.00 9.00 10.00 11.00 12.00 13.00
%
0
100
F1:TOF MS,ES-340.868
sample__u2_0
1.732e+003
4-OH-CB-107
8.53
7.77
9.588.70
10.15
12.0411.37
12.82
Std 2.0 ppb
urine blank+ 2.0 ppb
urine sample
urine blank
4-OH-107
4-OH-107
4-OH-107
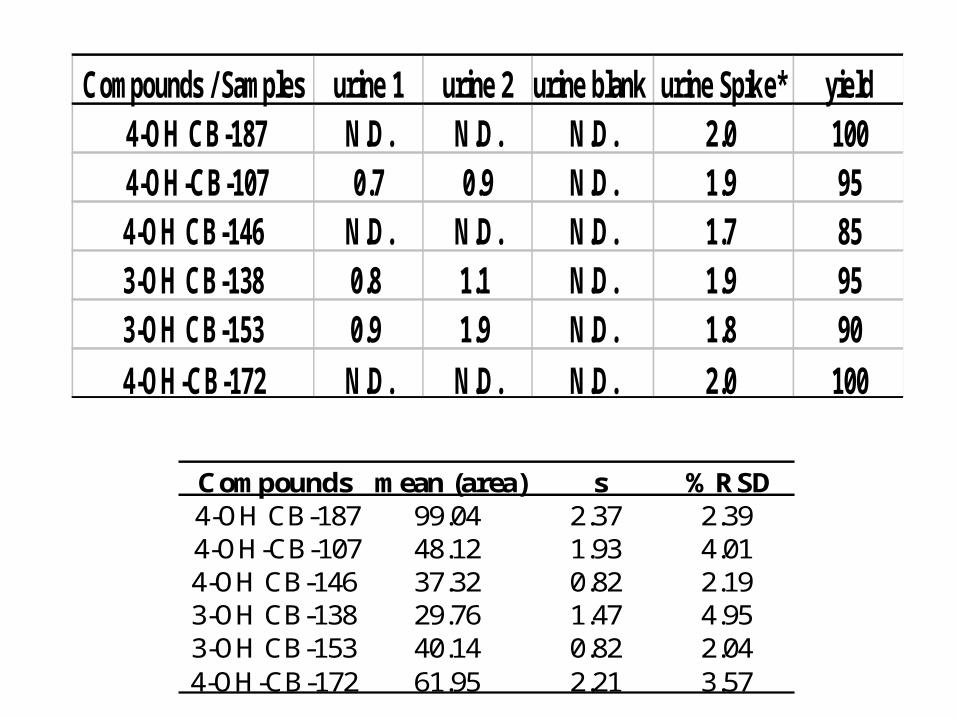
Compounds / Samples urine 1 urine 2 urine blank urine Spike* yield 4-OH CB-187 N.D. N.D. N.D. 2.0 100 4-OH-CB-107 0.7 0.9 N.D. 1.9 954-OH CB-146 N.D. N.D. N.D. 1.7 853-OH CB-138 0.8 1.1 N.D. 1.9 953-OH CB-153 0.9 1.9 N.D. 1.8 90
4-OH-CB-172 N.D. N.D. N.D. 2.0 100
Compounds mean (area) s %RSD 4-OH CB-187 99.04 2.37 2.39 4-OH-CB-107 48.12 1.93 4.014-OH CB-146 37.32 0.82 2.193-OH CB-138 29.76 1.47 4.953-OH CB-153 40.14 0.82 2.044-OH-CB-172 61.95 2.21 3.57
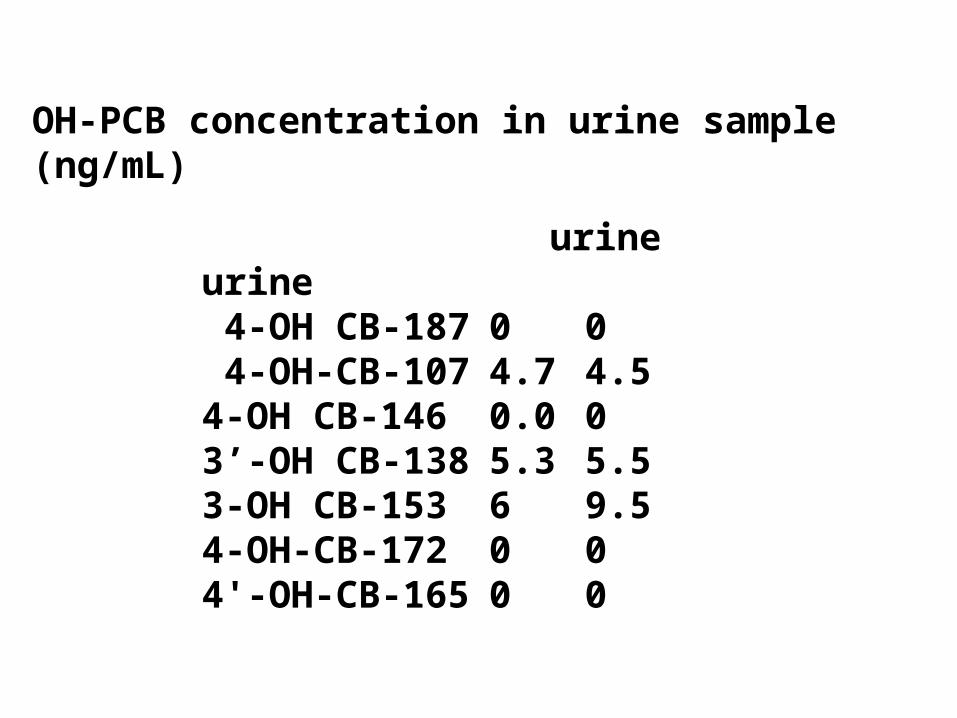
urine urine 4-OH CB-187 0 0 4-OH-CB-107 4.7 4.54-OH CB-146 0.0 03’-OH CB-138 5.3 5.53-OH CB-153 6 9.54-OH-CB-172 0 04'-OH-CB-165 0 0
OH-PCB concentration in urine sample (ng/mL)
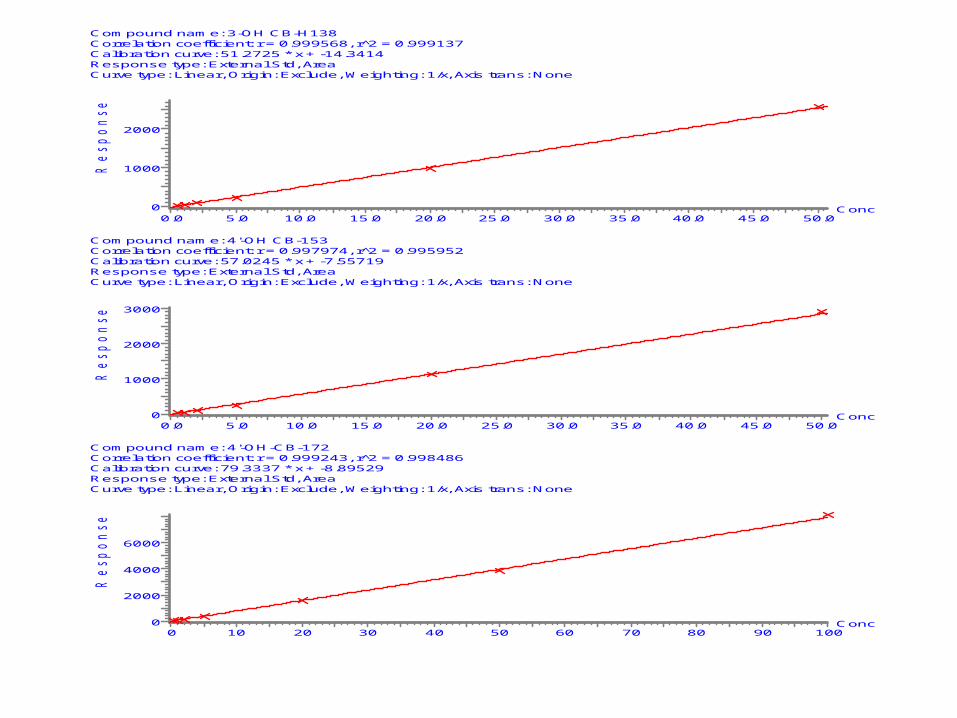
Compound name: 3-OH CB-H138Correlation coefficient: r = 0.999568, r^2 = 0.999137Calibration curve: 51.2725 * x + -14.3414Response type: External Std, AreaCurve type: Linear, Origin: Exclude, Weighting: 1/x, Axis trans: None
Conc0.0 5.0 10.0 15.0 20.0 25.0 30.0 35.0 40.0 45.0 50.0
Re
sp
on
se
0
1000
2000
Compound name: 4'-OH CB-153Correlation coefficient: r = 0.997974, r^2 = 0.995952Calibration curve: 57.0245 * x + -7.55719Response type: External Std, AreaCurve type: Linear, Origin: Exclude, Weighting: 1/x, Axis trans: None
Conc0.0 5.0 10.0 15.0 20.0 25.0 30.0 35.0 40.0 45.0 50.0
Re
sp
on
se
0
1000
2000
3000
Compound name: 4'-OH-CB-172Correlation coefficient: r = 0.999243, r^2 = 0.998486Calibration curve: 79.3337 * x + -8.89529Response type: External Std, AreaCurve type: Linear, Origin: Exclude, Weighting: 1/x, Axis trans: None
Conc0 10 20 30 40 50 60 70 80 90 100
Re
sp
on
se
0
2000
4000
6000
PCB & PFCsCa metabolism
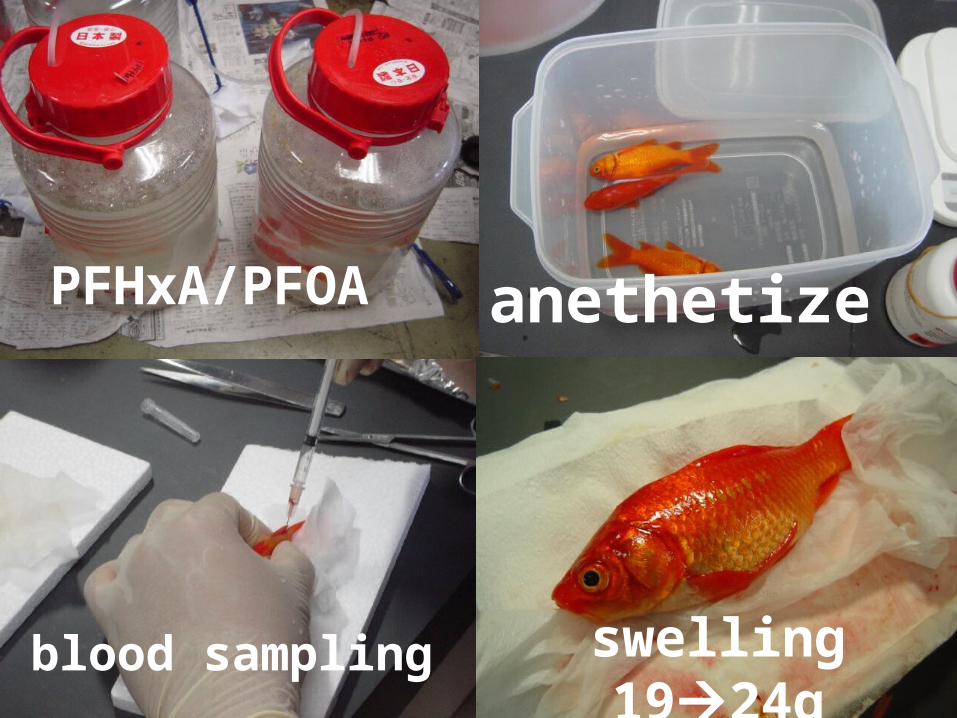
blood sampling
PFHxA/PFOA anethetize
swelling 1924g
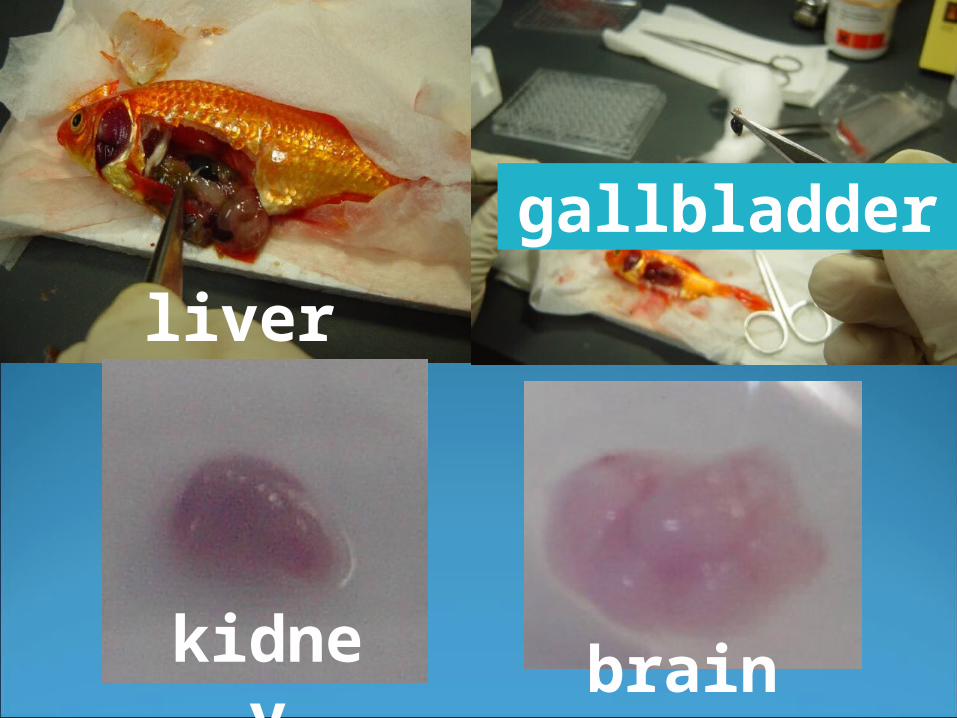
kidney
brain
liver
gallbladder
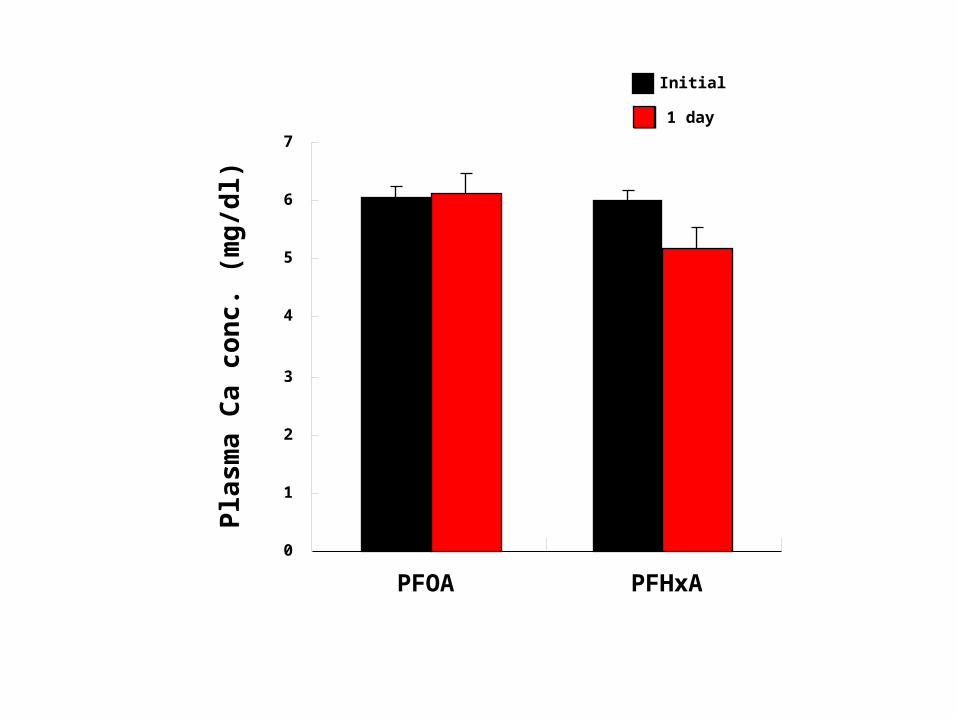
0
1
2
3
4
5
6
7
Pla
sma
Ca
con
c. (
mg/
dl)
Initial
1 day
PFOA PFHxA
chiral PCB Enantioselective
analysis
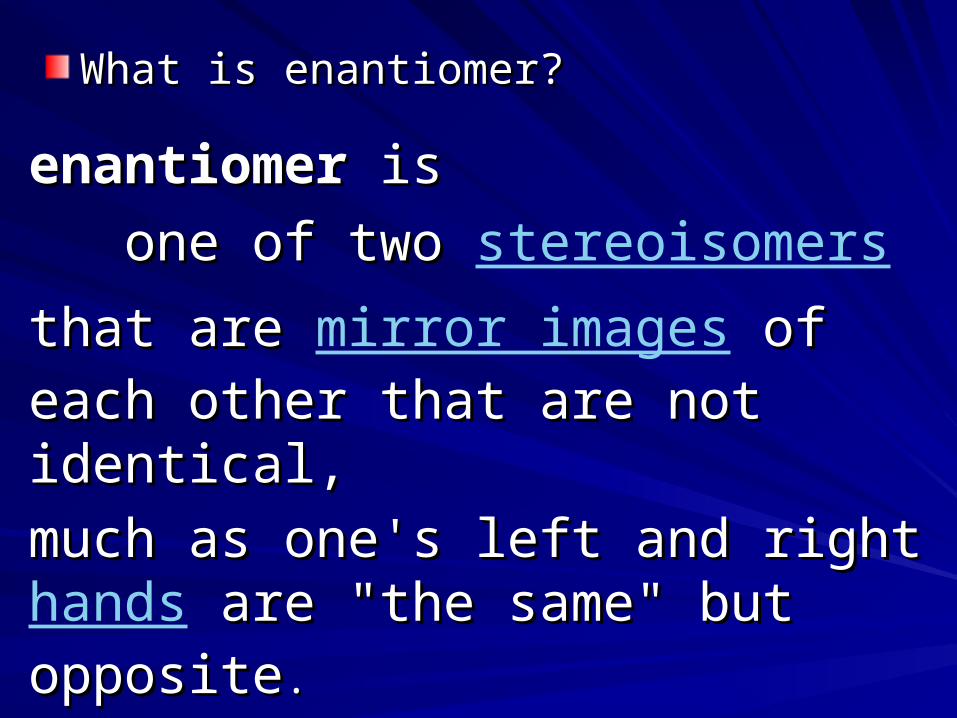
What is enantiomer?What is enantiomer?
enantiomerenantiomer is is
one of two one of two stereoisomers
that are that are mirror images of each other of each other that are not identical, that are not identical,
much as one's left and right much as one's left and right hands are are "the same" but opposite"the same" but opposite..
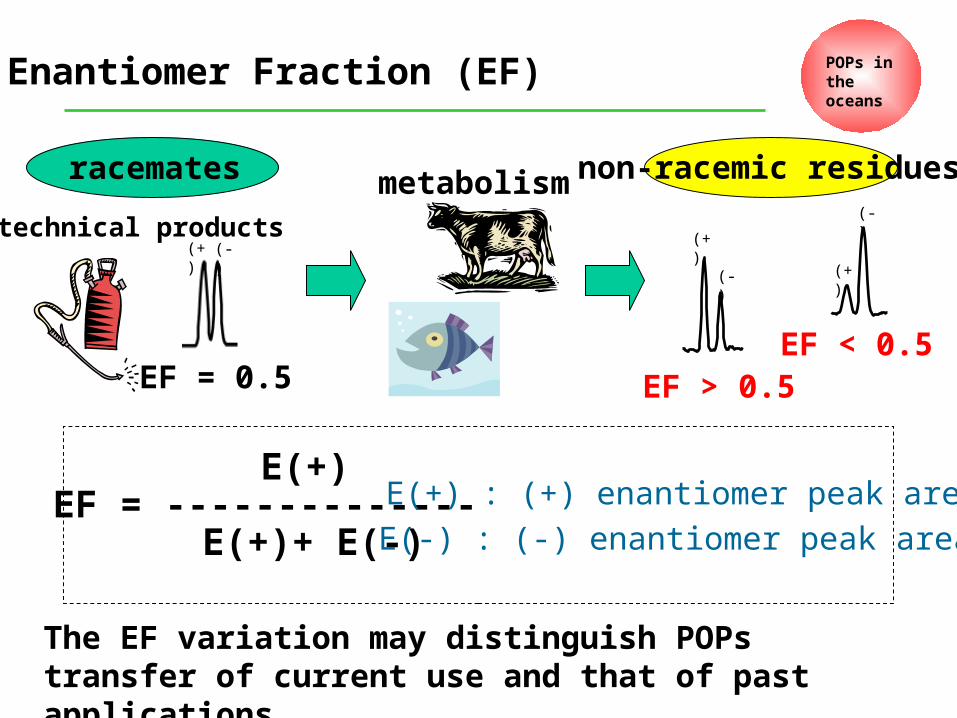
Enantiomer Fraction (EF)
EF = --------------E(+)
E(+)+ E(-)E(+) : (+) enantiomer peak area
E(-) : (-) enantiomer peak area
technical products
EF = 0.5
metabolism
EF > 0.5
racemates
EF < 0.5
non-racemic residues
The EF variation may distinguish POPs transfer of current use and that of past applications.
POPs in the oceans
(+) (-)(+)
(-) (+)
(-)
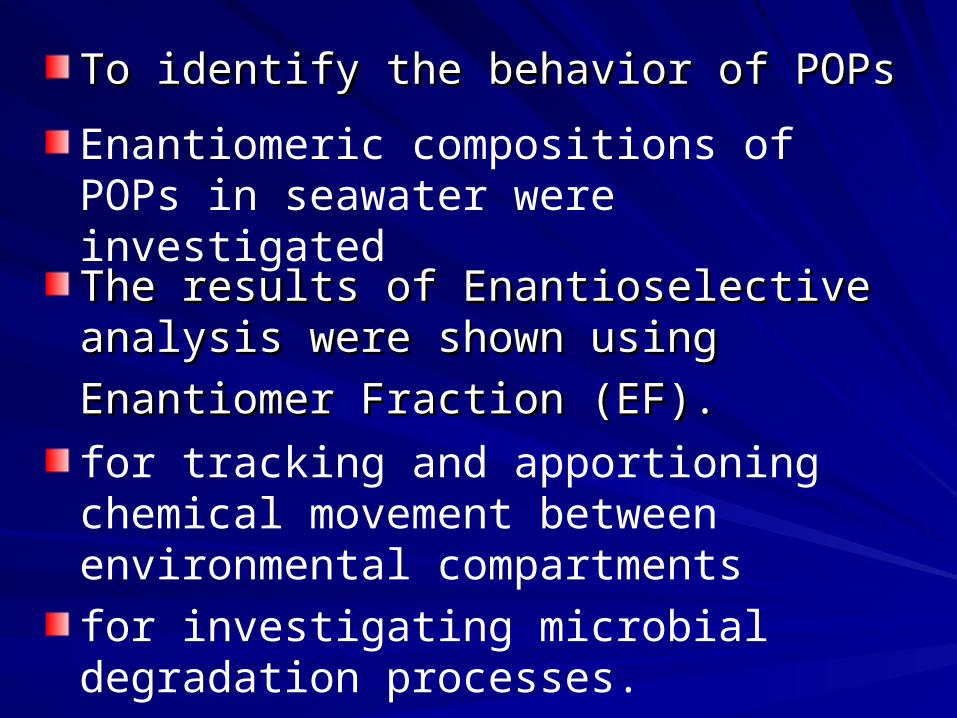
To identify the behavior of POPsTo identify the behavior of POPs
The results of Enantioselective analysis were The results of Enantioselective analysis were
shown using Enantiomer Fraction (EF).shown using Enantiomer Fraction (EF). for tracking and apportioning chemical movement between environmental compartments
for investigating microbial degradation processes.
Enantiomeric compositions of POPs in seawater were investigated
0.00
0.25
0.50
0.75
EF
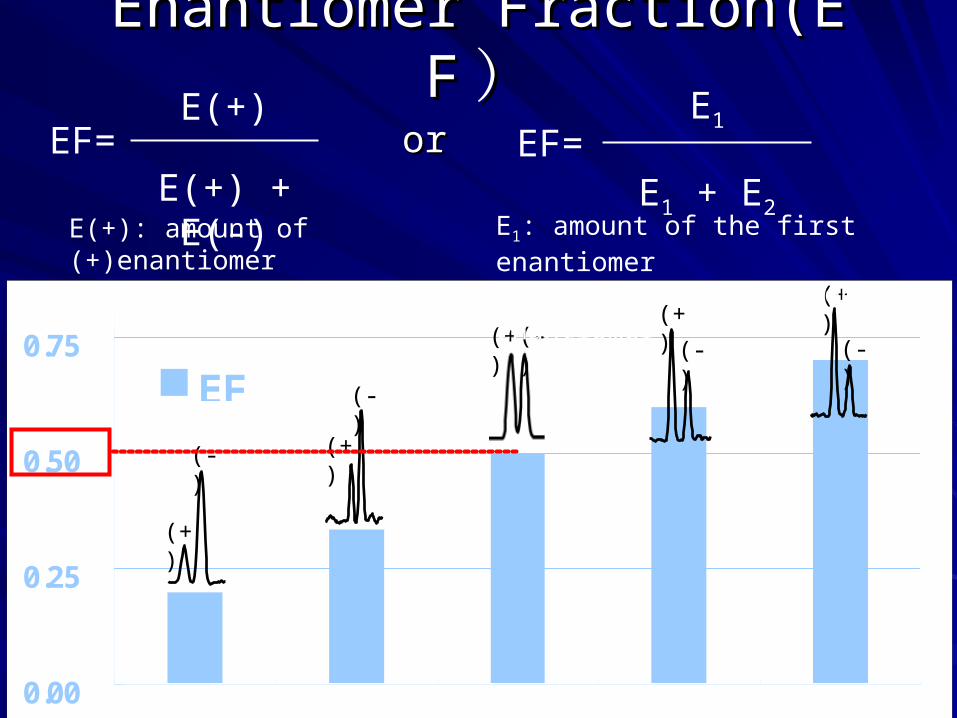
Enantiomer Fraction(EFEnantiomer Fraction(EF ))EF=
E(+)
E(+) + E(-)E(+): amount of (+)enantiomerE(-) : amount of (- ) enantiomer
(+)
(-) (+)
(-)
(+)(-)(+)
(-)
(+)
(-)
EF=
E1
E1 + E2E1: amount of the first enantiomerE2: amount of the second enantiomer
oror
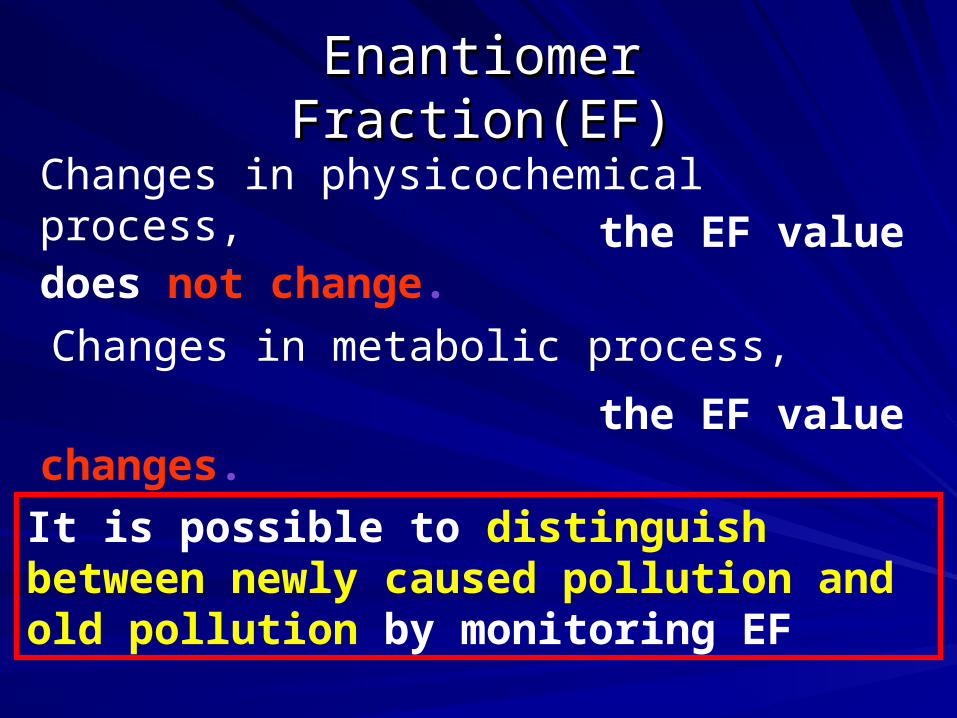
Enantiomer Fraction(EF)Enantiomer Fraction(EF)
Changes in physicochemical process,
It is possible to distinguish between newly caused pollution and old pollution by monitoring EF
the EF value does not change.
Changes in metabolic process,
the EF value changes.
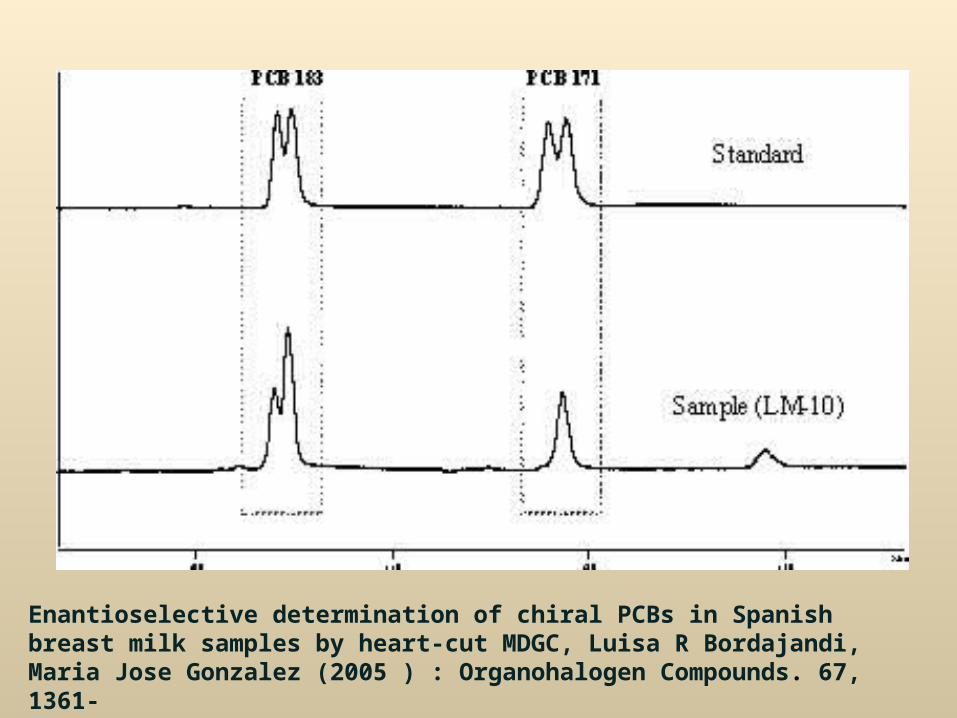
Enantioselective determination of chiral PCBs in Spanish breast milk samples by heart-cut MDGC, Luisa R Bordajandi, Maria Jose Gonzalez (2005 ) : Organohalogen Compounds. 67, 1361-

DISTRIBUTION OF CHIRAL PCBs IN SELECTED TISSUES IN THE LABORATORY RAT , Hans-Joachim Lehmler, et al (2004): Organohalogen Compounds. 66, 443-
PCB-91 PCB-95 PCB-149
Chlorofen n.d. 0.5 0.5
soil 0.46 0.5 0.5
Adipose 0.73, n=1 0.66, n=2 0.50±0.04
(0.62, n=1) (0.53, n=1) (0.48, n=2)
Brain n.d. n.d. n.d.
Heart n.d. n.d. n.d.
(0.53,n=1)
Kidney n.d. n.d. 0.52±0.04
(0.55,n=2)
Liver n.d. 0.47,n=1 0.52±0.04
(0.54,n=2)
Lung n.d. n.d. 0.47,n=2
Skin n.d. 0.54,n=1 0.49±0.04
(0.41,n=1)
Spleen n.d. 0.51,n=2 0.54±0.03
(0.56,n=1) (0.54±0.04)
WholeBlood n.d. n.d. 0.52,n=1
Serum n.d. n.d. 0.06,n=2
Enantiomeric fraction of PCB 91, 95 and 149 in tissues and blood from soil extract-treated animals
30 2011/05/23
GC/MS AnalysisGC/MS Analysis
10 12 14 16 18 20 22 24 26 28 30 32 34 36 38 40Retention Time (min)
0
200000
400000
600000
800000
1000000
1200000
1400000
Inte
nsity
2PM
121
4PH
104
3PM
982M
832M
111
4PM
121
3M12
12P
M11
24P
M93
2M10
93M
119
3M84
4PM
101
3M11
32P
M11
42P
M10
64P
M12
04P
M86
4PM
112
4PM
107
3M11
84M
109
3M11
04M
974P
M12
74P
M10
6
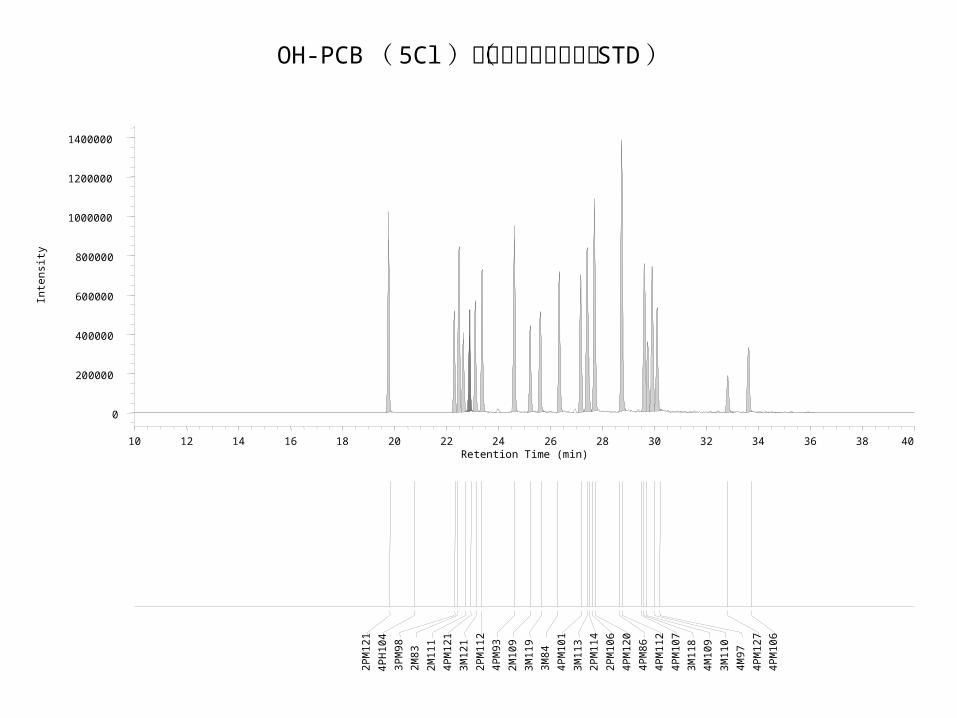
OH-PCB ( 5Cl )のクロマトグラム( STD )
10 12 14 16 18 20 22 24 26 28 30 32 34 36 38 40Retention Time (min)
0
10000
20000
30000
40000
50000
60000
70000
80000
90000
100000
110000
Inte
nsity
2PM
121
4PH
104
3PM
982M
832M
111
4PM
121
3M12
12P
M11
24P
M93
2M10
93M
119
3M84
4PM
101
3M11
32P
M11
42P
M10
64P
M12
04P
M86
4PM
112
4PM
107
3M11
84M
109
3M11
04M
974P
M12
74P
M10
6
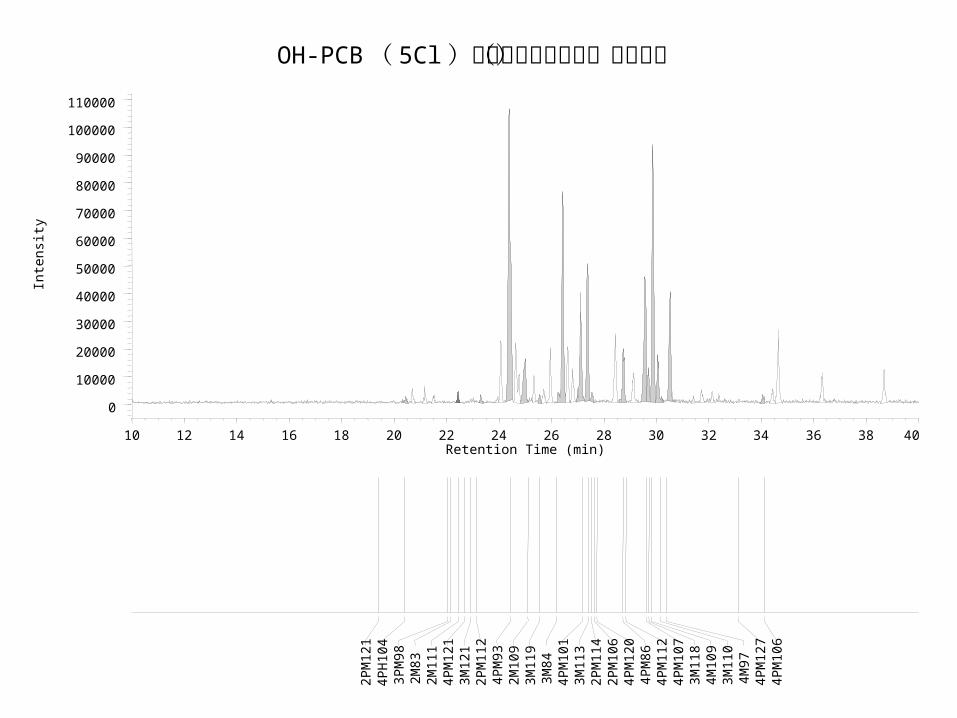
OH-PCB ( 5Cl )のクロマトグラム(尿試料)
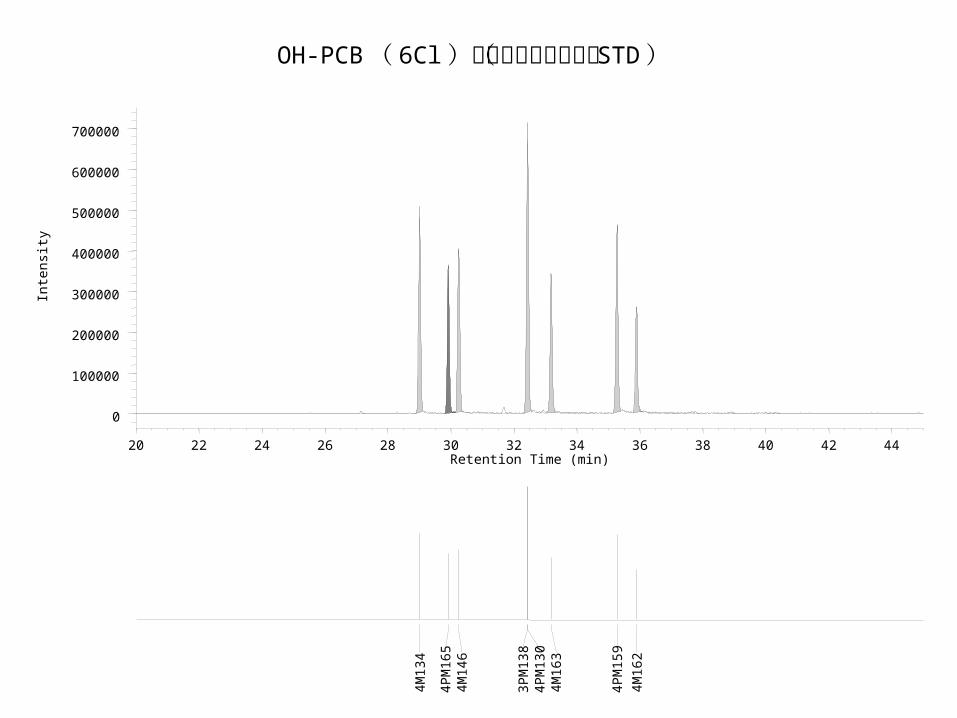
OH-PCB ( 6Cl )のクロマトグラム( STD )
20 22 24 26 28 30 32 34 36 38 40 42 44Retention Time (min)
0
100000
200000
300000
400000
500000
600000
700000
Inte
nsity
4M13
4
4PM
165
4M14
6
3PM
138
4PM
130
4M16
3
4PM
159
4M16
2
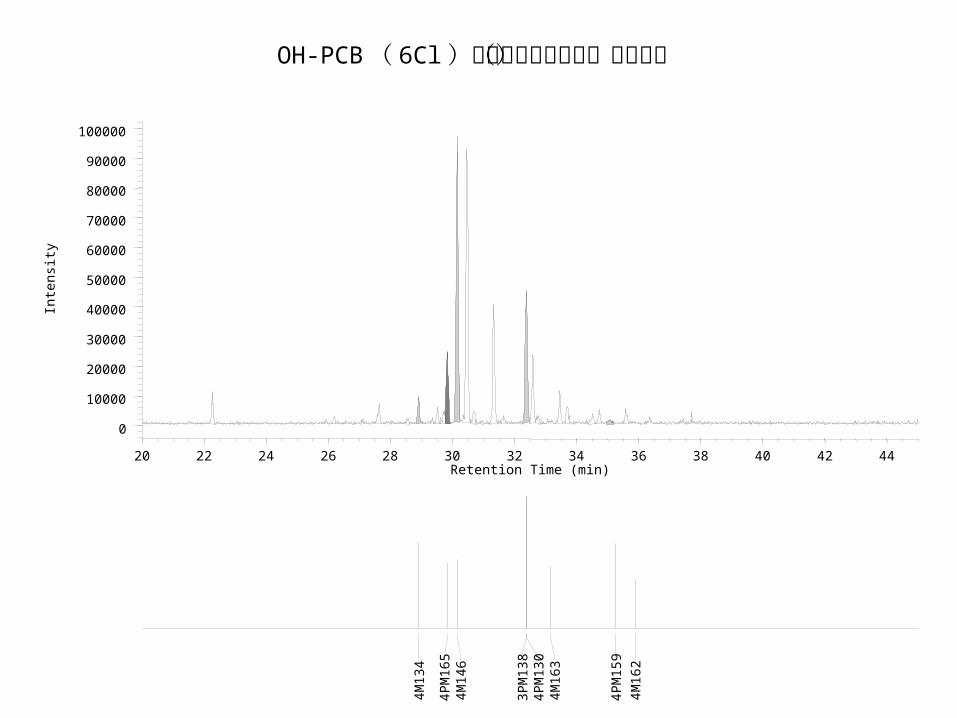
OH-PCB ( 6Cl )のクロマトグラム(尿試料)
20 22 24 26 28 30 32 34 36 38 40 42 44Retention Time (min)
0
10000
20000
30000
40000
50000
60000
70000
80000
90000
100000
Inte
nsity
4M13
4
4PM
165
4M14
6
3PM
138
4PM
130
4M16
3
4PM
159
4M16
2