Embed Size (px)
Citation preview
“Development of Reduction Emission Scenarios’ Strategy and
Health Consequences of Air Pollution in Jakarta”
TCAP-RCCC UI
INTRODUCTION
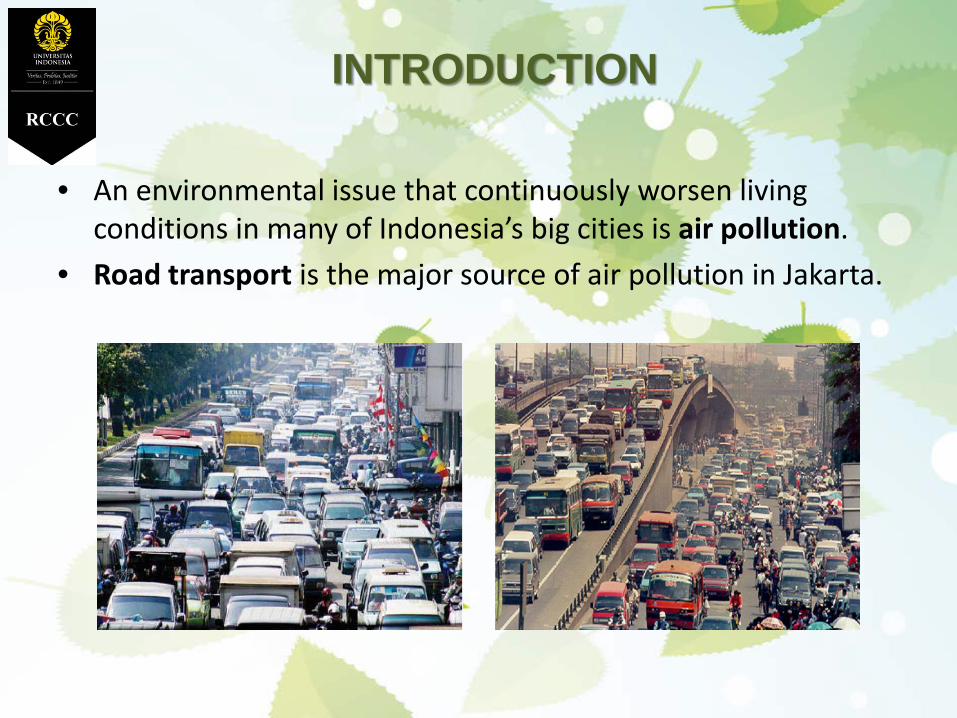
• An environmental issue that continuously worsen living conditions in many of Indonesia’s big cities is air pollution.
• Road transport is the major source of air pollution in Jakarta.
INTRODUCTION
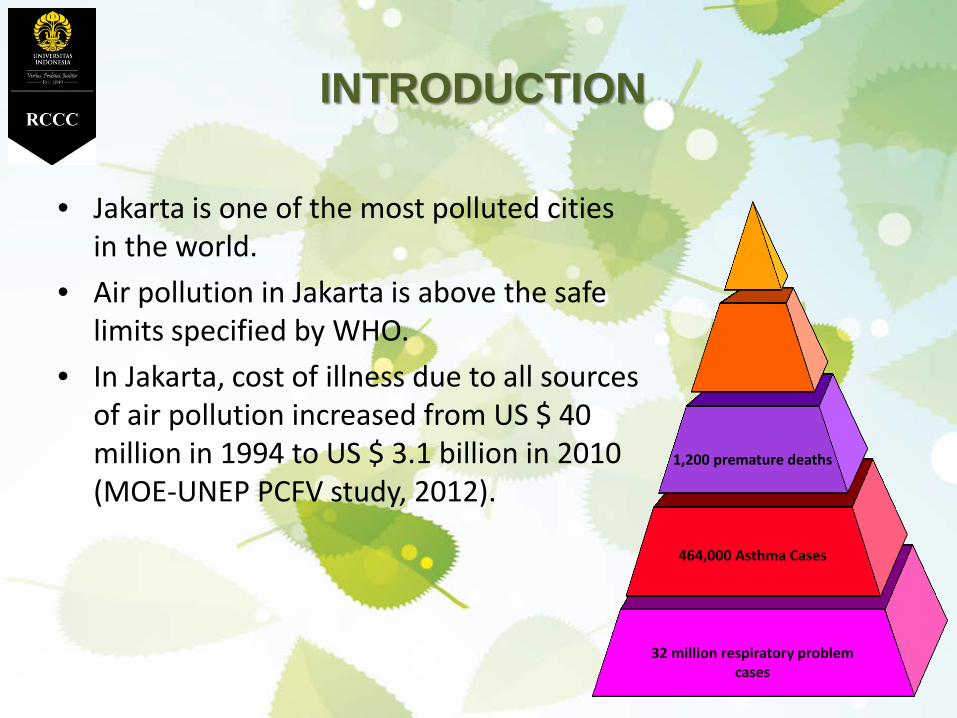
• Jakarta is one of the most polluted cities in the world.
• Air pollution in Jakarta is above the safe limits specified by WHO.
• In Jakarta, cost of illness due to all sources of air pollution increased from US $ 40 million in 1994 to US $ 3.1 billion in 2010 (MOE-UNEP PCFV study, 2012).
1,200 premature deaths
464,000 Asthma Cases
32 million respiratory problem cases
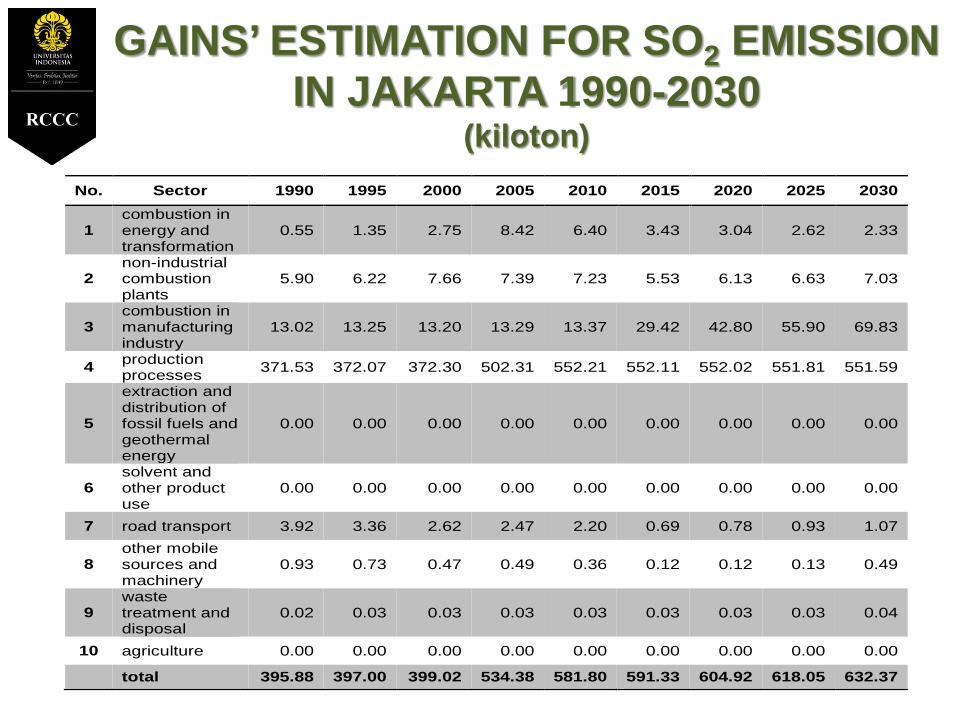
No. Sector 1990 1995 2000 2005 2010 2015 2020 2025 2030
1 combustion in energy and transformation
0.55 1.35 2.75 8.42 6.40 3.43 3.04 2.62 2.33
2 non-industrial combustion plants
5.90 6.22 7.66 7.39 7.23 5.53 6.13 6.63 7.03
3 combustion in manufacturing industry
13.02 13.25 13.20 13.29 13.37 29.42 42.80 55.90 69.83
4 production processes 371.53 372.07 372.30 502.31 552.21 552.11 552.02 551.81 551.59
5
extraction and distribution of fossil fuels and geothermal energy
0.00 0.00 0.00 0.00 0.00 0.00 0.00 0.00 0.00
6 solvent and other product use
0.00 0.00 0.00 0.00 0.00 0.00 0.00 0.00 0.00
7 road transport 3.92 3.36 2.62 2.47 2.20 0.69 0.78 0.93 1.07
8 other mobile sources and machinery
0.93 0.73 0.47 0.49 0.36 0.12 0.12 0.13 0.49
9 waste treatment and disposal
0.02 0.03 0.03 0.03 0.03 0.03 0.03 0.03 0.04
10 agriculture 0.00 0.00 0.00 0.00 0.00 0.00 0.00 0.00 0.00
total 395.88 397.00 399.02 534.38 581.80 591.33 604.92 618.05 632.37
GAINS’ ESTIMATION FOR SO2 EMISSION IN JAKARTA 1990-2030
(kiloton)
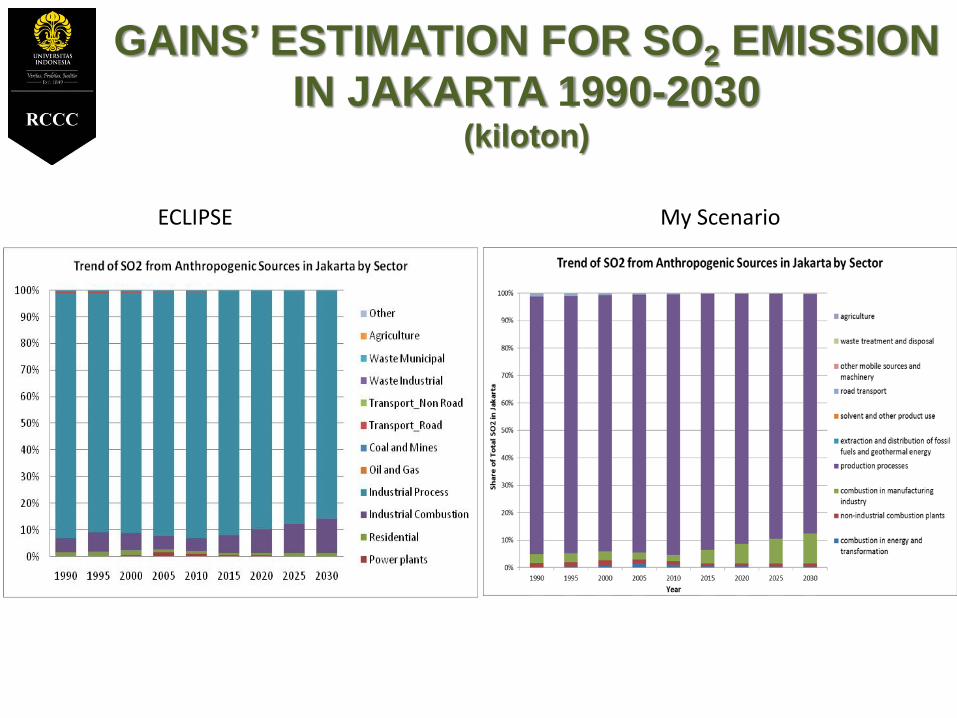
ECLIPSE My Scenario
GAINS’ ESTIMATION FOR SO2 EMISSION IN JAKARTA 1990-2030
(kiloton)
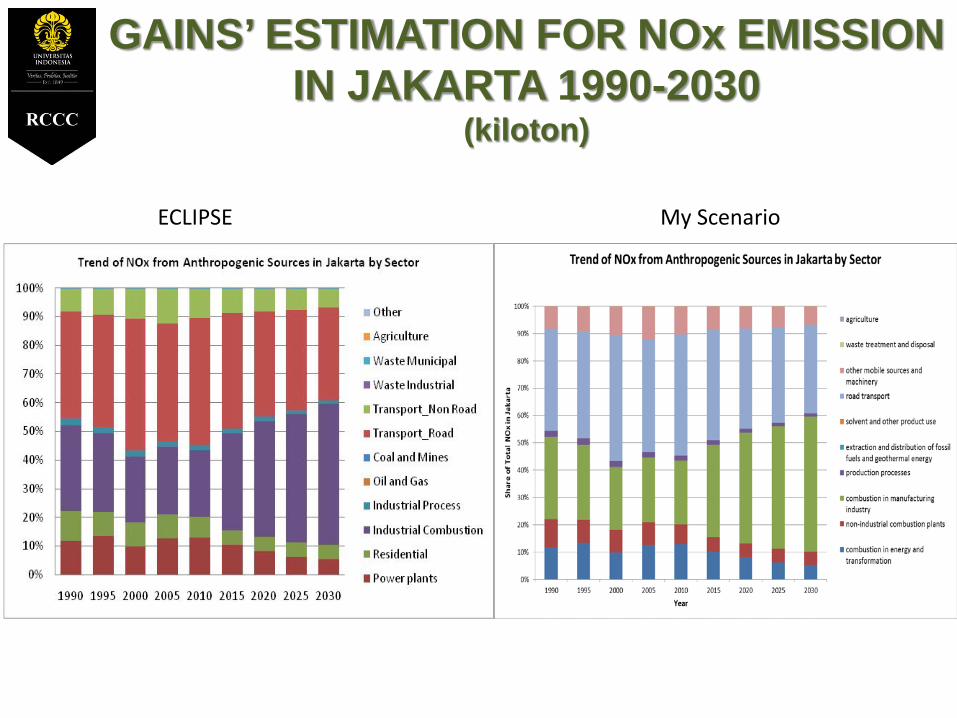
GAINS’ ESTIMATION FOR NOx EMISSION IN JAKARTA 1990-2030
(kiloton)
ECLIPSE My Scenario
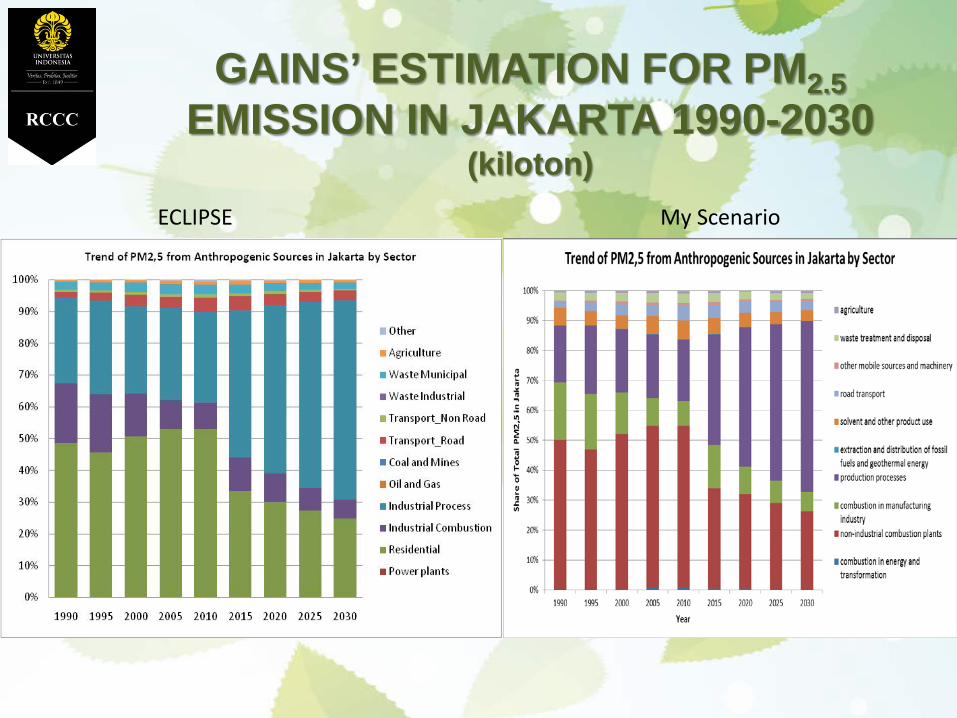
ECLIPSE My Scenario
GAINS’ ESTIMATION FOR PM2.5EMISSION IN JAKARTA 1990-2030
(kiloton)
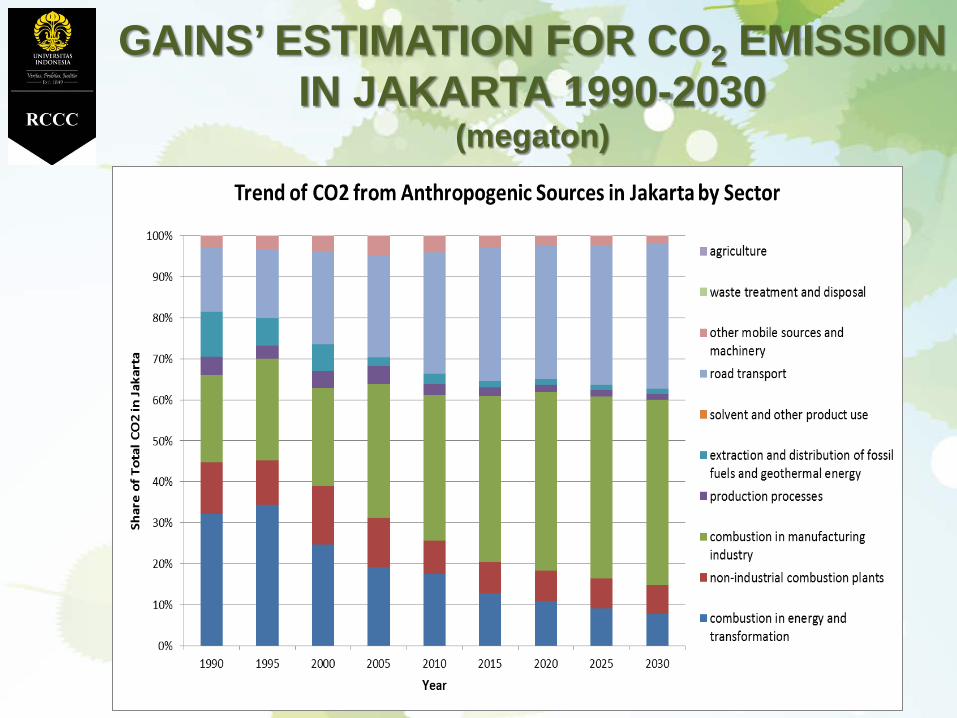
GAINS’ ESTIMATION FOR CO2 EMISSION IN JAKARTA 1990-2030
(megaton)
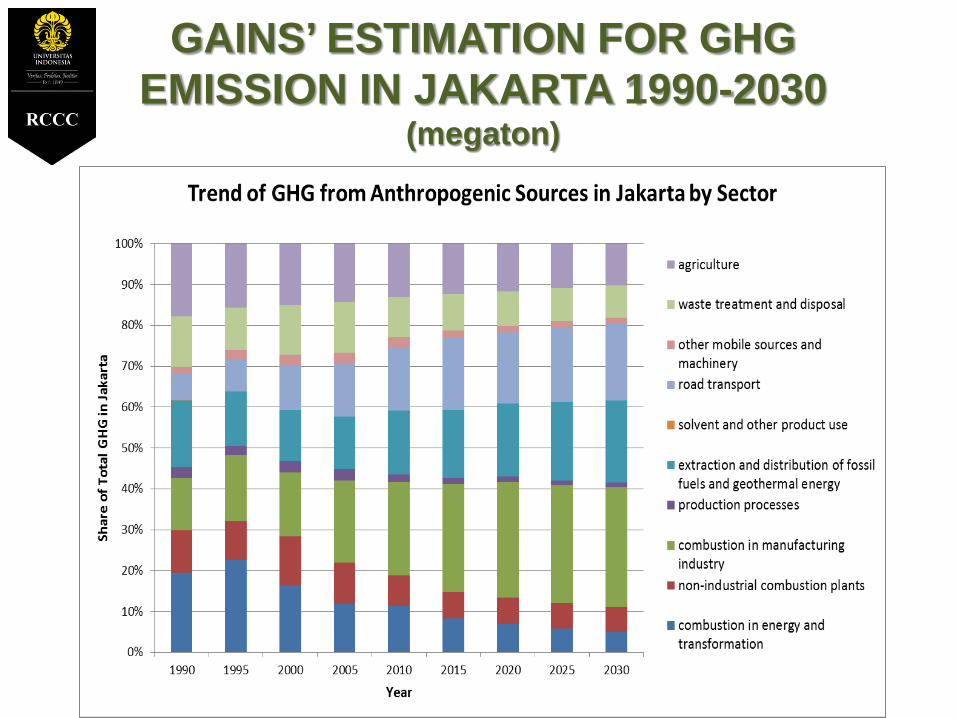
GAINS’ ESTIMATION FOR GHG EMISSION IN JAKARTA 1990-2030
(megaton)
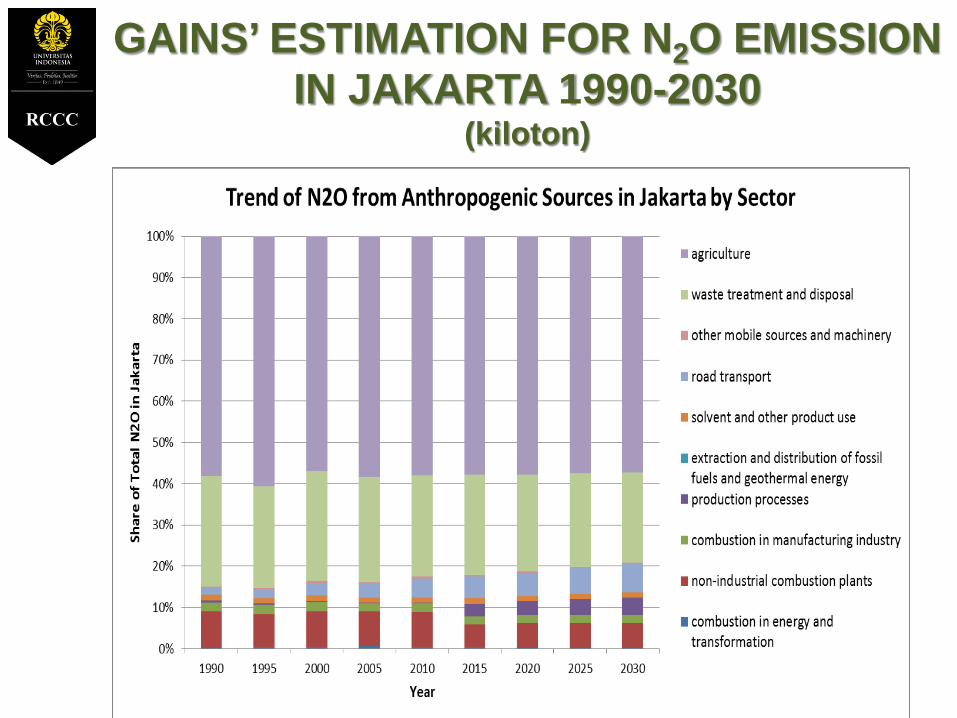
GAINS’ ESTIMATION FOR N2O EMISSION IN JAKARTA 1990-2030
(kiloton)
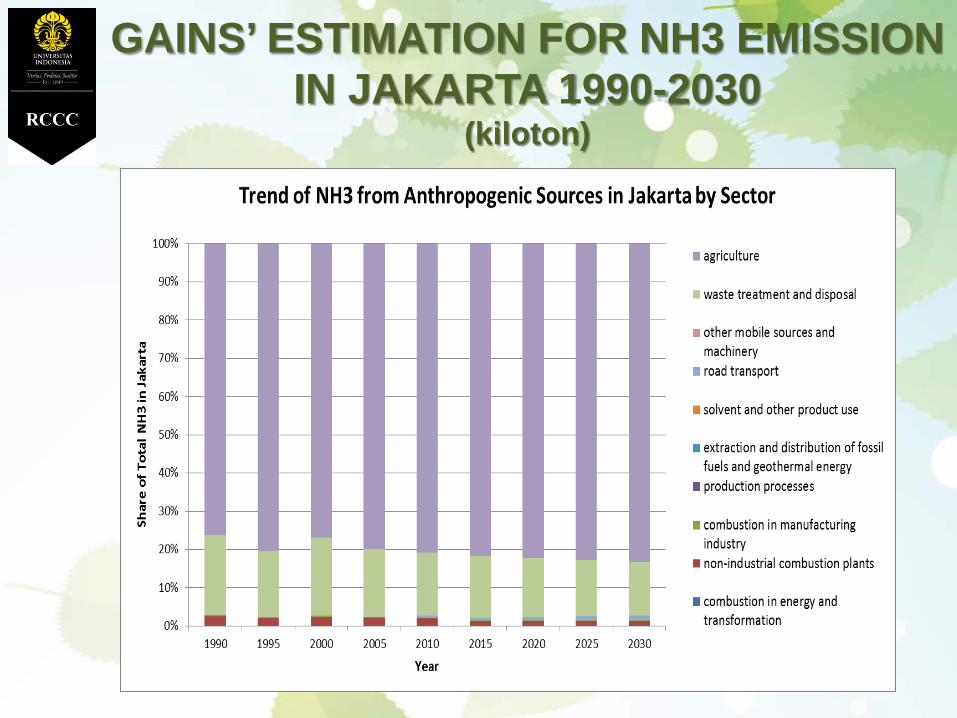
GAINS’ ESTIMATION FOR NH3 EMISSION IN JAKARTA 1990-2030
(kiloton)
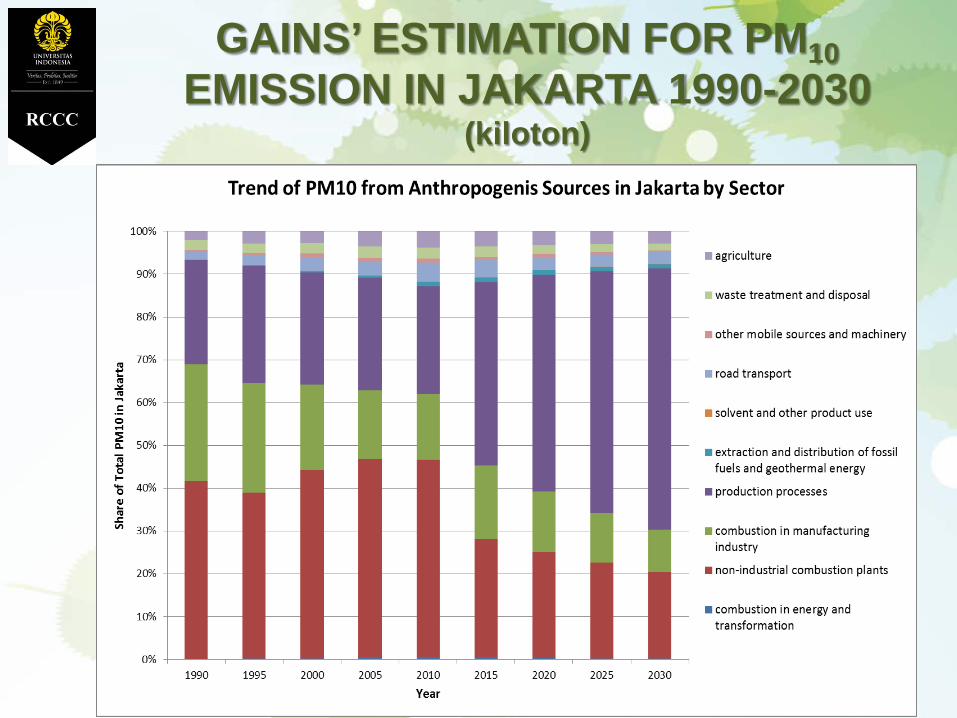
GAINS’ ESTIMATION FOR PM10EMISSION IN JAKARTA 1990-2030
(kiloton)
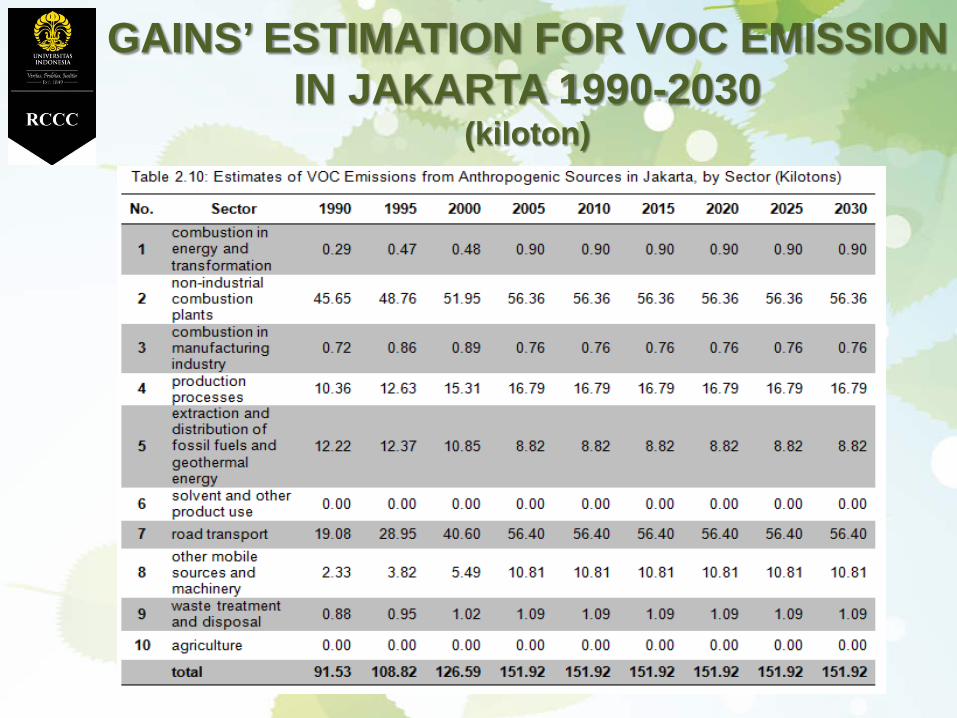
GAINS’ ESTIMATION FOR VOC EMISSION IN JAKARTA 1990-2030
(kiloton)
DATA INVENTORY AND ANALYSIS OF JAKARTA
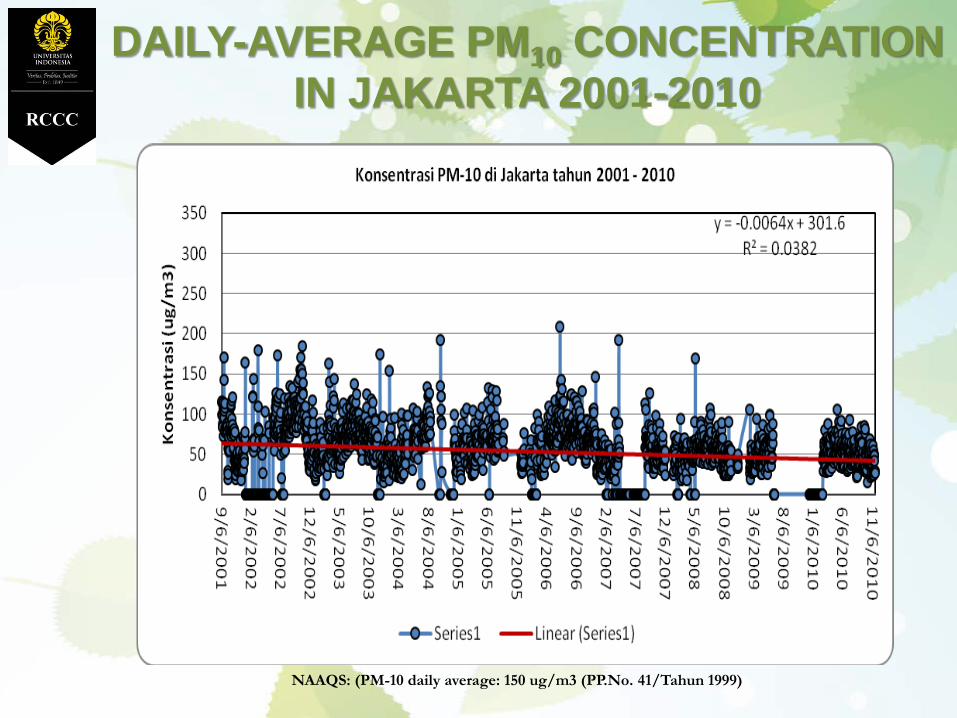
DAILY-AVERAGE PM10 CONCENTRATION IN JAKARTA 2001-2010
NAAQS: (PM-10 daily average: 150 ug/m3 (PP.No. 41/Tahun 1999)
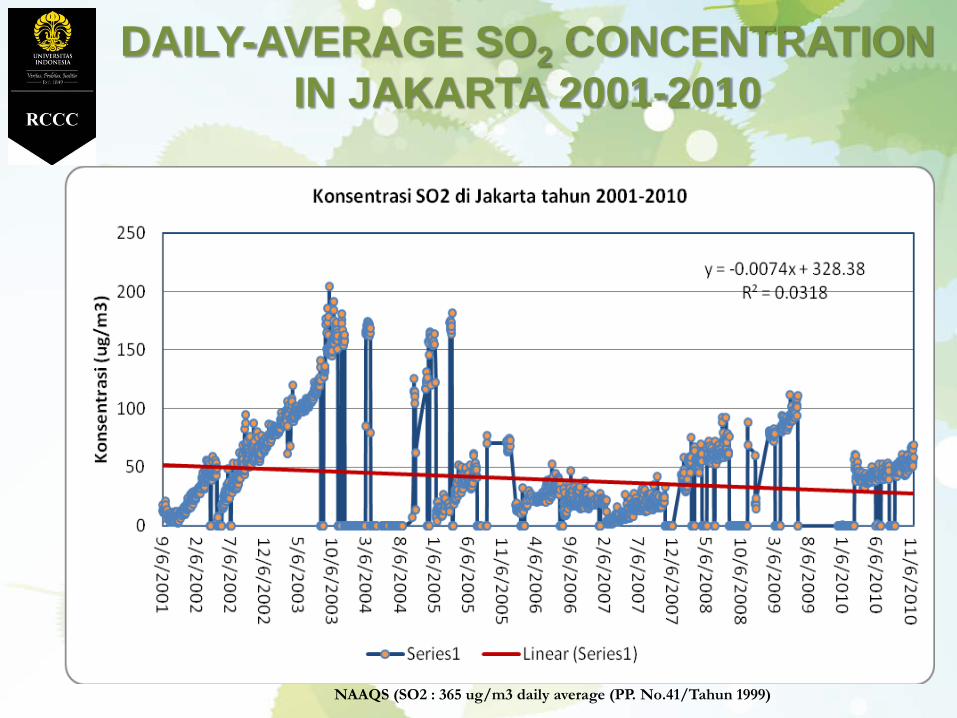
NAAQS (SO2 : 365 ug/m3 daily average (PP. No.41/Tahun 1999)
DAILY-AVERAGE SO2 CONCENTRATION IN JAKARTA 2001-2010
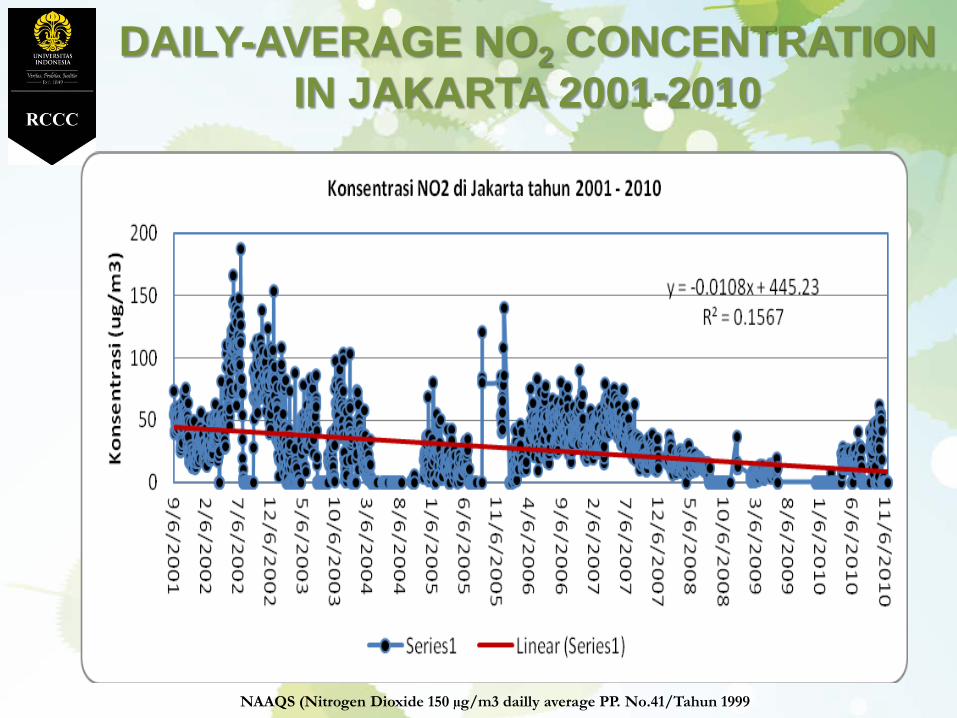
NAAQS (Nitrogen Dioxide 150 µg/m3 dailly average PP. No.41/Tahun 1999
DAILY-AVERAGE NO2 CONCENTRATION IN JAKARTA 2001-2010
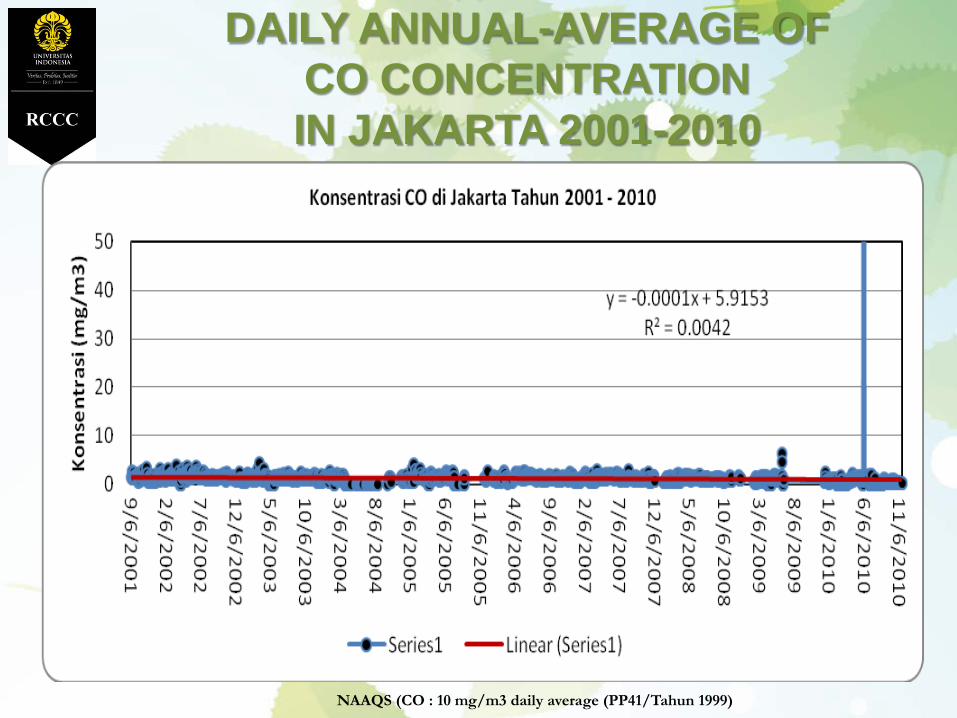
NAAQS (CO : 10 mg/m3 daily average (PP41/Tahun 1999)
DAILY ANNUAL-AVERAGE OF CO CONCENTRATION IN JAKARTA 2001-2010
Estimates of emissions of air pollutants from anthropogenic sources in Jakarta in 2010, by sector (kilotons)
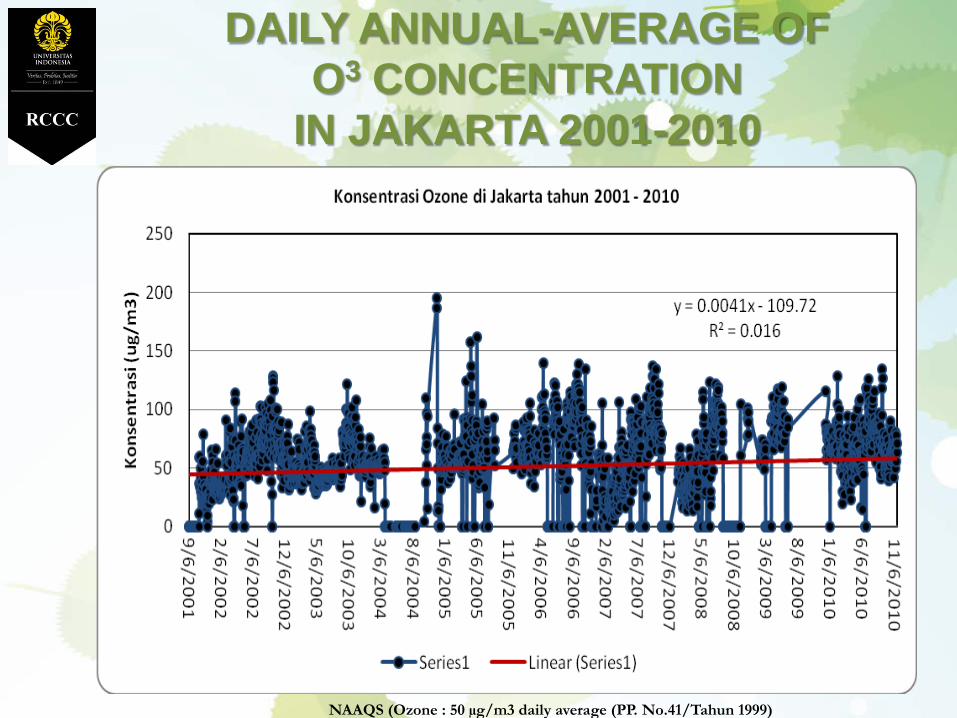
NAAQS (Ozone : 50 µg/m3 daily average (PP. No.41/Tahun 1999)
DAILY ANNUAL-AVERAGE OF O3 CONCENTRATION
IN JAKARTA 2001-2010
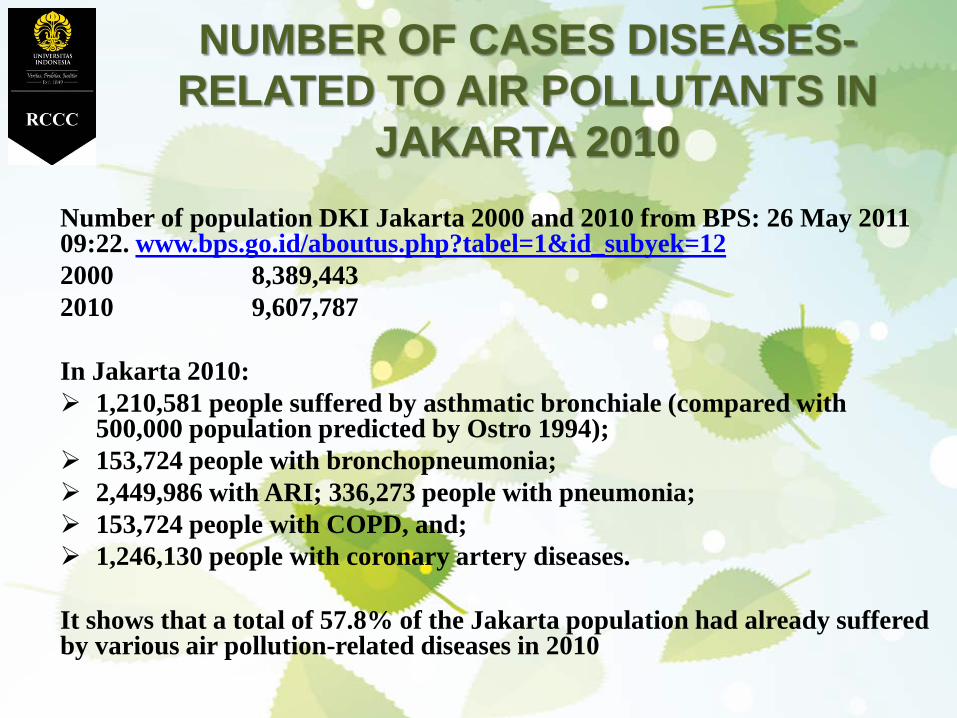
Number of population DKI Jakarta 2000 and 2010 from BPS: 26 May 2011 09:22. www.bps.go.id/aboutus.php?tabel=1&id_subyek=122000 8,389,4432010 9,607,787
In Jakarta 2010: 1,210,581 people suffered by asthmatic bronchiale (compared with
500,000 population predicted by Ostro 1994); 153,724 people with bronchopneumonia; 2,449,986 with ARI; 336,273 people with pneumonia; 153,724 people with COPD, and; 1,246,130 people with coronary artery diseases.
It shows that a total of 57.8% of the Jakarta population had already suffered by various air pollution-related diseases in 2010
NUMBER OF CASES DISEASES-RELATED TO AIR POLLUTANTS IN
JAKARTA 2010
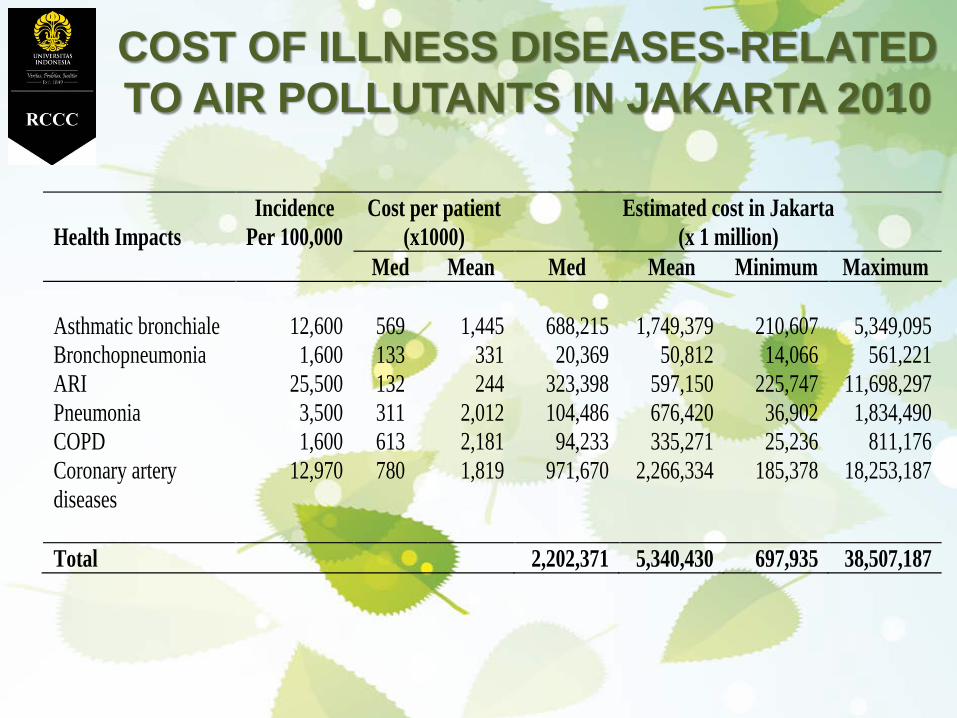
COST OF ILLNESS DISEASES-RELATED TO AIR POLLUTANTS IN JAKARTA 2010
Health Impacts
Incidence Per 100,000
Cost per patient (x1000)
Estimated cost in Jakarta (x 1 million)
Med Mean Med Mean Minimum Maximum Asthmatic bronchiale Bronchopneumonia ARI Pneumonia COPD Coronary artery diseases
12,600 1,600
25,500 3,500 1,600
12,970
569 133 132 311 613 780
1,445
331 244
2,012 2,181 1,819
688,215
20,369 323,398 104,486
94,233 971,670
1,749,379
50,812 597,150 676,420 335,271
2,266,334
210,607
14,066 225,747
36,902 25,236
185,378
5,349,095
561,221 11,698,297 1,834,490
811,176 18,253,187
Total 2,202,371 5,340,430 697,935 38,507,187
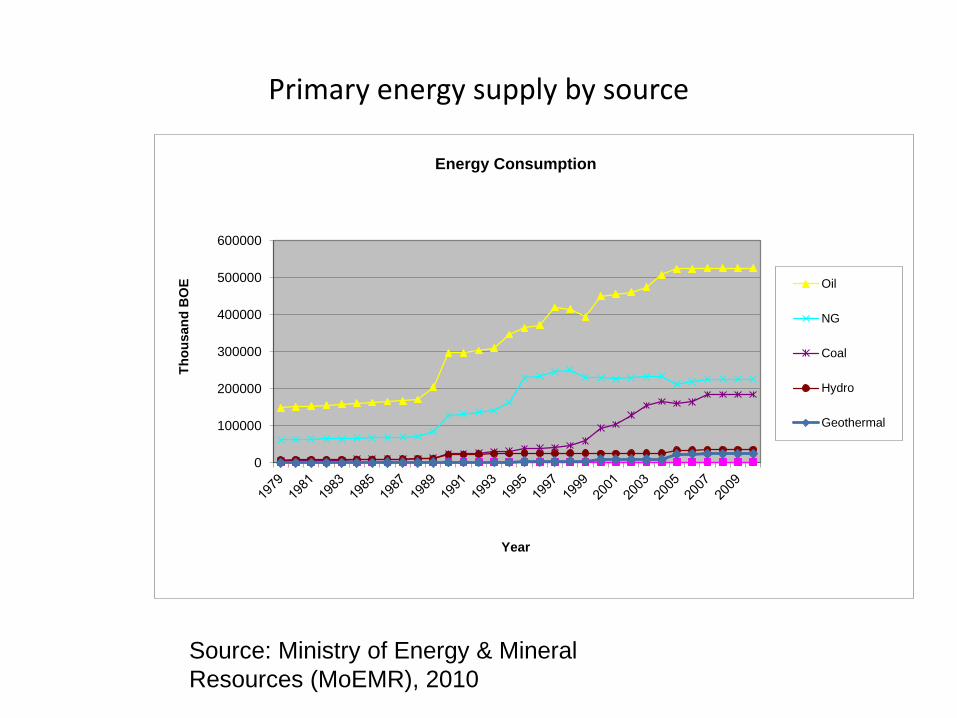
Primary energy supply by source
Source: Ministry of Energy & Mineral Resources (MoEMR), 2010
0
100000
200000
300000
400000
500000
600000
Thou
sand
BO
E
Year
Energy Consumption
Oil
NG
Coal
Hydro
Geothermal
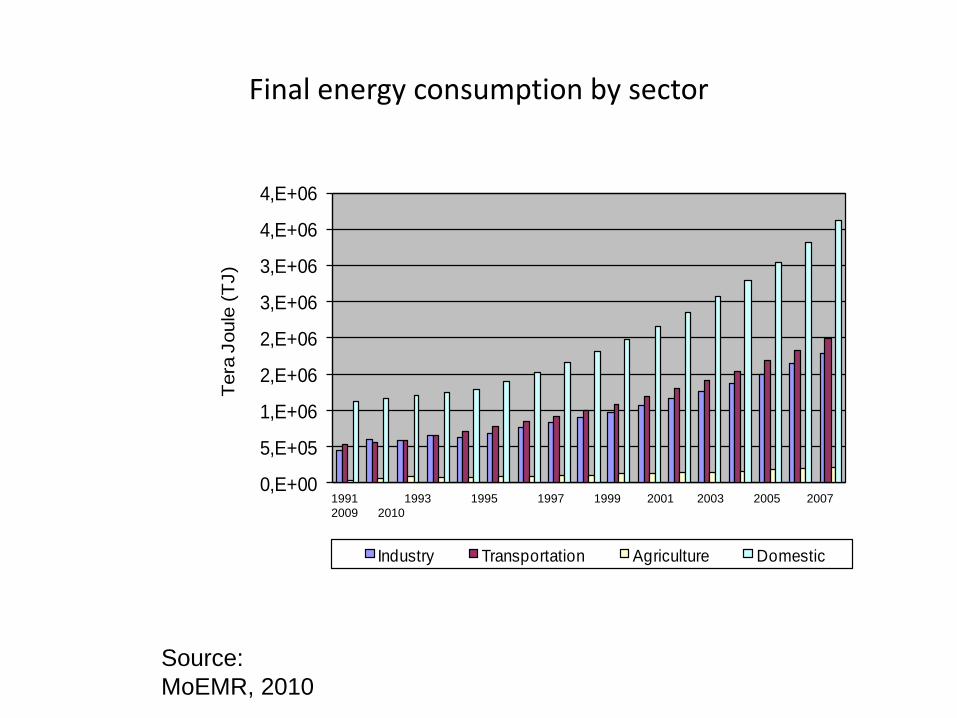
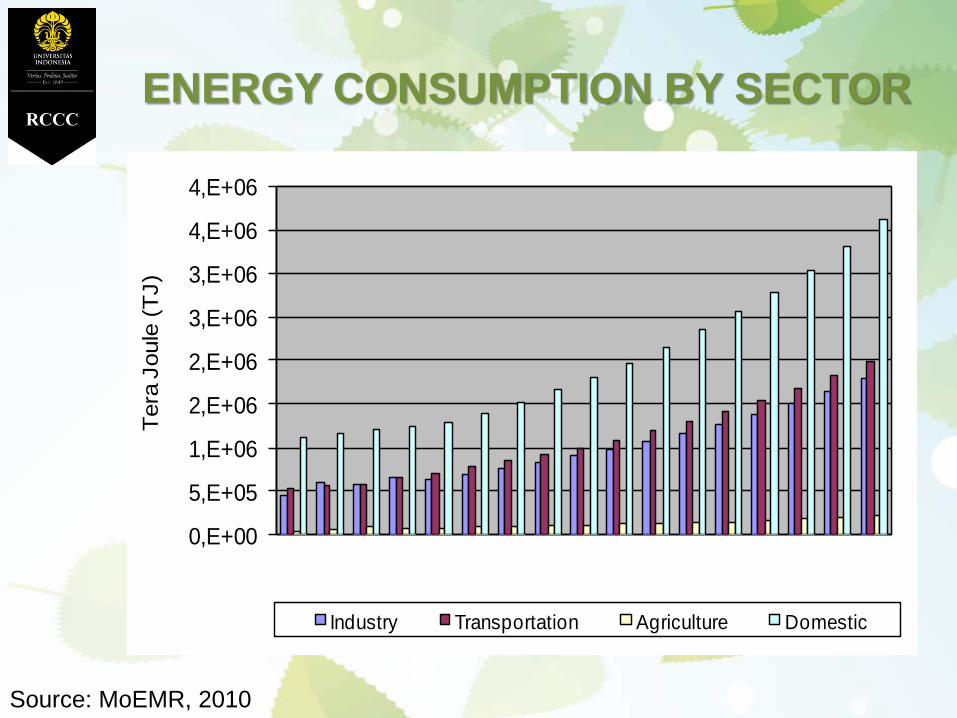
Final energy consumption by sector
0,E+00
5,E+05
1,E+06
2,E+06
2,E+06
3,E+06
3,E+06
4,E+06
4,E+06
Tera
Jou
le (T
J)
Year Industry Transportation Agriculture Domestic
Source: MoEMR, 2010
1991 1993 1995 1997 1999 2001 2003 2005 2007 2009 2010
INDONESIA
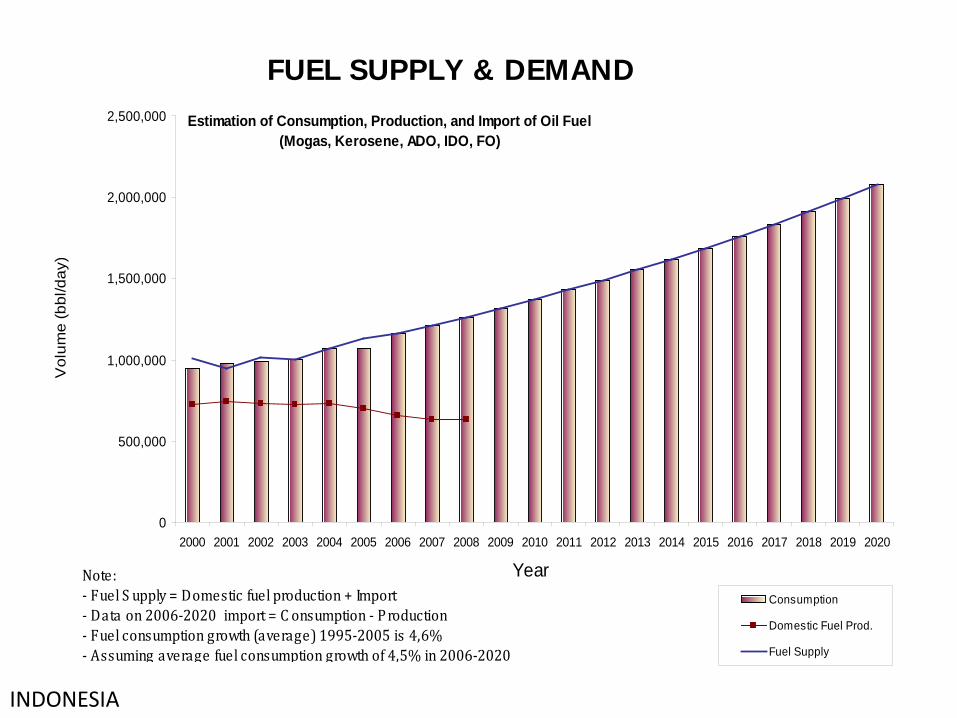
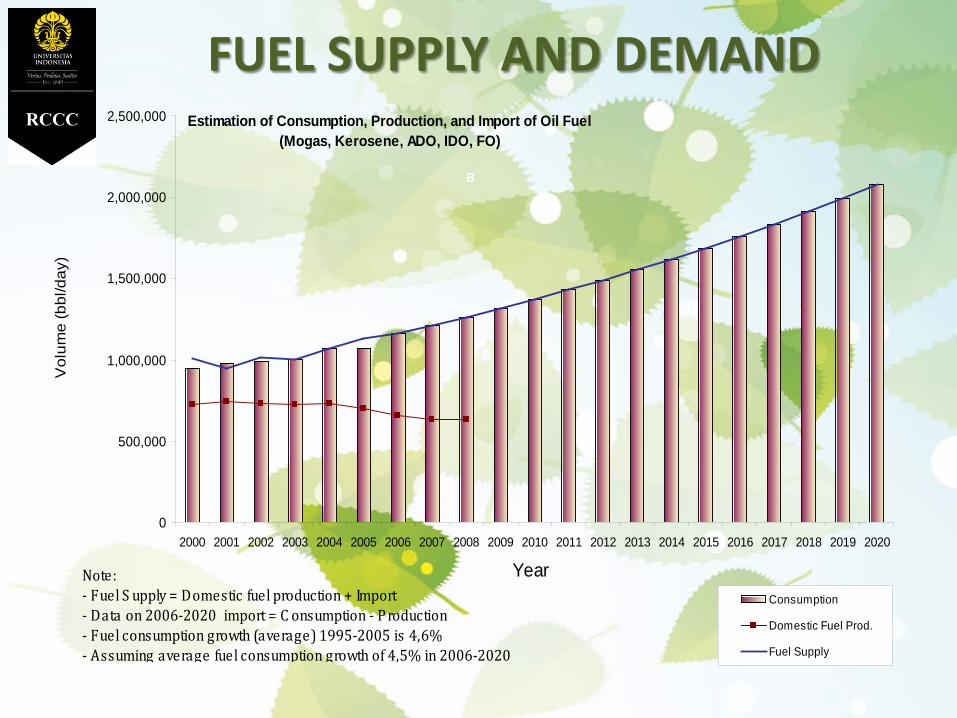
FUEL SUPPLY & DEMANDEstimation of Consumption, Production, and Import of Oil Fuel
(Mogas, Kerosene, ADO, IDO, FO)
0
500,000
1,000,000
1,500,000
2,000,000
2,500,000
2000 2001 2002 2003 2004 2005 2006 2007 2008 2009 2010 2011 2012 2013 2014 2015 2016 2017 2018 2019 2020
Year
Vol
ume
(bbl
/day
)
Consumption
Domestic Fuel Prod.
Fuel Supply
Note:- Fuel S upply = Domestic fuel production + Import- Data on 2006-2020 import = C onsumption - P roduction- Fuel consumption growth (average) 1995-2005 is 4,6% - Assuming average fuel consumption growth of 4,5% in 2006-2020
B
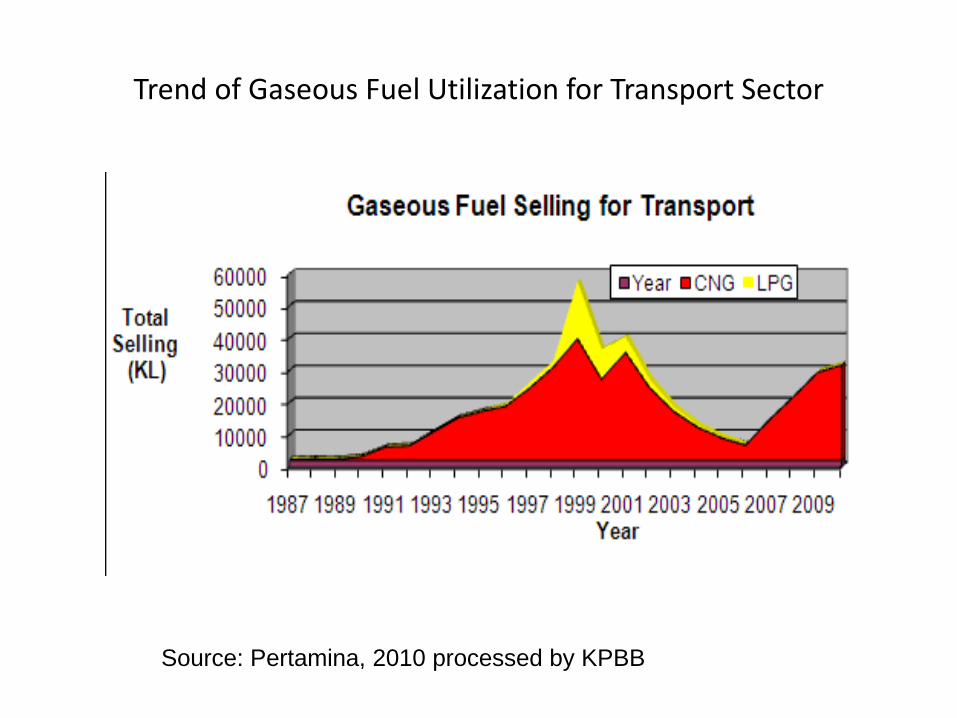
Trend of Gaseous Fuel Utilization for Transport Sector
Source: Pertamina, 2010 processed by KPBB
Bio-fuels
61%
36%
2%0%
0%
0%0%
1%
PREMIUM
PERTAMAX
PERTAMAX PLUS
BIOPREMIUM
BIOPERTAMAX E-5
SOLAR/HSD/MGO/ADO
PERTAMINA DEX
BIOSOLAR-B5
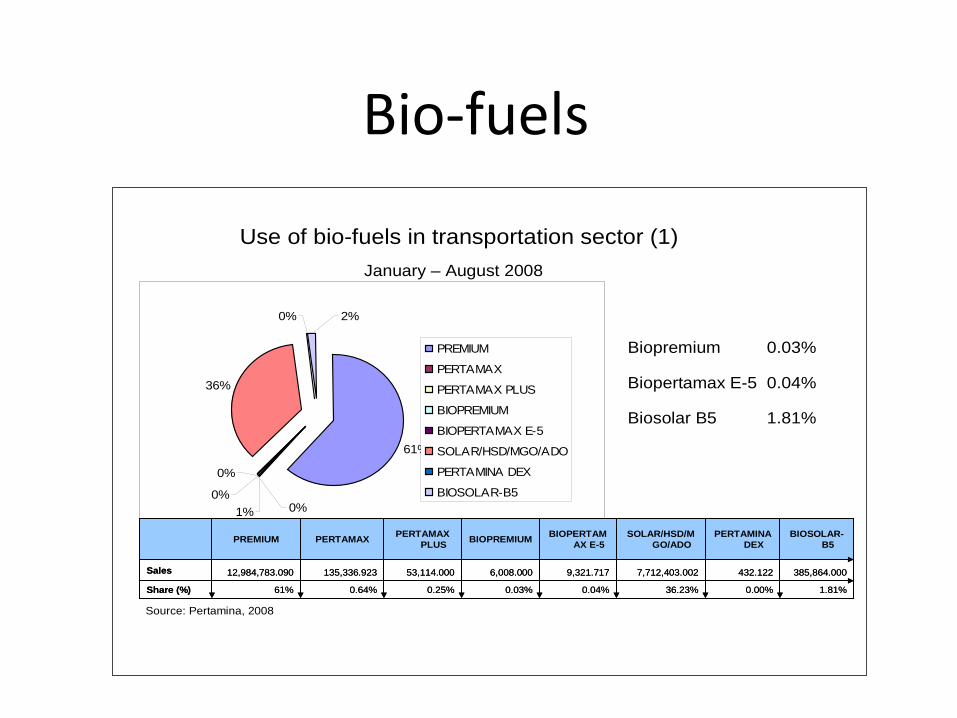
1.81%0.00%36.23%0.04%0.03%0.25%0.64%61%Share (%)
385,864.000432.1227,712,403.0029,321.7176,008.00053,114.000135,336.92312,984,783.090Sales
BIOSOLAR-B5
PERTAMINA DEX
SOLAR/HSD/MGO/ADO
BIOPERTAMAX E-5BIOPREMIUMPERTAMAX
PLUSPERTAMAXPREMIUM
1.81%0.00%36.23%0.04%0.03%0.25%0.64%61%Share (%)
385,864.000432.1227,712,403.0029,321.7176,008.00053,114.000135,336.92312,984,783.090Sales
BIOSOLAR-B5
PERTAMINA DEX
SOLAR/HSD/MGO/ADO
BIOPERTAMAX E-5BIOPREMIUMPERTAMAX
PLUSPERTAMAXPREMIUM
Source: Pertamina, 2008
January – August 2008
Use of bio-fuels in transportation sector (1)
Biopremium 0.03%
Biopertamax E-5 0.04%
Biosolar B5 1.81%
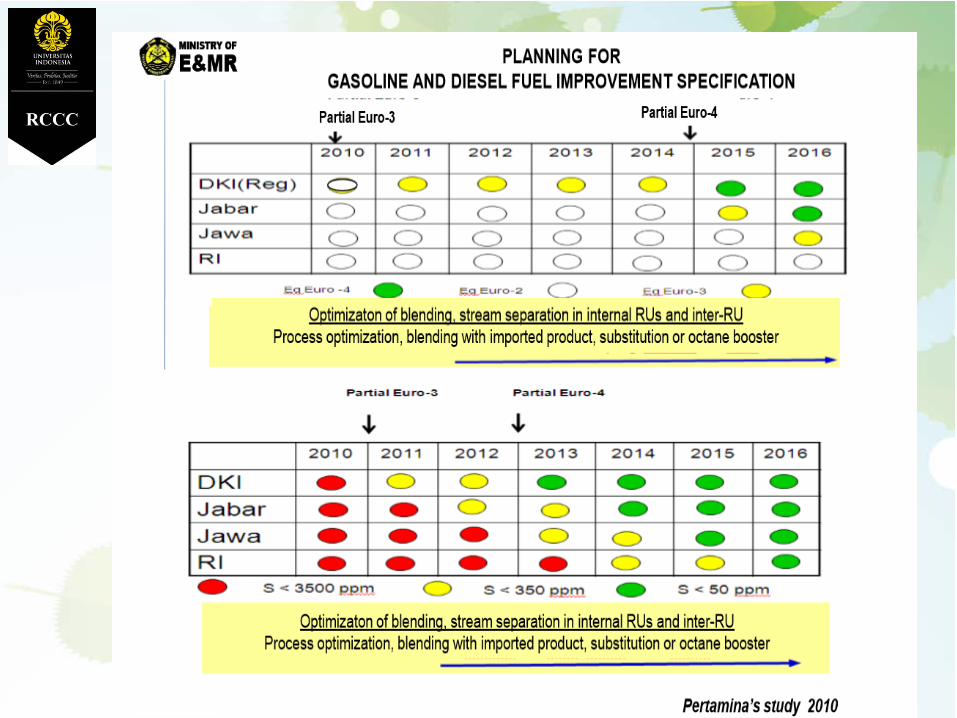
Key issues on fuel quality
• Indonesia is free of leaded gasoline • Diesel oil does not comply with Euro 2 fuel requirement
– Total Domestic Refineries Production of ADO spec. (S max. 3500 ppm) is approx 87.0 Million Barrel per year
– Total import ADO spec. (Sulfur content 5000. ppm) is approx 75.0 Million Barrel per year for Industry
– Sulfur content at pump is in the range of 400 ppm to 4600 ppm• Transport sector absorbs significant portion of fuel subsidy
Key issues with fuel supply, demand, and subsidy
NATIONAL DATA, REGULATIONS AND POLICIES
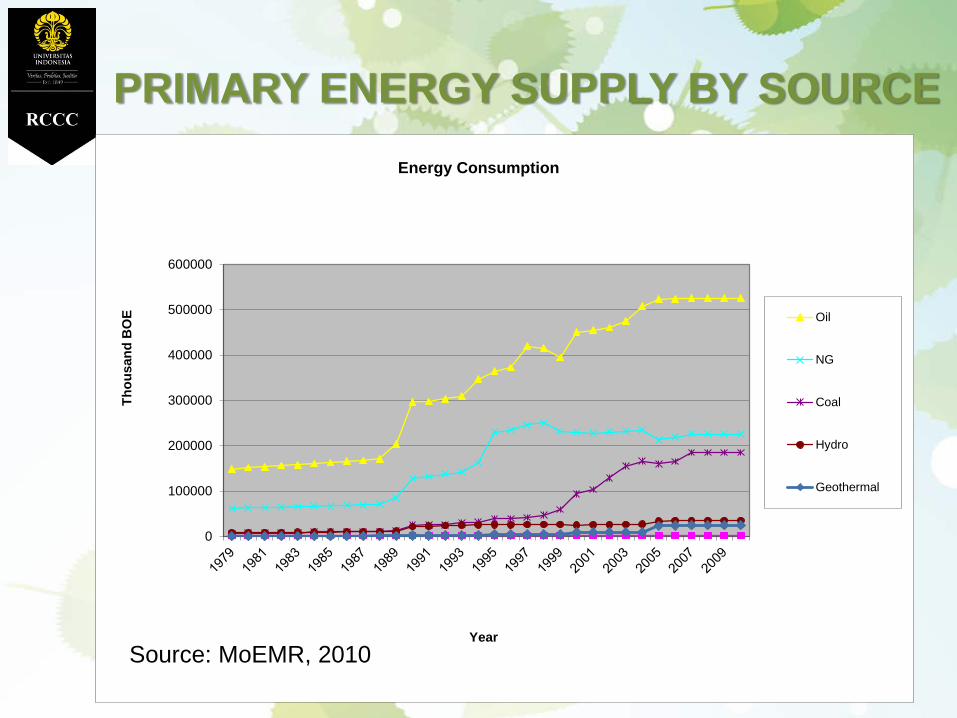
PRIMARY ENERGY SUPPLY BY SOURCE
0
100000
200000
300000
400000
500000
600000
Thou
sand
BO
E
Year
Energy Consumption
Oil
NG
Coal
Hydro
Geothermal
Source: MoEMR, 2010
0,E+00
5,E+05
1,E+06
2,E+06
2,E+06
3,E+06
3,E+06
4,E+06
4,E+06Te
ra J
oule
(TJ)
Year Industry Transportation Agriculture Domestic
ENERGY CONSUMPTION BY SECTOR
Source: MoEMR, 2010
Estimation of Consumption, Production, and Import of Oil Fuel(Mogas, Kerosene, ADO, IDO, FO)
0
500,000
1,000,000
1,500,000
2,000,000
2,500,000
2000 2001 2002 2003 2004 2005 2006 2007 2008 2009 2010 2011 2012 2013 2014 2015 2016 2017 2018 2019 2020
Year
Vol
ume
(bbl
/day
)
Consumption
Domestic Fuel Prod.
Fuel Supply
Note:- Fuel S upply = Domestic fuel production + Import- Data on 2006-2020 import = C onsumption - P roduction- Fuel consumption growth (average) 1995-2005 is 4,6% - Assuming average fuel consumption growth of 4,5% in 2006-2020
B
FUEL SUPPLY AND DEMAND
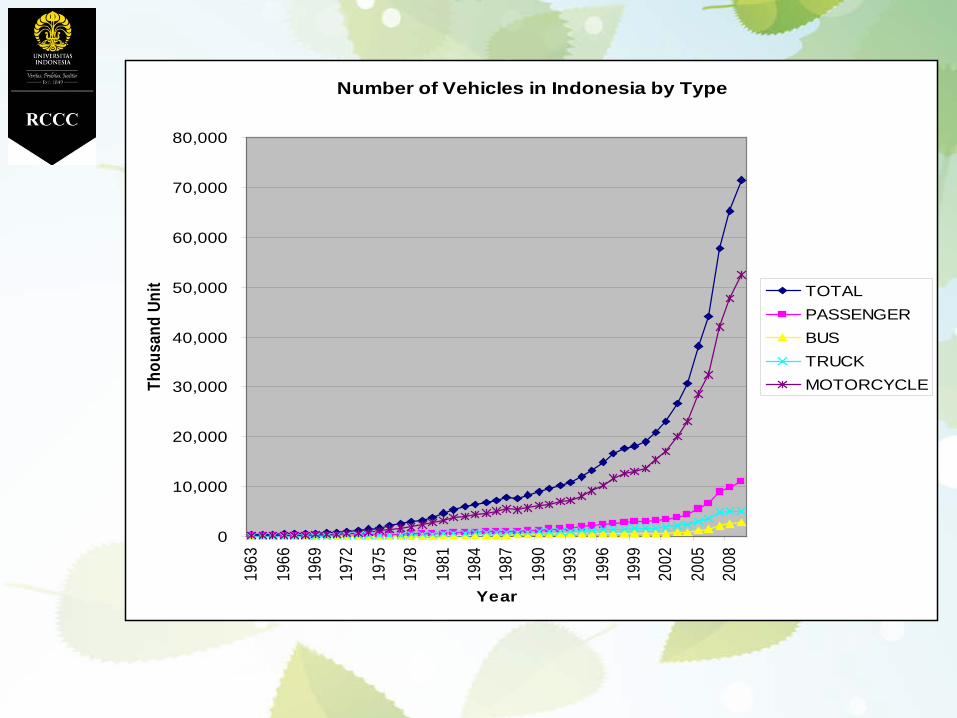
Number of Vehicles in Indonesia by Type
0
10,000
20,000
30,000
40,000
50,000
60,000
70,000
80,000
1963
1966
1969
1972
1975
1978
1981
1984
1987
1990
1993
1996
1999
2002
2005
2008
Year
Thou
sand
Uni
t TOTALPASSENGERBUSTRUCKMOTORCYCLE
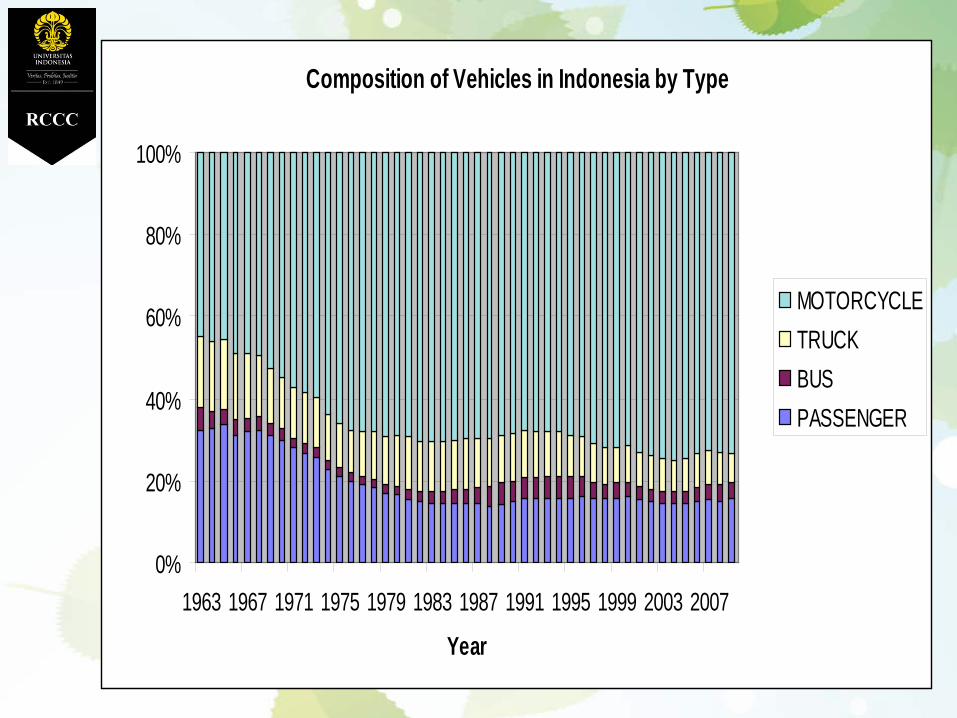
Composition of Vehicles in Indonesia by Type
0%
20%
40%
60%
80%
100%
1963 1967 1971 1975 1979 1983 1987 1991 1995 1999 2003 2007
Year
MOTORCYCLETRUCKBUSPASSENGER
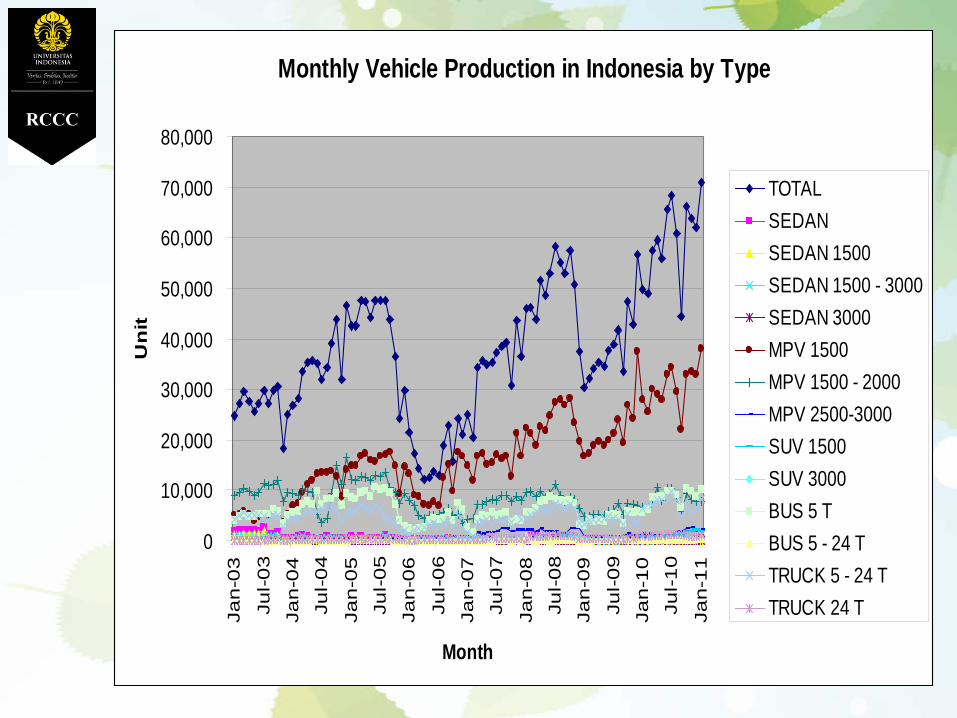
Monthly Vehicle Production in Indonesia by Type
0
10,000
20,000
30,000
40,000
50,000
60,000
70,000
80,000
Jan
-03
Jul-
03
Jan
-04
Jul-
04
Jan
-05
Jul-
05
Jan
-06
Jul-
06
Jan
-07
Jul-
07
Jan
-08
Jul-
08
Jan
-09
Jul-
09
Jan
-10
Jul-
10
Jan
-11
Month
Un
it
TOTALSEDANSEDAN 1500SEDAN 1500 - 3000SEDAN 3000MPV 1500MPV 1500 - 2000MPV 2500-3000SUV 1500SUV 3000BUS 5 TBUS 5 - 24 TTRUCK 5 - 24 TTRUCK 24 T
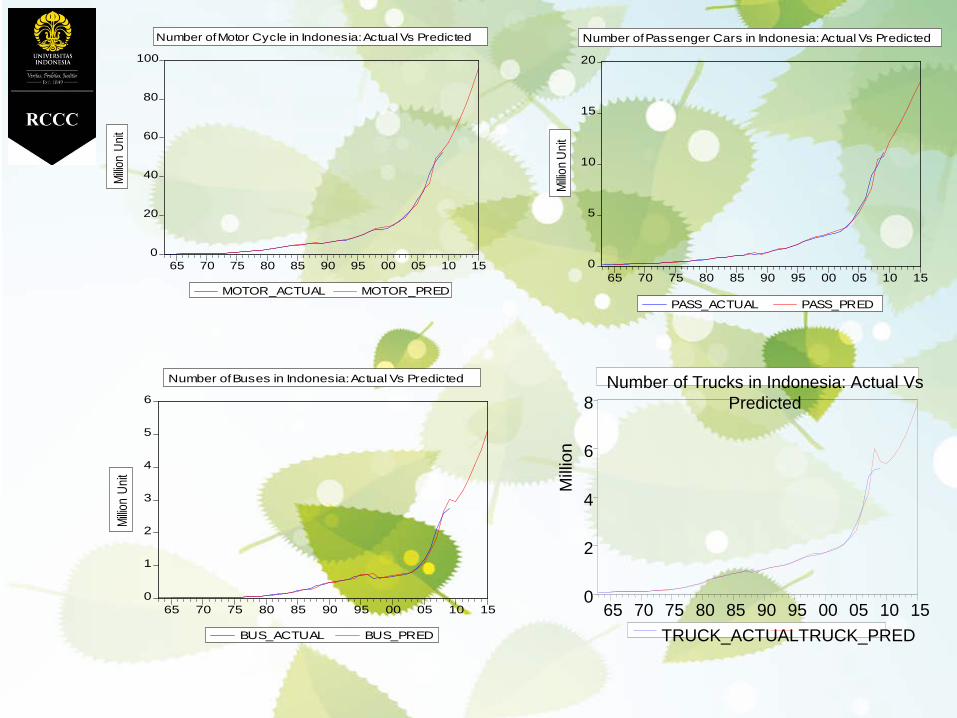
0
20
40
60
80
100
65 70 75 80 85 90 95 00 05 10 15
MOTOR_ACTUAL MOTOR_PRED
Number of Motor Cycle in Indonesia: Actual Vs Predicted
Millio
n Un
it
0
5
10
15
20
65 70 75 80 85 90 95 00 05 10 15
PASS_ACTUAL PASS_PRED
Number of Passenger Cars in Indonesia: Actual Vs Predicted
Millio
n Unit
0
1
2
3
4
5
6
65 70 75 80 85 90 95 00 05 10 15
BUS_ACTUAL BUS_PRED
Number of Buses in Indonesia: Actual Vs Predicted
Millio
n Un
it
0
2
4
6
8
65 70 75 80 85 90 95 00 05 10 15TRUCK_ACTUALTRUCK_PRED
Number of Trucks in Indonesia: Actual Vs Predicted
Mill
ion
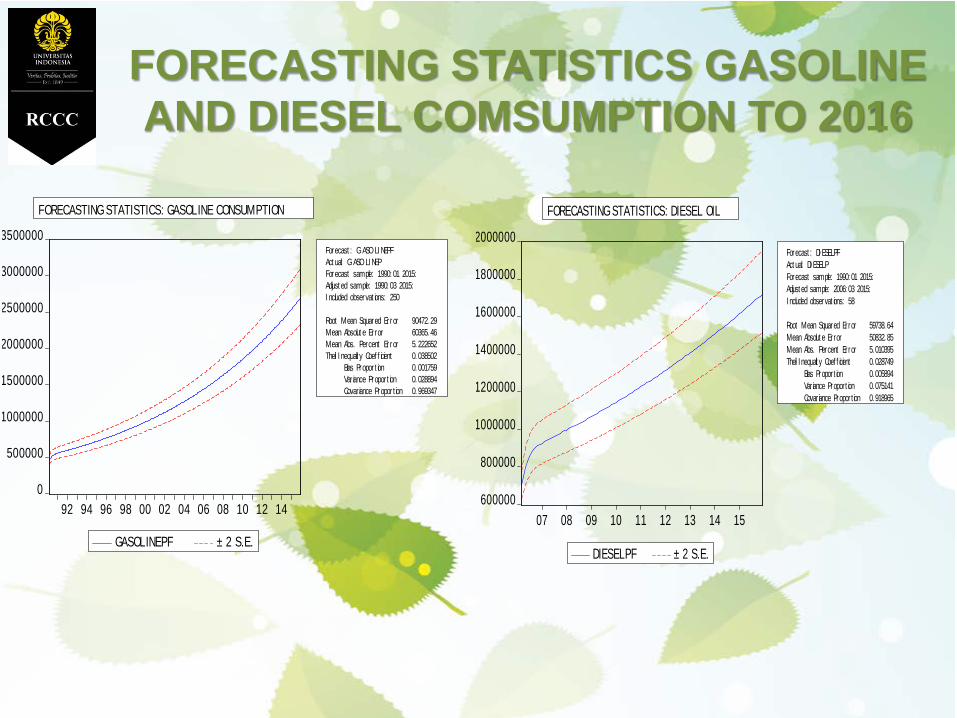
FORECASTING STATISTICS GASOLINE AND DIESEL COMSUMPTION TO 2016
0
500000
1000000
1500000
2000000
2500000
3000000
3500000
92 94 96 98 00 02 04 06 08 10 12 14
GASOLINEPF ± 2 S.E.
Forecast : GASOLI NEPFAct ual: GASOLI NEPForecast sample: 1990: 01 2015:Adjust ed sample: 1990: 03 2015:I ncluded observat ions: 250
Root Mean Squared Er ror 90472. 29Mean Absolut e Er ror 60365. 46Mean Abs. Percent Er ror 5. 222652Theil I nequalit y Coef f icient 0. 038502 Bias Propor t ion 0. 001759 Var iance Proport ion 0. 028894 Covariance Propor t ion 0. 969347
FORECASTING STATISTICS: GASOLINE CONSUMPTION
600000
800000
1000000
1200000
1400000
1600000
1800000
2000000
07 08 09 10 11 12 13 14 15
DIESELPF ± 2 S.E.
Forecast : DI ESELPFAct ual: DI ESELPForecast sample: 1990: 01 2015:Adjust ed sample: 2006: 03 2015:I ncluded observat ions: 58
Root Mean Squared Er ror 59738. 64Mean Absolut e Er ror 50832. 85Mean Abs. Percent Er ror 5. 010395Theil I nequalit y Coef f icient 0. 028749 Bias Propor t ion 0. 005894 Var iance Proport ion 0. 075141 Covariance Propor t ion 0. 918965
FORECASTING STATISTICS: DIESEL OIL
FOCUS OF THE SCENARIO
1. EMISSION FROM TRANSPORTATION2. HUMAN HEALTH BENEFICIERIES
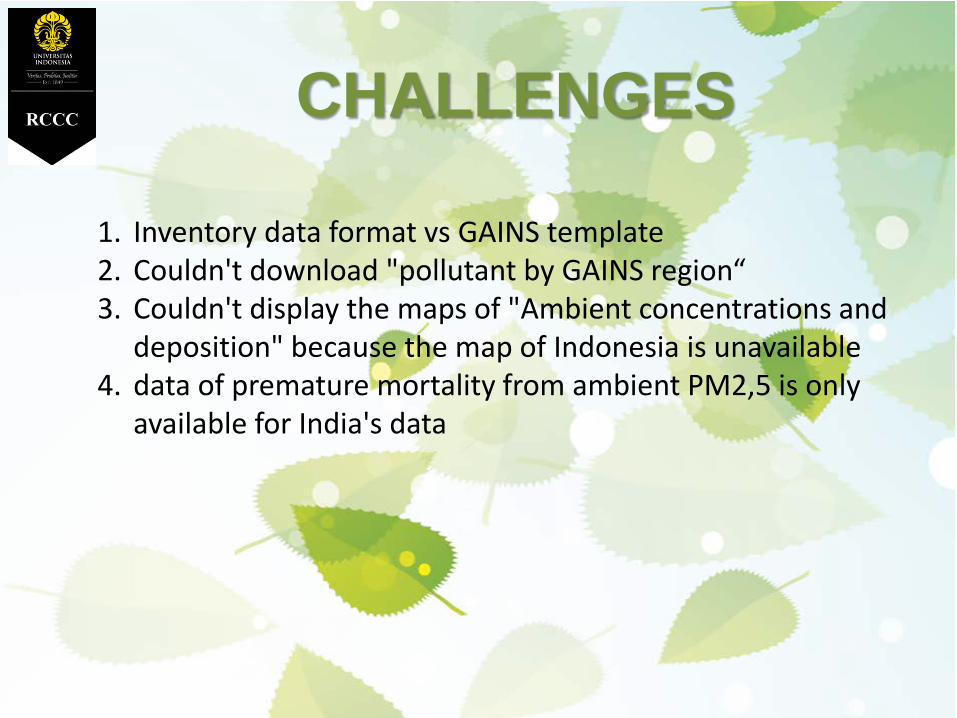
CHALLENGES
1. Inventory data format vs GAINS template2. Couldn't download "pollutant by GAINS region“3. Couldn't display the maps of "Ambient concentrations and
deposition" because the map of Indonesia is unavailable4. data of premature mortality from ambient PM2,5 is only
available for India's data

THANKS FOR YOUR ATTENTION