Embed Size (px)
Citation preview
California’s Climate InitiativeCalifornia’s Climate Initiative

2
Executive Order Established Statewide GHG Targets
By 2010, Reduce to 2000 Emission Levels*By 2020, Reduce to 1990 Emission Levels**By 2050, Reduce to 80% Below 1990 Levels
* Equals 60 Million Tons Emission Reductions, 11% Below BAU
** Equals 175 Million Tons Emission Reductions, 30% Below BAU
3
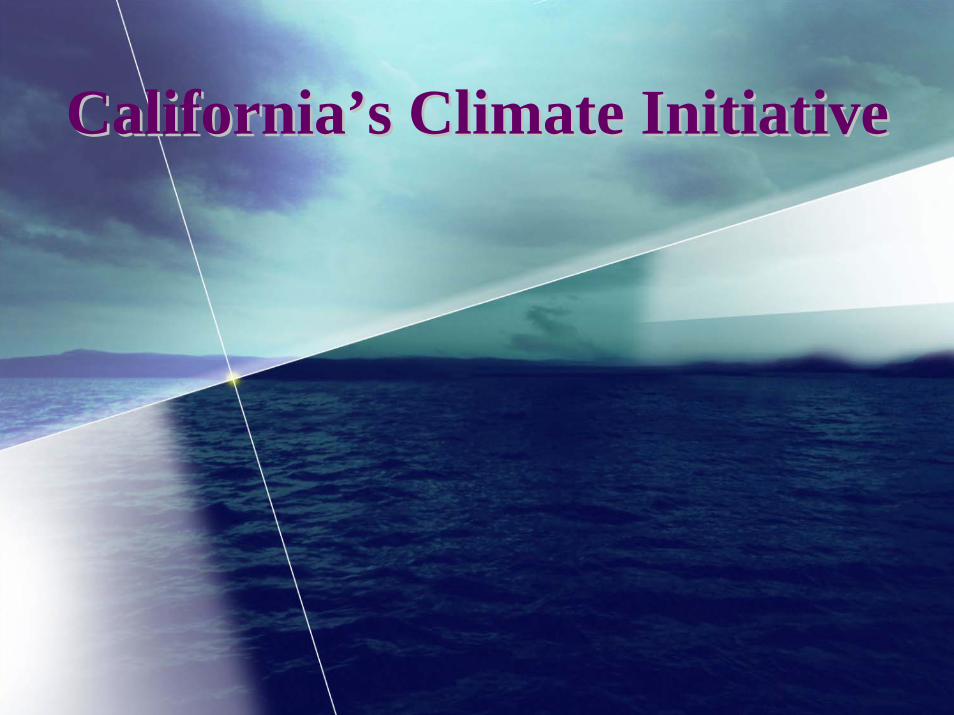
Climate Action TeamCalEPA Secretary Chairs the Team BT&H, CDFA, Resources, PUC, ARB, CIWMB, and CEC are RepresentedThe CAT Report:– Key Recommendations– Emission Reduction Strategies– Market-based Program– Scenario Analysis– Environmental Justice Considerations– Report to Governor and Legislature in March 2006 and
Biennially Thereafter
4
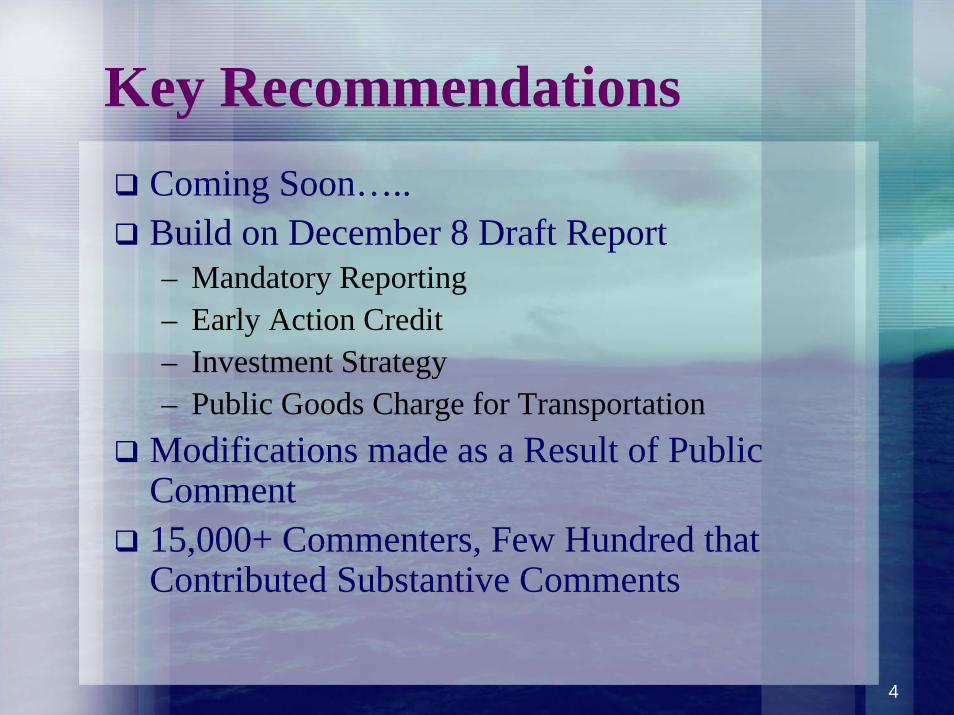
Key RecommendationsComing Soon…..Build on December 8 Draft Report– Mandatory Reporting– Early Action Credit– Investment Strategy– Public Goods Charge for Transportation
Modifications made as a Result of Public Comment15,000+ Commenters, Few Hundred that Contributed Substantive Comments
5
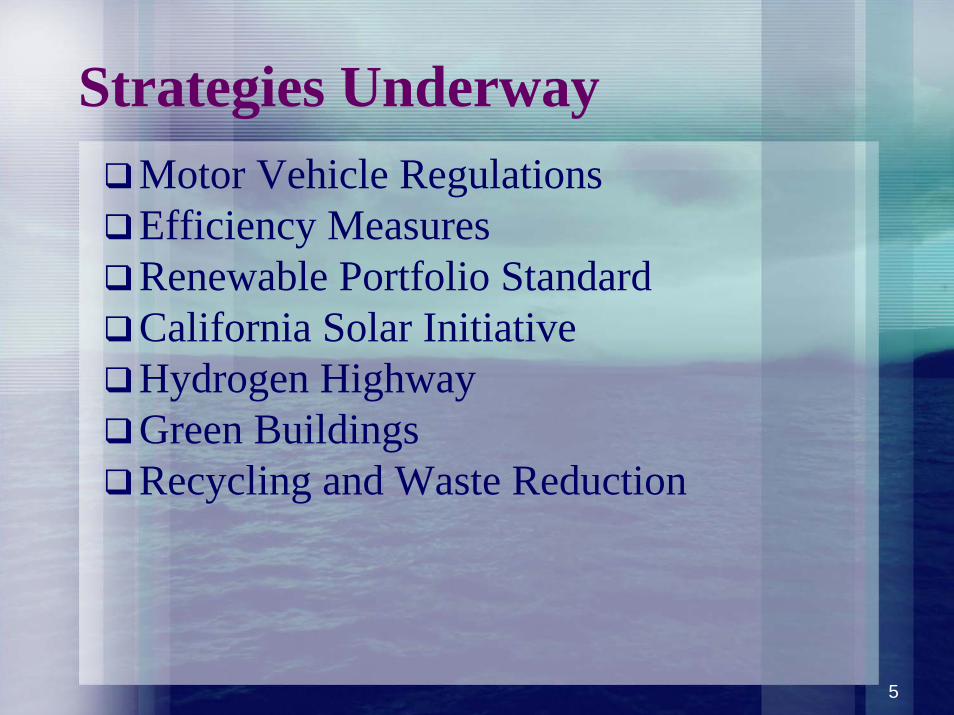
Strategies UnderwayMotor Vehicle Regulations Efficiency MeasuresRenewable Portfolio StandardCalifornia Solar InitiativeHydrogen HighwayGreen BuildingsRecycling and Waste Reduction
6
CAT Recommended Strategies
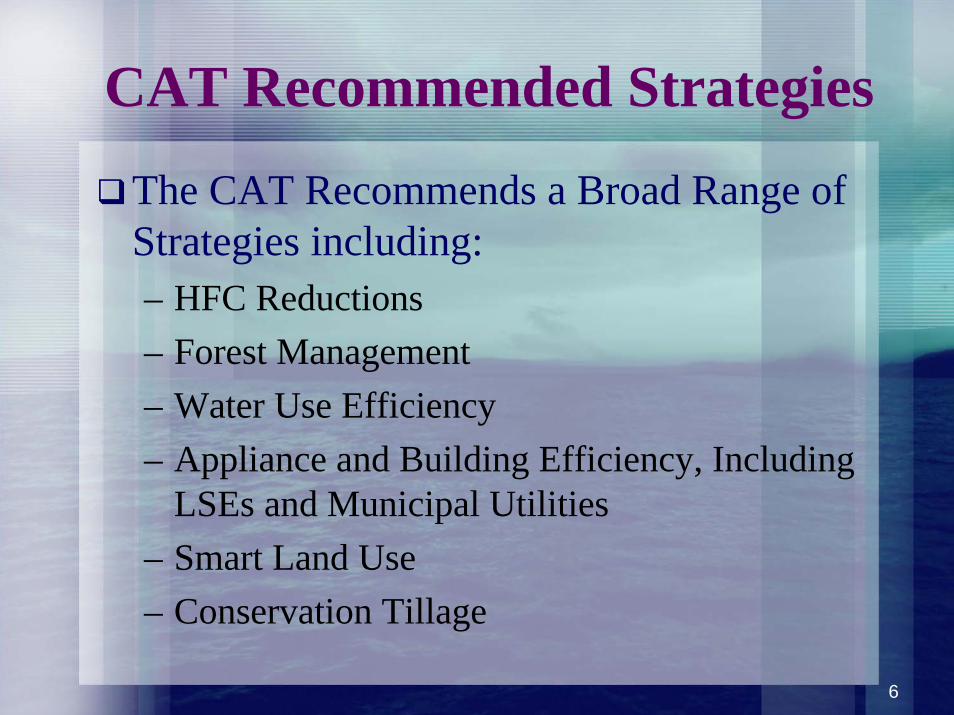
The CAT Recommends a Broad Range of Strategies including:– HFC Reductions– Forest Management– Water Use Efficiency– Appliance and Building Efficiency, Including
LSEs and Municipal Utilities– Smart Land Use– Conservation Tillage
7
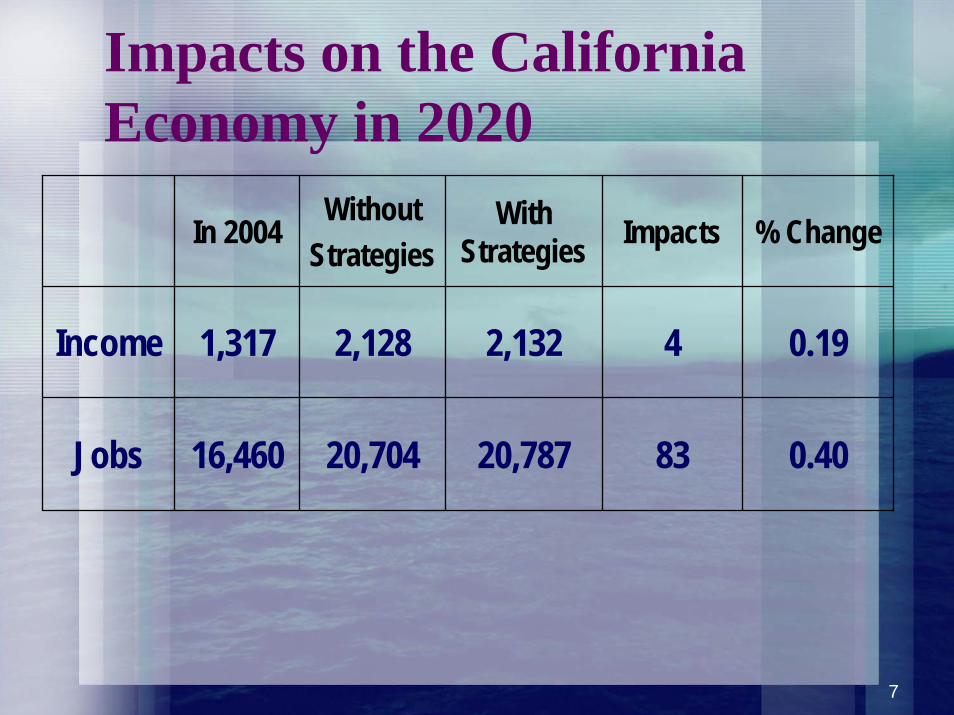
Impacts on the California Economy in 2020
In 2004Without
StrategiesWith
Strategies Impacts % Change
Income 1,317 2,128 2,132 4 0.19
Jobs 16,460 20,704 20,787 83 0.40

8
Based on Best Available Information to Date, Implementation of These Strategies will Achieve the Governor’s Targets

9
Market-Based ProgramMarket-Based Program Integral To California’s Strategy For Reducing EmissionsNational Approach To Capping Emissions Within An International Framework Most Effective In The Absence Of National Action, California Can Lead By Example By Developing A Market-Based Program As A Model For National Action
10
Market-Based Program Design
Design Options– Scope: Which Sources To Cover– Distribute of Emission Allowances– Auction– Emission Offsets– Other: Banking; Compliance Tracking;
Gases To CoverFacility-Level Emissions Data Needed

11
Scenarios
0
5
10
15
20
25
30
35
1990 2010 2030 2050 2070 2090
Year
CO
2 Em
issi
ons
(GtC
)
A1FiA2
A1
B2
A1TB1
Higher Emissions
Medium-high Emissions
Lower Emissions
Global Emission Scenarios: A1fi, A2, And B1Global Climate Models: GFDL, PCM, And Hadley3Temperature And Precipitation Downscaled To CaliforniaUse Of An Hydrological Model (VIC) To Produce The Needed Hydrological Products
-2
0
2
4
6
8
1975 2000 2025 2050 2075 2100
Tem
pera
ture
Cha
nge
(o C)
Lower Emissions
Medium-highEmissions
Higher Emissions
Projected Annual Mean Temperatures In California
12
Coastal Sea Level
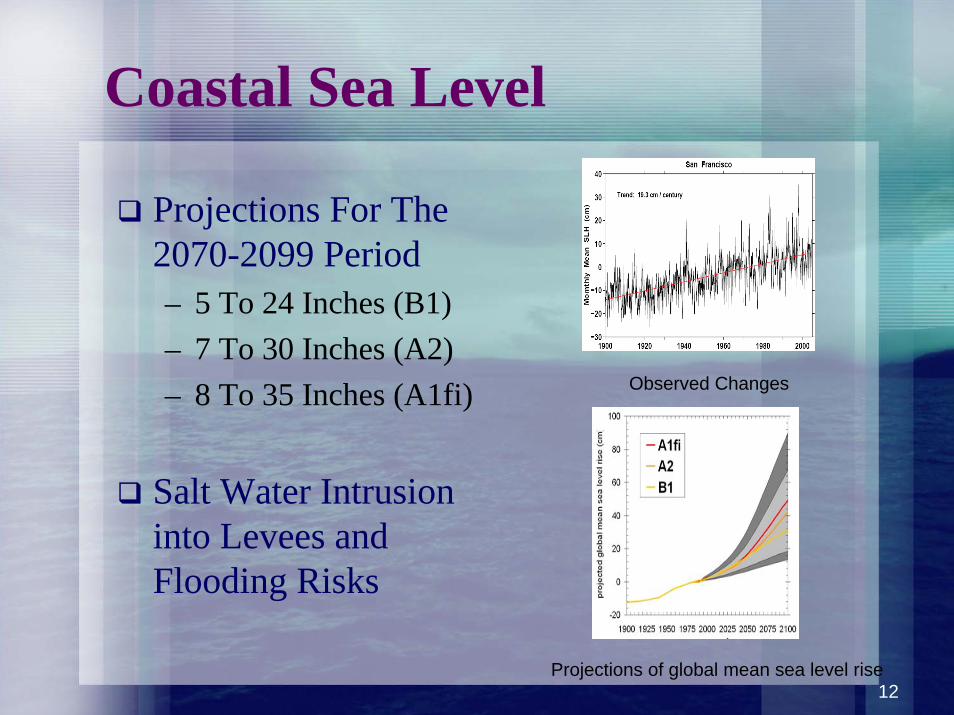
Projections For The 2070-2099 Period– 5 To 24 Inches (B1)– 7 To 30 Inches (A2)– 8 To 35 Inches (A1fi)
Salt Water Intrusion into Levees and Flooding Risks
Observed Changes
Projections of global mean sea level rise

13
Water Resources
Declining Snow Pack Will Aggravate The Already Overstretched Water Resources In The StateIncreased Flooding RiskPotential Up To 90 Percent Reductions Of April 1st Snow Levels
PCM B1
GFDL A2
14
Agriculture
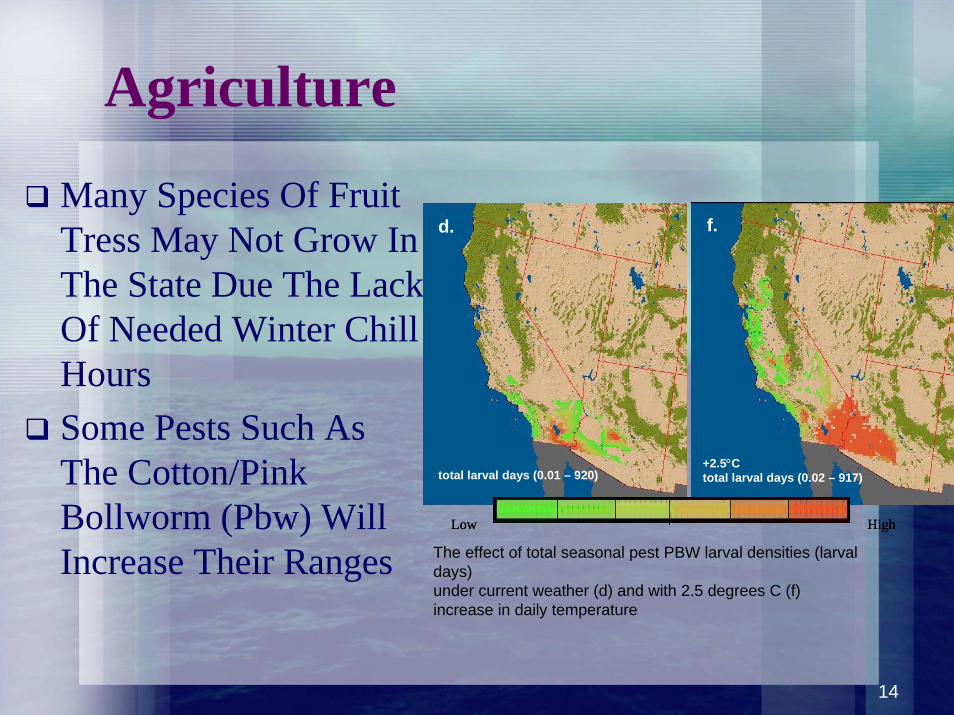
Many Species Of Fruit Tress May Not Grow In The State Due The Lack Of Needed Winter Chill HoursSome Pests Such As The Cotton/Pink Bollworm (Pbw) Will Increase Their Ranges The effect of total seasonal pest PBW larval densities (larval
days) under current weather (d) and with 2.5 degrees C (f) increase in daily temperature
total larval days (0.01 – 920)+2.5°Ctotal larval days (0.02 – 917)
d. f.
Low High
total larval days (0.01 – 920)+2.5°Ctotal larval days (0.02 – 917)
d. f.
Low High
15
Forest and Natural Landscapes
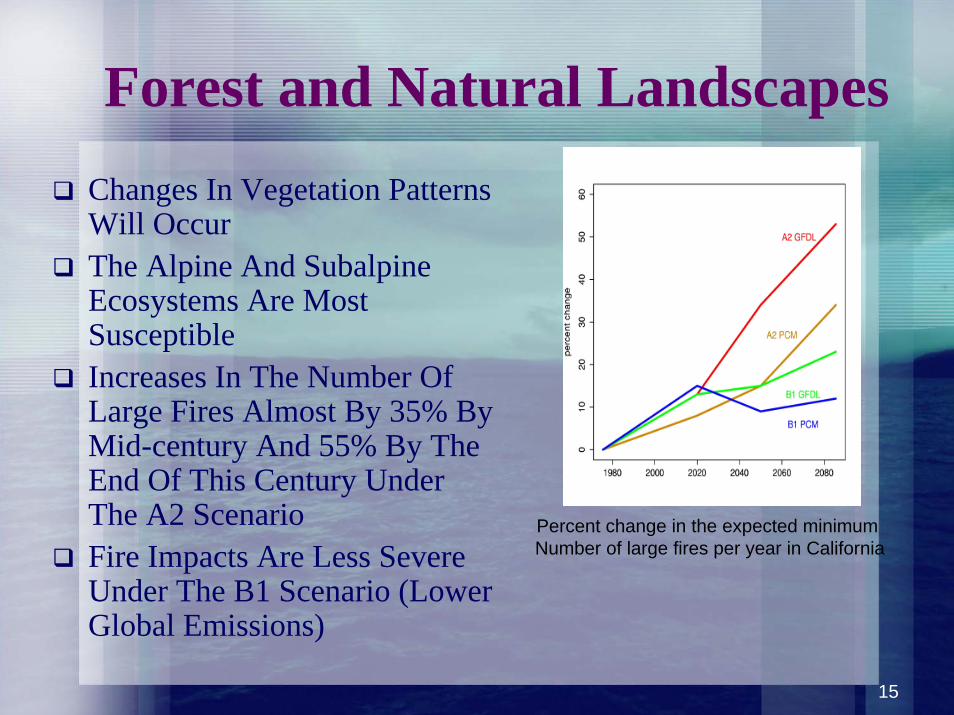
Changes In Vegetation Patterns Will OccurThe Alpine And SubalpineEcosystems Are Most SusceptibleIncreases In The Number Of Large Fires Almost By 35% By Mid-century And 55% By The End Of This Century Under The A2 ScenarioFire Impacts Are Less Severe Under The B1 Scenario (Lower Global Emissions)
Percent change in the expected minimum Number of large fires per year in California
16
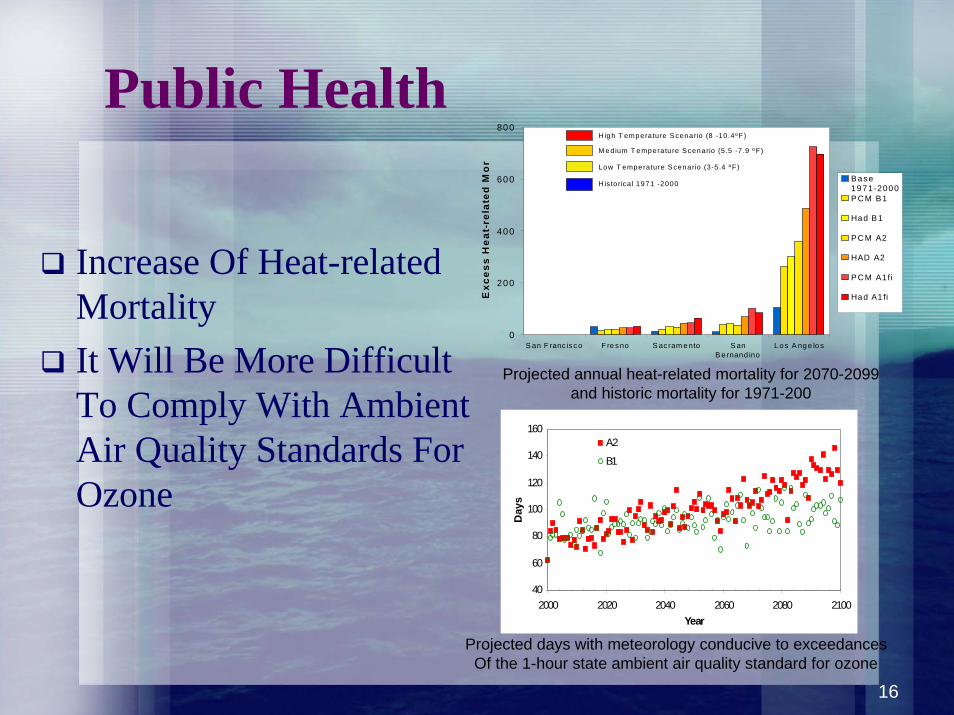
Public Health
Increase Of Heat-related MortalityIt Will Be More Difficult To Comply With Ambient Air Quality Standards For Ozone
40
60
80
100
120
140
160
2000 2020 2040 2060 2080 2100Year
Day
s
A2
B1
0
200
400
600
800
S an F ranc is co F re sno S ac ram e nto S anB e rnand ino
L o s A ng e lo s
Exc
ess
Hea
t-re
late
d M
or
Base197 1-2000PCM B1
Had B 1
P C M A2
HAD A2
P C M A1 fi
Had A1 fi
Low T emperature S cenario (3-5 .4 ºF)
M edium T emperatu re S cenario (5 .5 -7 .9 ºF )
H igh T empera ture S cena rio (8 -10.4ºF )
H is to rica l 1971 -2000
Projected annual heat-related mortality for 2070-2099 and historic mortality for 1971-200
Projected days with meteorology conducive to exceedancesOf the 1-hour state ambient air quality standard for ozone

17
ElectricityAnnual Hydropower Generation Will Decrease If Climate Change Reduces Precipitation Levels
Electricity Demand Will Increase With Temperature From 3 To 20 % By The End Of This Century
0
5,000
10,000
15,000
20,000
25,000
30,000
35,000
0% 20% 40% 60% 80% 100%
Non-Exceedence Probability
GW
H/y
r
GFDL A2
Historical Climatic Contitions
18
Next Two Years
Climate Action Team Will Work Together to Implement Emission Reduction Strategies Market-Based Options Evaluated and Recommendations MadeRefine Economic AnalysisContinue Scenario Analysis including Adaptation Options