Embed Size (px)
Citation preview

NASA CR-134704
MTI 74TR20
DEVELOPMENT OF PROCEDURES FOR CALCULATING STIFFNESS AND DAMPING PROPERTIES
OF ELASTOMERS IN ENGlNEERlHG APPLICATIONS
PART 11: ELASTOMER CHARACTERISTICS AT CONSTANT TEMPERATURE
bv Pradeep K. Gupta
Juergen M. Tessarzik Loretta Cziglenyi
MECHANICAL TECHNOLOGY INCORPORATED
r - ' - I , . . -? Prepared for L 9 % . )
J - l X ; .- 'T.
.> .;. '7 n
3 : -, 1 NATIONAL AERONAUTICS AND SPACE ADMINISTRATION
c
1 / Contract NAS3-15334 . .
' ..~ .'
Robert E. Cunningham, Project Manager . '.
https://ntrs.nasa.gov/search.jsp?R=19740026255 2020-03-20T06:34:28+00:00Z

1. Report No
NASA CR- 134704 I 2 Government Accession No. I 3. Recipient's Catalog No.
4. Title and Subtttle 1 5. Report Date
DEVELOPMENT OF PROCEDURES FOR CALCULATING STIFFNESS AND LWPING A p r i l 26, 1974 PROPERTIES OF ELASTOMERS I N ENGINEERING APPLICATIONS 6. Performing Organization Code
PART 11: ELASTOMER CHARACTERISTICS AT CONSTANT TENPERATURE
7. Authorkl 8. Performing Organ~zation Report No. Pradeep K . Gupta Juergen M. T e s s a r z i k I MTI 74TRIO L o r e t t a C z i g l e n y i 10. Work Unit No.
9. Performing Oryanizat~on Name and Address
Mechanical Technology I n c o r p o r a t e d 968 Albany-Shaker Road Latham, New York 12110
11. Contract or Grant No.
- 1 13. Type of Raport and Period Covered 12. Sponsoring Agency Name and Address
Nat iona l Aeronaut ics and Space A d m i n i s t r a t i o n Washington, D.C . 20546
I C o n t r a c t o r Report
I 14. Sponsoring Agency Code
I
15. Supplementary Notes
P r o j e c t Manager, Robert E. Cunningham, Bearings & Mechanical Power T r a n s f e r Branch, NASA-Lewis Research Cente r , Cleve land , Ohio 44135
6 . Abstract
Dynamic p r o p e r t i e s of a commercial po lybutad iene compound have been determined a t c o n s t a n t
t empera ture of 32 C by a f o r c e d - v i b r a t i o n r e s o n a n t mass t y p e of a p p a r a t u s . The c o n s t a n t
thermal s t a t e of t h e e ias tomer was ensured by keeping t h e ambient t empera ture c o n s t a n t and
by l i m i t i n g t h e power d i s s i p a t i o n i n t h e specimen. Experiments were performed w i t h bo th
compression and s h e a r specimens a t s e v e r a l p r e l o a d s (nominal s t r a i n v a r y i n g from 0 t o 5
p e r c e n t ) and t h e r e s u l t s a r e r e p o r t e d i n terms of a complex s t i f f n e s s a s a f u n c t i o n of
f requency. Very xeak frequency dependence is observed and a s i m p l e power law t y p e of
c o r r e l a t i o n is shown t o r e p r e s e n t t h e d a t a w e l l . V a r i a t i o n s i n t h e complex s t i f f n e s s a s
a f u n c t i o n of p re load a r e a l s o found t o be s m a l l f o r b o t h compression and s h e a r specimens.
7. Key Words (Suggested by Author(s) l Dynamic Proper t i e s V i b r a t i o n T.st Rig V i b r a t i a n Litera.:ure Survey V i s c o e l a s t i c Models A n a l y t i c a l t ' r o d i = t i o n Kethods Elastomers
18. Distribution Statement
Unlimited
- 9 . Security Classif. (or this report) 20. Security Classif. (of this pegel 21. No. of Pages 22. Rice'
Unlimited Unc l a s s i f l e d 125
' For sale by the National Technical Information Service, Springfield, Virginia 22151

FOREWORD
The work desc r ibed h e r e i n was performed a t Mechanical Technology Incorpora ted
(MTI) under NASA Cont rac t NAS3-15334 w i t h M r . Robert E. Cunningham, NASA-
Lewis Research Cen te r , a s P r o j e c t Manager. A t NTI, D r . Robert H. Badgley,
Manager, Machinery Dynamics Cen te r , was t h e Program Manager. The work
repor ted i s p a r t of a con t inu ing program whose o b j e c t i v e s a r e , f i r s t l y , t o
develop, through a n a l y t i c a l and exper imenta l i n v e s t i g a t i o n s , e l a s tomer
dynamics technology and , secondly, t o reduce t h i s technology t o p r a c t i c a l
des igner -o r i en ted form, s o t h a t i t may be used t o c a l c u l a t e t h e dynamic
mechanical p r o p e r t i e s of e l a s tomer ic damping n a t e r i a l s .

TABLE OF COmENTS,
PaRe FOREmRD, . . . . . . . . . . . . . . . . . . . . . . , . . . , . . iii LIST OF ILLUSTRATIONS . , . . . . , . . . . . . . . . . . . . . . . v i i
SUMMARY. . . . . . . . . . . . . . . . . . . . . . . . . . . . . . 1
INTRODUCTION. . . . . . . . . . . . . . . . . . . . . . . . . . . . 3
EXPERIMENT DESIGN AND TEST PROCEDURE. . . . . . . . . . . . . . . . 6
Descr ip t ion of Elastomer T e s t Rig . . . . . . . . . . . . . . . 6
Design C h a r a c t e r i s t i c s of t h e Tes t Rig. . . . . . . . . . . . . 7
Tes t M a t e r i a l S e l e c t i o n . . . . . . . . . . . . . . . . . . . . 13
Shear Tebt Samples. . . . . . . . . . . . . . . . . . . . . . . 16
Compression T e s t Samples. . . . . . . . . . . . . . . . . . . . 19
Ins t rumenta t ion . . . . . . . . . . . . . . . . . . . . . . . 19
Tes t ing Procedure . . . . . . . . . . . . . . . . . . . . . . . 28
T e s t Rig Response . . . . . . . . . . . . . . . . . . . . . . . 30
EXPERDENTAL RESULTS. . . . . . . . . . . . . . . . . . . . . . . . 3 5
Operat ing Condi t ions and Data Range . . . . . . . . . . . . . . 35
Temperature Gradient i n t h e Elastomer . . . . . . . . . . . . . 35
Reduction of Experimental Data t o Complex S t i f f n e s s . . . . . . 36
Compression T e s t s . . . . . . . . . . . . . . . . . . . . . . . 38
Shear T e s t s . . . . . . . . . . . . . . . . . . . . . . . . . . 45
Summary and C o r r e l a t i o n of Tes t R e s u l t s . . . . . . . . . . . . 56
DISCUSSION. . . . . . . . . . . . . . . . . . . . . . . . . . . . . 6 1
C O N C L U S I O N S . . . . . . . . . . . . . . . . . . . . . . . . . . . . 65
RECOMMENDATIONS AND FUTURE RESEARCH . . , . . . . . . . . . . . . . 66
APPENDIX A - TEST SAMPLE DESIGN . . . . . . . . . . . . . . . . . . 67
APPENDIX B - DYNAMIC CHARACTERISTICS OF TEST RIG CWONENTS . . . . 76
APPENDIX C - RESPONSE OF A BASE-EXCITATION SYSTEM . . . . . . . . . 96

TABLE C.? CONTENTS (conc luded 1
PaJ&?
APPENDIX LJ - MECHANICAL MODEL ANALOGIES OF ELASTOMER DYNAMIC . . . . . . . . . . . . . . . . . . . . . . RESPONSE 1 0 1
. . . . . . . . . . . . . . . . . . . . . . . . . . . NOMENCLATURE 1 12
. . . . . . . . . . . . . . . . . . . . . . R E F E R E N C E S . . . . . . 1 1 5
LIST OF ILLUSTRATIONS
. . . . . . . . . . . . Schematic of Elastomer Test Rig . 8
. . . . . . . . . . . . . . . Elastomer Test Rig D e t a i l s 9
. . . . . Elastomer Test Rig Mounted on Vibra t ion Table . 10
Radia l Guide Bearing . . . . . . . . . . . . . . . . . . 12
Elastomer T e s t Sample Support Base With Cooling C o i l s . . . . . . . . . . . . . . and Heating Cables I n s t a l l e d 14
. . . . . Temperature Cont ro l System f o r Elastomer T e s t s 15
Test Assembly of Four Elastomer Shear Specimens, Each 2.54 cm (1.0 i n . ) High . . . . . . . . . . . . . . . . . 17
Test Assembly of Eight E l a s t m e r Shear Specimens, Each 1.27 c m ( 0 . 5 i n . ) H i g h . . . . . . . . . . . . . . . . . 18
Test Assembly of Twenty Elasiamer Shear Specimens, Each 0.5 cm (0.2 i n . ) High . . . . . . . . . . . . . . . 20
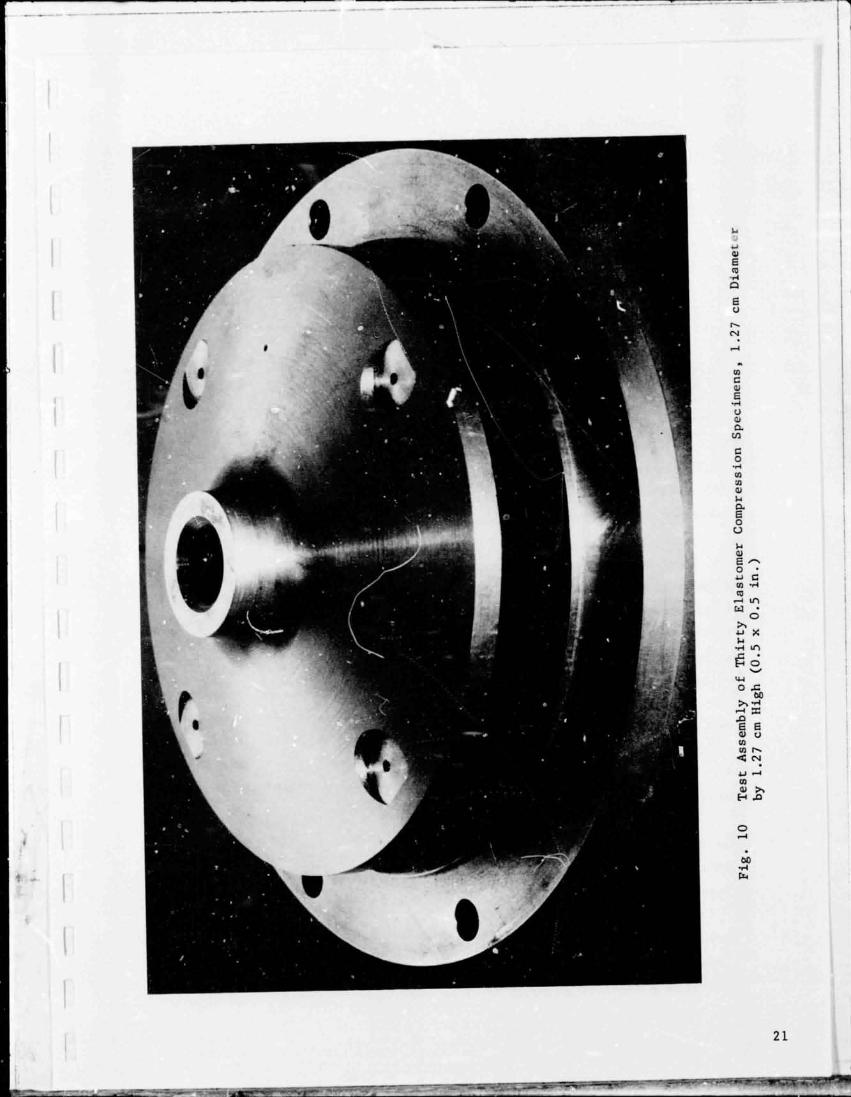
Tes t Assembly of T h i r t y Elastomer Compression Specimens, 1.27 cm Diameter by 1.27 cm High (0.5 x 0.5 i n . ) . . . . 2 1
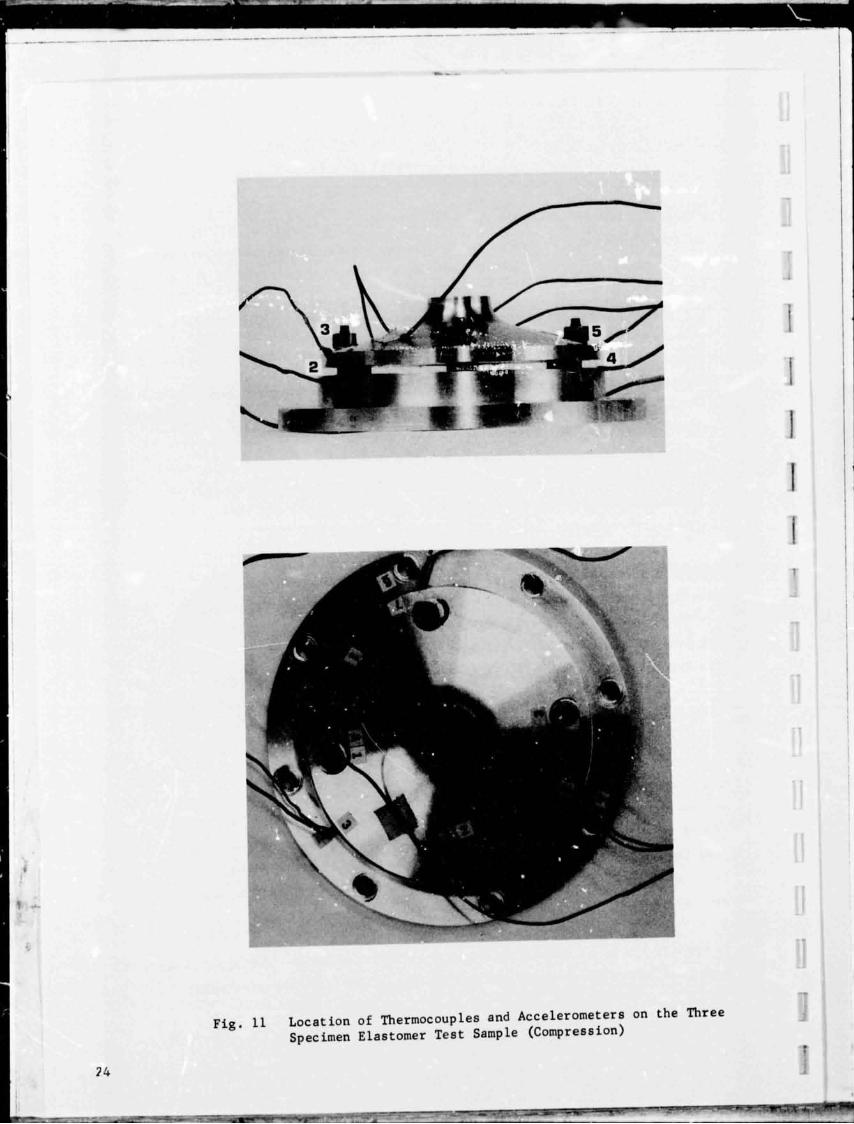
Locat ion of Thermocouples and Accelerometers on t h e Three Specimen Elastomer T e s t Sample (Compression) . . . 24
Typica l D e t a P r i n t o u t . . . . . . . . . . . . . . . . . . 25
Ins t rumenta t ion Console. . . . . . . . . . . . . . . . . 26
Schen~at ic of Data Acqu is i t ion System f o r Measurement of Elastomer Dynamic . . . . . . . . . . . . . . . . . . . . . . . P r o p e r t i e s 27
Dyamic Model of t h e E las txner Test Rig. . . . . . . . . 32
Mechanical Spr ing Used f o r Determining t h e Tes t Rig Dynamic Response . . . . . . . . . . . . . . . . . . . . 33
Schematic of Thermal Grad ien t s i n t h e Elastomer Spec imen . . . . . . . . . . . . . . . . . . . . . . . . 37
Complex S t i f f n e s s of t h e Compression Sample With T h i r t y Specimens a t 2-1/2 Percent Pre load. . . . . . . . 39
v i i
LIST OF ILLUSTRATIONS (continued )
Complex S t i f f n e s s of t h e Compression Sample With . . . . . . . . T h i r t y Specimens a t Five Percent Preload 40
Complex S t i f f n e s s of t h e Compr~dsion Sample With Ten . . . . . . . . . . . Specimens a t 2-112 Percent Preload 4 1
Complex S t i f f n e s s of t h e Compression Sample With Ten . . . . . . . . . . . Specimens a t Five Percent Preload. 42
Complex S t i f f n e s s 9f t h e Compression Sample With Three . . . . . . . . . . . Specimens a t 2-112 Percent Preload 43
Complex S t i f f n e s s of t h e Compression Sample With Three . . . . . . . . . . . Specimens a t Five Percent Preload. 44
V a r i a t i o n of R e l a t i v e Deformation Amplitude i n t h e Compression and Shear Elastomer Sample . . . . . . . . . 46
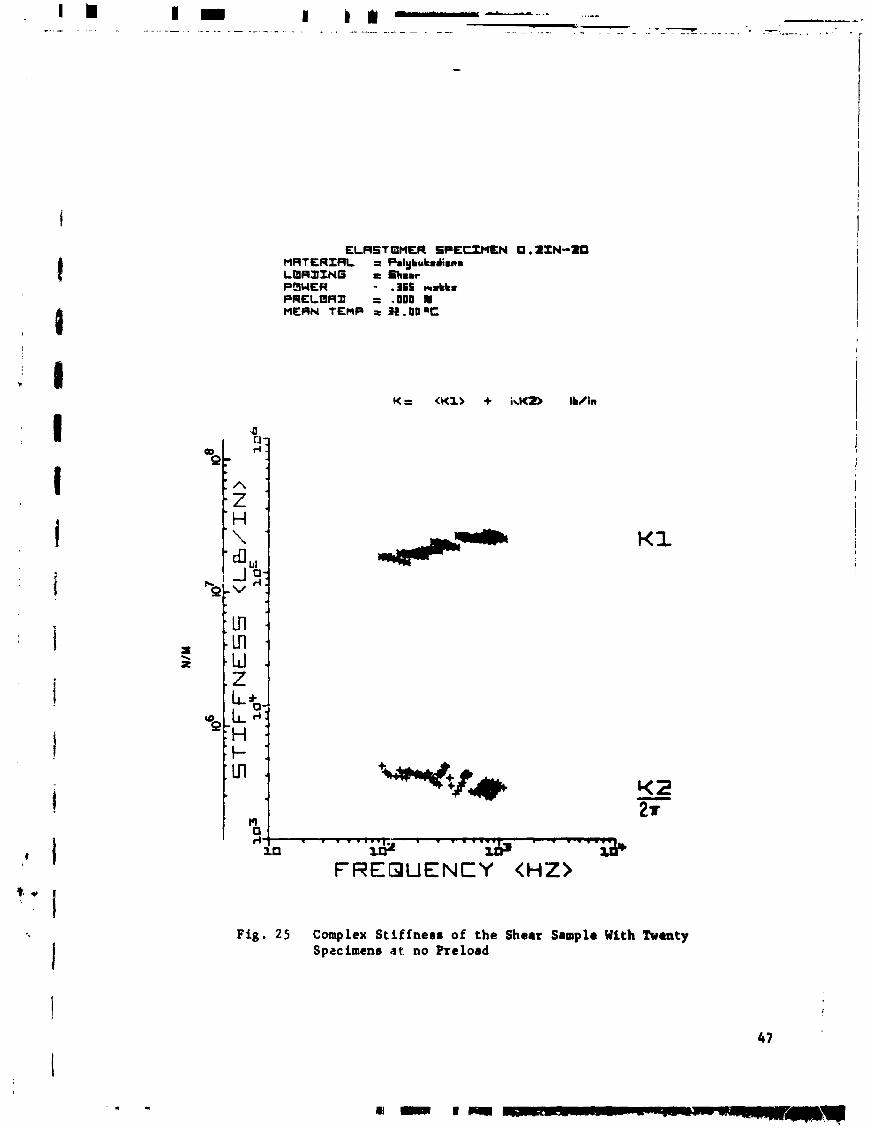
Complex S t i f f n e s s of t h e Shear Sample With Twenty . . . . . . . . . . . . . . . . Specimens a t no Preload. 41
Complex S t i f f n e s s of t h e Shear Sample With Twenty Specimens a t 2-112 Percent Preload . . . . . . . . . . . 48
Complex S t i f f n e s s of t h e Shear Sample With Twenty . . . . . . . . . . . Specimens a t Five Percent Preload. 49
Complex S t i f f n e s s of t h e Shear Sample With Eight . . . . . . . . . . . . . . . . Specimens a t no Preload. 50
Complex S t i f f n e s s of t h e Shear Sample With Eight Specimens a t 2-112 Percent Preload . . . . . . . . . . . 5 1
Complex S t i f f n e s s of the Shear Sample With Eight . . . . . . . . . . . Specimens a t Five Percent Preload. 52
Complex S t i f f n e s s of t h e Shear Sample With Four Specimens a t no Preload. . . . . . . . . . . . . . . . . 53
Complex S t i f f n e s s of t h e Shear Sample With Four Specimens a t 2-1/2 Percent Preload . . . . . . . . . . . 54
Complex E t i f f c e s s of t h e Shear Sample With Four . . . . . . . . . . . Specimens a t F ive Percent Pre load . 55
Typical Powe:: Law C o r r e l a t i o n . . . . . . . . . . . . . . 58
v i i i

LIST OF ILLUSTRATIONS (conc luded)
Typical Correlatiou of Experimental Data With a . . . . . . . . . . . . . . . . . . . Double Voigt Model 60
Schematic of the Compression Specimen. . . . . . . . . . . 68
Relationship Between Shore Hardness and Shear Modulus. . 72
Schematic of the Shear Specimen. . . . . . . . . . . . . 73
. . . . . . . . . . . . Dynamic Model of the Guide Bearing 77
Dynam~c Model of the Lower Cylinder Mounted on the . . . . . . . . Shaker Table With the Mechanical Spring. 79
Response of the Lower Air Cylinder . . . . . . . . . . . 8 1
. . . . . . . . . . . . . Reduced Model of the Test Rig. 82
Dynamic System Model f o r Lower Cylinder Mounted With the Mechanical Spring When the Lower P is ton is Con- . . . . . . . . . . strainedbytheLowerGuideBearing. 88
Lower Cylinder S t i f f n e s s and Dsmping With Constrained Pis ton Motion. . . . . . . . . . . . . . . . . . . . . . 89
B7 Dynamic Model of the Upper Cylinder Mounted With the Mechanical Spring When the Pis ton Motion is Con- s t ra ined by Both Guide Bearings. . . . . . . . . . . . . 91
B8 Upper Cylinder Response With Constrained Piaton 140tion . 92
. . . . . . . . . C 1 Schematic of a Base Exci tat ion System. 9 7
. . . C2 Response of a Base Exci tat ion System a t Resonance. 100
. . . . . . . . . D l Basic Elements of Visco-Elastic Models 102
. . . . . . . . . . D2 Generalized Maxwell and Voigt Models 103
D3 Charac ter i s t ic Functions Defining the Behavior of . . . . . . . . . . . . . . . . . . Visco-Elast i c Models 109

This report documents an experimental inves t iga t ion t o determirie the dynamic
proper t ies of elastomer t e s t samples a t constant temperature. The object ive
of the inves t iga t ion was t o i den t i fy the influence of exc i t a t i on frequency,
preload, shape, and deformat ion amp1 i tude on the dynamic
and compressive loading.
An ex i s t i ng forced-vibration resonant-mass-type t e s t r i g
t r o l the ambient temperature around the elastomer sample
proper t ies under shear
was ref ined t o con-
and monitor the power
d iss ipa ted i n the specimen. These two cons t ra in ts ensure a constant thermal
s t a t e of the elastomer. Pol.ybutadiene, a broad temperature range (Em) elastomer, was se lec ted a s the t e s t mater ia l f o r t h i s invest igat ion.
Three compression specimens with varying shape f ac to r s were t e s t ed a t preloads
corresponding t o a compression of 2-112 an6 5 percent of the i n i t i a l specimen
thickness. The ambient temperature and power d i s s ipa t ion were monitored and
control led e f f e c t i v e l y such tha t the elastomer temperature was 32OC t o within
1°c. The t e s t frequencies were var ied from 100 t o 1000 Hz. Test r e s u l t s a r e
presented a s complex s t i f f n e s s values fo r each specimen a s a function of f r e -
quency. Changes i n s t i f f n e s s a s a function of frequency or preload were found
t o bc small fo r the compression specimens, and within the t e s t frequency range
a simplt 77wer law re l a t ionsh ip was used t o represent the v a r i a t i o n with f r e -
quency.
Three shear specimens were t e s t ed a t prcloads corresponding t o nominal ~ c r a i n s
of 0, 2-112 and 5 percent. The frequency band was a l s o 100 to 1000 Hz. The
complex s t i f f n e s s i n t h i s case was somewhat higher than tha t observed with the
compression specimens, but the d i f fe rence i s consis tent with the d i f fe rence i n
s t a t i c s t i f f n e s s a s ca lcu la tea by conventional shape fac tor formulas. Varia-
t ions of complex s t i f f n e s s with e i t h e r frequency o r preload were found t o be
small, and a simple power law re la t ionship was again used t o represent the
va r i a t i on with frequency.
The compression samples, although covering a four t o One range of diameter-to-
height r a t i o , were each designed t o have s imi l a r a t i f f n e s s e s by varying the

number of individual elastomer elements, and applying published shape factor
values. The measured dynamic etiffnesses of the three compression samples were
similar .
The shear samples were each designed to have similar stiffnesses by varying . , the number of elements in inverse proportion to the sheared area. The resultant
. - dynamic stiffnesses were similar for each of the shear samples.

11. INTRODUCTION
Elastomeric dampers have been successfully applied in the co..~trol i1 ib- l vital
vibration problems . Increasingly demanding applications, part i c ~ . ,:r ly to , I 'xa-
t ion problems of rotors and power transmission shafting, arc being considered.
However, the availability of design-orietited data for such applications Ls
limited. Dynamic testing under accurately controlled conditions is the means
to develop this data and to determine the influence of important geometrical,
environmental, and chemical design parameters. Physical properties of
elastomeric materials can then be evaluated and used in the selection of
materials for particular applications.
Substantial advances have been reported in the development of experimental
methods for dynamic testing, and the determination of the influence of chemical
composirion on the observed dynamic response of the material. Chiang, et. al.,
in Part I of this series [I]*, described procedures for testing elastomer
specimens in a forced-vibration, resonant mass test rig. The ability of the
resonant mass approach to obtain data over a wide range of frequencies,
amplitudes, and preloads was demonstrated. In addition, the significance of
uncertainties in temperature variation was identified.
A narrative account of various test methods and some af their refinements
developed during the past two decades has been recently presented by Miller
( 2 1 . In addition to the measurements of frequency and amplitude of deforma-
tion, a major concern is with the temperature level and gradient in the elasto-
mer. 't has been suggested that the thermal state of the material is one of
the prime candidztes dominating its dynamic behavior. Hence, monitoring the
temperature of operation a3d the energy dissipated in the elastomer becomes
essential in an experimental setup for elastomer testing.
The significance of dynamic testing in comparison with simple static tests has
been well established, Larsen 131 has demonrtrated that the dynanlic st if fness
- .- * Number6 in brackets num mote References lieted at the end of this report.

i s generally higher than the s t a t i c spring ra te . Thf! temperature dependence
of the two properties as reported by b r s e n is even more in te res t ing i n that
although the dyaamic s t i f fness decreases with an increase i n cmperatrlre, the
changes in the long chain molecules as a r e s u l t of higher temperature r e s u l t s
in increased s t a t i c s t i f fness .
cardi l lo 141 used a force vibrat ion type hydraulic t e s t e r :o determine the
s t i f f n e s s and daaping propert ies of a number of materials. The e f fec t s of
frequency, amplitude, preload, and temperature were a lso considered. In :he
case of butyl stock, i t was shown that increasing the carbon black content i n
t h e compound resu l t s i n increased dynamic s t i f f n e s s and damping charac ter is t ics .
Heyer and Somaer [51 have considered compounds based on crtyrenebutadiene and
polybutadiene elastomers i n t h e i r invest igat ion with regard t o the e f f e c t s of
compositional and t e s t ing variat ions. Their r e su l t s concerning the influence
of carbon black content a r e i n agreement with thooe reported by Cardillo. In
a more recent work, Somaer and Meyer [ 6 ] have sumnarized the e f f e c t s of var ia-
t ions i n rubbers, f i l l e r s , o i l s , level of crosslinking and processing 6 *ors
such as mixing, curing, and storage on the dynamic propert ies of e' 5r i c
products .
The work reported herein was motivated by a need t o further imprctve the dynamic
t e s t methods for elastomers w i t h p a r t i c u l m reference t o t h e r m l conditions.
By control l ing the ambient temperature and the power dissipated i n the elastomer
specimen, t h e uncertaint ies i n the dynamic behavior of the t e s t m2:erial a re
reduced t o a minimum. The primary object ive of the invest igat ion i s t o ident i fy
t l e influence of exci ta t io . l frequency, preload, shape factor , and deformation
ampliLude on the dynamic propert ies of elastomer specLmens under conditions
wherein the thermal s t a t e of the material remains unchanged.
A previously designed [ 11 forced v ibra t ion type of ~ e s t i n g apparatur war
modified t o control the temperature of the two metal l ic p la t e s holding the
elastomer sample. Also, heating and cooling systems were designed t o control
the ambient temperature i n a closed chamber i n which the t e a t specimens a re
located. An electronic c i r c u i t to monitor the power d iss ipa t ion was designed

!
I with the objective of 1imit.ing the temperature gradients in the elastoner
I specimns. Polybutadiene, being a known broad temperature range elastomer, was
selected as the test material. The influence of excitation frequency, amplitude
of deformation, preload, and shape factor were examiced under a constant ambient
temperature and very low and bounded temperature gradients in the test epecimen. ; I i ~ 0 t h shear and compression loadings were considered with suitably designed
I: I specimens. The compression speciml ; were designed with varying shape factors i I with the objective of identifying the variations in the dynamiz behavior of
I the elastomer as a fur~ction of specimen geometry under isotherwal conditions.
I The experimental details of the apparatus are described in detail in the next
section, which is followed by a fairly comprehensive analysis of the dynamic
response of the test rig. Experimental results for both compression and shear
I samples are then presented. A complete summary of chese results is presented
in a tabulated form. Finally, the dynamic behavior of the elastomer ,.$ a
I function of the experimental conditions described above is discussed.
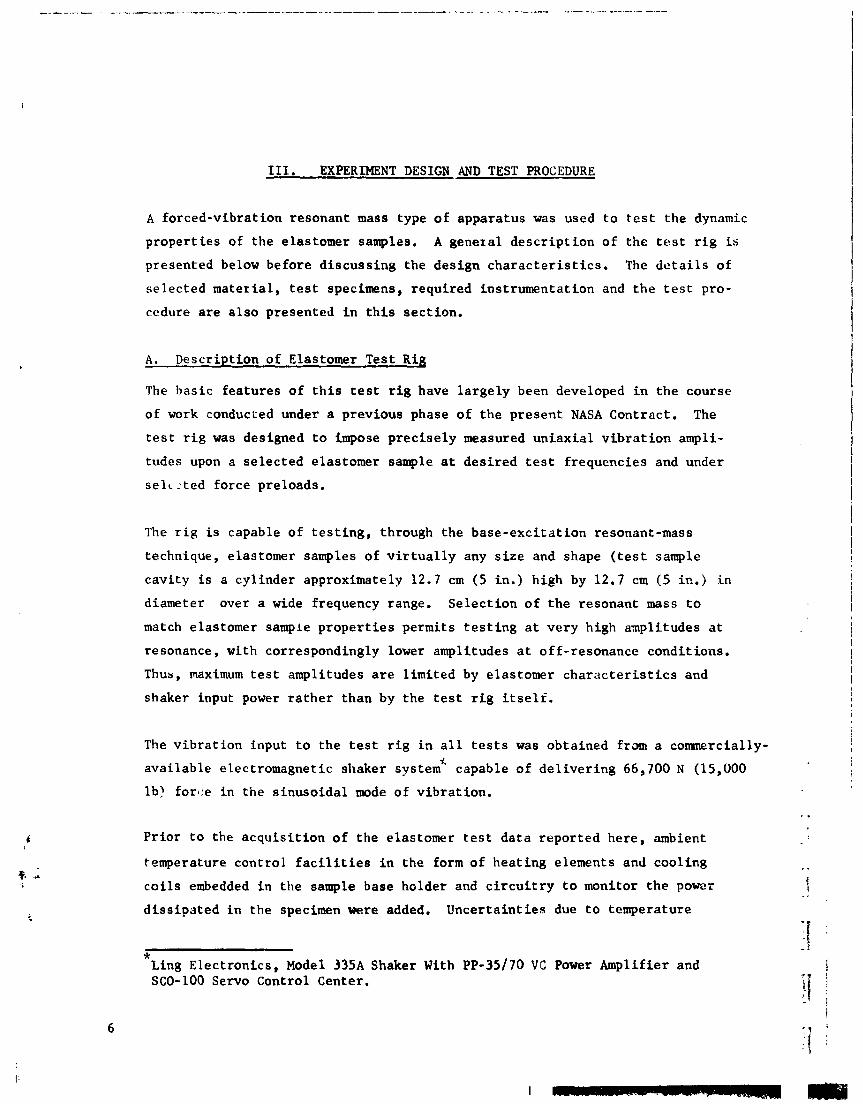
111. EXPERIMENT DESIGN AND TEST PROCEDURE
A forced-vibration resonant mass type of apparatus was used to test the dynamic
properties of the elastomer samples. A general description of the test rig is
presented below before discussing the design characteristics. The details of
selected material, test specimens, required instrumentation and the test pro-
cedure are also presented in this section.
A. Description of Elastomer Test Rig
The basic features of this test rig have largely been developed in the course
of work conducced under a previous phase of the present NASA Contract. The
test rig was designed to impose precisely measured uniaxial vibration ampli-
tudes upon a selected elastomer sample at desired test frequencies and under
se1t:ted force preloads.
The rig is capable of testing, through the base-excitation resonant-mass
technique, elastomer samples of virtually any size and shape (test sample
cavity is a cylinder approximately 12.7 cm ( 5 in.) high by 12.7 cm (5 in.) in
diameter over a wide frequency range. Selection of the resonant mass t4
match elastomer sample properties permits testing at very high amplitudes at I : !
resonance, with correspondingly lower amplitudes at off-resonance conditions.
Thus, maximum test amplitudes are limited by elastomer characteristics and
shaker input power rather than by the test rig itself.
The vibration input to the test rig in all tests was obtained from a commercially- - .
available electromagnetic shaker system9' capable of delivering 66,700 N (15,000 i
lb! forl:e in the sinusoidal mode of vibration.
". Prior to the acquisition of the elastomer test data reported here, ambient
temperature control facilities in the form of heating elements and cooling . . coils embedded in the sample base holder and circuitry to monitor the power 5 . . dissipated in the specimen were added. Uncertainties due to temperature
* Ling Electronics, Model 335A Shaker With PP-35/70 VC Power Amplifier and SCO-100 Servo Control Center.
var ia t ions a re now minimized by accurately cont ro l l ing the ambient tempera-
t u r e , and by l imit ing the heat generated i n the specimen. I n addi t ion , new
holding p la tes fo r the elastomer s a m ~ l e s were made; two d i f f e ren t configura-
aons provided shear and compression loading of the samples, respec t ive ly .
B . Design Charac ter i s t ics of the Test Rig
A schematic of the elastomer t e s t r i g is shown in Figure 1 and a layout
drawing of the same r i g i n Figure 2. Figure 3 shows the complete r i g
mourlted on the shake t ab l e .
The t e s t r i g was designed t o meet the following funct ional requirements:
1. Very low res idua l damping.
2 . An i n e r t i a nass loading of the elastomer t e s t sample with weights
ranging from approximately 0.8 t o 227 kg (1.8 t o 500 l b ) .
3 . A means fo r accurately cont ro l l ing force preloading of the elastomer
t e s t sample.
4 . Temperature cont ro l of the ambient a i r within the t e s t specimen
cavi ty .
The r i g employs a unid i rec t iona l v ibra t ing mass-spring system. In i t s
simylest form, t h i s concept might - o n s i s t of an elastomer spring t o which
various amounts of i n e r t i a mass a re bonded and the system could be completely
f ree of residua! damping o r s t i f f n e s s contr ibut ions from t e s t r i g elements.
Ho~iever, the p rac t i ca l requirements of balancing ra ther large i n e r t i a masses : ( u p t o 227 kg. (500 1b))on top of the elastomer spring and the desired mechanism j
f t o provide elastomer sample preloading a t a l l t e s t frequencies introduce addi-
t iona l elements which have f i n i t e s t i f f n e s s e s and small amounts of pa ra s i t i c
damping.
Spec i f ica l ly , two r a d i a l guide beariugs f o r the i n e r t i a mass and two a i r
cyl inders for the preloading of the elastomer samples a re required. The j
s t i f fness ' and damping propert ies of these elements have an in£ luence on the ,
t e s t r i g response, b u t a s described i n Section I V , these propert ies a re indepcn- i 1
de? t l y measured and accounted for . 7
1 I

BELLOFRAM SEALS -
I MASS t AXIAL MOTW MASS GUIDE SPOKES
PRELOAD AIR SPRING
ELASTOMER SAMPLE
TABLE
- ELECTROMAGNETIC SHAKER
F i v , 1 Schematic of Elaetomer Teet Rig


The resonant n s s s bonded t o t h e top 3f t h e e las tomer specimens c o n s i s t s of
a number of elements. For h igh frequency t e s t s , i n which only a minimum of
mass is requ i red , t h e resonan t mass can b e reduced t o t h e top p l a t e of t h e
specimen ho lde r and t h e p re load p i s t o n . The top p l a t e is made o u t of aluminum
and t h e pre load p i s t o n i s made ou t of t i t a n i u m f o r minimum weight . Inc reased
mass f o r medium o r low frequency t e s t i n g is provided by r i g i d l y a t t a c h i n g a
long rod t o t h e top of t h e pre load p i s t o n , and adding s t e e l weights . The
weights a r e cen te red by the rod and a r e a x i a l l y r e s t r a i n e d by s p a c e r s of
v a r i o u s l eng ths and a locknut nea r t h e upper end of t h e rod.
The rod i t s e l f r e c e i v e s r a d i a l suppor t from two f r i c t i o n l e s s guide bea r ings
(Fizure 4 shows one of the dismounted b e a r i n g s ) , each of which c o n s i s t s of a
hub and 1 2 s t e e l spokes. The hub is f i t t e d over t h e end of t h e rod and is
a x i a l l y clamped t o i t . This k ind of b e a r i n g arrangement provides good r a d i a l
s t i f f n e s s f o r reasonably high spoke t e n s i o n , b u t provides only l i m i t e d freedom
f o r a x i a l motion i f o v e r s t r e s s i n g of t h e spokes is t o b e avoided. Consequently,
changes i n pre load on t h e t e s t specimen must b e accompanied by lower ing o r
r a i s i n g of the o u t e r frame ( t o whjch t h e guide b e a r i n g s a r e a t t a c h e d ) . *
Preload of t h e e las tomer test specimens is c o n t r o l l e d by a p a i r of a i r c y l i n d e r s .
The lower c y l i n d e r is l o c a t e d d i r e c t l y above t h e t e s t specimen. Its p i s t o n is
a t t ached t o t h e specimen's upper holding-pla te and e x e r t s a downward f o r c e
on t h e specimen. The upper c y l i n d e r is l o c a t e d a t t h e top of t h e t e s t r i g and
i ts p i s t o n e x e r t s an upward f o r c e on t h e resonant mass. When t h e resonant
mass is l a r g e , t \ e d e s i r e d pre load is u s u a l l y achieved by p r e s s u r i z i n g t h e
upper cy l inder and p a r t i a l l y suppor t ing t h e weight of t h e mass. When t h e
resonant mass is smal l , t h e desj-red p re load is u s u a l l y achieved by p r e s s u r i z i n g
t h e lower cy l inder and e x e r t i n g a downward f o r c e i n add i t fon t o t h e weight of
t h e mass.
The upper and lower pre load pist .ons are s e a l e d i n t h e i r c y l i n d e r s by two
r o l l i n g diaphragm s e a l s (Bellofram 3C-600-37-FPJ and 3-119-119-CBJ). The a i r
cy l inder i n l e t h o l e is 0.762 nun (0.030 i n ) i n d iamete r , making each c y l i n d e r
e s s e n t i a l l y a "closed" c a v i t y under v i b r a t i o n c o n d i t i o n s . A c o n s t a n t pre load
f o r c e on t h e t e s t specimen is maintained through r e g u l a t i o n of a i r p r e s s u r e i n
the c y l i n d e r s . 11


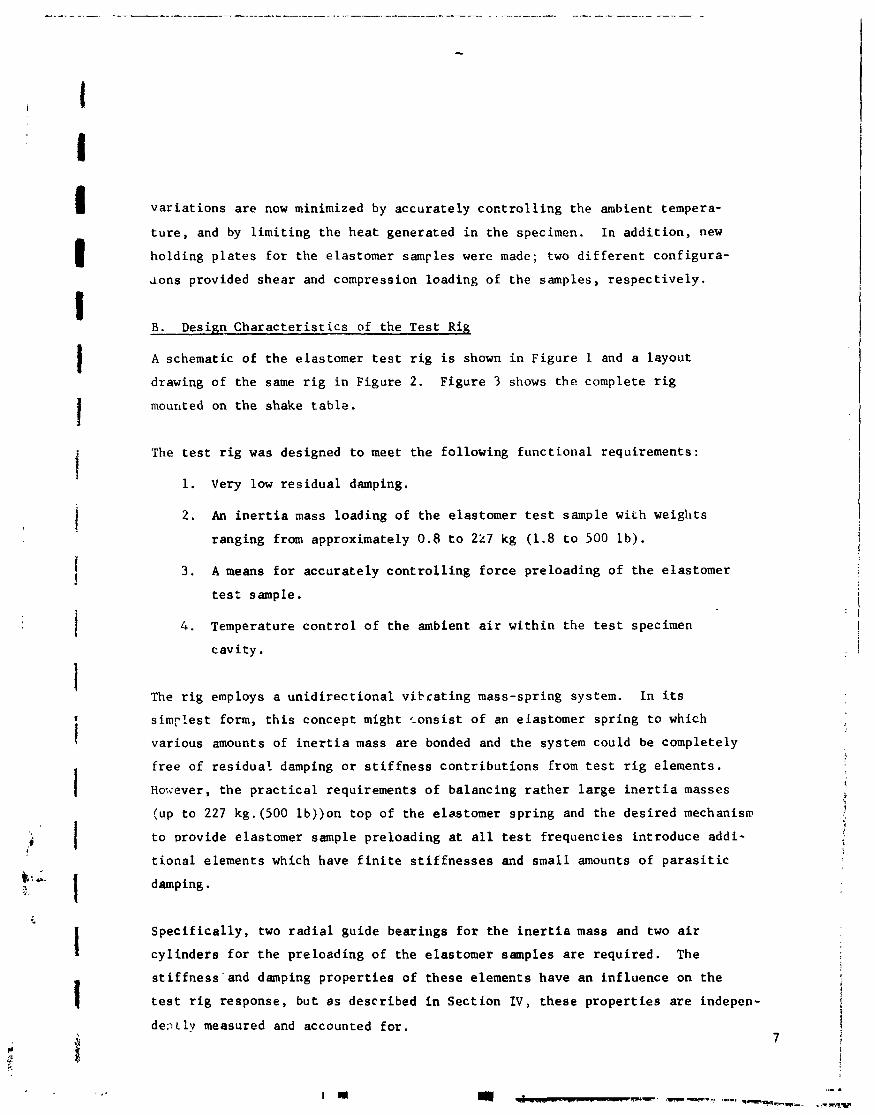
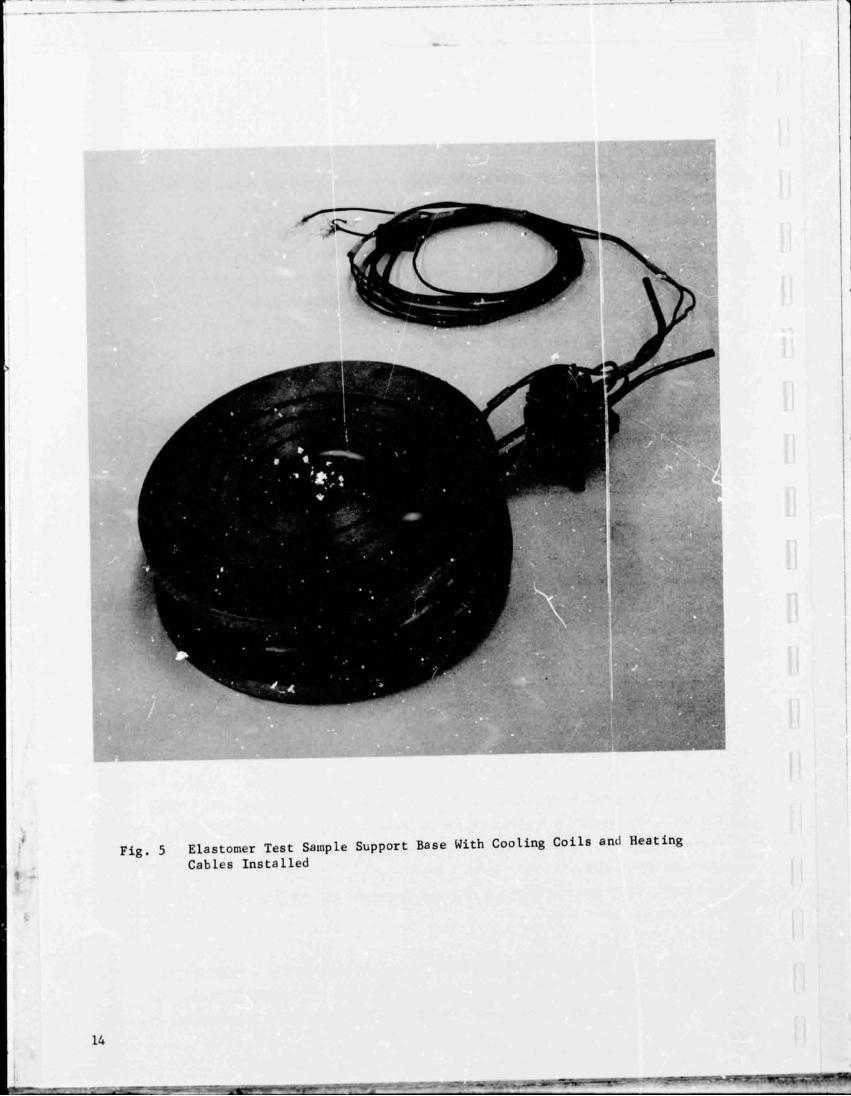
The ambient temperature w i t h i n t h e e las tomer t e s t specimen c a v i t y is c o n t r o l l e d
through the combined e f f e c t of e l e c t r i c h e a t i n g cab les and water-cooled tubes
i n s t a l l e d i n t h e base p l a t e below t h e t e s t specimens ( see Figure 5 f o r a
photograph of t h e i n s t a l l e d heat ing-cool ing e lements) . The grooves i n which
the h e a t i n g c a b l e and t h e t u b i n g a r e embedded have a r e v e r s e t a p e r t o ensure
secure and r a t t l e - f r e e o p e r a t i o n i n a v i b r a t i o n environment. The e l e c t r i c
h e a t e r is au tomat ica l ly c o n t r o l l e d by a temperature c o n t r o l l e r , which o b t a i n s
t h e necessary feedback from a thermocouple embedded i n t h e meta l of t h e base
p l a t e .
D e t a i l s of t h e temperature c o q t r o l system and of t h e ter.,perature r e c o r d i n g
system a r e shown i n F igure 6.
C . r e s t M a t e r i a l S e l e c t i o n - A s d iscussed above, t h e temperature v a r i a t i o n s a r e minimized by a c c u r a t e l y
c o n t r o l l i n g t h e ambient temperature and t h e hea t gene ia ted i n t h e specimen.
To reduce t h e e f f e c t s of any t empera tu re v a r i a t i o n s which remain, a Broad
Temperature Range (BTR) e las tomer was s e l e c t e d a s t h e t e s t m a t e r i a l . BTR
elas tomers a r e claimed t o show reduced v a r i a t i o n of m a t e r i a l p r o p e r t i e s w i t h
temperature.
Two of t h e BTR-type e las tomers under c o n s i d e r a t i o n f o r t e s t i n g were s i l i c o n e s
ar.d polybutadiene. The f i n a l choice was polybutadiene, because of t h e
d i f f i c u l t y , according t o t h e manufacturer , of producing batches of s i l i c o n e
m a t e r i a l s wi th c o n s i s t e n t m a t e r i a l p r o p e r t i e s . A s wi th most e l a s tomers ,
poiybutadiene may be produced wi th v a r i o u s m a t e r i a l hardness and damping r a t e s ,
according t o p r o p r i e t a r y manufacturers ' formulas. The polybutadiene chosen
f o r t h e t e s t desc r ibed i n t h i s r e p o r t c a r r i e s t h e manufacturer ' s (Nichols
Engineering, Inc . , She l ton , Connect icut ) d e s i g n a t i o n NE XlSSG, w i t h a nominal.
hardness of 70 durometer ( o r Shore A Hardness) and 2 1 pe rcen t of " c r i t i c a l
damping''. Th i s m a t e r i a l had t h e h i g h e s t hardness and damping of those a v a i l -
a b l e from t h e manufacturer.
The i n d i v i d u a l polybutadiene t e s t specimens were bonded wi th a cyanoacry la te
adhesive (Eastman 910 HMP) t o t h e i r r e s p e c t i v e aluminum suppor t p l a t e s . The
choice of bonding agent was based upon t h e manufacturer ' s recommendations and upon
13

sample t e s t s , which showed t h e epoxy (HYSOL AS7-4323) which was p rev ious ly used
f o r the bonding of neoprene and ure thane e las tomer specimens t o s t e e l and 1 t i t an ium s u r f a c e s y i e l d i n g u n s a t i s f a c t o r y r z s u l t s . It was found t h a t s u c c e s s f u l t bonding wi th Eastman 910 HMP is dependent upon smooth bonding s u r f a c e s , a t h i n 1 f i l m of adhesive and r a p i d a p p l i c a t i o n of a cons ide rab le clamping f o r c e t o t h e
banded s u r f a c e s .
D. Shear Tes t Samp1.e~
The shea r t e s t specimens were molded a s s h e e t s 15 cm by 15 cm (6 i n . by 6 i n . )
wi th a th ickness of 3.2 mm (0.125 i n . ) . I n d i v i d u a l t e s t specimens of t h e fo l lowing
q u a n t i t i e s and s i z e s were knife-cut from t h e s e s h e e t s :
1. Four s t r i p s - 25.4 mm high x 48.8 nun long (1.0 x 1.92 i n . )
2. Eight s t r i p s - 12.7 mm high x 48.8 mm long (0.5 x 1.92 i n . )
3. Twenty s t r i p s - 2 . 1 m high x 48.8 mm long (0.2 x 1.92 i n . )
I n the c a s e of t h e f i r s t sample c o n f i g u r a t i o n , t h e f o u r i n d i v i d u a l s t r i p s
were glued wi th one of t h e i r l a r g e f a c e s t o t h e s i d e s of a square aluminim
block and wi th t h e i r o t h e r l a r g e f a c e each t o one a d d i t i o n a l aiuminim ho ld ing
block (see Figure 7 f o r a photograph of t h e assembly of t h e f o u r - s t r i p s h e a r
t e s t sample). I n t h e assembly of the t e s t f i x t u r e , t h e f o u r ho ld ing blocks
were bo l t ed t o t h e shaks- table , whi le t h e elastomer-supported c e n t e r b lock
was a t t a c h e d to , and t n e r e f o r e became p a r t o f , t h e resonan t mass.
The ~ e c o n d s h e a r t e s t sample i n i ts assembled c o n f i g u r a t i o n (Figure 8) was ve ry
s i m i l a r t o t h e f i r s t one, except. t h a t each of t h e assembl ies was only of h a l f
t h e h e i g h t . The two assembl ies , p laced on t o p of each o t h e r , then f i t t e d i n t o
e x a c t l y the same space i n t h e t e s t f i x t u r e a s t h e f i r s t t e s t sample. The
e i g h t s t r i p s , d e f l e c t i n g i n unison, were designed t o have t h e same s t i f f n e s s
a g a i n s t d e f l e c t i o n of t h e c e n t e r mass r e l a t i v e t o t h e mounting b locks , a s t h e
four s t r i p s in t h e f i r s t assembly ( s e e Appendix A).
The convenience a s s o c i a t e d wi th the assembly uf i n d i v i d u a l four-specimen sub-
assembl ies becomes q u i t e apparent upon i n s p e c t i o n of t h e t h i r d s h e a r t e s t


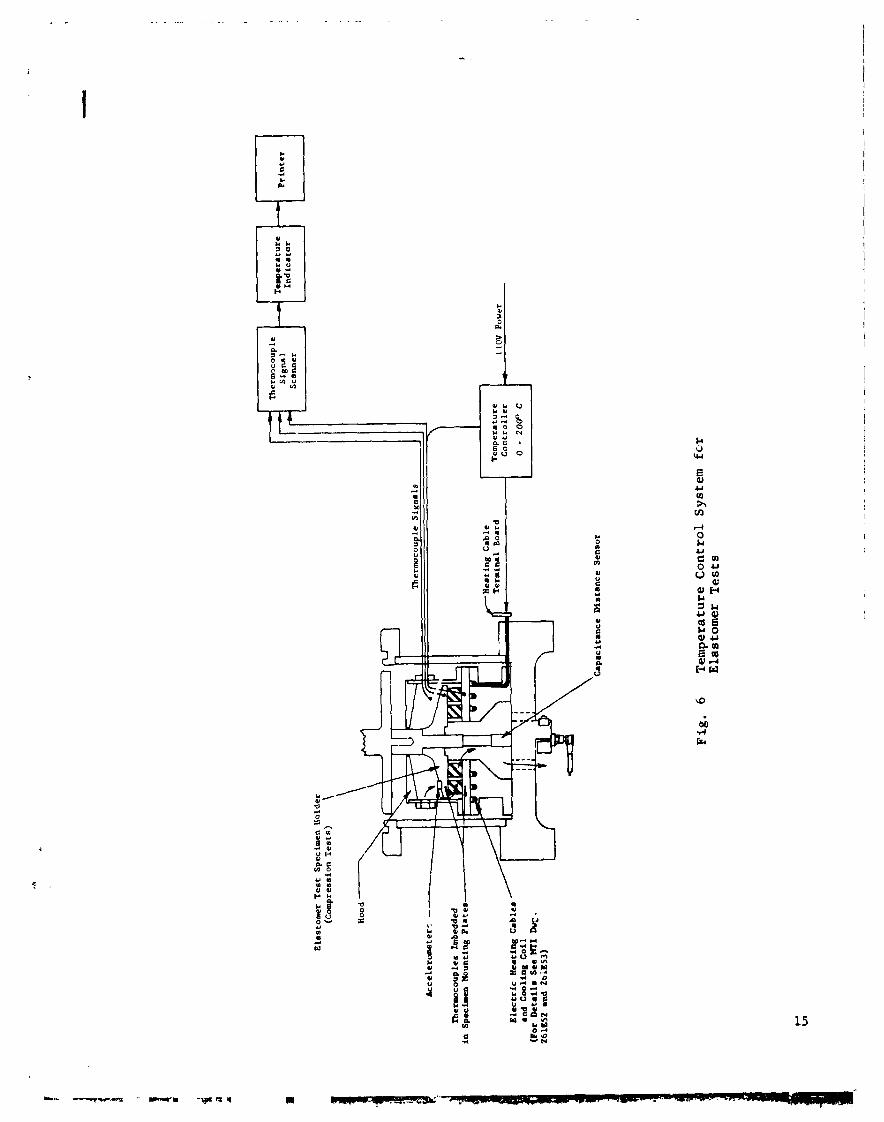
sample (Figure 9 ) . To mainta in t h e same s t i f f n e s s of t h e assembly wi th s h e a r
s t r i p s only 5.1 mm (0.2 i n . ) h igh, a t o t a l of twenty were needed. Since t h e
i n d i v i d u a l s t r i p s were requ i red t o be f r e e of i n t e r f e r e n c e by t h e s t r i p s above
o r below i t , they were glued t o aluminum b locks 6.4 mm (0.25 i n . ) h igh. W h e ~
assembled i n a s t o c k of f i v e , t h e r e i s a h e i g h t s e p a r a t i o n of 1 . 3 nun (0.05 in.)
between t h e i n d i v i d u a l s t r i p s .
E. Compression Teat Samples
Ind iv idua l compression t e s t specimens were shaped a s c : l i n d e r s of v a r i o u s
h e i g h t s . :he c y l i n d e r s were molded t o a unifor111 h e i g h t qf 12.7 mm (0.5 i n . )
and l a t e r c u t and growid t o t h e d e s i r e d h e i g h t . From i n d i v i d u a l specimens
the fo l lowing t h r e e test samples were assembled:
1. T h i r t y c y l i n d e r s - 12.7 mm diameter by 12.7 mm h e i g h t (0.5 x 0 .5 in . )
2. Ten c y l i n d e r s - 12 .7 m diameter by 6.4 mn high (0.5 x 0.25 i n . )
3. Three c y l i n d e r s - 12.7 mm d iameter by 3.2 mm high (0 .5 x 0.125 i n . )
The compression t e s t specimens were assembled t o c i r c u l - r p l a t e s , w i t h t h e
bottom p l a t e anchored t o t h e snaker t a b l e and t h e top p l a t e connected t o t h e
resonant mass. The assembly of t h e t h i r t y 12.7 mrn (0 .5 i n ) h igh c y l i n d r i c a l
specimens is shown i n Figure 10.
As with the s h e a r samples, t h e compression samples were each designed t o provide
s i m i l a r s t i f f n e s s e s . Appendix A d i s c u s s e s how t h e shape f a c t o r s f o r the
d i f f e r e n t he igh t c y l i n d e r s l e a d t o s e l e c t i o n of t h e above numeric&' combinations.
F. Ins t rumenta t ion
The measurement requirements f o r t h e e x p e r i m m t a l i n v e s t i g a t i o n of t h e e las tomer
dynamic p r o p e r t i e s were a s fo l lows:
1. Displacement measurement of e las tomer suppor t p l a t e a t t a c h e d t o t h e
v i b r a t i o n t a b l e , r e l a t i v e t o ground;
2, Displacement measurement of e las tomer s u p p o r t , p l a t e a t t a c h e d t o t h e
resonant mass, r e l a t i v e t o ground;


3. Phase ang le measurement betwcen displacement neasurements (1) and
( 2 ) above;
4 . Displacement measurement between two e las tomer stlpport p l a t e s ,
r e l a t i v e amplitude a c r o s s t h e e las tomer;
5 . ' J ibrat ibn frequency ;
6 . Temperature of e las tomer suppor t p l a t e s and ambient a i r temperature
i n t e s t specimen c a v i t y ;
7. V i b r a t i o n a l power d i s s i p a t i o n a r r o s s the e las tomer t e s t sample.
For convenience, a c c e l e r a t i o n was measured i n (1) and (2) i n s t e a d of d i sp lace -
ment, but s i n c e t h e motions were s i n u s o l d a l t h e d isplacements were d i r e c t l y
d e r i v a b l e from t h e a c c e l e r a t i o n s . The very low l e v e l of motion of t h e shaker
body (from which the shaker t a b l e IS i s o l a t e d by a i r s p r i n g s w i t h a ve ry low
resonant frequency) was a l s o measured by a c c e l e r o n ~ e t e r s .
The inpu t a c c e l e r a t i o n (1) was measured by an accelerometer l o c a t e d on t h e
suppor t base f o r t h e e las tomer t e s t samples. Output a c c e l e r a t i o n on t h e
resonant mass (2) was determined from t h r e e acce le romete r s mounted d i r e c t l y
t o t h e top p l a t e a t t a c h e d t o t h e e las tomer specimens. The u s e of t h r e e
accelerometers , spaced 90 degrees a p a r t , w i t h t h e i r output s i g n a l s d i sp layed
on one o s c i l l o s c o p e s c r e e n , permit ted immediate d e t e c t i o n of nonax ia l motions of
t h e rr-aonant mass. When nonax ia l motions of t h e resonant mass occur , they
manifes t themselves e i t h e r as amplitude o r phase ang le v a r i a t i o n s among t h e
t h r e e s i g n a l s , o r a s a combination of both ( t e s t i n g exper ience revea led t h a t
on ly the compression specimen having t h r e e c y l i n d r i c a l specimens was s u s c e p t i b l e
t o nonaxia l motions a t c e r t a i n t e s t f r e q u e n c i e s ) .
The displacement measurement (4) between t h e two e las tomer suppor t p l a t e s
( r e l a t i v e amplitude a c r o s s t h e e las tomer ) was accomplished wi th a noncontact ing
capacitance-type sensor .
Chromel-Alcmel type thermocouples were used t o measure t h e temperature a t t h e
midface l o c a t i o n of two s h e a r specimens i n each t e s t assembly. The thermo-
couples were embedded i n small h o l e s i n t h e aluminum ho ld ing p l a t e s a t a 2 2

d i s t a n c e o f approxitnately 1.6 mnl (1116 i n . ) from t h e e las tomer s u ~ f a c e s .
The c o m ~ r e s s i o n t e s t samples c o n t a i n thermocouples d i r e c t l y above and b t l o b
the c e n t e r po in t of t h e f l a t s u r f a c e s of t h r e e i n d i v i d u a l c y l i n d e r s . Again,
t h e thermocouples were separa ted by approximately 1.6 mm (1116 i n . ) of m e t ~ l
from t h e e las tomer s u r f a c e s . (See Figure 1& f o r t y p i c a l thermocouple i n s t a l
l a t i o n i n compression t e s t sample. )
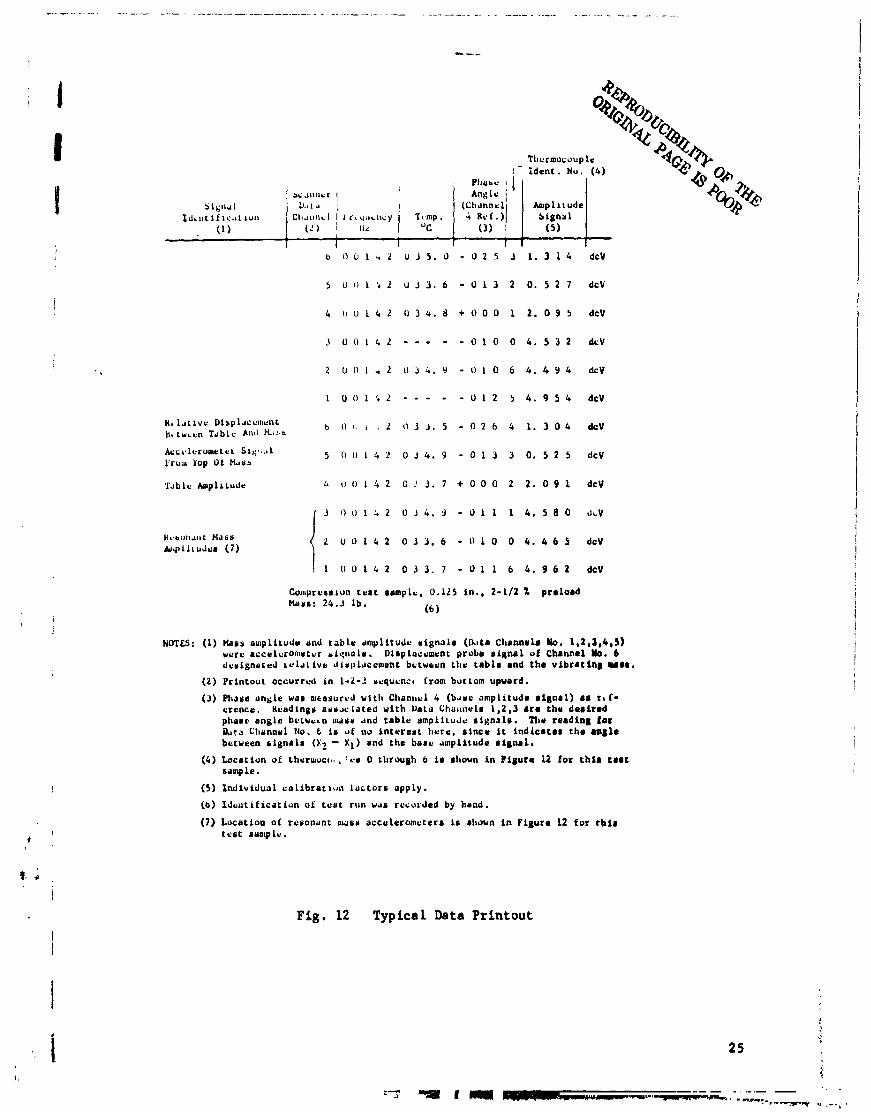
Displacement and a c c e l e r a t i o n d a t a , t o g e t h e r wi th temperatures from i n d i v i d u a l
thermocouples were d i sp layed ~ i s u a l l y i n d i g i t a l form f o r moni tor ing purposes .
A s a permanent r ecord , t h i s d a t a was a l s o recorded on a d i g i t a l p r i n t e r , w i t h one
thermocouple reading au tomat ica l ly p r i n t e d wi th each amplitude d a t a p o i n t . The
two types of d a t a were cycled independently by t h e i r own scanner-switches, and t h i s
a g iven v i b r a t i o n sensor output d id no t always appear on t h e same l i n e a s a g iven
thermocouple ou tpu t . This is i l l u s t r a t e d i n Figure 12.
Amplitude s i g n a l s , e i t h e r a c c e l e r a t i o n o r d isplacement , were s e q u e n t i a l l y
switched by an analog scanner i n t o a two-channel t r a c k i n g f i l t e r , which provided
a v i s u a l readout of v i b r a t i o n frequency and of two f i l t e r e d ampl i tude s i k n a l s .
The base amplitude s i g n a l ( a c c e l e r a t i o n ) was fed a t a l l t imes i n t o one of t h e
two channels of t h e t r a c k i n g f i l t e r and from t h e r e i n t o a phase meter where i t
served a s a r e fe rence s i g n a l f o r t h e measurement of t h e phase ang le of t h e
resonant mass amplitude s i g n a l (one of t h e accelerometer s i g n a l s ) . The d-c
va lues p ropor t iona l to phase ang le and ampl i tudes from t h e phase meter and
t h e t r ack ing f i l t e r were then converted i n r o d i g i t a l f o r r i n d i g i t a l vo l tme te r s
and p r i n t e d on paper by a 21-column p r i n t e r a t a r a t e of approximatel-y two l i n e s
per second (manually a c t i v a t e d ) . Each l i n e a d d i t i o n a l l y c o n t a i n s t h e v i b r a -
t i o n a l t e s t frequency and the temperature i n d i c a t i o n from one thermocouple.
(see Figure 12 f o r a t y p i c a l d a t a p r i n t c u t , F igure 13 f o r a photograph of
the ins t rumenta t ion console and Figure 14 f o r a schemat ic of t h e d a t a a c q u i s i -
t i o n system) .,
To monitor the power d i s s i p a t i o n i n t h e t e s t sample d u r i n ~ t e s t i n g , a power
meter was s p e c i a l l y designed and b u i l t . This meter u t i l i z e s a v a i l a b l e
C o s p r e r s ~ u n t o a t s n n p l u , 0.125 i n . , 2-1/2 % p r e l o a d Maus: 24.3 l b .
(6
Tlturmocouplr I - i d e n t . Nu. (4)
I bc.~lillur I :
NOTES: ( I ) Mass ompli tudu and t a b l e dtnyl i tudc a i g n a l r (Ill:. Clrannrls Yo. 1,2,3,4,5) werc r c c r l u r o n ~ u t u r b i q n n l r . D l r p l ~ c u m r n t probv r i ~ n a i of Channel b. 6 Juu igna taJ b ~ l d l l v t ! ~ ~ U P ~ C C P I C ~ I L butwern tht! t a b l e and t h e v i b r a t i n g
Sir;l141 I J ~ t ~ t i f lc.rLru~l
. (1 )
(2) P r i n t o u t occur rcd i n 1-2-2 acqucnct from butrom upward.
1 .I I I C l j ~ r i ~ ~ ~ l I . T ~ ~ ~ C I I C Y Tvnlp. i Ref .) I S i g n a l
( 2 ) 1 l l ~ "C ( 3 ) 1
I I 1
(3) Pt~aucr a n g l e was mrosurt,d wi th C t ~ o n t r ~ l 4 ( b a r e nmpl i tude a i g n a l ) a r r b f - orence. Kcadingu osuuc io ted wi th IJato Chaunr l r 1 ,2 ,3 are thu d o a i r e d phasr a n g l e bu tucrn u.inr and t a b l e ampl i lude r i g n a l s . The r e a d i n g for & t o Cltvmul 140. t is uf no i n t e r e a t h e r e , s i n c e i t i n d l c e t e s t h e mile between c i g n r l r ( X 2 - X1) and t h e basc m p i i t u d e r i p a r l .
(4) Loca t ion of r h ~ r i u o c t ~ . , lrs 0 through 6 i r shown i n F i g u r e 12 f o r t h i r t e a t sample.
(5 ) I n d i v i d u a l c n l i b r a t l ~ m l a r t o r s app ly .
( b ) I d ~ u t i f i c o t i o n of t e n t n r n wds recorded by hand.
(7) Loca t ion of resonan t nwsn a c c e l e r o m e t e r r i c shown i n F i g u r e 12 f o r t h i s t e s t ruotplu.
F ig . 12 Typ ica l Data P r i n t o u t


Sig
na
l S
ign
al
Mo
nit
ori
ng
S
ign
al
Pro
ce
ssin
g
Ac
qu
isit
ion
A
mp
lifi
ca
tio
n
And
S
wit
ch
ing
A
nd
Rea
do
ut
Tem
per
atu
res
T1
Th
er-m
cou
ple
T
em
pe
ratu
re
Ind
ica
tor
Am
pli
fie
rs
' P
rin
ter
41
4
Ana
lo
g
Sca
nn
er
Ph
ase
Met
er
Fil
ter
an
d
r
- 7 -
(Re
fere
nc
e)
r, - O
aci l
loa
co
pe
r
L J
lbta
Ac
au
isit
ion
Pro
be8
TI
- Te
qe
ratu
re o
f k
tr
l.
Ela
mta
r-H
am
s
T2
- Te
qe
ratu
re o
f T
emt
En
clo
sure
Iu
bie
nt
T3
- T.q
era
ture
o
f k
ta
l.
Ela
ato
rr-S
ha
ke
T
ab
le
X2-X
1 - D
iap
lac
crn
t k
mm
Re
lati
ve
to
Sh
ke
Ta
ble
A1
- Ac
ce
lera
tio
n
of
Han
s
A2
- Ac
ce
lera
tio
n o
f S
hk
e T
ab
le
A3
- Ac
ca
lera
tio
n o
f S
hh
r F
ra
a
-1-1 V
olt
rte
r
Ind
ica
tor
I
Fig. 14 Schematic of Data Acquisition System for Measurement
of Elastomer Dynamic Properties

a c c e l e r a t i o n and displacement s i g n a l i n p u t s . The t h r e e ( u n f i l t e r e d ) a c c e l z r -
ometer s i g n a l s from he top p l a t e of t h e specimen ho lde r ( resonant mass s i g n a l s )
a r e averaged, t o g i v e a s i g n a l p r o p o r t i o n a l t o t h e n e t f o r c e on t h e resonan t
mass. This s i g n a l i s t h e r e f o r e a lmost equal t o t h a t p o r t i o n of t h e f o r c e
a c t i n g through the e las tomer sample which is due t o dynamic displacement
( d i f f e r i n g only b: t h e smal l guide spoke and a i r c y l i n d e r f o r c e s due t o t h e i r
dynamic displacement . ) The displacement s i g n a l which i n d i c a t e s r e l a t i v e motion
a c r o s s the sample is d i f f e r e n t i a t e d t o g ive a s i g n a l p r o p o r t i o n a l t o r a t e of
deformation ( r e l a t i v e v e l o c i t y ) . The f o r c e and v e l o c i t y s i g n a l s a r e m u l t i p l i e d
toge the r t o g ive t h e ins tan taneous power. The ins tan taneous power c o n s i s t s
of a d-c (average) component and a s i n u s o i d a l l y va ry ing component and, by
f i l t e r i n g o u t t h e s i n u s o i d a l l y va ry ing component, t h e average power d i s s i p a -
t i o n is obta ined.
During t e s t , t h e average power d i s s i p a t i o n was he ld t o a v a l u e which, by h e a t
t r a n s f e r a n a l y s i s , gave a temperature r i s e i n t h e specimen of l e s s than
1 O c .
G. Tes t ing Procedure
One of t h e major f e a t u r e s of t h e c u r r e n t t e s t program was t h e performance of
t h e scheduled t e s t s a t near-resonance cond i t ions . S ince phase ang le between
base e x c i t a t i o n and resonan t mass response is an a c c u r a t e i n d i c a t o r of t h e amount
of damping i n t h e r e g i o n of resonance,measurements s h o ~ l d p r e f e r a b l y be made i n
the phase ang le range between approximately 15 and 165 degrees ( s e e Appendix B ) .
This r e q u i r e s t h a t t h e t e s t frequency be approximately 0.9 t o 1 . 5 t imes t h e
c r i t i c a l frequency of t h e elastomer-resonant mass system. Coverage of t h e f u l l
t e s t frequency range of 100 t o 1000 Hz w i t h s u f f i c i e n t t e s t p o i n t s t h e r e f o r e
n e c e s s i t a t e s changes i n t h e s i z e of t h e resonan t mass. Typ ica l ly between seven
and n ine d i f f e r e n t mass arrangements ranging from 0 . 8 Kg (1.8 l b . ) t o 51 Kg (113 l b . )
were found s u f f i c i e n t t o ccver the d e s i r e d t e s t range. The small .est mass m n s i s t e d
of the e las tomer t e s t sampie top p l a t e and t h e p re load c y l i n d e r p i s t o n , wi th no
a d d i t i o n a l weight a t t a c h e d . The nex t t h r e e combinat ions were ob t e i n e d by a t t a c h i n g
weights of up t o 1.9 Kg (3.5 l b . ) d i r e c t l y t o t h e p re load p i s t o n c y l i n d e r wi thout
the use of t h e spoke guide bea r ings . For t h e last f i v e mass arrangements both
guide bea r ings werc used.
2 8

Once any one of t h e s i x e las tomer test samples has been mounted on t h e shake
t a b l e and t h e necessary ins t rumenta t ion i n s t a l l e d and connected, a t y p i c a l
t e s t sequency proceeded a s fo l lows:
1. A resonan t mass was s e l e c t e d and i n s t a l l e d .
2. The e las tomer sample was s t a t i c a l l y pre loaded. (Far ze ro pre load
cases , t h e s t a t i c load ing on t h e elastome: by t h e resonan t mass
was r e l i e v e d through an a p p r o p r i a t e p r e s s u r i z a t i o n of t h e top a i r
c y l i n d e r . I f t h e p re load requirement exceeded t h e s t a t i c d e f l e c t i o n
of t h e e las tomer ob ta ined from t h e resonan t mass, p r e s s u r i z e d a i r
was admit ted i n t h e lower c y l i n d e r t o produce t h e d e s i r e d p re load .
Elastomer d e f l e c t i o n s were determir,ed by readout from t h e capac i t ance
probe i n s t a l l e d i n t h e lower base p l a t e of t h e e las tomer specimen
holding f i x t u r e . ) 3. The e las tomer t e s t sample c a v i t y was enclosed and t h e temperature
c o n t r o l system given t ime t o a d j u s t ambient temperature t o t h e
d e s i r e d va lue .
4. Wfth low v i b r a t i o n l e v e l s a p p l i e d t o tile base of t h e e las tomer
ho ld ing f i x t u r e , frequency scans were conducted u n t i l t h e approximate
r e m n a n t frequency of t h e system was found. Subsequently, an
exac t de te rmina t ion of t h e system resonan t frequency was made by
t r a c i n g , on an X-Y p l o t t e r , t h e d-c va lue p r o p o r t i o n a l t o t h e resonant
mass a c c e l e r a t i o n amplitude a s a f u n c t i o n of t h e base e x c i t a t i o n
frequency. It may be noted h e r e t h a t , f o r a base-exci ted s i n g l e
degree of freedom spring-dcmper-mass system, resonance occurs a t
an ang le smal le r than 90 degrees . The d e v i a t i o n from 90 degrees i s
e s s e n t i a l l y determined by t h e emou3t of damping i n t h e system a s
shown i n Appendix B.
5. While t h e predetermined v i b r a t i o n a l power d i s s i p a t i o n l e v e l i n
t h e e las tomer t e s t sample was m ~ i n t a i n e d by adjus tment of t h e
shaker power inpu t l e v e l , t h e v i b r a t i o n freqcency was reduced
u n t i l t h e phase a n g l e dec reases t o a va lue between 15 and 25
degrees . Provided none of t h e o s c i l l o s c o p e monitored acce le ra -
cion and displacement s i g n a l s showed s i g n s of a b n o r m a l i t i e s (d i s -
t o r t i o n s , o r i n d i c a t i o n s of nonax ia l motion of t h e resonan t mass) , 2 9

a d a t a point was recorded. The record ing of one d a t a point
cons i s t ed of e i t h e r one o r two complete p r i l l t o u t s of a l l
ampl i tudes (up t o seven i n d i v i d u a l s i g n a l s ) , a s s o c i a t e d
phase ang les and t e s t frequency, and a l l temperatures from
t h e thermocouples loca ted i n t h e t e s t specimen ho ld ing p l a t e s .
6 . Stepwise i n c r e a s e s i n v i b r a t i o n frequency were imposed and
between s i x and t e n d a t a p o i n t s were recorded u n t i l t h e phase
tingle reached approximately 165 degrees .
7 . Shake t a b l e power was turned o f f and t h e p re losd on t h e
e las tomer sample was inc reased t o t h e next h igher value .
8. S teps 4 through 7 were repea ted u n t i l d a t a a t a l l d e s i r e d pre-
loads was obta ined.
9. Shaker t a b l e power was turned o f f , and a1 1 pre load on t h e
e las tomer sample removed. The e las tomer t e s t sample was then given
time (ap t o one hour) t o recover i t s o r i g i n a l , uncompressed
h e i g h t ( a s i n d i c a t e d by d i s p l a c e n e n t probe r e a d i n g s ) .
T e s t s , comprising s t e p s 1 through 9, were then repea ted w i t h each of t h e
remaining masses i n t u r n , each mass g iv ing a dynamic system w i t h a d i f f e r e n t
resonant frequency.
The complete s e t of r e s u l t s obta ined f o r each t e s t specimen was reduced t o
y i e l d s t i f f n e s s and damping v a l u e s over the range of frequency covered by
t h e t e s t s . The a n a l y s i s upon which t h i s d a t a r educ t ion was based is d e s c r i b e d
i n t h e fo l lowing s e c t i o n s of t h i s r e p o r t .
H. T e s t Rig Response
With t h e forced v i b r a t i o n type of t e s t i n g desc r ibed i n t h i s s e c t i o n , t h e dynamic
c h a r a c t e r i s t i c s of t h e e las tomer a r e b a s i c a l l y determined by measuring t h e
motions of t h e resonant mass and knowing t h e s t i f f n e s s and damping c h a r a c t e r i s t i c s
of a l l elements of t h e t e s t r i g . I t was, t h e r e f o r e , nece s a r y t o analyze the
dynamic response of t h e t e s t r i g wi th t h e o b j e c t i v e of de :e rmin iq t h e c h a r a c t e r -
is t i c s of t h e v a r i o u s sye tem components, v iz . , lower c y l i n d e r , upper c y l i n d e r and i I
guide bea r ings .
3 0

A dynamic model of the c e s t r i g is shown i n Figure 15 where t :he system components
a r e denoted by a s p r i n g o r a combination of a s p r i n g and a dashpot depending
on t h c i r phys ica l c h a r a c t e r i s t i c s . Both c! , l lnders and t h e guide bea r ings have been
designed such that t h e i r s t i f f n e s s e s a r e n e g l i g i b l y smal l compared t o t h e s t i f f -
ness of t h e e las tomer . Hence, very l i t t l e p r e c i s i o n is requ i red i n determining
t h e s e s t i f f n e s s v a l u e s . However, damping in t roduced by t h e use of rubber s e a l s
i n t h e c y l i n d e r s needs c a r e f u l a t t e n t i o n s i n c e these damping c o e f f i c i e n t s may
be q u i t e comparable wi th t h a t of t h e z las tomer specimen.
I n o rde r t o determine the dynamic response of t h e t e s t r i g , each component was
t e s t e d i n d i v i d u a l l y and i t s r e l e v a n t c h a r a c t e r i s t i c s were measured. When
assembly does not in t roduce any a p p r e c i a b l e changes, t h e complete dynamic re -
sponse of t h e t e s t r i g is determinable by t h e c h a r a c t e r i s t i c s of each of t h e
system elements. The most l i k e l y e lements , whose response may c!epend on t h e
assembly, a r e perhaps t h e rubber s e a l s i n t h e c y l i n d e r s s i n c e t h e i r damping
c o e f f i c i e n t s may depend on t h e i r proper al ignment t o a c e r t a i n degree . With
t h e primary o b j e c t i v e of p r e c i s e l y determining t h e dynamic response of t h e
t e s t r i g , t h e e las tomer specimen was rep laced by a mechanical s p r i n g shown i n
F igure 16, whose s t i f f n e s s arid e q u i v a l e n t mass a r e measured exper imenta l ly . Along
wi th the t e s t i n g of each system element s e p a r a t e l y , t h e t o t a l response of t h e t e s t
r i g wi th t h e mechanical s p r i n g was measured a s a func t ion of a i r p r e s s u r e s i n t h e
c y l i n d e r s . Although t h e s t i f f n e s s of t h e v a r i o u s elements may be determined
by the experiments performed w i t h each of t h e system elements, i t was found
t h a t t h e dampfnp of t h e c y l i n d e r s was b e s t determined by performing a l e a s t
squares a n a l y s i s of t h e measured response of t h e assembled t e s t r i g .
The d e t a i l s of t h e a n a l y s e s desc r ibed above a r e p resen ted i n Appendix 0 . The
r e s u l t s arc summarized below.
Numerical Values f o r Dynamic C h a r a c t e r i s t i c s of Tes t Rig Elements
Guide a e a r i n g S t i f f n e s s k = 3.675 x lo4 ~ / r n (210 l b / i n ) s
Lower Cyl inder Damping 2
c = 1.02 x 10 N-sec/m (0.583 l b - s e c / i n ) L
Upper Cyl inder Damping c = 2.45 N-sec/m (0.014 lb - sec / ln ) u

P
RES SPOKES MASS
m $hu OUTPUT r2= A2 sin(ut - y)
----- LOWER ---ELASTOMER SPECIMEN ,- - -I - - -, CY LINER
i AIR SPRING
REPLACEABLE BY I I MECHANICAL SPRING FOR CALIBRATION I
PURPOSES _f ad-


5 Lower Cyl inder S t i f f n e s s kg = 1.642 x 10 + 1.023 pg N/m (938 + 40.25 p , l h , ' . r I
Upper Cyl inder S t i f f n e s s 4 kU = 9.0 x 1 0 + 1 . 5 2 5 pu N/m(515 + 60 .00Pu
2 2 where p p and p a r e p r e s s u r e s i n N/m o r l b / i n gage i n t h e lower and upper cy l -
u inders r e s p e c t i v e l y . Note t h a t a l l the above va lues a r e independent of frequency.
A s shown i n Appendix B, when t h e e las tomer specimen i s i n p l a c e , and t h e phase
angle p and r a t i o of output t o i n p u t amplitude. a , i s measured, t h e e las tomer
s t i f f n e s s and damping (Ke ,Ce) a r e c a l c u l a t e d as fol lows: 2 2
(ku + 2ks)a (cos9-a)+wCuaSin$-mm (acosp-a ) Ke = -K +
R a2 - 2acos 4 + 1
All the d a t a f o r damping of t h e e las tomer is presented as tile imaginary p a r t
of t h e complex s t i f f n e s s ( d e ) .
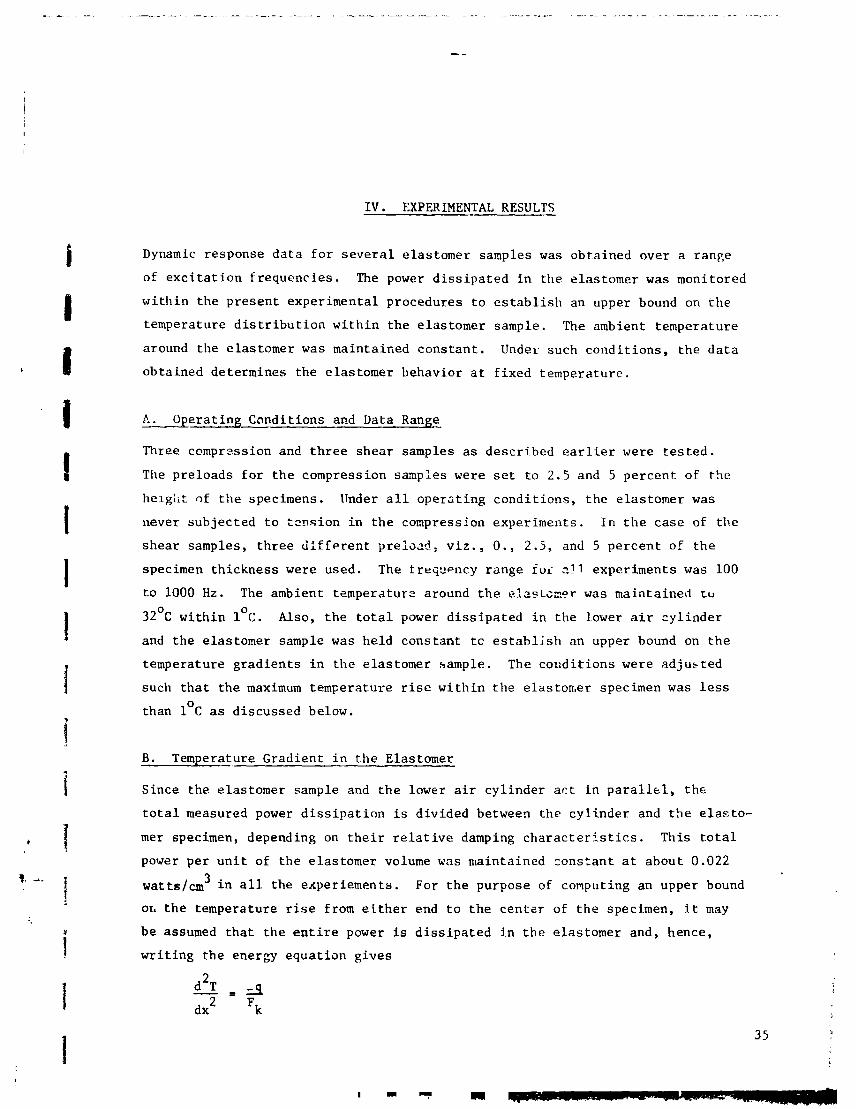
IV. EXPERIMENTAL RESULTS
Dynamic response d a t a f o r s e v e r a l e las tomer samples was obta ined over a range
of e x c i t a t i o n f requenc ies . The power d i s s i p a t e d i n t h e e las tomer was monitored
w i t h i n t h e p r e s e n t exper imenta l procedures t o e s t a b l i s h an upper bound on t h e
temperature d i s t r i b u t i o n w i t h i n t h e e las tomer sample. The ambient temperature
around the e las tomer was maintained cons tan t . Under such cond i t ions , t h e d a t a
obta ined determines the e las tomer behavior a t f i x e d temperature .
A . Operating Condit ions and Data Range
Three comprsssion and t h r e e shea r samples a s desc r ibed e a r l i e r were t e s t e d .
The p re loads f o r t h e compression s a ~ p l e s were s e t t o 2 .5 and 5 pe rcen t of the
helgii t of t h e specimens. Under a l l o p e r ~ t i n g c o n d i t i o n s , t h e e las tomer was
never sub jec ted t o t m s i o n i n t h e compression experiments. In t h e c a s e of t h e
shea r samples, t h r e e d f f f e r e n t p r e h d : v i z . , O . , 2.5, and 5 p e r c e n t of t h e
specimen th ickness were used. The f r e q a m c y range ioi 211 experiments was 100
t o 1000 H z . The ambient tsmperaturg around t h e e l a ~ i s a n r was maintained tu
3 2 ' ~ w i t h i n 1°c. Also, t h e t o t a l power d i s s i p a t e d i n the lower a i r c y l i n d e r
and t h e e las tomer sample was he ld cons tan t t c e s t a b l i s h an upper bound on t h e
temperature g r a d i e n t s i n t h e e las tomer sample. The c o n d i t i o n s were ad ju$ ted
such t h a t t h e maximum temperature r i s e w i t h i n t h e e l a s t o r h e r specimen was l e s s
than 1°c a s d iscussed below.
B. Temuerature Gradient i n t h e Elastomer
Since the e las tomer sample and t h e lower a i r c y l i n d e r a c t i n p a r a l l e l , t h e
t o t a l measured power d i s s i p a t i o n i s divided between t h e c y l i n d e r and t h e e l a s t o -
mer specimen, depending on t h e i r r e l a t i v e damping c h a r a c t e r i s t i c s . This t o t a l
power pe r u n i t of t h e e las tomer volume was maintained cons tan t a t about 0.022
watts/cm3 i n a l l the experiements. For t h e purpose of computing an upper bound
or. t h e temperature r i s e from e i t h e r end t o t h e c e n t e r of t h e specimen, i t may
be assumed t h a t t h e e n t i r e power is d i s s i p a t e d i n t h e e las tomer and, hence,
w r i t i n g t h e energy equat ion g i v e s n

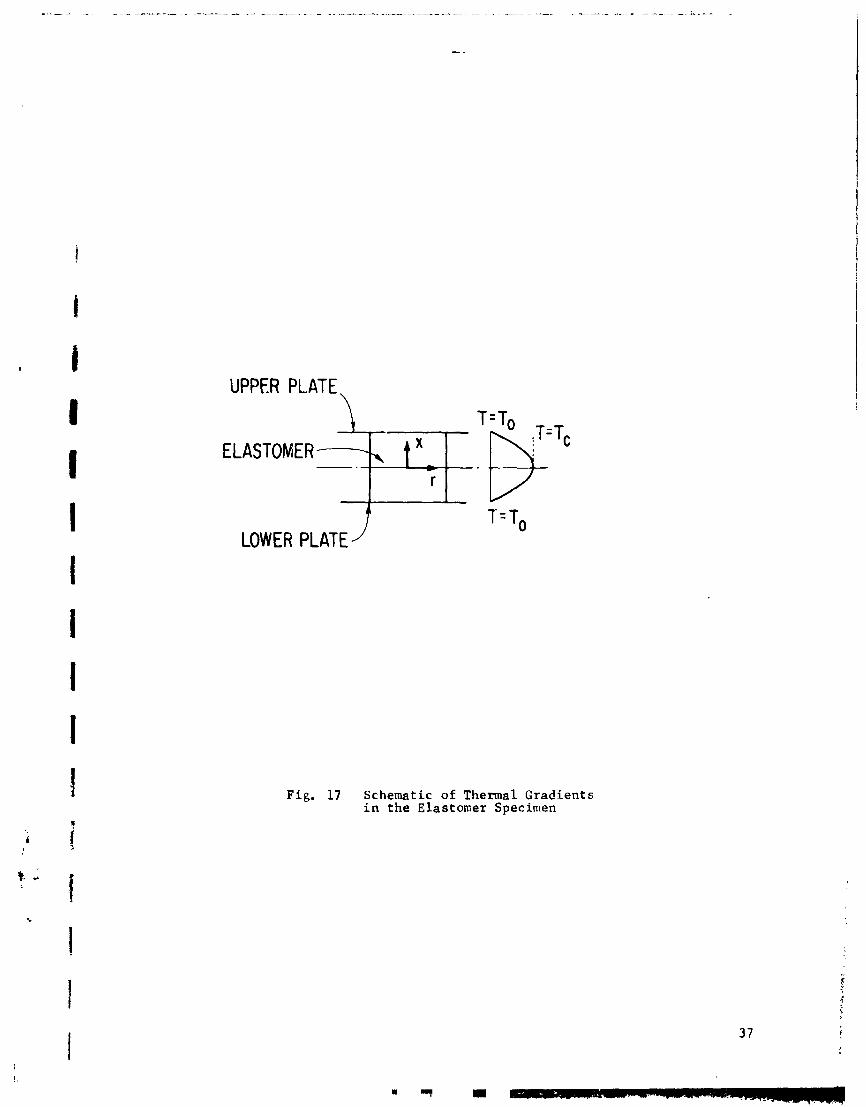
0 3 where T is the temperature ( C), q is the d i s s i p a t i o n (wattslcm ), F is tlie 0
k thermal c o n d i c t i v i t y (wa t t s / C cm) and x is the coord ina te a s shown i n F i ~ u r e 17.
Since the temperature a t t h e two ends is he ld cons tan t a t say T t h e above 0'
equat ion may be i n t e g r a t e d t o determine the temperature T i n t h e c e n t e r of C
t h e specimen.
where a , h e i g h t of the specimen is 1.27 cm (0.5 i n . ) f o r t h e wors t case . Assuming. 0 the t h e r n a l conduc t iv i ty t o be 0.002 w a t t s / C cm [ 7 ] t h e temperature r i s e f o r
3 a d i s s i p a t i o n of 0.022 watts/cm w i l l be
Thus, under a l l o p e r a t i n g c o n d i t i o n s f o r t h e e n t i r e exper imenta l d a t a , t l ie 0
temperature r i s e w i t h i n the e las tomer is l e s s than 1 C . S ince t h e ambient 0 0
temperaEure was monitored t o be cons tan t a t 32 C t o w i t h i n 1 C , i t may be con-
cluded t h a t t h e measured e las tomer response is under i so the rmal cond i t ions .
C . Reduction of Experimental Data t o Complex S t i f f n e s s
The exper imenta l v a r i a b l e s measured included t h e inpu t and ou tpu t a c c e l e r a t i o n ,
r e l a t i v e phase ang le , r e l a t i v e amplitude of e las tomer displacement and t h e
d i s s i p a t e d power. When t h e damping c o e f f i c i e n t f o r t h e lower c y l i n d e r is a con-
s t a n t , then t h e d i s s i p a t i o n i n t h e c y l i n d e r a t any frequency i s p r o p o r t i o n a l
t o the r e l a t i v e displacement amplitude. Thus, when t h e t o t a l d i s s i p a t i o n ( c y l i n d e r
p l u s e las tomer sample) i s l -c ld c o n s t a n t , t h e d isplacement amplitude is a n
i n d i c a t o r of e l a s ~ o i n e r d i s s i p a t i o n . From t h e measurenent of t h e inpu t and out-
pu t a c c e l e r a t i o n , and t h e obse rva t ion t h a t a l l motions a r e s i n u s o i d a l , t h e syFren
~ r a ~ s r n i s s i h i l i t y a , which is t h e r a t i o of ou tpu t t o i n p u t ar !pl i t rdes , nia: be be te r -
mined. 9 0 1 n t h e measurement of t h e phase a n g l e Cp and t h e c c m p u t ~ d ir, Z~~uat ion: ;
(1) and Table 1 may be used t o compute t h e e las tomer s t i f f n e s s and iam3ing P
c o e f f i c i e n t s c . e
UPPER PLATE \
LOWER PLATE f
Fig. 17 Schematic of Thermal Gradients in the Elastomer Specimen
The phys ica l c h a r a c t e r i s t i c s of an e las tomer a r e sometimes denoted i n terms
of a complex s t i f f n e s s . Also s i n c e s i m u l a t i o n of m a t e r i a l behavior by mechani-
c a l v i s c o e l a s t i c models is g e n e r a l l y performed i n terms of complex s t i f f n e s s
o r complex compliance, t h e s e q u a n t i t i e s a r e de f ined below.
Complex S t i f f n e s s K = K 1 4 iK2
Complex Compliance H = H 1 - iH2
Also, no te t h e r e l a t i o n s h i p s
H = 1 / K
K 1 = k t h e e las tomer s t i f f n e s s c o e f f i c i e n t e
and
K2 = wc where w is t h e frequency i n r a d i a n d l s e c . e
With the above r e l a t i o n s , t h e complex s t i f f n e s s is a l s o w r i t t e n a s
K = ke + i (wc ) . e
From the computed k and c t h e r e a l and imaginary p a r t s K 1 and K2 may b e d e t e r - e e '
mined and a l l t h e r e s u l t s a r e p resen ted i n terms of these parameters .
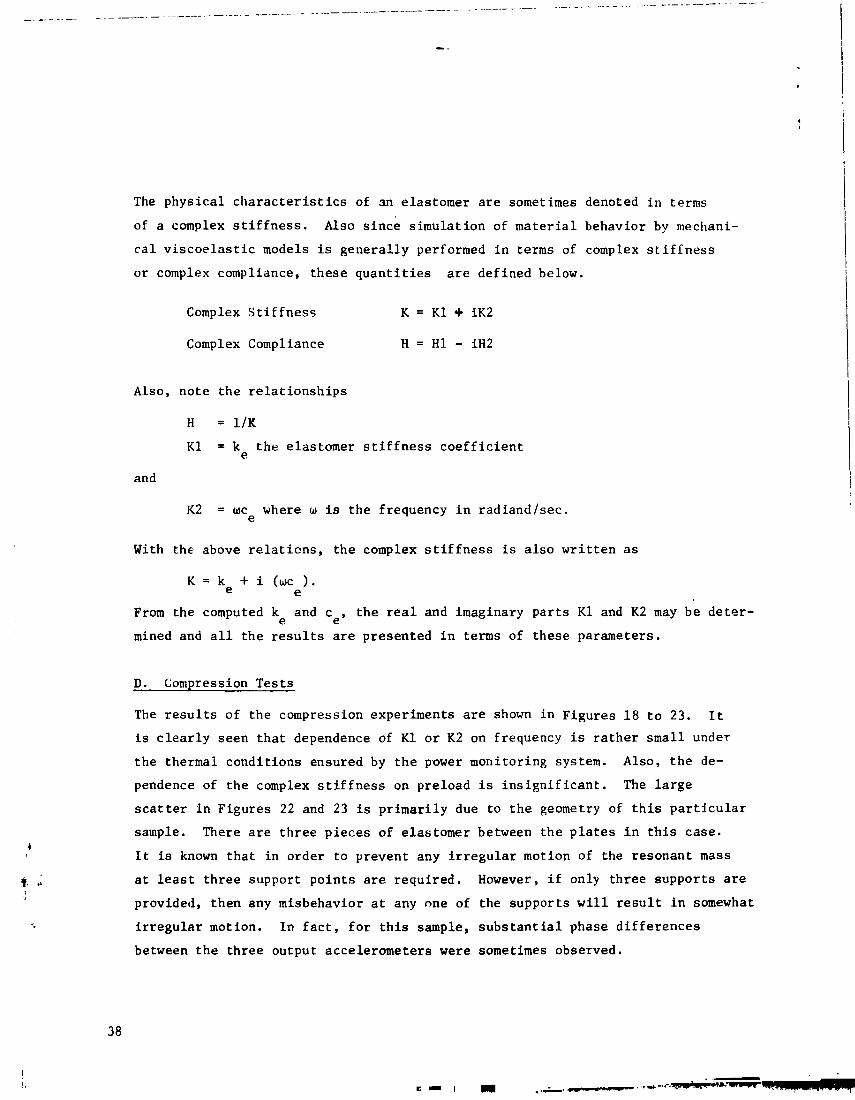
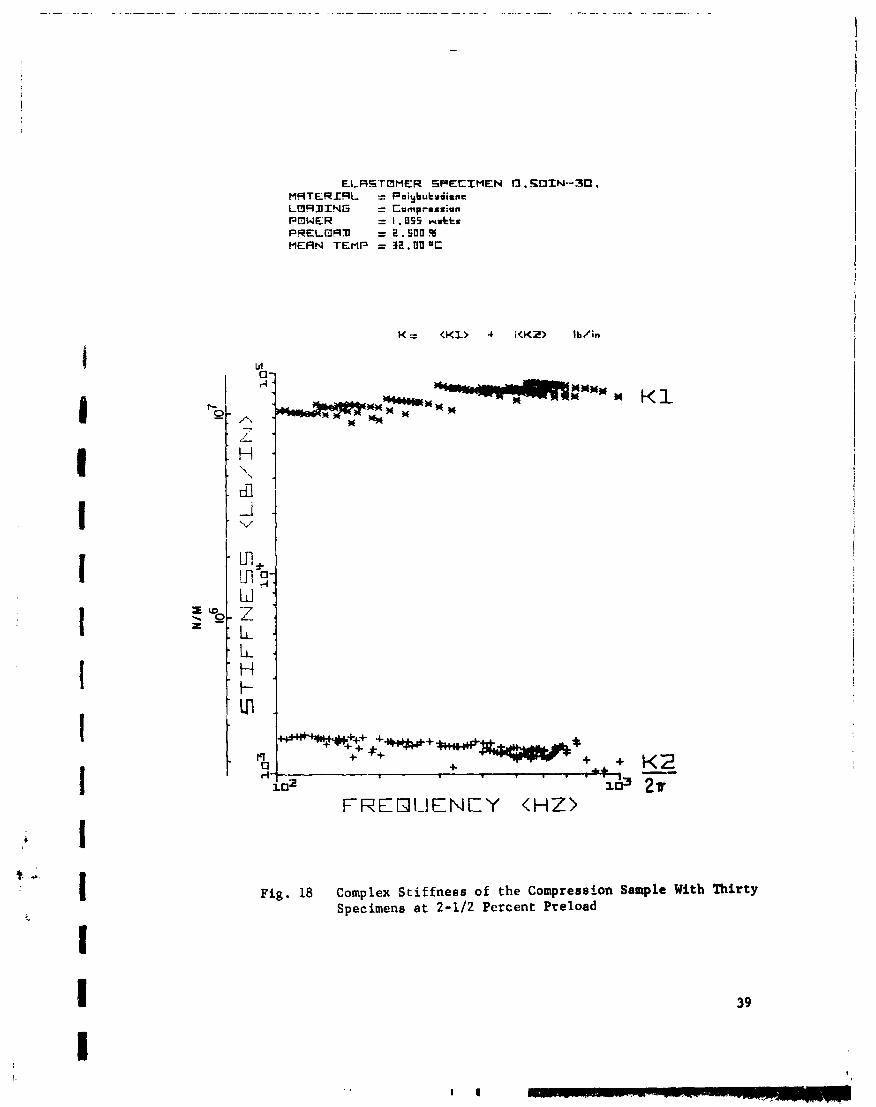
D. Compression T e s t s
The r e s u l t s of t h e compression experiments a r e shown i n F igures 1 8 t o 23. I t
is c l e a r l y seen t h a t dependence of K 1 o r K2 on frequency is r a t h e r smal l under
t h e thermal cond i t ions ensured by t h e power moni tor ing system. Also, t h e de-
pendence of t h e complex s t i f f n e s s on pre load is i n s i g n i f i c a n t . The l a r g e
s c a t t e r i n F igures 22 and 23 is p r i m a r i l y due t o t h e geometry of t h i s p a r t i c u l a r
satnple. There a r e t h r e e p i e c e s of e l a s tomer between t h e p l a t e s i n t h i s case .
I t is known t h a t i n o rde r t o prevent any i r r e g u l a r motion of the resonan t mass
a t l e a s t t h r e e suppor t p o i n t s a r e r equ i red . However, i f only t h r e e suppor t s a r e
provided, then any misbehavior a t any nne of the suppor t s w i l l r e s u l t i n somewhat
i r r e g u l a r motion. I n f a c t , f o r t h i s sample, s u b s t a n t i a l phase d i f f e r e n c e s
between t h e t h r e e output acce le romete r s were sometimes observed.
ELRSTBMER SPECIMEN n . S O X N - - X U . MFITERSFIL = Paiybutrdirnc LBFIIIING = Cmrnprmsslon PBWER = 1.055 w&kr P!?ELC3FIS = 2 .500 % MEAN TEMP = 32. UU "1
F i g . 18 Complex S t i f fnes s of the Compression Sample With Thirty Specimens a t 2-112 Percent Preload

ELRSTaMER SPECIMEN 0 . S O I N - 3 a . M R T E R I R L = Pdybutrdirnu L B R I I I N G = Cumprmximn PBWER = 1.055 m*c.ttx P R E L B R X = 5 .000 RI MERN TEMP = 32.00 m C
FREGIUENCY <HZ>
Fig. 19 Complex Stiffness of the Compression Sample With Thirty Specimens at Five Percent Preload

ELRSTBMER SPECIMEN l3.2hIN-10. MRTERXRL = Polybutrdirnm LBRDXNG = Cmrnprmaion PBWER = .I15 w . t b PRELURD = 2.500 RT HERN TEMP = 32 .DO O C
FREQUENCY <HZ>
Fig. 20 Complex S t i f fnes s of the Compreesion Sample Wtth Ten Specimens at 2-1/2 Percent Preload
ELRSTEI~IER SPECIMEN D.~SXN-I~. MRTERIRL = PmltJbutzdi=n= LDR91NG =: tarnprs=ribn PDWER = . I15 3.ttr PRPLaRR = 5. DO0 I MERN TEMP = 32.110
Fig. 21 Complex St i f fness of the Compression Sample With Ten Specimens a t Five Percent Preload
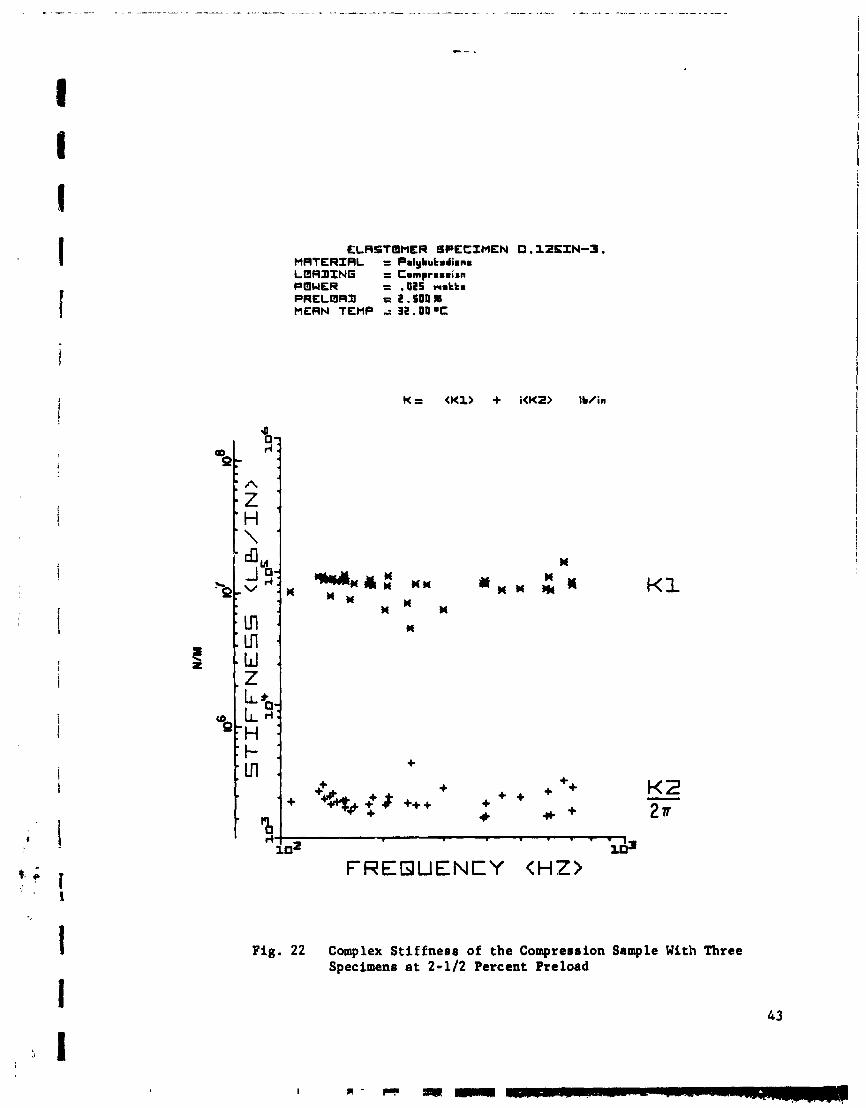
E L R S T a M E R SPECIMEN D. lZ!hIN-3 . M F I T E R I R L = Pdybutslimnm LaADING = Cmmprmmmimn P13WER = ,025 rcmtta PRELmRfl = 2.500 11 MfRN T E M P 2 3 2 . 00 mC
FREQUENCY <HZ>
Fig. 22 Complex Stiffness of the Compression Sample With Three Specimens at 2-112 Percent Preload
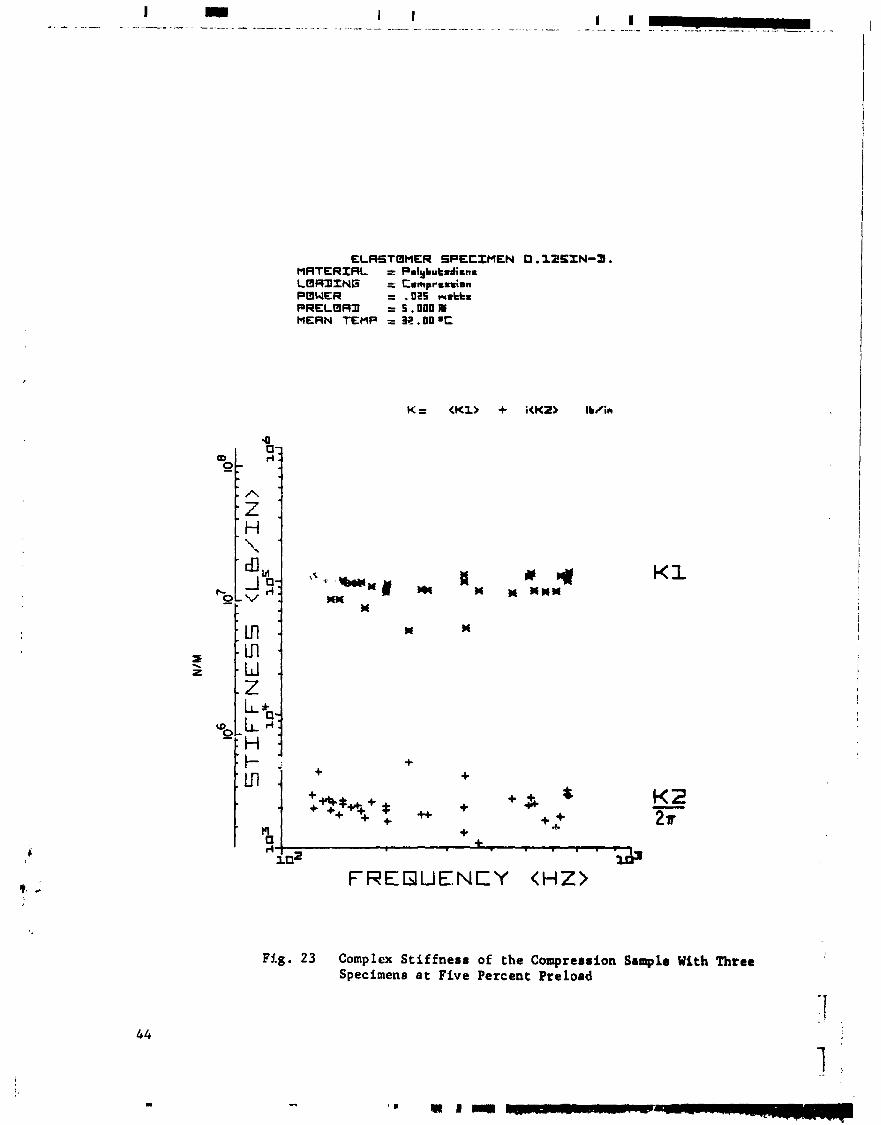
E L R S T O M E R S P E C I M E N O.1ZSXN-3. M R T E R I R L =: Pdybutsdirna L O R R I N G =: ~ o m p r r r ~ i o n POWER = .oar; wst ta PRELmAO = 5 . POD Al MERN TEMP = 33 .DP O C
F l g . 23 Complex S t i f fnes s of the Comprerrion Sample With Three Specimens a t Five Percent Preload

Close examination of t h e r e s u l t s of F igures 1 8 and 23 show t h e v a l u e s f o r K1
t o f c l l o w a number of d i s t i n g u i s h a b l e l i n e s whose s l o p e s d i f f e r from t h e o v e r a l l
t r e n d s . These l i n e s respond t o . t h e d i f f e r e n t v a l u e s of resonant mass, and I t
should be noted t h a t each change i n mass r e q u i r e s a reassembly of t h e t e s t r i g
and b a s i c a l l y a new set-up. These obse rva t ions i n d i c a t i n g t h e v a l u e s of K l t o
be somewhat dependent on t h e resonan t mass, p r i m a r i l y imply t h a t t h e i n f e r r e d
v a l u e s of K1 :o a c e r t a i n e x t e n t a r e dependent of t h e n a t u r a l frequency of the
t e s t r i g . Th i s dependence is l e s s pronounced f o r K 2 . Although t h e s e obse rva t ions
a r e no t completely understood a t t h i s t ime, i t may be mentioned t h a t , i n g e n e r a l ,
t h e s e n s i t i v i t y of a r e sonan t mass method t o r e s i d u a l e r r o r s i n t h e t e s t procedure W
can be expected t o vary wi th (- ). W n
The v a r i a t i o n of r e l a t i v e amplitude of deformat ion i n t h e e las tomer a s a f u n c t i o n
of frequency (when t h e d i s s i p a t i o n i n t h e e las tomer p l u s t h e lower c y l i n d e r is
he ld c o n s t a n t ) was found t o be q u i t e independent of p re load . A t y p i c a l v a r i a - 1 tiom of amplitude a s a f u n c t i o n of frequency is shown i n Figure 24. The dec rease 1 i n amplitude wi th i n c r e a s e i n frequency i n d i c a t e s t h a t t h e power d i s s i ~ a t e d i n
the e las tomer a l s o dec reases wi th i n c r e a s e s i n frequency s i n c e K2 o r c w ' i s e
f a j r l y c o n s t a n t . T t should, however, be noted t h a t the computations of K1 and
K 2 a r e based on t h e assumption t h a t t h e a i r c y l i n d e r damping c o e f f i c i e n t s a r e
c o n s t a n t .
E. Shear T e s t s
Complex s t i f f n e s s d a t a f o r t h e s h e a r experiments f o r t h e v a r i o u s specimens
a t d i f f e r e n t p re loads a r e summarized i n F igures 25 t o 33. Tn g e n e r a l , t h e
frequenc lependence is aga in smal l and a l s o t h e e f f e c t s of p re loads appear
t o be i n s i g n i f i c a n t . However, when compared wi th t h e compression
d a t a , i t is seen t h a t both the r e a l and imaginary p a r t s of t h e complex s t i f f -
n e s s a r e somewhat h igher i n t h e c a s e of s h e a r t e s t s .
Again, due t o t h e power c o n s t r a i n t s , t h e r e l a t i v e amplitude v a r i a t i o n a s a
f u n c t i o n of frequency is n e a r l y i d e n t i c a l f o r a l l t h e specimens. Typ ica l
r e s u l t s are shown i n Figure 24.
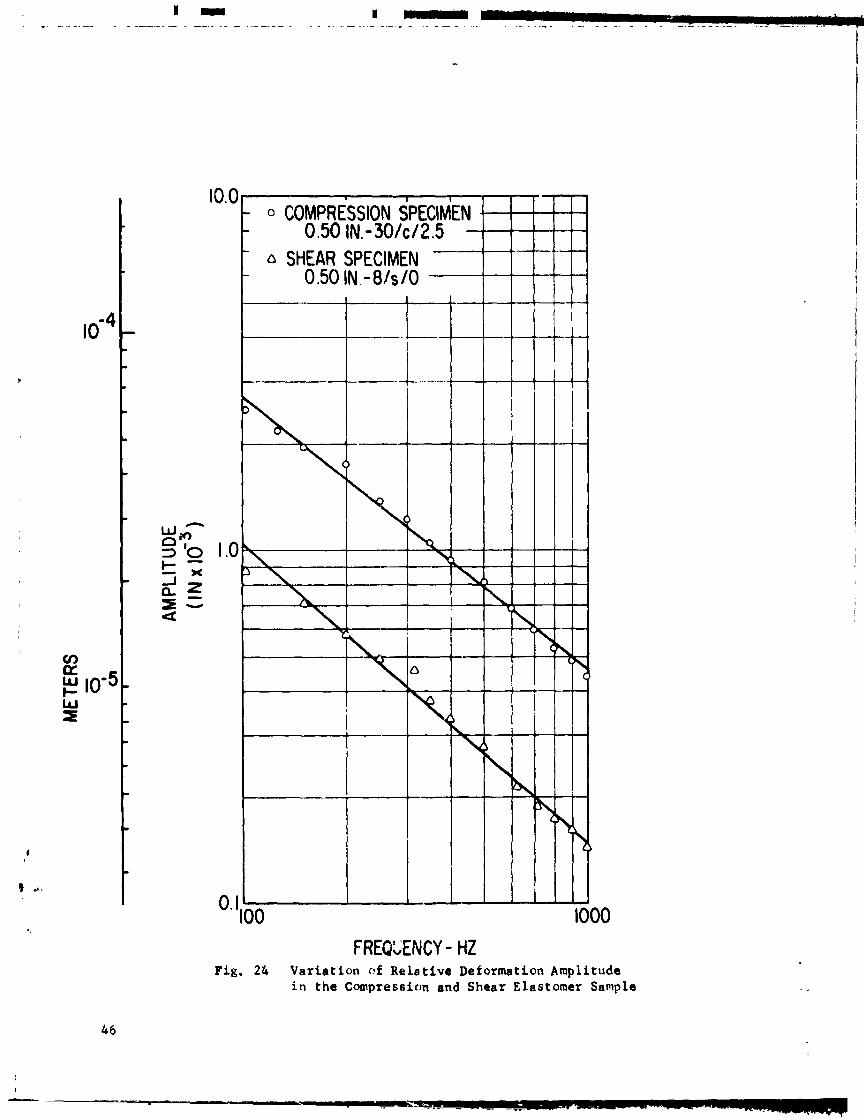
Fig. 24 Variation of Relative Deformation Amplitude i n the Compression and Shear Elastomer Sample
FREQUENCY <HZ>
F i g . 2 5 Complex Stiffnerr of the Shear Sample With Twenty Specimen8 a t no Preload

ELRSTWlER SPECIMEN 0.2XN-ZP MRTERIRI, = Pdgbutdimc LBRDINE = Shew PEIWER = .355 msttx PRELBRD = 2 . SPU B MBRN TEMP = 32. UP .C
FREQUENCY <HZ>
Fig. 26 Complex St i f fness of the Shear Sample With Twenty Specimens a t 2-112 Percent Preload

ELRSTBMER SPECIMEN O.ZZN-20. MFlTERXRL t Pdybutmdimnm LOROING = Shmr PEIUER = .35S r*mtks PRELORD = 5.000 11 MERN TEMP = 3s. PO mC
Fig. 27 Complex St i f fness of the Shear Sample With Twenty Specimens a t Five Percent Preload

ELRSTDMER SPECIMEN D.SIN-8. MRTERXRL = Polybutdinnr LDROING = Shew PDWER = ,365 wmtts PRELDRll = ,000 % MERN l'EMP = 32.00 'C
t $ 1 xz ' ' 'is ' ' .id+
FREBUENCY <HZ>
Fig. 28 Complex S t i f fnes s of the Shear Sample With Eight Specimens a t no Preload

~ i ~ . 29 cmnple~ S t i f fnes s of the Shear Sample With - dhf specimens 8 t 2-112 Percent Preload
p * . . 10
. , & . . . . . . - .
FREBUENCY <HZ)

LLRETOMER SPECIMEN O.STN-8. P'RTERIRL r Pmlgbutwdimnn LmF19ING =: Shmar PDWER = .3CS r * m t t = PRELmRX = S .000 R MERN TEMP = 3 1 . 0 0 0C
FREQUENCY <HZ)
Fig. 30 Complex Stiffness of the Shear Sample Jith Eight Specimens a t Five Percent Preload

ELRST(3MER SPECIMEN 1.OIN-+. MRTERIRL = Pdybutsdirnc LDRZING = Eih8.r PURER = .365 w s t t x PRELORD = .OD0 % MERN TEMP = 3Z. 00 'C
102
FREQUENCY <HZ>
Fig. 31 Complex S t i f fnes s of the Shear Sample With Four Specimens a t no Preload

Fig. 32 Complex S t i f f n e s s of the Shear Sample With Four Spec h e n s a t 2-1 12 Percent Preload

ELRSTaHER S P E C I M E N 1.0 IN-Y . M R T E R I A L = Pmlqbutmdianm L O R S I N G = 5hm.r PEwCR = ,365 math. P R E L O R l = 5 . POD MERN TEMP = 32 . OD .C
t I- 102 * .lib
FREQUENCY <HZ>
Fig . 33 Complex St i f fness of the Shear Sample With Four Specimens a t Five Percent Preload

I?. Summary and Corre l . a t i o n of Tes t Resul t
Within the exper imental range of f requenc ies t h e complex s t i f f n e s s shows a
f a i r l y mild frequency dependence f o r a l l compression and shear experiments.
Thus,for t h e purpose of e s t i m a t i n g specimen s t i f f n e s s , s i n g l e v a l u e s o f t h e cumplex
s t i f f n e s s may be s t a t e d f o r t h e e n t i r e frequency range wi thout any apprec iab le
e r r o r s . The second and f i f t h columns i n Table 1 g ive t h e mean v a l u e s over t h e
frequency I lge of t h s r e a l and imaginary s t i f f n e s s components f o r each sample
under each preload cond i t ion . The s i m i l a r i t y of these mean v a l u e s a t d i f f e r e n t pre-
loads i n d i c a t e s i n s e n s i t i v i t y t o p re load . The s i m i l a r i t y i n s t i f f n e s s among
elas tomer samples which have d i f f e r e n t shape f a c t o r s , bu t have been designed f o r
s i m i l a r s t i f f n e s s ( see des ign d e t a i l s i n Appendix A), i s a l s o f a i r l y s i m i l a r .
The weak frequency dependence of t h e d a t a may be summarized i n terms of t h e
c o e f f i c i e n t s of a power law c o r r e l a t i o n func t ion of t h e form
where Y i s one of t h e v a r i a b l e s of i n t e r e s t ( K l , K2, o r amplitude) o r
! Thus t h e d a t a f a l l s on a s t r a i g h t l i n e on log-log paper. The c o e f f i c i e n t s I
A and B f o r each d a t a s e t a r e computed by convent ional least squares regres-
s i o n a n a l y s i s and s u m a r i z e d i n t h e t h i r d , f o u r t h , s i x t h , and seventh columns
of Table 1. T h e s e c o r r e l a t i o n terms may be used t o determine t h e r e l a x a t i o n
modulus of t h e m a t e r i a l a t cons tan t temperature. Deformation amplitudes a r e
a l s o summarized i n Table 1, both i n terms of mean va lues over t h e frequency
range i n terms of the c o e f f i c i e ; + : of t h e same power c o r r e l a t i o n
func t ions . A s a demonstration, t h e power l o s s c o r r e l a t i o n t o t h e 1.27 cm
(0.5 in . ) high compression sample wi th 2.5 per Lent pre load i s superimposed on
t h e exper imental d a t a i n Figure 34,
A powerfyl technique f o r the c o r r e l a t i o n of e las tomer d a t a w i t h marked frequency
dependence is t o f i t mechanical v i s c o e l a s t i c models. For the p resen t d a t a ,
wi th i ts weak dependence on frequency, such techniques may no t be employed ve1,y
e f f i c i e n t l y . However, a s a demonstration of t h e approach, t h e behavior of t h e

TABLE 1 SUUYARY Ob ELASTONER TEST DATA -----------------I-____
MATERIAL P o l y b u t r d l r n r TEMPERPTURE 32 dog-C
CuIIPLE). ST IRNESS K K I + l a 2 I W l n CORRELLTION FORM Y A.OMECIAM
SPECIMEN DETAILS
*++++n+wm KZ rww+a+wa+ MEAN A B lb/ in
++.+*++nw NEAN in
AMPLITUDE ***mc* A B
COMPLEX STIFFNESS K K I + 1K2 N w / n CORRELATION FORM Y A 4 M W A n 0
SPECIMEN DET A l LS
*wawwn+a K 1 ~++c+w*+cn+. n*+n.c*-m K2 C.-W***+a *mw*** AMPLITUDE **nu- M EAN A 0 MEAN A 0 MEAN A B Now/m N w / m m
N.M. F r q u r n c y WEOA I n t h o c o r r r l r t l o n f u n c t i o n 1s I n r r d / s r c .
A sample consists of several specimens of elastomer arranged in a prescribed configuration.
"Specimen details" code given in the table is derived a8 fcllowr:
(1) Compression Sample: (Specimen thicknees) IN - No. of Specimen8/C/ ( X Preload).
The diameter of all compression rpecimenr ir 112 in.
(2) Shear Sample: (Specimen length) IN - No. of Specimenr/S/ (% Preload)
The specimen thickness and width normel to direction of deformation for all ahear 6pecimenr 7,
are respectively 118 in and 1.92 in. t,
k

ELRSTBMER 5PECIMEN f l . S U I N - - 3 0 . MFITERIRL = Polybutrdi=nc LI3RDING = Curnpr=xxlan PBWER = 1.055 w & t t PWELaRII = 2.500 % MERN TEMP = 32. 0U O C
Fig. 34 Typical Power Law Correlation

d a t a f o r t h e compression sati?ple having 30 c y l i n d r i c a l e las tomer specimens wi th
1.27 cm (0.5 i n . ) diameter and 1.27 cm (0.5 i n . ) t h i c k was c o r r e l a t e d wi th a
double Voigt model. The l e a s t squares technique descr ibed i n Appendix D was
used t o determine t h e v a r i o u s c o e f f i c i e n t s of t h e model. Since t h e s e l e c t e d
model is of t h e s e r i e s type, t h e a n a l y s i s is b e s t performed i n terms of complex
comylia,, .?s. The r e s u l t s a r e shown i n Figure 35. It is seen t h a t most of t h e
s t i f f n e s s is determined by t h e s t a t i c s p r i n g , and t h a t t h e s t i f f n e s s and damp!.ng
behavior of t h e model fo l lows reasonably c l o s e l y t h e mean l e v e l of t h e measured
s t i f f n e s s and damping va lues . Within t h i s o r d e r of agreement between exper i -
mental d a t a and model p r e d i c t i o n s , a l a r g e number of d i f f e r e n t types of models
may be shown t o f i t t h e da ta . However, t h e use of mean va lues , o r t h e s imple
c o r r e l a t i o n func t ions , i s adequate i n t h e p resen t case .
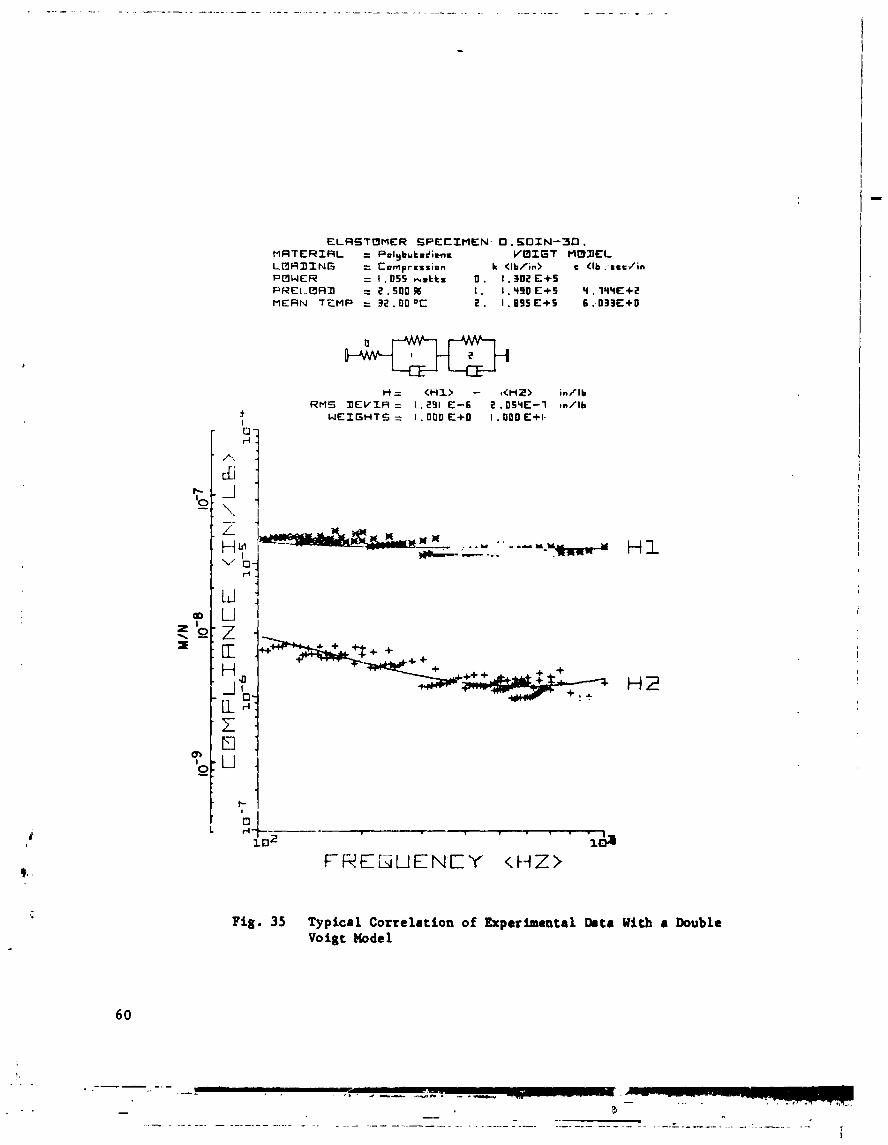
E L R S T B M E R SPECIMEN. 0.50IN-30. MRTERI RL = P o l Y b u t d i m s YUXGT W ~ C L LC3RIlING z Kornprcssion k <Ib/in> c (Ib . - a g e f i n PFIWER = I . 0 5 5 ~ d t r 0 . 1.302 E+S PRELBRIY = 2 . 5 0 0 8 1 . I . '490 E + 5 q . 14'4E+2 M E R N T E M P = 3 2 . 0 0 "C 2 . 1 . a95 E+S 6 :033E+O
H = <HI> - #<HZ> i n f l b R M S XIEVIR = 1 .291 E-6 2 .0S'4E-1 m/ lb
W E I G H T S = 1 .OD0 E + O I , 000 E+I.
H i ?
F i g . 35 Typical Correlation of Experimental Data With 8 Double Voigt Hodel

V . DISCUSSION ----
Cxamination of the exper imenta l d a t a i n d i c a t e s t h a t , i f the t h e n a ! s t a t e of the
e las tomer is held c o n s t a n t , t h e complex s t i f f n e s s .)f the m a t e r i a l is r e l a t i v e l y
i n s e n s i t i v e t o the v s r i a t i o n of frequcncy. I t is expected t h a t , i f K2 o r
c w is a cons tan t , then f o r cons tan t power d i s s i p a t i o n i n the e ias tomer , t h e e r e l a t i v e amplitude must a l s o be frequency independent. However, i n a l l the
experiments, the power measurement IJ 7 pr imar i ly used t o e s t a b l i s h an upper
bound on the temperature g r a d i e n t i n t h e e las tomet and, i n f a c t , the measured
power i s a sum of e las tcmer d i s s i p a t i o n and the d i s s i p a t i o n i n the lower
cy l inder . I t may be shown [8] t h a t , i f t h e dampirag c o e f f i c i e n t of t h e c y l i n d e r
is a c o n s t a n t , aad i f t h e t a t a l work done pe r cyc le is dhen the r e l a t l v e
amvlitude is x then r '
The above equat ion may be rearranged a s
2 Win x S --- .5 2x power
r K2 + cllu u(K2 + cpG
Since t h e i r a g i n a r y p a r t of t h e complex s t i f f n e s s K2 = cew was found t o be f a i r l y
i n s e n s i t i v e tn the frequency, t h e amplitude w i l l dec rease a s a func t ion of
frequency a t c o n s t m t power, a s found i n a l l the experiments.
The u n c e r t a i n t i e s i n the computed e las tomer p r o p e r t i e s w i l l be g e n e r a l l y smal l
when the nominal s t i f f n e s s and damping va lues of t h e t e s c samples a r e substan-
t i a l l y l a r g e r than those of the va r ious elements o f the t e s t r i g , a s shown by
Equations (B5) and Table B 1 . A comparison of the e las tomer c o e f f i c i e n t s shown
i n Table 1 with those of t h e t e s t r i g components c l e a r l y shows t h a t the s t i f f -
n e s s of any of t h e test r i g elements is indeed smal l compared t o t h e e las tomer
s t i f f n e s s and, t h e r e f o r e , any e r r o r s w i l l no t s i g n i f i c a n t l y a f f e c t t h e computed
s t i f f n e s s o ? the e las tomer . In c a s e of the damping c o e f f i c i e n t , however,
Equations (B5) need f u r t h e r d i scuss ion . I f t h e proper va lues of c and c 1 2 from I a h l e B 1 . r e s u b s t i t u t e d i n t h e second of t h e Equations (B5), t h e e1astomc.-
damping e f f i c i * n t may be w r i t t e n a s

C u k - mu a (coo$ - a) + a s i n ) (1 - 3)
Cn. + CP mu
Since t h e experimental d a t a was c o l l e c t e d a t cond i t ions c l o s e t o resonance f where t r a n s m i s s i b i l i t y a > > 1, and t h e r e s i d u a l s t i f f n e s s e s a r e smal l compared
t o t h e elastomer s t i f f n e s s , t h e above equat iou may be approximated a s i
mw s i n c z3 -- - (cR -!- Cu) e o
Thus, an e r r o r i n t h e es t imat ion of c Q and c w i l l have an a d d i t i v e e r r o r i n u
c o r a l i n e a r irequency dependent e r r o r i n K2. e
I t is now c l e a r t h a t , i f t h e nominal va lue of elastomer damping is s u b s t a n t i a l l y
l a r g e i n comparisorl wi th t h e sum of t h e cy l inder damping i a e f f i c i e n t s , ( cg + c U ) ,
then any smal l u n c e r t a i n t i e s i n t h e e s t i m a t i o n of c Q + c w i l l no t appreciably u
e f f e c t the elastomer damping c o e f f i c i e n t s c . I f t h e r e s u l t s summarized i n e Table 1 a r e reexamined, i t is seen t h a t K2 = cew is f a i r i y i n s e n s i t i v e t o
frequency. The elastomer dampiug, t h e r e f o r e , decreases a s a func t ion of f r e -
quency and t h e g r e a t e s t s i g n i f i c a n c e of e r r o r s i n c y l i n d e r damping a r e t o be
expected a t t h e h i g h e s t f requenc ies . The lowest va lues of K2 f o r t h e compression 6 3
and shear sampiss from Table 1 a r e 1 .462 x 10 ~ / m (8.347 x 10 l b / i n . ) and 6 4 2.737 x 10 N / m (1.563 x 10 l b / i n . ) r e s p e c t i v e l y . A t a frequency of 1000 Hz
2 these va lues r e s u l t i n e las tomer cliunping c o e f f i c i e n t s , ce, of about 2.33 x 10 N-sec/m
2 and 4.36 x 10 N-seclm (1.33 and 2.49 lb-sec!in) r e s p e c t i v e l y f o r t h e compression
L and shear samples. The t o t a l r e s i d u a l damping (ce + c ) is about 1.05 x 10 N-seclm
u (0.6 lb - sec l in . ) . Thus, u n c e r t a i n t i e s i n t h e es t imated r e s i d u a l damping may
become s i g n i f i c a n t i n t h e extreme high frequency reg ion . Under such c o n d i t i o n s ,
methods both t o reduce and more a c c u r a t e l y dete-mine t h e s e r e s i d u a l damping
should be considered i n r e l a t i o n t o f u t u r e t e s t r i g modi f i ca t ions .
62
The e f f e c t s of p re loads , i f any, on t h e dynamic response of t h e e las tomer a r e
not c l e a r l y n o t i c e a b l e w i t h i n the p resen t d a t a . O f course t h e maximum nominal
s t r a i n due t o t h e pre load was no more than 5 percen t . A t l e a s t f o r t h e com-
p ress ion t e s t s it might be expected t h a t an i n c r e a s e i n p re load r e s u l t s i r k
increased s t i f f n e s s . This is indeed observed t o some degree a s shown i n
Table 1, howevor, t h e p r e s e n t d a t a does no t warrant such a genera l conclus ion.
I n f a c t , f o r t h e s h e a r samples a ' r e v e r s e d e f f e c t i s c o n s i s t e n t l y observed.
Since v i b r a t i o n amplitude was not v a r i e d as an independent parameter, no con-
c lus ions can be drawn a s t o t h e i n f l u e n c e of amplitude. It is , ho- ever, a
premise of t h i s work t h a t , a s long a s t h e temperature of t h e e las tomer remains
cons tan t , t h e in f luence of amplitude w i l l be - m a l l . I n o t h e r words dynamic
c h a r a c t e r i s t i c s measured under cond i t ions which both l t m i t t h e temperature r i s e
and c o n t r o l t h e environmental temperature should be t h e same whether t h e amp-
l i t u d e is cons tan t o r t h e power d i s s i p a t e d i s cons tan t . Fur the r i n v e s t i g a t i o n
of the in f luence of amplitude w i l l be necessary t o conso l ida te t h i s p o i n t .
Re la t ions bezween t h e complex s t i f f n e s s and some b a s i c phys ica l p r o p e r t i e s
such as r e l a x a t i o n modulus could be mathematically expressed [ 9 ] i n terms 9f
Four ie r r e l l t i o n s . However, a much more r igorous a n a l y s i s of t h e exper imental
d a t a w i l l be requ i red i n o r d a r t o o b t a i n t h e c o r r e l a t i o n f u u c t i o n s desc r ib ing
t h e complex s t i f f n e s s i n t h e e n t i r e frequency range of zero t o i n f i - n i t y . Th i s
c l e a r l y war ran t s more experiments and d a t a a n a l y s i s . It is a n t i c i p a t e d t h a t
f u t u r e i n v e s t i g a t i o n s w i l l accomplish t h i s o b j e c t i v e .
A s descr ibed i n Appendix A, t h e t e s t samples were designed wi th t h e primary
o b j e c t i v e of i n v e s t i g a t i n g t h e e ias tomer behavior i n t h e frequency ranpe of
100 t o 1000 Hz wi th va ry ing shape f a c t o r s . This o b j e c t i v e has c l e a r l y been
achieved i n the p resen t i n v e s t i g a t i o n . Furthermore, t h e r e s u l t s summarized
i n Table 1 show t h a t v a r i a t i o n s i n the dynamic s t i f f n e s s w i t h i n t h e t h r e e
compression o r t h e t h r e e shear samples a r e smal l . However, t h e dynamic
s t i f f n e s s oE the shear samples is about twice t h a t o? t h e compression samples.
I f t h e s t a t i c s t i f f n e s s r a t i o of s h e a r t o compression samples is computed

from the simple r e l a t i o n s given i n Appendix A, i t is found t h a t t h i s r a t i o
v a r i e s from 1 . 8 t o 2.27. Thus, t h e observed d i f f e r e n c e i n dynamic s t i f f n e s s
of t h e s h e a r and compression samples is p r i m a r i l y due t o t h e d i f f e r e n c e s i n
t h e s t a t i c s t i f f n e s s f o r t h e s e l e c t e d geometr ical conf igura t ions . The
a b s o l u t e va lues of t h e dynamic s t i f f n e s s , a s might be expected, a r e s u b s t a n t i a l l y
l a r g e r than those of t h e s t a t i c s t i f f n e s s (as def ined i n Appendix A ) . This
is i n agreement w i t h most of t h e publ ished i n v e s t i g a t i o n s , e .g . , Meyer and
Sommer [5] o r C a r d i l l o [ 4 ] . Althcv~gh no g e n e r a l conclus ion wi th regard t o
t h e in f luence of shape f a c t o r s on t h e dynamic p r o p e r t i e s of an e las tomer
sample may be p r e s e n t l y j u s t l f i e d , i t is very l i k e l y t h a t shape f a c t o r s
in f luence t h e s t a t i c s t i f f n e s s as desc r ibed i n Appendix A. In o t h e r words,
samples wi th varying shape f a c t o r s bu t similar s t a t i c s t i f f n e s s w i l l have
c l o s e l y i d e n t i c a l dynamic s t i f f n e s s a t any frequency, as demonstrated i n
t h i s i n v e s t i g a t i o n .

VI. CONCLUSIONS
A BTR e las tomer (polybutadiene) has been t e s t e d under shea r and compressive 0
loading, a t 32 C , f o r cons tan t power d i s s i p a t i o n , over t h e frequency range
100 t o 1000 Hz. Displacement ampl i tudes covered 2.54 x t o 7.6 x 1 0 - ~ m
( s t r a i n s of 0.0008 t o 0 .024 ) . From t h e t e s t r e s u l t s , f o r t h e s e c o n d i t i o n s ,
t h e fo l lowing conclus ions may be drawn.
The procedure f o r moni tor ing and c o n t r o l l i n g power d i s s i p a t i o n and
environmental temperature was s u c c e s s f u l i n a l lowing measurement of 0 sample p r o p e r t i e s a t a temperacure cons tan t w i t h + 1 C. -
The dynamic p r o p e r t i e s i n terms of complex s t i f f n e s s a r e only weakly
in f luenced by f requency.
A s imple power law r e l a t i o n s h i p may be used t o r e p r e s e n t the measured
frequency dependence.
The dynamic p r o p e r t i e s i n terms of ccmplex s t i f f n e s s a r e no t s i g n i f i c a n t l y
in f luenced by pre load.
The use of publ ished shape f a c t o r s t o les ign d i f f e r e n t shaped e las tomer
samples f o r e q u a l s t i f f n e s s r e s u l t e d 4 n samples whose dynamic s t i f f n e s s
and damping values were s i m i l a r .

V I I , RECOMMENDATIONS FOR FWTURE RESEARCH
On t h e b a s i s o f t h e work repor ted and t h e o v e r a l l o b j e c t i v e s of t h e Elastomer
Technology Program, t h e fo l lowing recommcndations f o r f u t u r e i n v e s t i g a t i o n s
a r e made.
1. U t i l i z e t h e repor ted s t i f f n e s s and damping p r o p e r t i e s f o r e las tomer
specimens of p a r t i c u l a r geometry t o determine g e n e r a l l y a p p l i c a b l e
m a t e r i a l p r o p e r t i e s .
2 . Apply t h e s e m a t e r i a l p r o p e r t i e s i n t h e p r e d i c t i o n of s t i f f n e s s and
damping proper tFes of t h e same m a t e r i a l , bu t wi th d i f f e r e n t geometries.
3. I n p a r t i c u l a r , p r e d i c t t h e s t i f f n e s s and damping of a c y l i n d r i c a l
c a r t r i d g e (such as might b e used t o f l e x i b l y support a r o l l i n g element
b ~ a r i n g ) . 4 . Tes t a c y l i n d r i c a l c a r t r i d g e t o determine i t s dynamic s t i f f n e s s and
damping p r o p e r t i e s and compare these measurements wi th corresponding
p r e d i c t i o n s .
5. Design a c y l i n d r i c a l c a r t r i d g e damper f o r c o n t r o l l i n g v i b r a t i o n of
a s p e c i f i c ro tor-bear ing system and t e s t t h e performance of t h e
c a r t r i d g e i n t h i s a p p l i c a t i o n .
6. By f u r t h e r control led- temperature t e s t s on e las tomer specimens, de te r -
mine what in f luence temperature has on +he m a t e r i a l p r o p e r t i e s of
t h e BTR elas tomer t e s t e d i n t h e p r e s e n t l v repor ted i w e s t i g a t i o n .
7. Develop a model f o r p r e d i c t i o n of e las tomer behavior which accounts
f o r temperature dependence o f m a t e r i a l p r o p e r t i e s .
8. A s i d e n t i f i e d i n t h i s r e p o r t , u n c e r t a i n t i e s i n t h e damping of t h e
lower cy l inder could be s i g n i f i c a n t a t t h e h igher t e s t f requenc ies .
Reduction of t h i s u n c e r t a i n t y should be f a c t o r e d i n t o f u t u r e r i g
modi f i ca t ions by such means as use of a m e t a l l i c f o i l t o ,+lace
t h e p resen t rubber s e a l s .

APPENDIX A
TEST SAMPLE DESIGN
The frequency range over which t h e e las tomer samples a r e requ i red t o be
t e s t e d was a dominating f a c t o r i n t h e des ign of t h e samples s i n c e accept-
a b l e d a t a cannot be c o l l e c t e d a t f requenc ies f a r from t h e resonance. Th is
may be seen by examination of a t y p i c a l response p l o t f o r a Sase -exc i t a t ion
system, a s descr ibed i n Appendix B. For f requenc ies g r e a t e r than t h r e e t imes t h e
n a t u r a l frequency, t h e system t r a n s m i s s i b i l i t y approaches 1 .0 and, depending
on t h e amount of damping i n t h e system, t h e phase angle between t h e inpu t and
output displacements tends t o 130 degrees . Based on t h e s e f a c t s , i t was de-
cided t h a t no d a t a should be c o l l e c t e d a t f requenc ies h igher t h a n t h r e e times t h e
n a t u r a l frequency. Since from a p r a c t i c a l s t andpoin t t h e upper bound on t h e
v i b r a t i o n frequency is on t h e o rder of 1000 Hz, it was decided t h a t t h e
t e s t set-up should provide a resonance frequency of a t l e a s t 350 Hz wi th +he
smal les t mass, which was approximately 0.9 Kg (2 l b . ) i n t h e p r e s e n t i n v e s t i -
ga t ion . These c o n s t r a i n t s provided a s t i f f n e s s which t h e t e s t sample muit
have i n o rder t o meet t h e experimental requirements . Both t h e compression
and shear samples were designed based on t h i s c r i t e r i o n .
1. C s e s s i o n Sample - The compression sample is a n ensemble of s e v e r a l c y l i n d r i c a l e las tomer spec i -
mens, as descr ibed i n Sec t ion 111. The s i z e and number of t h e s e specimens was
determined by t h e above design x i t e r i o n . I f d is the diameter and "a" is
t h e h e i g h t of any c y l i n d r i c a l elastomer specimen (as shown i n F igure Al) ,
and i f a compressive load is app l ied along t h e a x i s of
nominal compressive s t r e s s is given by Payne and S c o t t
where G = Shear modulus o f t h e material
X = Rat io of s t r a i n e d t o uns t ra ined l e n g t h
:; = Shape f a c t o r
t h e specimen, then t h e
[ 101


The s t r a i n , c, i s simply ( 1 - A ) and t h e r e f o r e Equation (Al) may a l s o b e
w r i t t e n a s
Since f o r most of t h e experiments i n t h e p r e s e n t i n v e s t i g a t i o n t h e smal l
s t r a i n assumption w i l l b e v a l i d , Equation (A2) may be expanded i n powers of
E, Hence
I f h igher o r d e r terms a r e neg1ec:ed i n t h e above equa t ion , then
It should be noted t h a t Equation (A4) is b a s i c a l l y ~ o o k e ' s Law, s i n c e t h e
Young's modulus f o r most rubbers , E = 3G.
The s t a t i c s t i f f n e s s of t h e e las tomer sample is de f ined by load pe r u n i t
d e f l e c t i o n , i . e . ,
where A i s t h e c r o s s s x t i o n a l a r e a of each e las tomer specimen and n is t h e
number of specimens i n t h e ensemble.
Combining (A4) and (A5) r e s u l t s i n
Equation (A6) g i v e s t h e s t a t i c s t i f f n e s s . However, i n dynamic t e s t i n g t h e
n a t u r a l frequency of t h e system w i l l be p r i m a r i l y determined by t h e dynamic
s t i f f n e s s . Meyer and Sommer [5] have produced t e s t r e s u l t s comparing t h e
s t a t i c and dynamic s t i f f n e s s e s of s e v e r a l Polybutadiene composit ions, For
a composition having a Shore P. hardness of 71, i t is shown t h a t t h e dynamic
s t i f f n e s s is t h r e e t imes l a r g e r than the s t a t i c s t i f f n e s s . Since no

composit ional d e t a i l s on t h e m a t e r i a l used i n t h i s i n v e s t i g a t i o n a r e a v a i l a b l e
except t h a t i t has a Shore A hardness of 70, t h e above f i n d i n g s i s used t o I
compute t h e dynamic s t i f f n e s s , k,
The n a t u r a l frequency o f o r a mass m is given by n
where the c r o s s s e c t i o n a l a r e a is represen ted i n terms of t h e diameter d.
The minimum mass f o r t h e p resen t system is 0.9 Kg (2 l b ) and t h e desired- w n ?
is 350 Hz. Also, a s a p r a c t i c a l value , 1.27 cm (0.5 i n . ) may be a r b i t r a r i l y 1 - s e l e c t e d f o r t h e diameter . S u b s t i t u t i o n of t h e s e va lues i n Equation (A8)
- 7
r e s u l t s i n
2 Note t h a t t h e shear modulus G is i n l b / i n and t h e t -e ight of t h e specimen "a"
is i n inches i n Equation (A9).
T
It is now on ly necessary t o e s t i m a t e t h e shear modulus and determine t h e i shape f a c t o r S. Gent [ l l ] has shown t n approximate i n t e r - r e l a t i o n s h i p
between Shore A hardness , s, and t h e Young's modulus of e l a s t i c i t y , E.
7 0 Assuming G = E/3 t h i s r e l a t i o n s h i p is given by

Equation (A10) is p l o t t e d i n Figure A2, t aken from Gent. Using t h i e r e l a -
t ionsh ip , t h e shear modulus f o r a 70 durometer o r Shore A hardness is e s t i m ~ t e d 6 2 2
a s 1.86 x 1 0 N/m (270 l b / i n ). S u b s t i t u t i o n of t h i s i n Equation (A9) g i v e s
The shape f a c t o r , S, i s def ined by Payne and S c o t t [ l o ] by a func t ion
6 2 where B i s a cons tan t which depends on t h e shear modulus. For G = 1.86 x 10 N/m 2
(270 l b / i n ), B is es t imated a s 0.063. Thus,
With the o b j e c t i v e of s tudying t h e e f f e c t s of shape f a c t o r on t h e dynamic
p r o p e r t i e s , t h r e e d i f f e r e n t th icknesses of 12.7, 6.35, and 3.675 mm (0.5,
0.25, and 0.125 i n . ) were s e l e c t e d t o g i v e shape f a c t o r s of approximately 1,
1 .25 and 2. For these th icknesses and t h e shape f a c t o r s , t h e numher of specimens
requ i red i n each ensemble were determined t o be r e s p e c t i v e l y 25, 10, and 3 f o r
t h e t h r e e samples. For t h e f i r s t sanp ie , t h e number n was i n f a c t changed t o
30 p r imar i ly because of p r a t i c a l reasons f o r geometr ical symmetry of t h e sample.
I n any case t h i s w i l l i n c r e a s e t h e n a t u r a l frequency and is , t h e r e f o r e , p e r f e c t l y
accep tab le .
2. Shear Sample
The des ign of t h e s h e a r samples is somewhat s impler than t h a t of t h e compression
samples s i n c e no shape f a c t o r s a r e a s s o c i a t e d wi th s h e a r deformation. However,
a s shown i n Figure A 3 , when a p i e c e of rubber i s shear - s t ra ined i n a conven-
t i o n a l manner both shear and bending occur. It has been shown [ l o ] t h a t t h e
app l ied shear f o r c e , F, r e s u l t s i n a d e f l e c t i o n , 6 , given by the express ion

Pig. A2 Relationship Between Shore Hardneao and Shear Modu lue

Fig. A3 Schematic of the Shear Specimen
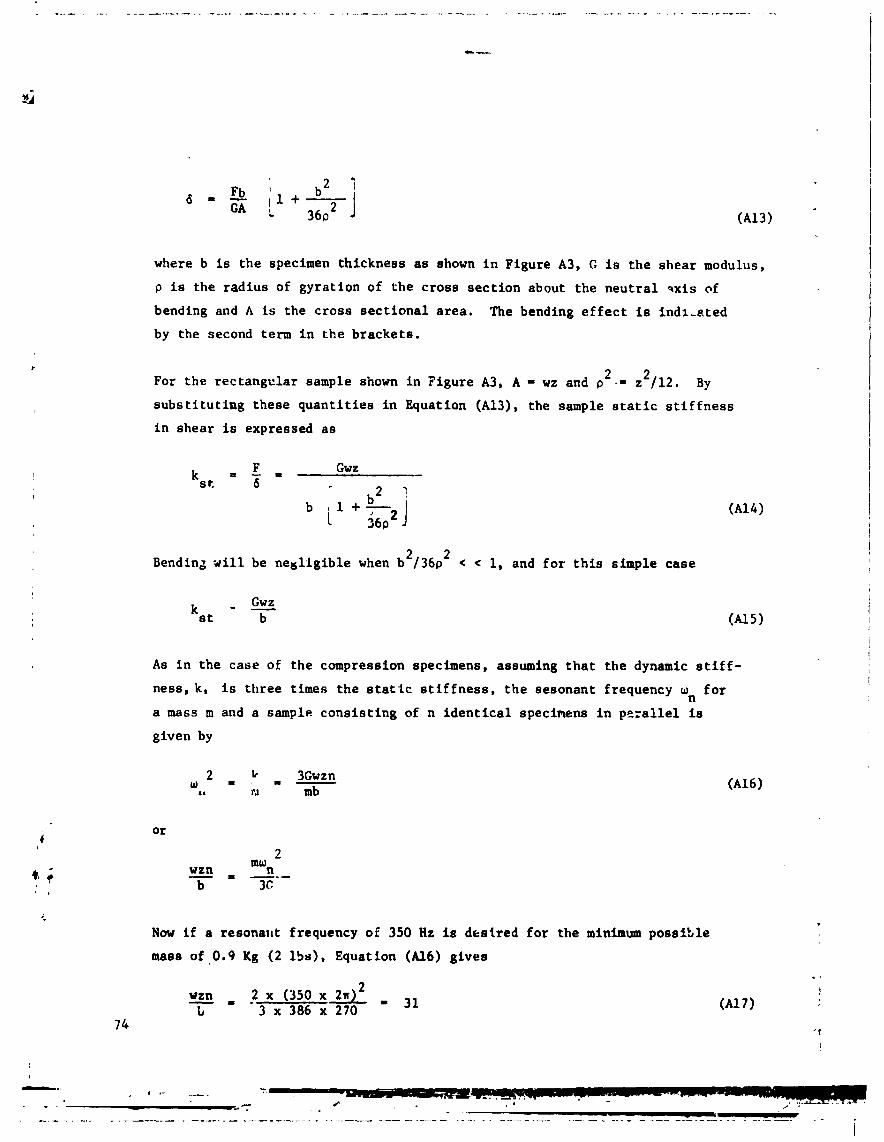
6
where
P is
b is t h e specimen th ickness as shown i n Figure A3, G l a t h e s h e a r modulus,
the r a d i u s of gyra t ion of t h e c r o s s s e c t i o n about t h e n e u t r a l -x i s of
bending and A is the c r o s s s e c t i o n a l a r e a . The bending e f f e c t is i n d i - a t e d
by the second term i n t h e b racke t s .
2 For t h e r e c t a n g c l a r sample shown i n Figure A3, A = wz end p 2 - - z 112. By
subs t i tu t ip ig these q u a n t i t i e s i n Equation (Al3), the sample s t a t i c s t i f f n e s s
i n shear is expressed a s
Bendin2 xi11 be n e g l i g i b l e when bL/36pL < c 1, and f o r t h i s simple case
Gwz - - b
A s i n t h e c a s e of t h e compression specimens, assuming t h a t t h e dynamic s t i f f - I
n e s s , k , i s t h r e e times t h e s t a t i c s t i f f n e s s , t h e sesonant frequency w f o r i
n a mass m and a sample. c o n s i s t i n g of n i d e n t i c a l specimens i n p ~ r a l l e l is
given by
Now i f a resonant frequency of 350 Hz is d e s i r e d f o r the minimum p o s s i b l e
mass of 0.9 Kg (2 l b s ) , Equation (Al6) g i v e s
wzn 2 x (350 x& 31 I -
L 3 x 386 x 270

I f t h e a c t u a i value cf wzn!b i s greater than 31. ihen the tesonant frequency
w i l l be somewhat g r e a t e r than 350 Hz (as given by Squation Al6). Such a
des ign w i l l be p e r f c c t l y accep tab le as long as .e lowest. d e s i r e d resonant
frequency is a t t a i n a b ~ e wi th t h e maximum a v a i ? ~ h l e masa. With t h e s e des ign p,uide-
l i n e s , i t was decided t h a t a s a t i s f a c t o r y shear sample may c o n s i s t of f o u r
e las tomer specimens wi th t h e f o l l a v i n g dimensions
Sample No. 1: n = 4; w = 5.08 cmi2 i n . ) ; z = 2.54 cm(l.0 i n . )
It may be noted t h a t the above conf igura t ion g ives wzn/b = 64 and t h e r e f o r e
the resonant frequency corresponding t b t h e mass ti5 2 l b w i l l b e 35C 64/31
o r 502 Hz. I f t h e ].owest d e s i r e d frequency is 100 Hz, then t h e re: ' r ed mass
w i l l b e approximately 51 l h , which i s w e l l w i t h i n t h e exper imental l i m i t a t i o n s
on maximummass. Also, bending e f f e c t s have been neqlected I n t h e above 2
design, which is q u i t e j u r t i f i a 5 l e s i n c e t h e bending term (b /36p2) i n t h i s
case is 0.0052, which is indeed q u i t e smal l compared t o u n i t y .
I n o rder t o a l low f o r some bending e f f e c t s t : t h i n the exper imental l i m i t a t i o n s .
two a d d i t i o n a l conf igura t ions were s e l e c t e d
f o r a l l th ree samples t o meet t h e s t i f f n e s s
f i g u r a t i o n s a r e
Sample No. 2: n = 8; w = 5.08 cm (2.0
z = 1.27 cm (0.5 i n . )
Sample No. 3; n = 20; w = 5.08 cm(2.0
z = O.'08 :m (0.2 i n . )
2 2 The magnitude of the bending term (b /36p )
f o r Samples No. 2 and No. 3, r e s p e c t i v e l y .
v a r i a t i o n i n t h e p o s s i b l e bending e f f e c t s .
such t h a t (wznlb) is h e l d cons tan t
requirements. The s e l e c t e d con-
i n . ) ; b = 0.318 cm (0.125 in . )
i n . ) ; t 0.31b cm (0.125 i n . )
Ls es t imated t o be 0.0208 and
Thus t h e shear specimens have

APPENDIX B
DYNAMIC CHARAClZRISTICS OF TEST RIG COMPONENTS
A. Guide Bearings -- The two guide b e a r i n g s , c o n s i s t i n g of spoke assembl ies , a r e i d e n t i c a l wi th re-
gard t o t h e i r geometry and dynamfc response. Therefore , t h e experiment
d iscussed below eppl i e s t o both spoke assembl ies .
Since t h e only mode of d i s s i p a t i o n i n t h e spoke assembl ies is i ? , t e r n a l f r i c t i o n
i n the meta l an+ a t t h e j o i n t s , t h e a s s o c i a t e d damping w i l l b e n e g i i g i b l y
small . It was found tha; w i t h i n t h e d e s i r e d p r e c i s i o n on t h e t e s t r i g response ,
t h e damping of t h e spokes may be neg lec ted . I n o r d e r t o measure t h e s t i f f n e s s
a simple experiment was performed. The o u t s i d e r i n g of t h e spoke assembly was
clamped on the shaker t a b l e , a s shown schemat ica l ly i n F igure B1. The n a t u r a l
frequency of t h e system was measured, and k. ,wing t h e mass of t h e hub* ( s e e Sec-
t i o n 111) , t h e s t i f f n e s s of t h e spokes was computed i n a s t r a i g h t forward manner.
The duced d y ~ a m i c model and t h e system c h s r a c t e r i s t i c s a r e a l s o o u t l i n e d i n
Figur- B1. It was fclund t h z t t h e s t i f f n e s s of each spoke assembly, ks, is 4 3.67 x 10 N/m (210 l b l i n ) .
B. Mechanical S p r i n g
Any damping i n t h e mechanical s p r i n g is cnce aga in n e g l i g i b l e . However, due
t o th - s i z e of t h e s p r i n g ( s e e Figure 1 6 ) , i ts e q u i v a l e n t mass must be
determined exper imenta l ly . The s p r i n g was clamped on t h e shaker t a b l e and
t h e n a t u r a l frequency w of t h e system was measules. The dynamic model, i n m
t h i s case , w i l l be s i m i l a r t c t h e one sh-wn i n Figure B 1 . I n t h e second exper i -
ment, a smal l mass, A was a t t a c h e d t o t h e top of t h e s p r i n g and t h e n a t u r a l f r e - IT1
quency w ' was aga in measured. From t h e s e measurements, t h e computation of equi- m
v a l e n t s p r i n g mass, m , and t h e s t i f f n e s s , k is s t r a i g h t f o r w a r d . m m
and w ' = m m m m


It w a s found t h a t t h e equ iva len t mass mm = 0.877 kg (1.93 l b s ) and the
corresponding s t i f f n e s s k = 2.96 x 10⁵ N/m (1695 l b l i n ) . m
C. Lower Cyl inder wi th Free P i s t 2
It is p o s s i b l e to mount t h e lower c y l i n d e r w i t h t h e mechanical s p r i n g
d i r e c t l y on t h e shaker t a b l e and o b t a i n a base e x c i t a t i o n system, shown
schemat ica l ly i n Figure B2. The a n a l y s i s f o r such a system is q u i t e
s imple 1121, and i f t h e ou tpu t motion is measured a s a func t ion of t h e
inpu t t a b l e e x c i t a t i o n , t h e s t i f f n e s s and damping of t h e c y l i n d e r can be
c a l c u l a t e d . It is assumed t h a t t h e s t i f f n e s s of t h e cy l inder i s a func t ion
of t h e a i r p r e s s u r e only.
The a n a l y s i s f o r t h e base e x c i t a t i o n system of F igure B2 is o u t l i n e d i n -
Appendix C , and i t is shown t h a t i f t h e system t r a n s m i s s i b i l i t y , a (def ined
by t h e r a t i o of output t o inpu t amplitude) and t h e phase ang le 4 between
t h e output and inpu t a r e measured, t h e va lues s t i f f n e s s kl and cl may be
computed. Within t h e scope of t h e p r e s e n t i n v e s t i g a t i o n , i t i s conserva-
t i v e l y assumed t h a t k and c a r e frequency independent, a s d i scussed i n t h e 1 1
Discussion s e c t i o n . Under t h i s assumption, it is shown i n Appendix C t h a t
only the measurements of a and t h e frequency a t resonance a r e necessa ry i n
o r d e r t o determine k and c I n f a c t , t h e phase ang le $ could be computed 1 1'
by knowing kl and c from t h e measurement of a a t resonance, and t h e reso- 1 nant frequency. Thus, t h e resonant f r e q u e ~ c y and va lues c ~ f a were measured
a s a func t ion of t h e a i r p r e s s u r e t n t h e c y l i n d e r . The phase ang le 4 a t
res,.nance was a l s ~ measured f o r t h e purpose of comparing I t w i t h t h e
computed value. The ampl i tudes were low enough such t h a t f l u c t u a t i o n s 3f
p r e s s u r e i n t h e c y l i n d e r were l e s s than 1% under t h e a d i a b a t i c assumption
f o r t h e h i g h e s t amplitudes imposed.


With t h e above measurements and t h e a n a l y s i s desc r ibed i n Appendix C , kl' and JI were computed, and f i n a l l y , us ing the r e l a t i o n s shown i n Figure B 2 , k,
and c were determined. The r e s u l t s a r e shown a s a func t ion of a i r p r e s s u r e 11
i n t h e c y l i n d e r i n Figure B3. The compufed and measured phase ang les a t
resonance a r e a l s o compared i n t h i s p l o t , where t h e s o l i d curve r e p r e s e n t s
t h e computed r e s u l t s and t h e exper imenta l daca is shown by the d i s c r e t e
po in t s . It is seen t h a t w i t h i n t h e p r e c i s i o n l i m i t s of phase ang le measure-
ment t h e agreement i s f a i r l y good. The c y l i n d e r s t i f f n e s s is very w e l l
approximated by a l i n e a r func t ion of p t e s s u r e and t h e v a r i a t i o n i n t h e
damping is r a t h e r smal l . However, i t should be noted t h a t the motion of
t h e p i s t o n is f r e e i n t h i s experiment whi le i t i s cons t ra ined i n t h e assembled
t e s t r i g . Such a c o n s t r a i n t may i n f l u e n c e t h e c y l i n d e r c h a r a c t e r i s t i c s ,
s i n c e i t c e r t a i n l y i n f l u e n c e s al ignment of t h e s e a l s .
I n o r d e r t o put some c o n s t r a i n t on t h e p i s t o n motion, t h e lower guide bea r ing
was clamped t o t h e p i s t o n and t h e experiment was repeated. The a n a l y s i s of
t h i s s e t u p , and of a s i m t l a r s e t u p f o r t h e upper c y l i n d e r , a r e s p e c i a l c a s e s
of t h e g e n e r a l response of t h e t e s t r i g and hence t h i s response i s formulated
be fo re d i s c u s s i n g t h e above two s p e c i a l cases .
L. General ized Tes t Rig Response
The dynamic model of t h e t e s t r i g shown i n Figure 15 is r e d u c i b l e t o the
form shown i n Figure B4 by combining t h e va r ious elements appear ing i n
p a r a l l e l . Now t h e equat ion of motion of t h e resonant mass w i l l be h i e v e n d e n t
of t h e shaker a i r s p r i n g and i t may
I t i s found exper imenta l ly t h a t
of t h e above edua t ion of motion
be w r i t t e n a s
c ; + k (X -X ) + k2x2 = 0 (82) 2 2 1 2 1
motions a r e s i n u s o i d a l and hence s o l u t i o n
becomes s t r a i g h t forward
= A1 s i n w t
= A2 s i n (wt - 4 )


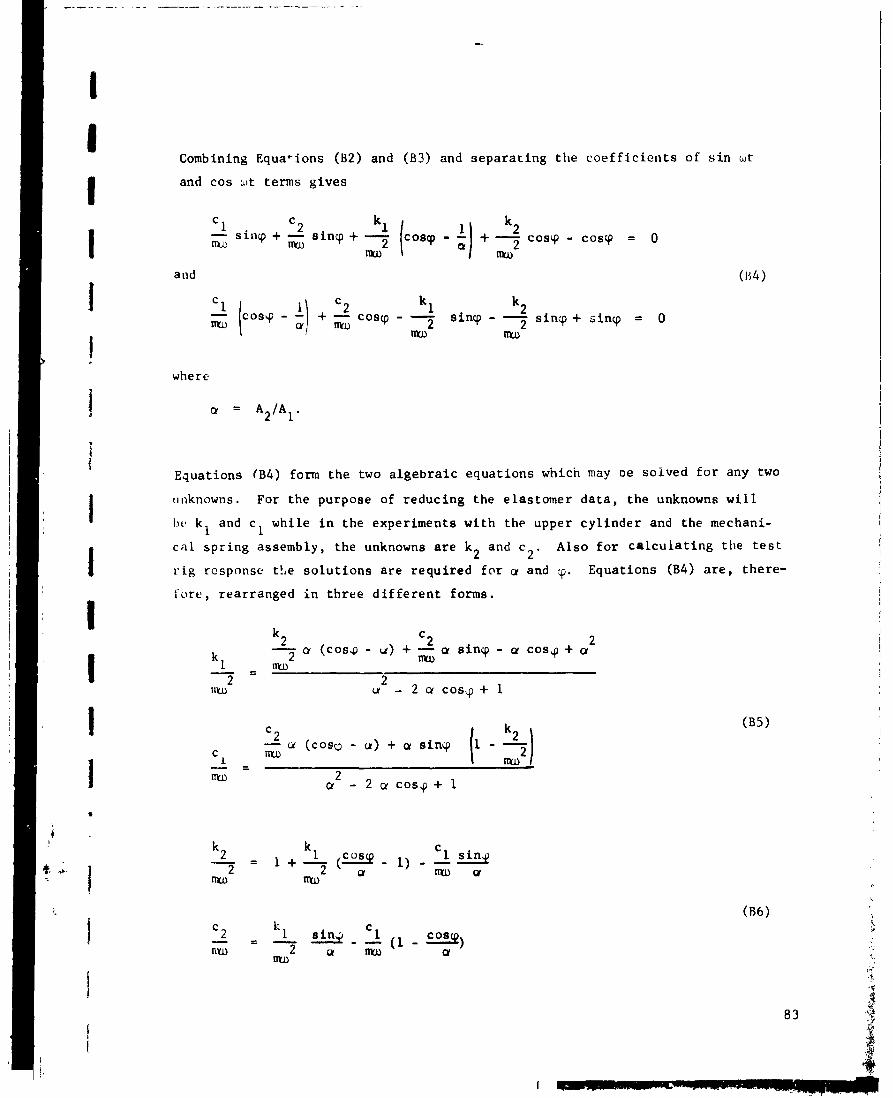
Combining Equations (B2) and (B3) and separating t h e c o e f f i c i e n t s of s i n w t
and cos w t terms g i v e s
1 C 2
- 8 ,
- sincp + - sincp + - nYu
cosy - k2 dl +T cosy - cosq = 0 nYo
and
1 C 2 kl - (.o., - $1 + - cos, - - 2
nYu sincp - - nu s i n 9 + sincp = 0
nYu nYo
where
Equations (B4) form t h e two a l g e b r a i c equa t ions which may De solved f o r any two
unknowns. For the purpose of r educ ing the e las tomer d a t a , the unknowns w i l l
b t ~ k and c whi le i n the experiments wi th the upper c y l i n d e r and the mechani- 1 1 c n l s p r i n g assembly, the unknowns a r e k and c Also f o r c a l c u l a t i n g the t e s t 2 2 ' r i g rcspnnse t!,e s o l u t i o n s a r e r equ i red f o r cr and cp. Equations (B4) a r e , there-
f o r e , rearranged i n t h r e e d i f f e r e n t forms.
k 2 2 - CY (cosg - u) + - a s i n y - a c o s g + a 2
1 2 mLD - = nW
rlyu 2 2
u - 2 (Y cosq + 1
C 2 - u (COST - u) + ar sincp
C 1
nu - =
a2 - 2 Q cosg + 1

a n d
tan? =
The express ions of k c k2 , and c i n terms of t h e va r ious c o e f f i c I. ' I. ' 2 i e n t s
shown i n Figure 15 a r e summarized i n Table B 1 f o r t h e d i f f e r e n t t e s t se tups .
It is c l e a r t h a t t h e experiment w i t h t h e lower c y l i n d e r assembled wi th t h e
guide bea r ing and t h e mechanical s p r i n g , is a s p e c i a l case of t h e above
formulat ion. Likewise, t h e experiment w i t h upper p i s t o n connected d i r e c t l y
t o t h e mechanical s p r i n g s and t h e guide bea r ings forms ano the r s p e c i a l case.
Since, i n t h e case of both of t h e s e experiments, t h e s t i f f n e s s and damping
c o e f f i c i e n t s a r e assumed t2 be frequency independent, t h e formulat ion could
be expressed i n terms of t h e resonance cond i t ions . Th i s w i l l be very s i m i l a r
t o t h e a n a l y s i s presented f o r the base e x c i t a t i o n system i n Appendix C.
The system t r a n s m i s s i b i l i t y a i s w r i t t e n i n terms of t h e nondimensional
q u a n t i t i e s .

TABLE B1 - REDUCED STIFFNESS AND DAMPING COEFFICIENTS
Test Setup
Mechanical Spring with kl, + km k + 2ks c u u
A l l System Components
Elastomer Specimen with k~ + ke k + 2ks c ' 1 + 'e U 11 A l l System Components
Mechanical Spring with km + k1 C a ks 0.
Lower Cylinder and Guide Bearing
Mechanical Spring with A 11 System Components Except the Lower Cylinder
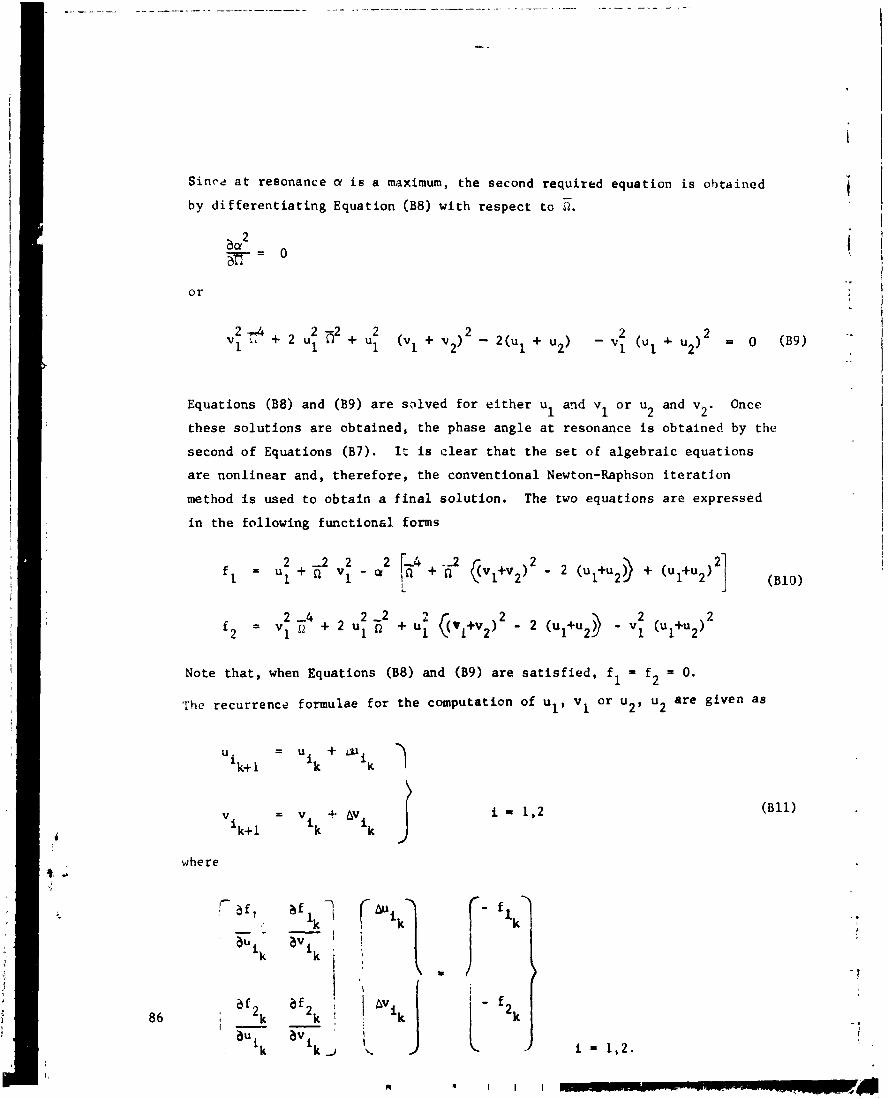
Sine< a t resonance a i s a maximum, the second requ i red equat ion i s ob ta ined
by d i f f e r e n t i a t i n g Equation (B8) w i t h r e s p e c t t o 12.
Equations (B8j and (B9) a r e sa lved f o r e i t h e r u agd v o r u and v Once 1 1 2 2 ' t h e s e s o l u t i o n s a r e ob ta ined , the phase ang le a t resonance is obta ined by the
second of Equations (B7). I: is c l e a r t h a t t h e s e t of a l g e b r a i c equa t ions
a r e non l inea r and, t h e r e f o r e , t h e convent ional Newton-Raphson i t e r a t i o n
method i s used t o o b t a i n a f i n a l s o l u t i o n . The two equa t ions a r e expressed
i n t h e fo l lowing f u n c t i o n a l forms
Note t h a t , when Equations (88) and (B9) a r e s a t i s f i e d , f l = f 2 = 0.
The recurrence formulae f o r the computation of u l , v l o r u 2 , u2 a r e g iven as
where

once ~ h c above s o l u t i o n s a r e ob ta ined , the phase ang le a t resonance i s ex-
pressed a s
'l'l~u:;, i f ihc s t i f f n e s s and damping coef f i c i e n c s a r e independent of f requency,
i t i s only necessary t o measure the system t r a n s n i s s i b i l i t y and the frequency
. I ( I ~ ' S O I K I I I ~ L ~ i l l ordtsr t i ) compute the unknown c o e f f i c i e n t s . The s p e c i a l c a s e s
0 1 ~ 1 1 , . I O W L ~ C .11nI upper c y l i n d e r w i t n cons t ra ined p i s t o n motion may ndw be con-
E. Lower Cyl inder wi th Constrained P i s t o n
Some c o n s t r a i n t on t h e motion c f t h e p i s t o n i n t l - 2 lower c y l i n d e r i s provided
by connecting i t t o the lower guide bear ing. The dynamic model of t h i s
system is shown schemat ica l ly i n Figure B5. For a p resc r ibed amplitude of
t a b l e e x c i t a t i o n , t h e frequency was v a r i e d u n t i l resonance was observed.
The ou tpu t motion of t h e r e s m a n t mass was then no ted , and thus t h e t r ans -
m i s s i b i l i t y a and t h e frequency a t resonance were determined a s f u n c t i o n s
of the a i r p r e s s u r e i n t h e lower c y l i n d e r . The ampl i tudes were low enough
t h a t f l u c t u a t i o n s i n t h e a i r p r e s s u r e were I - ? - ?:)an 1% assuming a d i a b a t i c
expansion f o r t h e l a r g e s t ampl i tudes impoc . , i ~ t i o n s (bll) w i t h i = 1,
were solved f o r u and v , and thus t h t c y l ; t : t i f F n r s s and damping 1.
c o e f f i c i e n t s were determined.
The r e s u l t s a r e p l o t t e d a s func t ions of preasu 1gi r e 86. Although
t h e s t i f f n e s s again v a r i e s l i n e a r l y as a func t ion of p r e s s b r e , t h e a b s o l u t e
va lues a r e somewhat h igher than those ob ta ined w i t 1 9 t he f r e e p i s t o n motion
in Figure B3. A p o s s i b l e reason f o r t h i s e f f e c t i s the change i n c y l i n d e r
volume between the two t e s t s [ 1 2 j . The l i n e a r r e l a t i o n s h i p shown by t h e
dashed curve was used i n c a l c u l a t i n g t h e lower c y l i n d e r s t i f f n e s s f o r ;be
purpose o f reducing the e las tomer da ta .


Fig. B6 Lower Cyljnder S t i f tnesr 2nd D,.my i1.p W i t h Constrainetl Piston Motitv.

Var ia t ions i n t h e damping c o e f f i c i e n t s a r e r a t h e r i r r e g u l a r , and assuming a
constant value a s shown by t h e dashed curve seems very reasonable . I t
should be noted t h a t c o n s t r a i n i n g t h e p i s t o n ~ i u r i o n does i n c r e a s e t h e damping
t o an apprec iab le e x t e n t . For reducing t h e e las tomer d a t a , c y l i n d e r damping
das t h e r e f o r e determined by performing a l ezs t - squares a n a l y s i s of t h e
response of t h e completely assembled t e s t r i g , except t h a t t h e mechanical
s p r i n g was used i n s t e a d o f che e las tomer specimen. D e t a i l s of t h i s approach
a r e d iscussed l a t e r i n t h i s Appendix.
The d i f f e r e n c e s between t h e computed and measured phase ang les a r e cf t h e
same genera l o r d e r a s shown e a r l i e r i n Figure B3.
F. Upper Cylinder wi th Constrained P i s t o n
S imi la r t o t h e lower c y l i n d e r , an experiment was set-up wi th t h e upper
c y l i n d e r mounted i n p lace . The p i s t o n was ccnnected through bo th gu ide
bea r ings d i r e c t l y t o t h e meachanical s p r i n g mounted on the shaker t a b l e .
Thus, t h e lower c y l i n d e r was e l imina ted i n t h i s test. A dynamic model of
t h e system is shown schemat ica l ly i n F igure B7.
Since t h e range of p ressure v a r i a t i o n i n t h e upper c y l i n d e r dur ing t h e
a c t u a l t e s t s was much smal le r than t h a t f o r lower c y l i n d e r , t h e a i r p r e s s u r e 2 was v a r i e d only up t o 2.76 x 10⁴ N / m (4 p s i g ) i n t h i s experiment. The
t r a n s m i s s i b i l i t v a and t h e frequency a t resonance were measured a s f u n c t i o n s
of a i r p ressure i n t h e cy l inder . Equations (B11) wi th i = 2 , were so lved i n
t h i s case f o r u and v and thus t h e c y l i n d e r s t i f f n e s s and damping were 2 2
determined a s f u n c t i o n s of t h e pressure .
The s t i f f n e s s is aga in found t o vary l i n e a r l y w i t h p ressure a s shown i n
Figure B8. The r e l a t i o n s h i p shown by t h ~ dashed curve was used dur ing
reduc t ion of d a t a from t h e e las tomer tests. It may be noted t h a t t h e
s t i f f n e s s of t h ~ upper c y l i n d e r is somevhat l e s s than t h a t of t h e lower
cy l inder . An exp lana t ion o f t h i s d i f f e r e n c e l i e s i n t h e f a c t t h a t i n the
assembled conf igura t ion , t h e volume i n the upper c y l i n d e r is g r e a t e r than
t h a t i n t h e lower one.
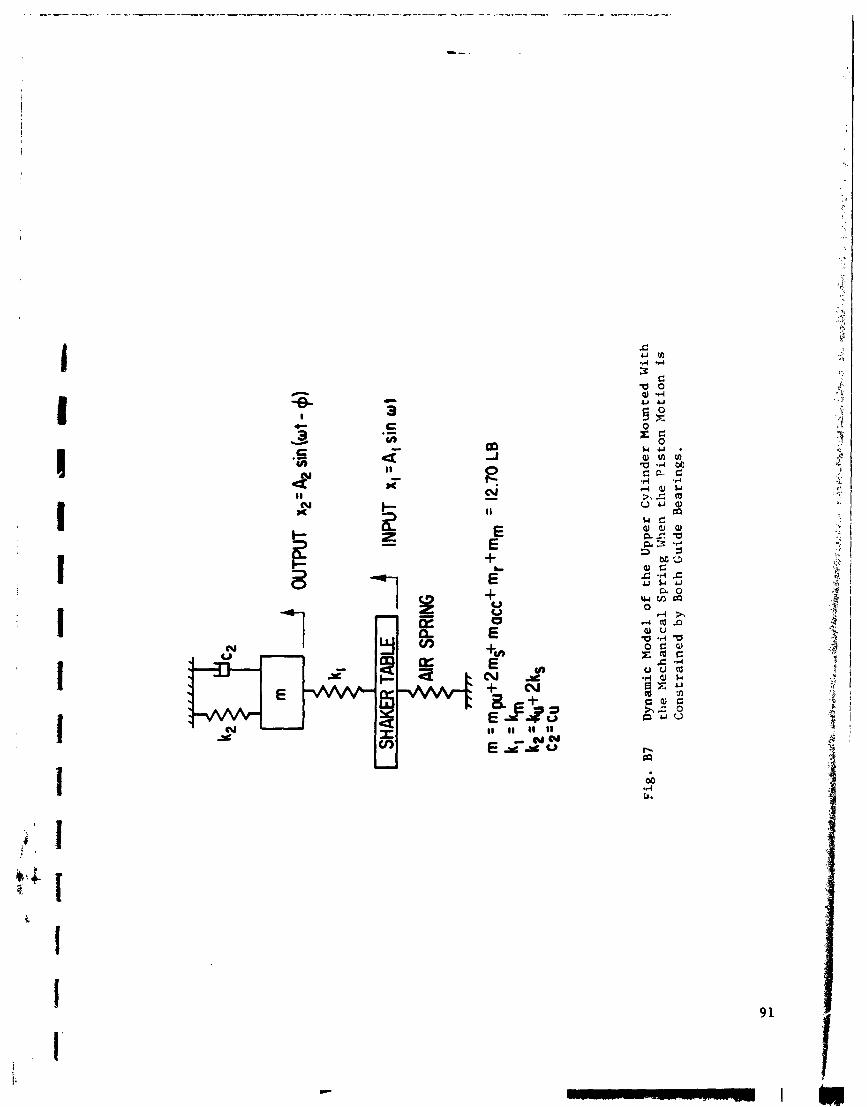
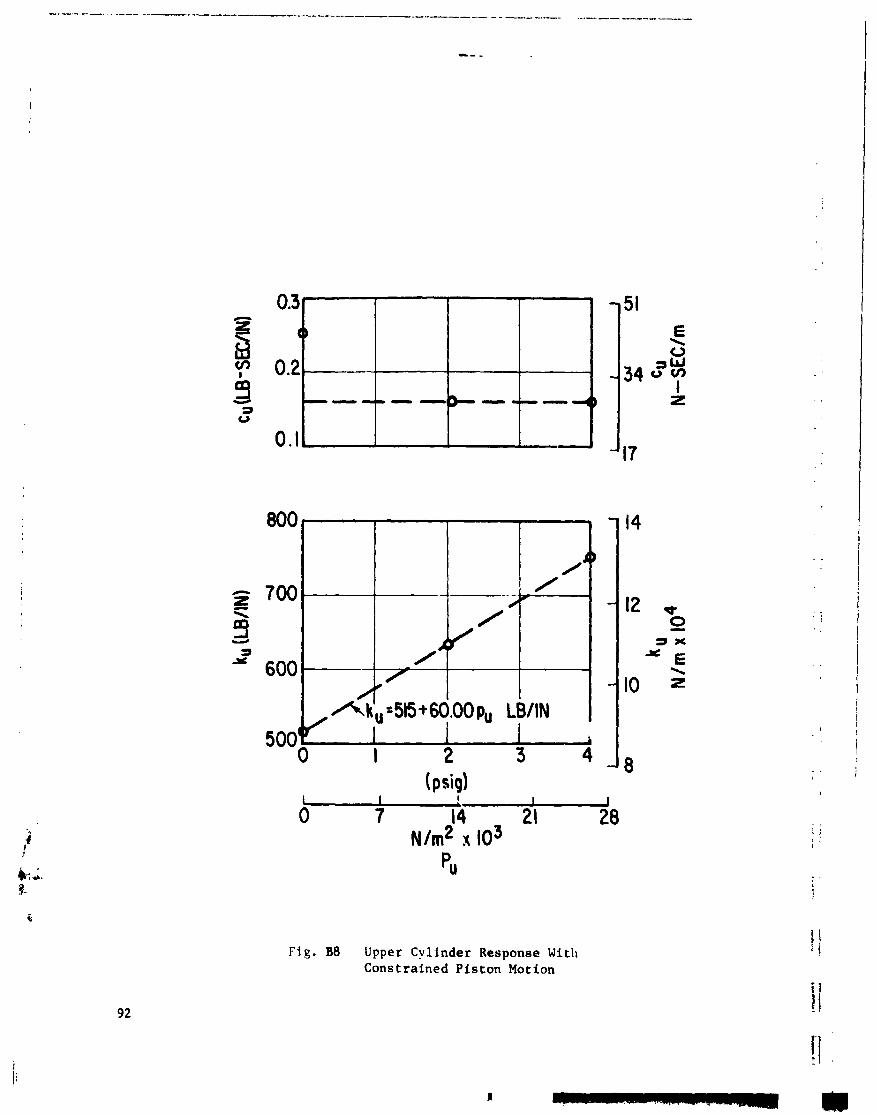
Fig. B8 Upper Cylinder Response W i t h Constrained Piston Motion
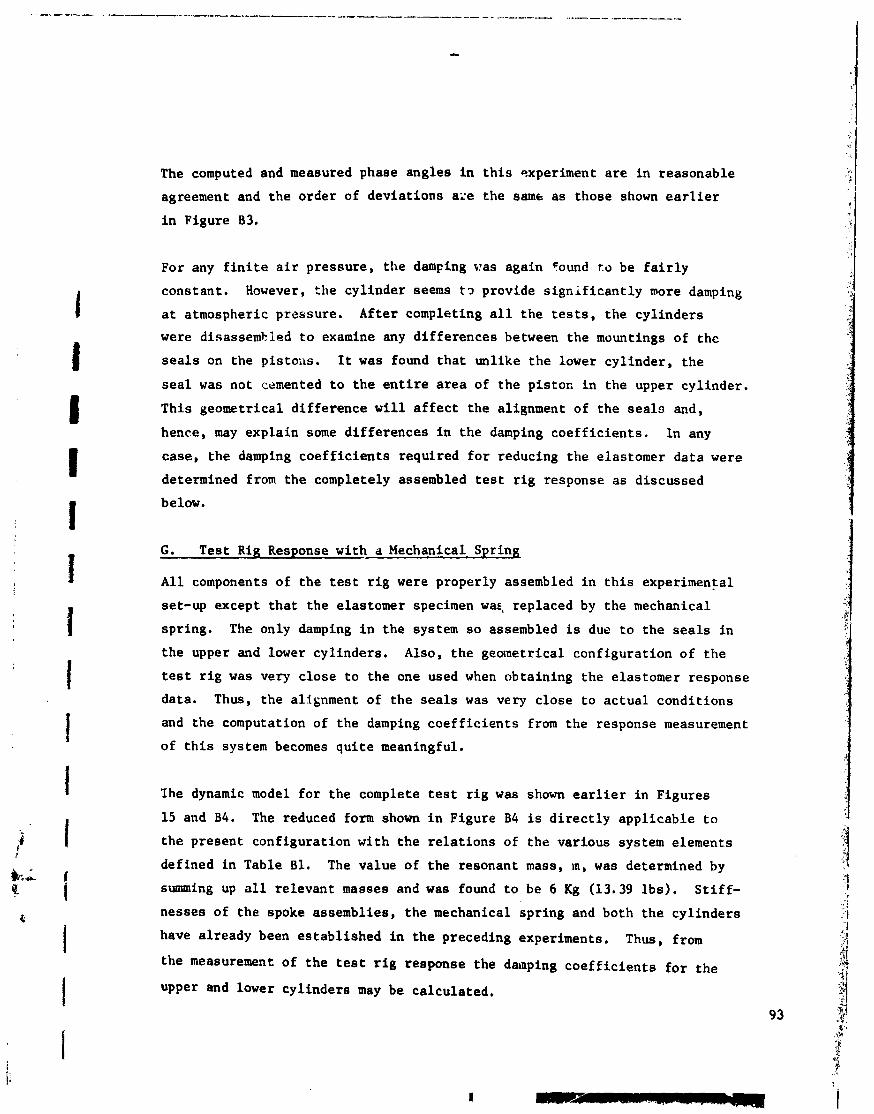
The computed and measured phase angles i n t h i s experiment a r e i n reasonable
agreement and the order of deviat ions ai-e the same as those shown e a r l i e r
i n Figure B3.
For any f i n i t e a i r pressure, t he damping vas again found t o be f a i r l y
constant. However, t he cy l inder seems t3 provide s i g n i f i c a n t l y more damping
a t atmospheric pressure. Af te r completing a l l t he t e s t s , the cy l inders
were disassemhied t o examine any d i f f e r ences between the mountings of t he
s e a l s on the pistoils. It was found tha t unl ike t he lower cy l inder , the
s e a l was not cemented t o t h e e n t i r e a r ea of the p i s ton i n the upper cyl inder .
This geometrical d i f fe rence w i l l a f f e c t t he alignment of t he s e a l s and,
hence, may explain some di f fe rences i n t he damping coe f f i c i en t s . In any
case, the damping coe f f i c i en t s required f o r reducing the elastomer da ta were
determined from the completely assembled t e s t r i g response a s discussed
below.
G. Test Rig Response with a Mechanical Spring
A l l components of the t e s t r i g were properly assembled i n t h i s experimental
set-up except t h a t the elastomer specimen wah, replaced by the mechanical
spring. The only damping i n the system s o assembled is due t o the s e a l s i n
the upper and lower cyl inders . Also, t h e geometrical configurat ion of t h e
t e s t r i g was very c lose t o the one used when obtaining the elastomer response
data. Thus, the alignment of the s e a l s was very c lose t o ac tua l condi t ions
and the computation of the damping coe f f i c i en t s from the response measurement
of t h i s system becomes q u i t e meaningful.
Zhe dynamic model f o r the complete test r i g was shown e a r l i e r i n Figures
15 and B4. The reduced form shown i n Figure B4 is d i r e c t l y appl icab le t o
the present configurat ion wi th t he r e l a t i o n s of the various system elements
defined i n Table B1. The value of the resonant mass, in, was determined by
s ~ i m i n g up a11 relevant masses and was found t o be 6 Kg (13.39 l b s ) . S t i f f -
nesses of the spoke assemblies, t he mechanical spr ing and both t he cy l inders
have already been es tab l i shed i n t he preceding experiments. Thus, from
the measurement of t he test r i g response the damping c o e f f i c i e n t s f o r the
upper ttnd lower cy l inders may be calculated.
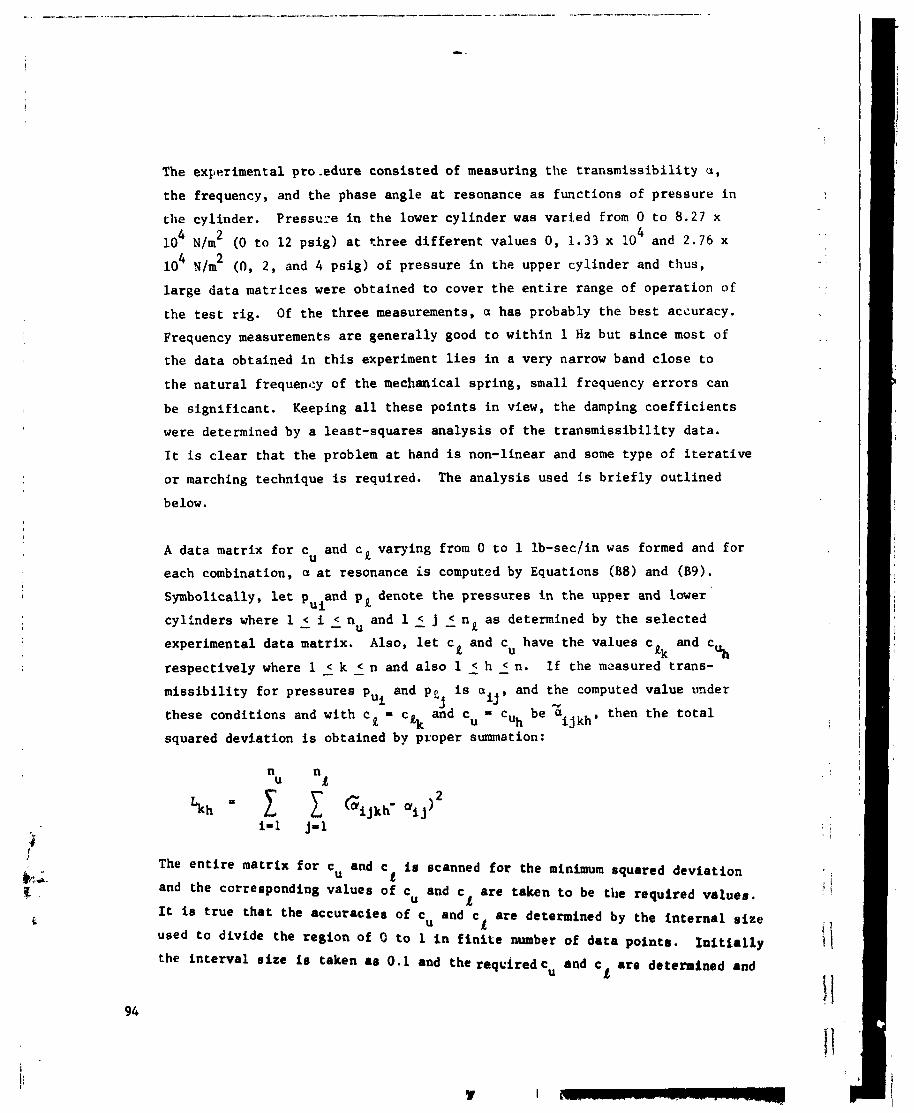
The experimental pro,.edure c o n s i s t e d of measuring t h e t r a n s m i s s i b i l i t y u ,
t h e frequency, and t h e phase angle at resonance a s func t ions of p r e s s u r e i n
t h e cy l inder . P r e s s w e i n t h e lower c y l i n d e r was v a r i e d from 0 t o 8 . 2 7 x 4 2 10 N/m (0 t o 12 p s i g ) a t t h r e e d i f f e r e n t va lues 0 , 1 .33 x lo4 and 2 .76 x 4 2 10 X/m (0, 2 , and 4 p s i g ) of p ressure i n t h e upper c y l i n d e r and thus ,
l a r g e d a t a mat r i ces were obta ined t o cover t h e e n t i r e range of opera t ion of
t h e t e s t r i g . Of t h e t h r e e measurements, a has probably t h e b e s t accuracy.
Frequency measurements a r e genera l ly good t o wi th in 1 Hz bu t s i n c e most of
t h e d a t a obta ined i n t h i s experiment l ies i n a very narrow band c l o s e t o
t h e n a t u r a l frequency of t h e mechanical s p r i n g , smal l frequency e r r o r s can
be s i g n i f i c a n t . Keeping a l l t h e s e p o i n t s i n view, t h e damping c o e f f i c i e n t s
were determined by a leas t - squares a n a l y s i s of t h e t r a n s m i s s i b i l i t y data .
I t is c l e a r t h a t t h e problem a t hand is non-linear and some type of i t e r a t i v e
o r marching technique is required. The a n a l y s i s used is b r i e f l y o u t l i n e d
below.
A d a t a matr ix f o r cu and cl varying from 0 t o 1 lb-sec l in was formed and f o r
each combination, a a t resonance is computctd by Equations (B8) and (B9).
Symbolically, let p and pll denote t h e p r e s s u r e s i n t h e upper and lower u i
c y l i n d e r s where 1 2 i ( n u and l ( j ( n Q a s determined by t h e s e l e c t e d
exper imental d a t a matr ix . Also, l e t c and c have t h e va lues c II u ilk and r e s p e c t i v e l y where 1 2 k 2 n and a l s o 1 2 h 2 n. I f t h e measured t rans -
m i s s i b i l i t y f o r p r e s s u r e s p and pp is ail, and t h e computed va lue m d e r u i 1 c.)
these cond i t ions and w i t h c Q C % Cu be Pjkh, then t h e t o t a l
squared dev ia t ion is obta ined by proper summation:
The e n t i r e mat r ix f o r c and c i r scanned f o r the minimum squared d e v i a t i o n u L and the corresponding value. of cu and c a r e taken t o be the requ i red values.
I It i s t r u e t h a t the a c c u r a c i e s of cu and c a r e determined by t h e i n t e r n a l s i z e a used t o d iv ide the r e g i o n of O t o 1 i n f i n i t e number of d a t a point^^. I n l t l a l l y the i n t e r v a l s i z e i r taken a6 0 . 1 and t h e r e q c i r e d c and c a r e determined and
U I
then a new mat r ix wi th i n t e r v a l s i z e 0.01 is set up around tilcse computed
va lues and t h e p rev ious ly ob ta ined s o l u t i o n is r e f i n e d bv adding an
a d d i t i o n a l d i g i t . The procedure could be repea ted f o r o b t a i n i n g any more
s i g n i f i c a n t d i g i t s i f necessary .
Using t h e above scheme, t h e damping c o e f f i c i e n t s f o r the lower and upper
c y l i n d e r s were found t o be r e s p e c t i v e l y 102 and 2 .45 N-seclm (0.583 and
0.014 lb - sec / in ) . These va lues were used i n determining t h e e las tomer
c h a r a c t e r i s t i c s from t h e exper imenta l da ta .

APPENDIX C
RESPONSE OF A BASE-EXCITATION SYSTEM
Since t h e s t i f f n e s s and damping i n t h e a i r c y l i n d e r s have been assumed t o be
independent of frequency, a t l e a s t w i t h i n t h e scope of t h e p resen t i n v e s t i g a -
t i o n , it i s necessary t o analyze t h e t e s t r i g response t o determine t h e s e
c o e f f i c i e n t s of damping and s t i f f n e s s . J n t h e absence of t h e upper c y l i n d e r
t h e t e s t r i g is represen ted by a convent ional base e x c i t a t i o n system. The
response of such a system is very wel l known [ 121 and t h i s Appendix b r i e f l y
out l i n e s t h e a n a l y s i s a p p l i c a b l e t o such a system.
The response of a simple base e x c i t a t i o n system, a s shown i n Figure C 1 , is
given i n terms of t r a n s m i s s i b i l i t y u , and t h e phase ang le Q , def ined by t h e
equat ions given i n Reference [ 91 .
and
n t a n tp = 2 2
I - < ? ) + (2c:) n n
where:
co = e x c i t a t i o n frequency ( rad l sec ) - = /!, t h e n a t u r a l frequency of t h e s p r i n g mass system ( r a d l ~ e c )
k - s p r i n g s t i f f n e s s (N/m)
2 rn - resonant mass (N-eec / i n . )
C 6 - , damping r a t i o =c
c - system damping c o e f f i c i e n t (N-sec/m)

-SHAKER INPUT x,=A,s inwt
Fig . C 1 Scherwtic of a Base E x c i t a t i o n System
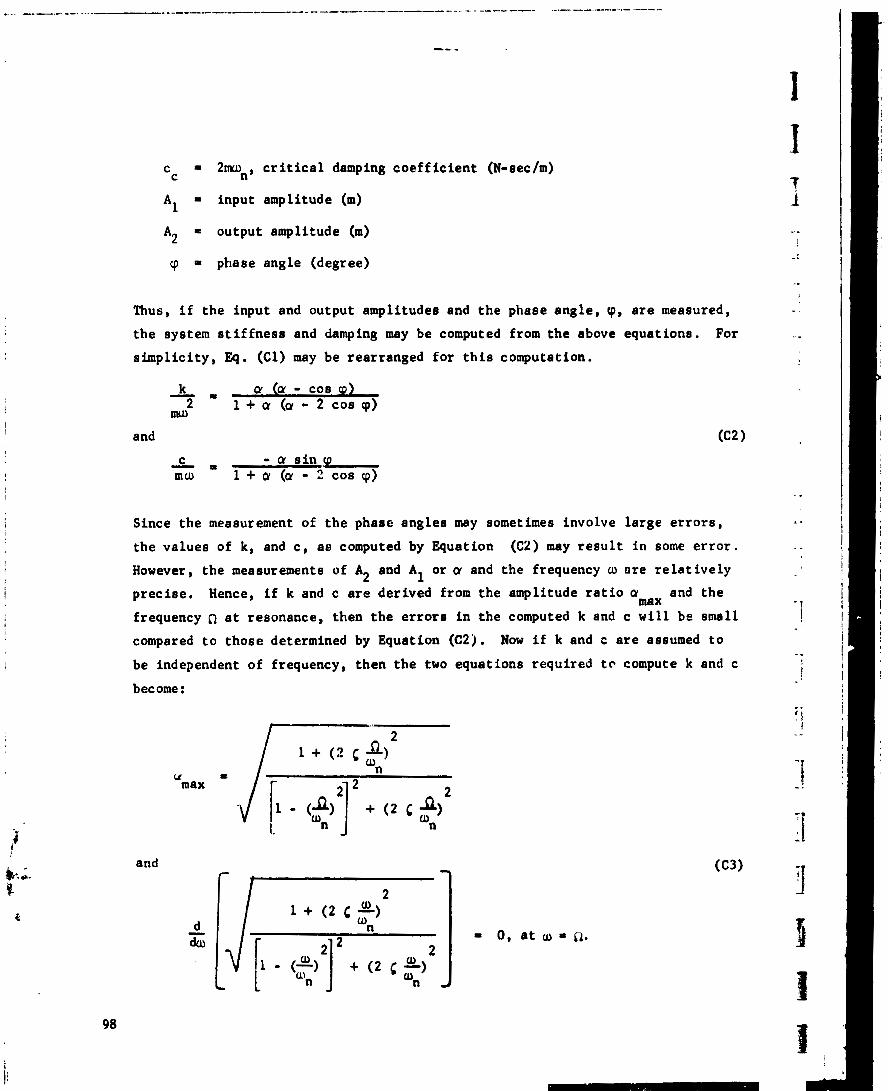
c = 2 w n , c r i t i c a l damping c o e f f i c i e n t (N-sec/m) C
A1 = input amplitude (a)
A* = outpu t amplitude (m)
q = phase angle (degree)
Thus, i f t h e inpu t and output amplitude8 and t h e phase a n g l e , Q, a r e measured,
t h e system s t i f f n e s s end damping may be computed from t h e above equa t ions . For
s i m p l i c i t y , Eq. (Cl) may be rearranged f o r t h i s computation.
k - I Q' (a - cos w ) 2
mco 1 + a (a - 2 C O S (9)
and
Since t h e measurement of t h e phase a n g l e s m y sometimes involve l a r g e e r r o r s ,
t h e va lues of k, and c , a s computed by Equation (C2) may r e s u l t i n some e r r o r .
However, t h e measurements of A2 and A1 o r a. and t h e frequency m ore r e l a t i v e l y
p r e c i s e . Hence, i f k and c a r e de r ived from t h e amplitude r a t i o a rnax and t h e
frequency n a t resonance, then t h e e r r o r 8 i n t h e computed k and c w i l l be smal l
compared t o t h o s e determined by Equation (C2). Now i f k and c a r e assumed t o
be independent of frequency, then t h e two equa t ions requ i red t o compute k and c
become :
U max
and

a The preceding two equations a r e e a s i l y solved fo r (u, ) and umx a s a funct ion of
6 . The phase angle a t resonance is then computed frBm the second of Equation (Cl).
2 1 4
CT r
max d.%+5
4c2 4 4 4
These so lu t ions a re r e a d i l y p lo t ted i n Figure C2 with an add i t i ona l no ta t ion :
The
from
computations of k and c with the measured u and Clm now s t ra igh t forward max Figure C 2 . For example, f o r a = 2.5, the following values a r e noted:
LL and from t h e d e f i n i t i o n s of 6 , 6 , and 0 , it it3 found t h a t 9 = 56O, 1 - 0.958.
4" For a mass equivalent t o say 0.9 kg (2 l b ) , t h i s gives k = 7.66 x LO N/m (437
lb / in . ) and c = 37.1 N-sech (0.212 lb-sec/ in . ) .
Once k, and c a r e determined, t he rystem response is d i r e c t l y computed, using
Equation (Cl) . This response may be compared with t he one obtained experi-
mentally t o a s c e r t a i n some confidence on the computed values of k and c .

ZETR Fig. C2 Retpoare of a Bare Excitation Syrtem at R ~ O O M ~ C ~

APPENDIX D
MECHANICAL MODEL ANALOGIES OF ELASTOMER DYNAMIC hESPONSE
During the course of t h i s study, techniques fo r f i t t i n g equivalent mechanical
models t o elastomer s t i f f n e s s and damping da t a were developed. This Appendix
descr ibes these techniques. Figure 35 of the l ~ p o r t compares the predict ion of
one such model with the data t o which the model was f i t t e d .
Mechanical models simulating v i scoe la s t i c behavior of elastomers may be obtained
by combining several spr ings and dashpots i n a prescribed fashion. The simplest
arrangements a r e when only one spr ing and one dashpot a r e connected e i t h e r i n
s e r i e s o r in p a r a l l e l a s shown i n Figure D l . The s e r i e s arrangement is general ly
ca l led a Maxwell element, while the p a r a l l e l configurat ion is termed as a Voigt
element. Sometimes the p a r a l l e l arrangement i s a l s o re fer red t o a s a Kelvin
element, s ince i t was introduced by Kelvin before Voigt. In general , for a so l id
mater ial , a Maxwell model may be defined by a combination r r .vetal Maxwell
elements connected in p a r a l l e l with a spr ing and a dash .ikewise, a general
Voigt model may cons is t of several Voigt elements conne m s e r i e s with a
spring. These models a r e shown schematically i n Figure ,,. Although several
other combinaLions a r e possible , Lazan [131 has shown tha t a l a rge number of
arrangements a r e reducible t o e i t h e r a Maxwell or 3 Voigt type of model. The
ana lys is for both these models is q u i t e simple. In f a c t , i f the Maxwell model
i s analyzed in terms of complex s t i f f n e s s , the ana lys is w i l l apply d i r e c t l y t o
the Voigt model when the s t i f f n e s s function i s replaced by compliance.
1. Mamell Model
Since the force in a spr ing and the dashpot i n a Mamell element is the same,
the model is bes t analyzed i n terms of complex s t i f f n e s s . Let the model con-
s ie t , of n Maxwell elements connected i n p a r a l l e l with a spr ing of s t i f h e a s ko,
and a dashpot with damping coe f f i c i en t co. Also, let: the j t h element have a
spr ing of r t i f f n e s s k and a dashpot with a damping coe f f i c i en t of c For J 1 '
so l id mater ials , ko w i l l be f i n i t e and v i l l correspond t o the s t a t i c s t i f f n e s s
and c may be zero. A r e l axa t ion time T = c /k is 8 measure of the time 0 j j j
required fo r s t r e s s r e l axa t ion i n the j t h l b m e l l element. A straightforward
a lgebra ic manipulation w i l l shar t h a t the complex s t i f f n e r s of the Maxwell
model i r deocribed by the function [93 101
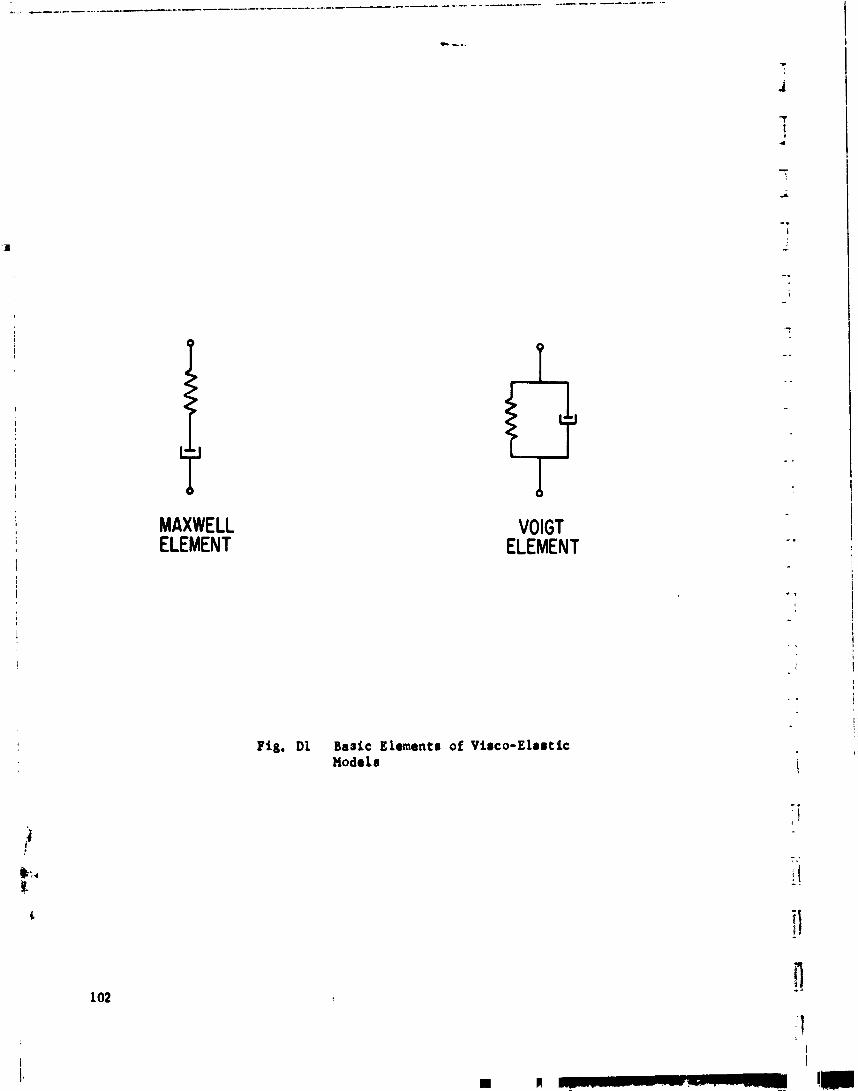
MAXWELL ELEMENT
VOlGT ELEMENT
Fig. D l Basic Elementr of Virco-Elrrtic Modr 1s
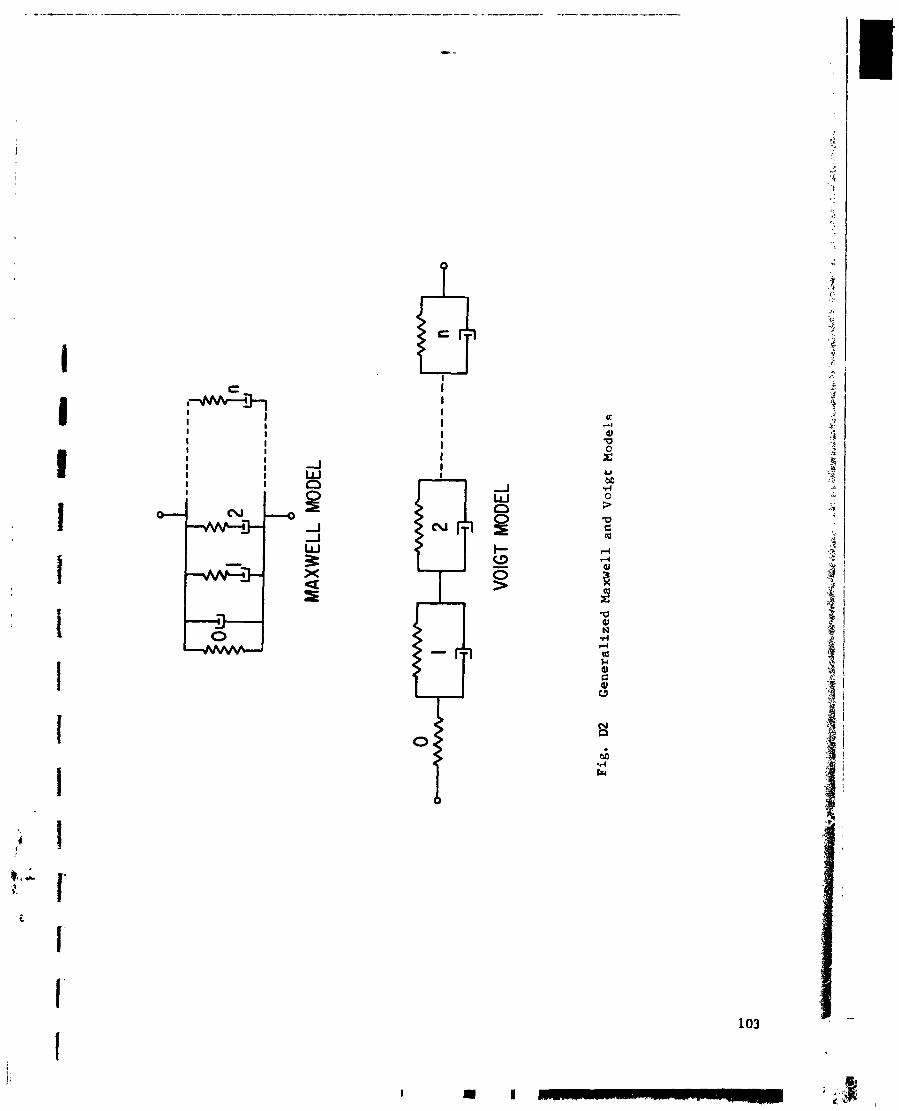

For b r e v i t y , Equation (Dl) i s w r i t t e n a s
where
and
I f K1 and K2 a r e determined exper imenta l ly as a f u n c t i o n of frequency, then
Equations(D3) may be used t o compute t h e v a r i o u s model c o e f f i c i e n t s . A l e a s t -
squares method may be used t o accomplish t h i s t a s k . Let the exper imenta l d a t a
be t a b u l a t e d a t f requenc ies (1: , 1 s v s m, where m is the t o t a l number of d a t a V
p o i n t s and a l s o f o r g e n ~ r a l l t y l e t the f u ~ ~ c t i o n s K 1 and K2 be weighted bv con-
s t a n t s W1 and W2, then the sum of squared d e v i a t i o n (SSD) is def ined a s
\ '
SSD = W 1 k f (uJ v t K 1 j j

where
Equation (D4) may be d i f f e r e n t i a t e d w i t h r e s p e c t t o a l l t h e model c o e f f i c i e n t s
and d e r i v a t i v e s s e t equa l t o ze ro f o r minimum SSD. These r e s k l t i n g equa t ions
a r e t o be solved s imul taneously f o r t h e requ i red c o e f f i c i e n t s . It i s c l e a r
t h a t t h e c o e f f i c i e n t s k appear i n a l i n e - r f ash ion but T o r R a r e n a n l i n e a r j j 1
and a r e , t h e r e f o r e , determined by i t e r a t i , method.
For any s e t of va lues f o r n i s j g n, t h e l i n e a r c o e f f i c i e n t s kos co, and j *
k 1 s j s n a r e determined by so lv ing t h e ?normal equationst1 f o r a c o n v e n t ~ o n a l 1 '
l i n e a r r e g r e s s i o n a n a l y s i s [14].
D i f f e r e n t i a t i o n of Equat ion (D4) with respec t t 3 t h e non l inear c o e f f i c i e n t g i v e s
where

A A = - and hi I - -
bQi 3%
For minimum SSD, the d e r i v a t i v e s given by the above equa t ions must be zero.
Thus, t h e n simultaneous equa t ions f o r 0 1 s j r n become 1 ' 1
1 The above equa t ions a r e solved by the Newton-Raphson i t e r a t i o n method. The
i
success ive s o l u t i o n s a r e obta ined by i n v e r t i n g t h e Jacobian mat r ix . -. . . i i f
The elements of the Jacobian mat r ix a r e der ived by s t ra igh t fo rward d i f f e r e n t i a -
t i o n of Equation (D6) i / r !
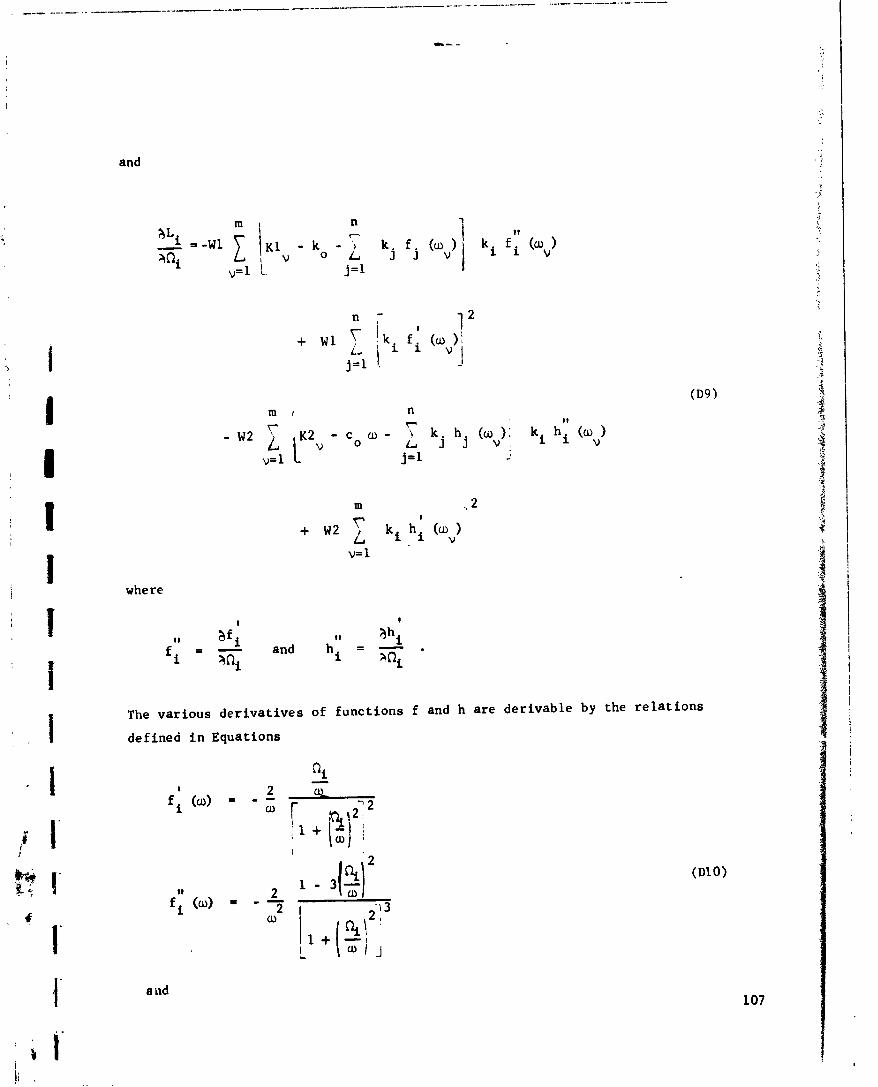
and
where
I 1
11 a i 11
f i = - a h i
and hi = - 3%
The various derivatives of functions
defined i n Equations
0, L -
I 2- f i (a) = - - a r I y<2 ; I + i
f and h are derivable by the re lat ions

To summarize t h e i t e r a t i v e s b l u t i o n procedure t h e l i n e a r parameters , ko, Co$
k 1 s j s n a r e solved f o r any set o f i t e r a t e s a , 1 s j s n. j ' 1
The new s e t
o f i t e r a t e s , 1 s j r n a r e ob ta ined by s o l v i n t t h e l i n e a r a l g e b r a i c Equa-
t i o n s (D7). "3 .l
It s h o u l d be noted t h a t such a l e a s t squares a n a l y s i s may somctirnes r e s u l t i n
negat ive c o e f f i c i e n t s , which a r e p h y s i c a l l y meaningless. Under t h e s e cond i t ions ,
i t might seem reasonable t o guess t h e p o s s i b l e r e l a x a t i o n f requenc ies from t h e
t r e n d of t h e d a t a and determine t h e l i n e a r parameters by c a r r y i n g ou t a
s imple l i n e a r regress ion.
I n o rder t o judge t h e reasonable v a l u e s o f 0 1 * j S n, t h a q u a l i t a t i v e j '
t r e n d s of Equation (D4) must be examined. It i s c l e a r t h a t K 1 i s formed
by l i n e a r s u p e r p o s i t i o n of f, and K2 is ob ta ined by anperposing t h e f u n c t i o n s .I
h The f u n c t i o n G f and h are p l o t t e d a s func t ions of o/Q i n ~ i g u r e ~ 3 , j
Thus, superposing f over s s t a t i c s t i f f n e e e ko w i l l r e s u l t i n a n i n c r e a s i n g .I
K 1 a s a func t ion of-frequency. I n t h e c a s e o f K2, some maxima o r minima may
be observed, depending on t h e va lues of I f n = 1, then c l e a r l y K2 w i l l j '
peak a t u = nl. I f 11 = 2 and nl and 0 a r e q u i t e f a r a p a r t , then a minimum 2 w i l l be observed i n K2 a t cu somewhere between O1 and C$. I f n = 2 and Ql and
O2 a r e q u i t e c l o s e , then a maximum w i l l be observed i n K2 a t u, somewhere be-
tween Ql and %. A non-zero va lue f o r c o e f f i c i e n t co c l e a r l y i n d i c a t e s a l i n e a r
i n c r e a s e i n K2 wi th frequency. I f no such t rend i s p r e s e n t i n t h e d a t a , co
may be s e t equal t o zero. These q u a l i t a t i v e t r e n d s w i l l e s t a b l i s h t h e poss ib le
va lues of O . , 1 s j S n , and a l s o might h e l p determine t h e number of e lements , j
n, required i n a model t o f i t the exper imental d a t a . 108


2. Voigt Model
As shown i n Figure D2 l e t a genera l i zed Voigt model be def ined by n Voigt
elements connected i n s e r i e s wi th a s p r i n g of s t i f f n e s s ko, Also , l e t the
j t h element have a s p r i n g of s t i f f n e s s k and a dashpot w i t h damping c o e f f i - j
c i e n t c I f t h i s model i s app l i ed t o s o l i d m a t e r i a l s , and i f the s t a t i c j '
s p r i n g w i t h s t i f f n e s s ko is not p r e s e n t then the s p r i n g s i n a l l elements must
have non-zero s t i f f n e s s . T h i s model is b e s t analyzed i n terms of complex com-
p l i a n c e H(m) which may be expressed a s L91-
where
bo = l / k o , b = J
l / k j and = c / k J J
The time T i n t h i s c a s e , is g e n e r a l l y c a l l e d r e t a r d a t i o n time s i n c e i t i s a j
measure of time requ i red f o r the e x t e n s i o n of the s p r i n g , i n t h e Voigt element,
t o i ts e q u i l i b r i u m l e n g t h whi le r e t a r d e d by t h e dashpot .
Equaiion (D12) f o r b r e v i t y may be expressed a s
where
n
and h i s same a s de f ined i n Equat ion 110 J

It i a c l e a r l y noted t h a t Equation (014) ie s i m i l a r t o Equation (D3) wi th co = 0.
I n f a c t , i f ko, k j , f j , 1 s j L n, and K l v , KZy, 1 4 a m i n Equation (03)
a r e r e s p e c t i v e l y replaced by bo, b j , g!, 1 s j L n, and H 1 , HZ , 1 s V r m, v v
t h a ~ the r e s u l t i n g equa t ion w i l l be i d e n t i c a l t o Equation (D14j. Thus, a l l
tht? a n a l y s i s ou t l ined f o r the Maxwell model i s a l s o a p p l i c a b l e i n the case of
the Voigt model.
The d e r i v a t i v e s of the func t ion g a r e e a s i l y obta ined j
A l l t he q u a l i t a t i v e f e a t u r e s descr ibed i n the case of the Maxwell model a r e a l s o
r e l e v a n t here when t h e exper imantal d a t a is p l o t t e d i n terms of complex compli-
ance. However, the f u n c t i o n g must be used i n s t e a d of f Th i s is a l s o p l o t t e d J j '
i n Figure ~ 3 .
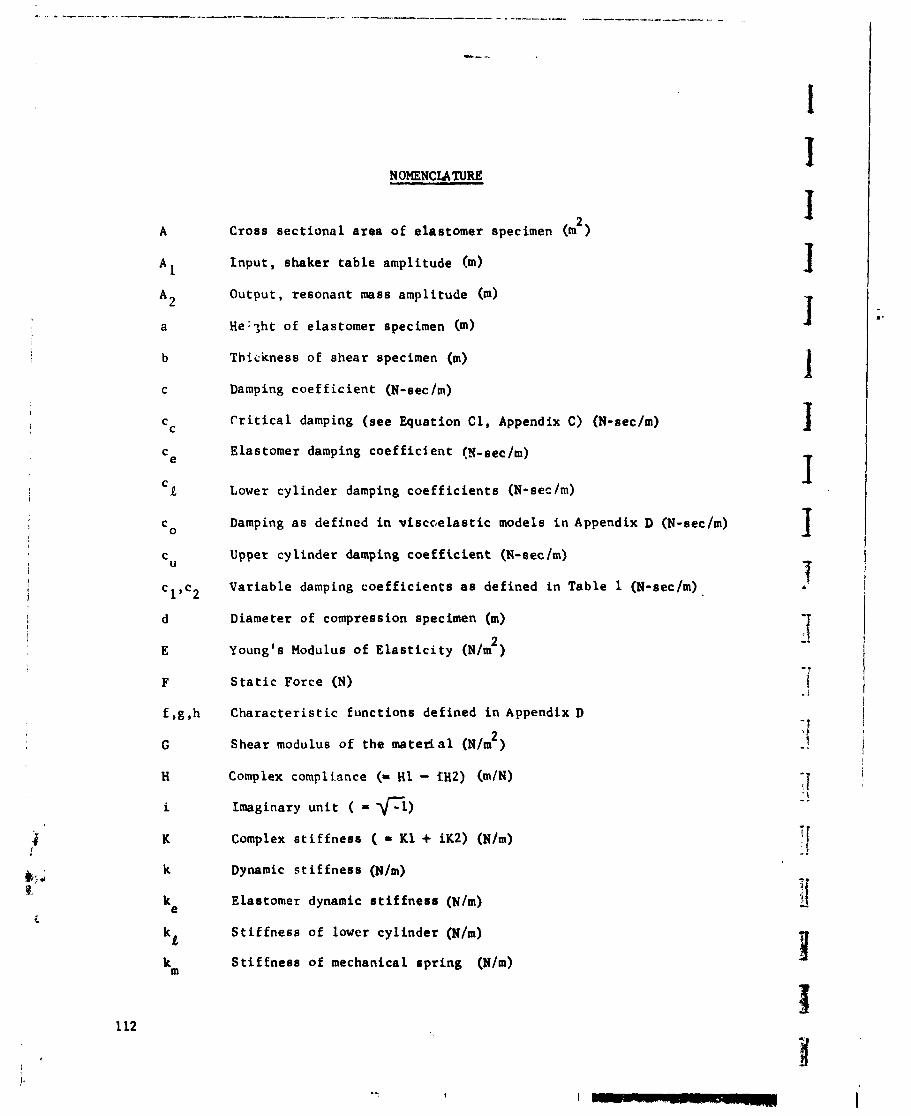
NOMENCLATURE
2 Cross s e c t i o n a l a r e a of e l a s tomer specimen (m )
I n p u t , shaker t a b l e ampl i tude (m)
Output , r e sonan t mass ampl i tude (m)
He : 3 h t of e las tomer specimen b )
Thickness of shea r specimen (m)
Damping c o e f f i c i e n t (N-secfm)
C r i t i c a l damping ( s e e Equation C1, Appendix C) (N-sec/m)
Elastomer damping c o e f f i c i e n t (X-sec/m)
Lower c y l i n d e r damping c o e f f i c i e n t s (N-sec /m)
Damping a s de f ined i n v i s c c ~ e l a a t i c models i n Appendix D (N-sec/m)
Upper c y l i n d e r damping c o e f f i c i e n t (N-sec /m)
V a r i a b l e damping c o e f f i c i e n t s as de f ined i n Table 1 (N-sec/m)
Diameter of compression specimen (m)
2 ~ o u n g ' s Modulus of E l a s t i c i t y (N/m )
S t a t i c Force (N)
C h a r a c t e r i s t i c f u n c t i o n s de f ined i n Appendix D
2 Shear modulus of t h e m a t e r i a l (N/m )
Complex compliance (- H l - fH2) (m/N)
Imaginary u n i t ( = Fl)
Complex s t i f f n e s s ( = K1 + iK2) (Nfm)
Dynamic s t i f f n e s s (N/m)
Elastomer dynamic e t i f f n e s s (Nfm)
S t i f f n e s s of lower c y l i n d e r ( ~ / m )
S t i £ fnese of mechanical s p r i n g (Nfm)
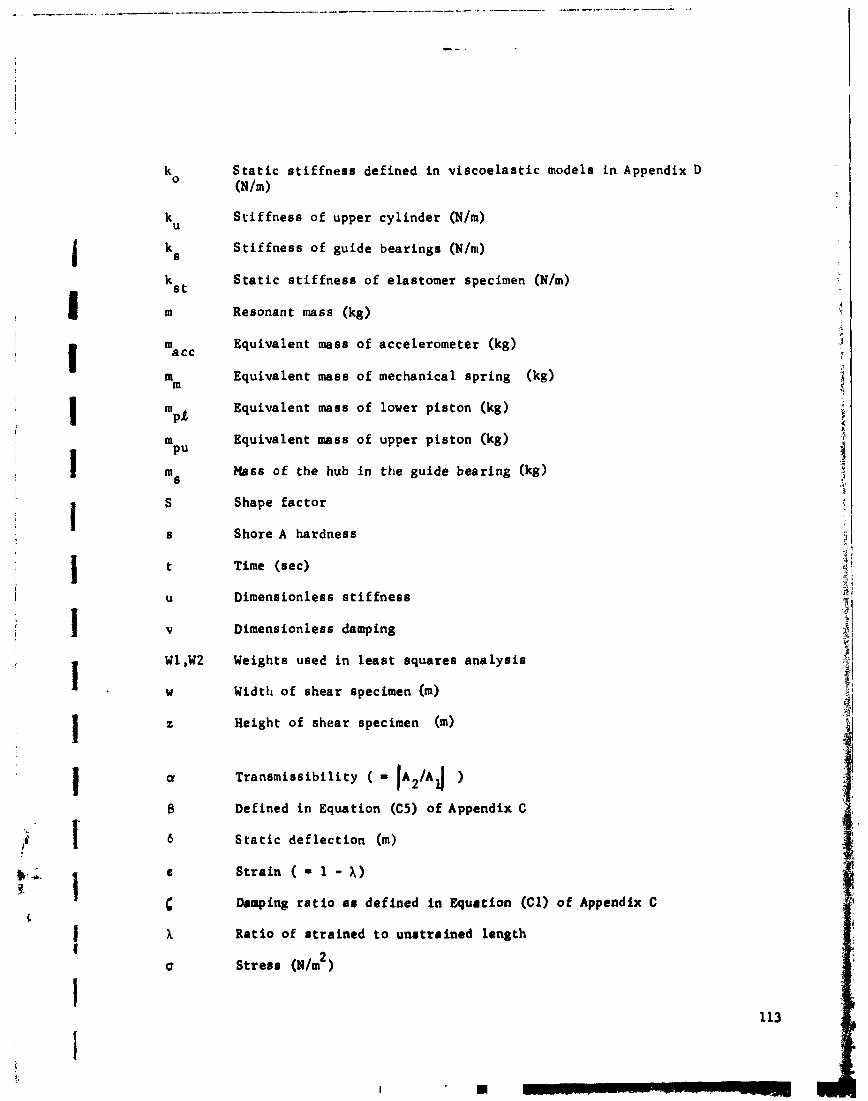
S t a t i c s t i f f n e e e de f ined i n v i s c o e l a a t i c models i n Appendix D (N/m)
S t i f f n e s s of upper c y l i n d e r (N/m)
S t i f f n e s s of guide bea r ings (N/rn)
S t a t i c s t i f f n e s s of e l a s tomer specimen (N/m)
Resonant mass (kg)
Equivalent mass of acce le romete r (kg)
Equivalent mass of mechanical s p r i n g (kg)
Equivalent mass of lower p i s t o n (kg)
Equivalent mess of upper p i s t o n (kg)
Mass of t h e hub i n t h e gu ide bea r ing (kg)
Shape f a c t o r
Shore A hardness
Time (eec)
Dimensionless s t i f f n e s s
Dimensionless damping
Weights used i n l e a s t squares a n a l y s i s
Width of s h e a r specimen (m)
Height of s h e a r specimen (m)
a T r a n s m i s s i b i l i t y ( - B Defined i n Equation (C5) o f Appendix C
b S t a t i c d e f l e c t i o n (m)
c S t r a i n ( = 1 - 1)
c Damping r a t i o a8 def ined i n Equ.tion (Cl) o f Appendix C
X R a t i o of s t r a i n e d t o u n r t r a i n e d l eng th
a 2 S t r e a r (N/m )

r Relaxation or retardation time (aec)
EP Phase angle (degree)
r i Dimeneionlees frequency
W m Natura 1 frequency of mechanical spring (radlsec)
W n Natura 1 frequency (radlsec)
03 8
Natural frequency of guide bearings (rad/rec)
a Frequency (radloec)

REFERENCES
Chiang, T., Tessarz ik , J.M., and Badgley, R .H . , "Development of Procedures f o r C a l c u l ~ t i n g S t i f f n e s s and Damping P r o p e r t i e s of Elastomers i n Engineer- i u g Appl ica t ions - P a r t I: V e r i f i c a t i o n of Basic Methods, NASA Contractor Report CR-120965, Prepared by Mechanical Technology Incorporbted f o r NASA- Lewis Research Center under Contract NAS3-15334, March 1972,
M i l l e r , H.E., "Dynamic Proper ty Measur--w,*t of &las tomers and Elas tomeric Mounts-Past, P resen t , and Future", Papc: '. .>. 730256, SAEIASTM Sym., "The Measurement of t h e Dynamic P r o p e r t i e s c f Elastomer P r o p e r t i e s of Elastomer and Elastomeric Mounts" Det., Michigan, ;-,luary 1973,
Larsen, R.T., "Dynamic V e r ~ u s S t a t i c Spr ing Rates f o r Vibrat ion Mounts", SAE 'frans. Paper No. 660599, 1966, 193-200.
C a r d i l l o , R.M., "Dynamic Tes t ing of Elastomer Mountings", J . Appl. Poly. Sc. 8, 1964, 53-71.
Meyer, D.A. and S.wner, J.G., "The E f f e c t of Compositional and Tes t ing Var ia t ions on t b e Dynamic P r o p e r t i e s of Compounds Based on Styrene-Butadiene and Polybutadiene Elastomers", Rubber Chem. Tech. 44, 1971, 258-270.
Saamer, J .G., and Meyer, D,A. , "Factors Cont ro l l ing t h e Dynamic P r o p e r t i e s of Elastomeric Products", Paper No. 730267 SAEIASTM Sym., "The Measurement of t h e Dynamic P r o p e r t i e s of Elastomer and Elas tomeric Mounts", D e t r o i t , Michigan, January 19 73.
Hodvan, C.D., E d i t o r , HANDBOOK OF CHEMISTRY AND PHYSICS, Chemical Rubber Publ ishing Co., 40th Ed i t ion , 1958-59, 1553.
DenHartog, J .P. , MECHANICAL VIBRATIONS, XcGtaw- H i l l Book Company, 1965.
Ferry , J.D., VISCOELASTIC PROPERTIES OF POLYMERS, John Wiley and Sons, 1970.
Payne, A.R. , and S c o t t , J .R. , EKINEERIK: DESIGN WITt! RUBBEX, I n t e r s c i e n c e Pub l i shers , New York.
Gent, A.N., "On t h e Re la t ion Between Indenat ion Hardness and Youngs Modulus", Rubber Chem. Tech,, 2, 1958, 896-905.
Thompnon, W.T., VIBRATION THEORY AND APPLICATIONS, Prent ice !!all, 1965.
Lazan, B.J . , DAMPING OF MATERIALS AND MEMBERS I N S'IRUCTURAL WECWNICS, Pergamon Prese , 1968.
Hald. A , , STATISTICAL THEORY WITH ENGINEERING APPLICATIONS, John Wiley and Sonr, 1952.

NASA-Lewis Research Center 2 1000 Brookpark Road Cleveland, OH 44135
Attention: Project Manager, M.S. 6-1 A. Ginsburg, M ,S . 5-3 W. Loomis, M.S. 23-2 W. Anderson, M.S. 23-2 R . Johnson, M.S. 23-2 S. Hinmel, M.S. 3-5 B, Lubarsky, M.S. 3-3 L . Sp'lopen, M.S. 500-206 C. H . Win- 'g, M.S. 5-3 N . Musial, M.S. 500-113 Report Control OPfice, M.S. 505 Library, M.S. 60-3 (2 copies) Rel iobi l i t y 6 Qua l i t y Assurmce
: i f ice , M S . 500-111 Technology U t i l i z a t i o n Off i c e , M .S . 3- 19 Plans & Programs Off ice , M S . 3-15
NASA S c i e n t i f i c & Tcchnical NASA Manned Spacecraft Center Informat ion F a c i l i t y (10 copies) Attn: Library
A t tn : Acquioitione Branch (SQT-34056) Hotiston, TX 77058 P. 0 - BOX-33 College Park, MI) 20740
NASA h e s Research Center Attn: Library Moffctt F ie ld , CA 94035
NASA Pl igh t Research Center At tn: Library P. 0. Box 273 Edwarde, CA 93523
NASA Goddard Space F l igh t Center Attn: Library Greenbelt , MD 20771
J e t Propuleion Laboratory Attn: Library 4800 Oak Grove Drive Pasadena, CA 91103
NASA h a g l e y Research Center Attn: Library Lengley S t a t i on Hampton, VA 23365
N&A Marshall Space Fl.!$ht Center Attn: Library Marehall Space Plight Center , AL 358x2
NASA Headquarters Washington, D.C 20546 Attn: WLCId. Miller (1 ccyies )
RLC1N.F. Rekos
Atomic Energy Commisrfon Attn: N. C e ~ s t e i n AEC-NASA Space Nuclear Propussion Off ice Washington, DC 20545
B a t t e l l e Memor~rl l n r t i t u t e Columbus Labora t .~r iee 505 Kinq Avenue Columbur, OH 43201 Attn: C . H . Allen
J.W. Kannel Library
Gcnerr 1 ELec tr ic Company Attn: C. C. Moxe Gas Turbine Engineering Divir ion Schencctady, N1 12306

Indus t r i a 1 Tectonic s , Inc . 18301 Santa Fe Avenue Compton, CA 90024 Attn: H. Hanau
H. Signer (6 cop ies )
Mechanical Technology Incorporated Attn: L ibra ry 968 Albany-Shaker Road Latham, NY 12110
Pure Carbon Company Attn: J . J . Sherlock MAIC Divis ion 441 Hal l Avenue S t . Mary, PA 15857
National Science Foundation A t tn: Library Engineering Divis! on 1800 G . S t r e e t , N.W. Washington, DC 20540
Naval Ship Engineering Center Attn: W. C . Lindstrom NSC 613D4B W,shington, DC 20360
Naval Ship Research & Development Center Attn: W. V . Smith Annapolis Divis ion Annapolis, MD 21402
Naval Ship Systems Command Attn: J . E. Dray SNHIP 6148 Washington, DC 20360
North h e r i can Rockwell Attn: Myles Butner Power S y s t e m Divis ions 6633 Canoga Avenue Canoga Farl., CA 91304
North American Rockwell Corporation Attn: L ibra ry Space Divis ion 12214 Lakewood Boulevard Downey, CA 90241
O f f i c e of Naval Research Attn: S . W. Doroff O W 4 6 3 Washington, D.C. 20360
Rensselaer Polytechnic I n s t i t u t e Attn: F. F, Ling Mechanics Div i e i o n Troy, NY 12181
AVSCOM Attn: E . J . Hollman, AMSAV-11 Di rec to r Product Assurance P. 0. Box 209 S t . Louis , MO 63012
SKF I n d u s t r i e s , Incorporated Engineering and Research Center 1100 F i r s t Avenue King of P r u s s i a , PA 19406 Attn: T. T a l l i a n
A . T r o i a n i L. S ib ley
TEtW Marl in Rockwell Div i s ion Attn: A. S. I rwin 402 Chandler S t r e e t Jarnestown, NY 14701
United A i r c r a f t Corporat ion P r a t t & Whitney A i r c r a f t Divis ion 400 Main S t r e e t East Har t fo rd , CT 06108 Attn: F. H. Mahler
P. Holmes L ibra ry P. Brown R. Shevchenko
U. S. Army A i r Mobi l i ty R&D Laboratory E u s t i s D i r e c t o r a t e . I
Commanding O f f i c e r (SAV DL-EU-PP) F o r t E u s t i s , VA 23604 . . . . Attn: 3. White . a
3' {
L. Bartone R . Givens - .
NAVAIRSYSCOMHQ Attn: H. Lewis, AIR 53645A Department of t h e Navy Washington, DC 20360
AVCO Lycoming Divis ion T
Attn: R . P. Cuny Manager, Mechanical Components
1 ( i*
S t r a t f o r d , CT 06497
AFAPL- S FL Wright-Patterson A i r Force Base, OH 4543 A t t n : J . Jenk ins
E, Lake
O f f i c e of Naval Research Attn: L t . Richard M i l l e r , Code 463 800 N. Quincy S t r e e t Arl ington, VA 22217

Northwestern Univers i ty Deptrtment c f Mechanical Engineering
and As t ronau t ica l Science Evanston, IL 60201 b t t n : D r . R . Burton
D r . H.S. Cheng
Sunstrand Denver Attn: L ibra ry 2480 West 70 Avenue Denver, CO 80221
TRW Accessor ies Divis ion Attn: L ibra ry 2355 Euclid Avenue Cleveland, OH 44117
U .S . Army Engineering R&D Labs Atten: W. C r i m Gas Turbine Tes t F a c i l i t y F o r t Be lvo i r , VA 22060
United A i r c r a f t Corporat ion Sikorsky A i r c r a f t Divis ion Attn: L e s t e r Burroughs S t r a t f o r d , CT 06497
Southwest Research I n s t i t u t e Attn: P . M. Ku Technical Vice Pres iden t P. 0 . Drawer 28510 San Antonio, TX 78284
Aerospace Corporation Attn: L ibra ry P . 0. Box 95085 Los Angeles, CA 91745
AiResearch Manufacturing Company 402 South 36 S t r e e t Phoenix, AZ 85034 A t t n : Libra ry
Lyle S ix
Bendix Research Labs Divis ion Attn: L ibra ry D e t r o i t , M I 48232
Boeing Company Aerospace Divis ion Attn: L ibra ry P . 0. .Box 37 07 S e a t t l e , WA 98124
Boeing Company V e r t o l Divis ion, Boeing Center P. 0 . Box 16858 Ph i lade lph ia , PA 19142 Attn: L ibra ry
A . J . Lemanski
Cont inen ta 1 Aviat ion & Engineering Corp . Attn: L ibra ry 12700 Kercheva 1 Avenue D e t r o i t , M I 48215
Curt tss-Wright Corporat ion Wright Aero Divis ion Attn: L ibra ry Main & Passa ic S t r e e t s Woodr idge, N J 07075
Fa f n i r Bearing Company Attn: R . J Matt 37 Booth S t r e e t New B r i t a i n , CT 06050
Frank l in I n s t i t u t e Research Labs Benjamin Frank l in Pkwy, a t 20th S t r e e t Ph i lade lph ia , PA 19103 Attn: W. Shapiro
J . Rumbarger
General E l e c t r i c Cornpan9 Attn: L ibra ry Mechanical Technology Laboratory R&D Center Schenectady , NY 12301
Genera 1 Motors Corporation Attn: L ibra ry Det ro i t -Al l i son Di- isi ion I n d i a n a p o l i s , I N 46206
General Motors Corporat ion A t t e n t ion: W . Kacmarsky New Departure-Hyatt Divis ion Hayes Avenue (Route 4 ) Sandusky, OH 44871
Hughes A i r c r a f t Corporat ion Attn: L ibra ry Cen t ine la & Teale Avenue Culver C i t y , CA 90230

I n s t i t u t e f o r Defense Analyses Attn: L ibra ry 400 Army-Navy Drive Arl ington, VA 22202
Lockheed M i s s i l e s ir Space Company Attn: L ibra ry P. 0 . Box 504 Sunnyva l e , CA 94088
Massachusetts I n s t i t u t e of Techn2logy Attn: L ibra ry Cambridge, MA 02139
AiResearch Manufacturing Company Attn: Library 9851 Sepulveda Boulevard Los Angeles, CA 90009
Mate r ia l s Science Copr . Blue Be l l Of £ i c e Campus Merion Tower Building Blue Be l l , PA 19422
Shaker Research Corp. Attn: D r . C .H.T. Pan Northway 10 Executive Park B a l l s t o n Lake, NY 12019
Marlin-Rocknell Company Attn: Anthony T. Galbato Division of TRW, Inc . 402 Chandler S t r e e t Jamestown, NY 14701
Genera 1 E l e c t r i c Co . Attn: Dr. Alfred J. Martenson P. 0. Box 8 , Malta S i t e Schenectady, NY 12301
Naval A i r Systems Conmand Attn: S. M. Collegeman A I R 5365A Washington, DC 20360


![Elastomer plasma polymerization Review - Characterization of … · 2018. 9. 11. · nished elastomer composites [11-15], elastomer surfaces modified by gas-phase fluorination [15-16]](https://img.pdfslide.us/doc/110x75/60bd17fb7a9618105d1a2bef/elastomer-plasma-polymerization-review-characterization-of-2018-9-11-nished.jpg)