Embed Size (px)
Citation preview
22
Development of Potentiometric Urea Biosensor Based on Canavalia ensiformis Urease
Lívia Maria da Costa Silva1, Ana Claudia Sant’Ana Pinto1,
Andrea Medeiros Salgado1 and Maria Alice Zarur Coelho2 1Laboratory of Biological Sensors/EQ/UFRJ
2BIOSE/EQ/UFRJ Biochemical Engineering Department, Chemistry School,
Technology Center, Federal University of Rio de Janeiro Brazil
1. Introduction
The increasing number of potentially harmful pollutants in the environment calls for fast
and cost-effective analytical techniques to be used in extensive monitoring programs.
Additionally, over the last few years, a growing number of initiatives and legislative actions
for environmental pollution control have been adopted in parallel with increasing scientific
and social concern in this area (Rogers & Gerlach, 1996; Rodriguez-Mozaz et al., 2004;
Rodriguez-Mozaz et al., 2005; Rogers, 2006). Nitrogen compounds are pollutant found in
several industrial effluents, being its determination of extreme environmental importance.
Several methods are used to urea determination, including spectrophotometry, fluorimetry, potentiometry and amperometry. But some of these require a pretreatment or are unsuitable for monitoring in situ. For this reason there has been growing interest in the development of biosensors for these determinations. The requirements for application of most traditional analytical methods to environmental
pollutants analysis, often constitute an important impediment for their application on a
regular basis. The need for disposable systems or tools for environmental applications, in
particular for environmental monitoring, has encouraged the development of new
technologies and more suitable methodologies. In this context, biosensors appear as a
suitable alternative or as a complementary analytical tool. Biosensors can be considered as a
subgroup of chemical sensors in which a biological mechanism is used for analyte detection
(Rogers & Gerlach, 1996; Rodriguez-Mozaz et al., 2005; Rogers, 2006).
A biosensor (Figure 1) is defined by the International Union of Pure and Applied Chemistry
(IUPAC) as a self-contained integrated device that is capable of providing specific
quantitative or semi-quantitative analytical information using a biological recognition
element (biochemical receptor), which is retained in contact direct spatial with a
transduction element (Thévenot et al., 1999). Biosensing systems and methods are being
developed as suitable tools for different applications, including bioprocess control, food
quality control, agriculture, environment, military and in particular, for medical
applications. The main classes of bioreceptor elements that are applied in environmental
www.intechopen.com

Biosensors – Emerging Materials and Applications 484
analysis are whole cells of microorganisms, enzymes, antibodies and DNA. Additionally, in
the most of the biosensors described in the literature for environmental applications
electrochemical transducers are used (Thévenot et al., 1999).
Fig. 1. Biosensor scheme.
For environmental applications, the main advantages offered by biosensors over
conventional analytical techniques are the possibility of portability, miniaturization, work
on-site, and the ability to measure pollutants in complex matrices with minimal sample
preparation. Although many of the developed systems cannot compete yet with
conventional analytical methods in terms of accuracy and reproducibility, they can be used
by regulatory authorities and by industry to provide enough information for routine testing
and screening of samples (Rogers & Gerlach, 1996; Rogers, 2006; Sharpe, 2003). Biosensors
can be used as environmental quality monitoring tools in the assessment of
biological/ecological quality or for the chemical monitoring of both inorganic and organic
priority pollutants.
Due to great variety of vegetal tissues Brazil constitutes an inexhaustible enzyme source,
which can be used in the most diverse areas of the knowledge, amongst them in the
development of the biosensors. James B. Sumner (Sumner, 1926) crystallized the enzyme
urease from jack bean, Canavalia ensiformis (Fabaceae), a bushy annual tropical american
legume grown mainly for forage, in 1926, to show the first time ever that enzymes can be
crystallized. Urease is abundant enzyme in plants and, moreover, it can be found at
numerous of eukaryotic microorganisms and bacteria. The bacterial and plant ureases have
high sequence similarity, suggesting that they have similar three-dimensional structures and
a conserved catalytic mechanism.
Ureases (urea amidohydrolase, EC3.5.1.5) catalyzes the hydrolysis of urea to yield ammonia
(NH3) and carbamat, the latter compound decomposes spontausly to generate a second
molecule of ammonia and carbon dioxide (CO2) (Takishima et al., 1988) (Figure 2).
So, the main objective of this study was to optimize the operating conditions to obtain the
final configuration of the urease biosensor for environmental application.
www.intechopen.com

Development of Potentiometric Urea Biosensor Based on Canavalia ensiformis Urease 485
茎態軽 伐 系頚 伐 軽茎態 髪 茎態頚 通追勅銚鎚勅屬吟吟吟屐 軽茎戴 髪 茎態軽 伐 系頚 伐 頚茎 茎態軽 伐 系頚 伐 頚茎 髪 茎態頚 → 軽茎戴 髪 茎態系頚戴 茎態系頚戴 ↔ 茎袋 髪 茎系頚戴貸 に軽茎戴 髪 に茎態頚 ↔ に軽茎替袋 髪 に頚茎貸
Fig. 2. Urea hydrolysis catalyzed by urease.
2. Material and methods
2.1 Biocomponent: jack beans (Canavalia ensiformis)
The biocomponent, jack beans, Canavalia ensiformis, as show in Figure 3, was donated by Seeds & Associate Producers on Earth by Brazilian Agricultural Research Company (EMBRAPA). It is a vegetal plant tissue rich in the urease (Luca & Reis, 2001). The jack beans were being used as a powder, with a particle size less than or 3mm, in free form or immobilized. When the powder was not in use, it was stored in refrigerators, till further use.
Fig. 3. Jack beans.
2.2 Ammonium ion-selective electrode calibration
For biosensor system development, an ammonium ion-selective electrode (Orion Ammonia Electrode 95-12 Thermo) was used as transducer. A calibration curve of the electrode potential (mV) vs. urea concentration (ppm) is constructed, using ammonium chloride solution (NH4Cl) (1000 ppm) as stock solution. The standard solutions were prepared from the stock solution in range of 5 to 1000 ppm.
2.4 Best conditions of the fresh jack bean urease
The tests for optimization the enzymatic reaction conditions of fresh urease of jack beans monitored the urea hydrolysis to ammonia by ion-selective electrode response under different conditions. The conditions tested were: the jack bean amount (0.1, 0.2, 0.3, 0.4 and 0.5 g); the pH of sample standard solution (6.0, 7.0 and 8.0) and reaction temperature (20, 25, 30 and 40°C). The assay consisted in adding the desired amount of powder in 5.0 mL of the standard solutions (several urea concentrations prepared from stock solution in potassium phosphate buffer with desired pH) and 100 µL of ISA (ionic strength adjustor buffer solution). Then the ammonium ion-selective electrode was immersed in the solution, monitoring the enzymatic reaction by the potential difference (mV) caused by urea hydrolysis.
www.intechopen.com

Biosensors – Emerging Materials and Applications 486
2.5 Urease immobilization
The enzyme (powdered jack bean) immobilization using glutaraldehyde was performed
according Junior (1995). The final configuration of procedure, in brief, urease was
covalently immobilized on nylon screen according to the following procedure: 0.2 g of
powdered beans was placed under a nylon screen and 200 mL of glutaraldehyde solution
(12.5%) were added. Then, another nylon screen was placed on top (Figure 4). After 20
minutes, the set was immersed in distilled water for 20 minutes and then in potassium
phosphate buffer pH 7.0 at the same time. The immobilized biocomponent was used after
storage for 24 hours in the refrigerator, at 4°C.
Fig. 4. Procedure step sequence of powdered jack bean immobilization.
2.6 Urease activity assay
Alkalimetric method is based on the observation made by Kistiakowsky & Shaw (1953, as
cited in Comerlato, 1995) which the initial pH neutral of unbuffered solution of urea-urease
rapidly increases to pH 9.0, and then remains approximately constant. The reaction products
in this pH are usually ammonium carbamate, ammonium carbonate and bicarbonate as
shown in the following Figure 5: 茎態軽系頚軽茎態 髪 に茎態頚 → 岫軽茎替岻袋 髪 岫軽茎態系頚態岻貸 髪 茎態頚 → に岫軽茎替岻袋 髪 岫系頚戴岻貸 → 岫軽茎替岻袋 髪 軽茎戴 髪 岫茎系頚戴岻貸
Fig. 5. Urea hydrolysis by urease.
In this method, the urease activity was assayed by adding 1mL of urea solution,
immobilized urease and 10mL of deionised water. Incubation was carried out at 25ºC (room
temperature) and low agitation for a constant interval. Withdrew an aliquot (2 mL) of
mixture solution and terminated with hydrochloric acid solution. Then, the reaction mixture
was back-titrated with sodium hydroxide solution, methylorange being used as an
indicator. The blank test was assayed under the same conditions above, using 1mL of urea
solution and 11 mL of deionised water.
These end products of the reaction are a buffer system that maintains the pH constant as the
reaction proceeds. So using the substrate initially buffered at pH 9.0, avoids the subsequent
change in pH. The addition of excess hydrochloric acid in the final time disrupts the reaction
and converts the carbamate and ammonia to ammonium ions. Therefore, back-titration with
sodium hydroxide measures the acid did not react (Comerlato, 1995).
To calculate the enzyme activity, first is necessary to calculate the volume of sodium hydroxide (vol. NaOH) wich is given by: vol. NaOH = vol. NaOH blank – vol. NaOH test. So the urease activity calculated using the equation below:
www.intechopen.com

Development of Potentiometric Urea Biosensor Based on Canavalia ensiformis Urease 487
岫軽欠頚茎兼剣健欠堅件建検岻捲岫懸剣健. 軽欠頚茎岻捲岫などどど岻捲岫穴血岻建件兼結堅結欠潔建件剣券岫兼件券憲建結嫌岻捲欠兼剣憲券建剣血倹欠潔倦決結欠券嫌岫訣岻 噺 戟券件建嫌 欠兼剣憲券建剣血倹欠潔倦決結欠券嫌岫訣岻斑
where: 懸剣健. 軽欠頚茎噺 撃剣健憲兼結岫件券兼件健健件健件建結堅嫌岻剣血嫌剣穴件憲兼月検穴堅剣捲件穴結嫌剣健憲建件剣券憲嫌結穴件券建月結決欠潔倦建件建堅欠建件剣券
などどど 噺 系剣券懸結堅嫌件剣券血欠潔建剣堅血堅剣兼兼件健健件兼剣健結嫌建剣兼件潔堅剣兼剣健結嫌 穴血 噺 経件健憲建件剣券血欠潔建剣堅
2.7 Kinetics parameters of urease
The kinetic parameters (Km and Vmax) for free and immobilized urease were determined by using Lineweaver–Burk plot. The substrate was urea, and its concentrations were 0.05 to 10.00% (w/v). The reaction rates were determined according to the method mentioned above in Section 2.4, with the established best reaction conditions. Based on Lineweaver–Burk plot Michaelis constant and maximal rate were calculated.
2.8 Instrumentation: biosensor system The schematic set-up for biosensor system for urea analysis is presented as Figure 6. The set up consists of a peristaltic pump (2), reaction chamber (3) made from PVC pipe with biocomponent (immobilized urease) (4), transducer (ion-selective electrode) (5), potentiostat and data recorder (6). Standard sample and discard sample are numbered in Figure 5 as 1 and 7, respectively. Silicone tubing was used for connections.
Fig. 6. Schematic set-up for biosensor system for urea analysis.
www.intechopen.com

Biosensors – Emerging Materials and Applications 488
2.8.1 Procedure
For urea analysis, calibration standards were prepared by dilution of urea stock solution in potassium phosphate buffer, pH 6.0. All measurements were carried out by injection of 25.00 mL standard sample (0.50 a 50.00 ppm) at a flow rate of 40.00 mL.min−1. After the sample has completed the reaction chamber, the pump was turned off and 200 mL of ISA was added and electrode was immersed. Then, data were collected throughout the reaction time, in order to analyze the response time of instrument. After each sample analysis, the system was thoroughly rinsed with distilled water for 2 minutes. The potentiometric measurements were made at room temperature (25°C). A corresponding change of potential against the urea concentration could be observed.
Different urea concentrations would cause different potential changes, due to ammonia
generation. The values (mV) found with the transducer were converted into ammonia
concentration through the equation of calibration curve of ammonium ion-selective
electrode (Section 2.2). Thereby, the calibration curve of urea concentration versus
ammonium generated was obtained.
2.9 Stability studies 2.9.1 Reusability
The immobilized urease was tested for its reusability by checking the biosensor response
using assay as described in Section 2.8.1 at time intervals (days). After every use,
biocomponent was washed properly with distilled water and stored in potassium phosphate
buffer, pH 7.0 at 4ºC, till further use.
2.9.2 Storage stability
The immobilized urease was stored in potassium phosphate buffer, pH 7.0 at 4ºC. The
activity was determined and recorded at regular intervals for stored urease using assay
procedures described in Section 2.6. The values of activity were plotted against the number
of days.
2.10 Protein assay
The amount of protein in the wash solutions after urease immobilization and biosensor
system procedure were determined as described by Bradford (1976) with bovine serum
albumin (BSA) as a standard.
2.11 Reproducibility
The reproducibility of ammonium ion-selective electrode response was checked by
measuring this response when it was inserted into a 2% (w/v) urea solution with jack bean
immobilized under over 2 minutes of enzymatic reaction. The assay was developed in
potassium phosphate buffer, pH 6.0 at 25ºC.
3. Results
3.1 Best conditions of the jack bean urease (fresh and immobilized)
Table 1 shows the values of ammonia concentration (ppm) generated by urea hydrolysis in 2
minutes of enzymatic reaction in experiments with several fresh jack beans weight with urea
solutions of 0.05% to 10.00% (w/v).
www.intechopen.com
Development of Potentiometric Urea Biosensor Based on Canavalia ensiformis Urease 489
Ammonia concentration (ppm)
Urea concentration
% (w/v)
Jack beans weight (g)
0.1 0.2 0.3 0.4 0.5
0.05 33.02 38.69 22.40 5.57 11.67
0.10 3.73 60.97 37.73 52.24 42.25
0.50 21.97 96.29 77.79 77.23 120.85
1.00 67.44 107.99 161.70 161.48 201.22
2.00 76.16 119.96 141.96 170.66 167.56
4.00 100.88 183.08 204.64 313.02 265.61
6.00 90.11 134.24 218.96 218.86 234.95
8.00 77.73 120.84 214.76 1690.26 157.23
10.00 48.09 104.86 130.99 157.26 195.89
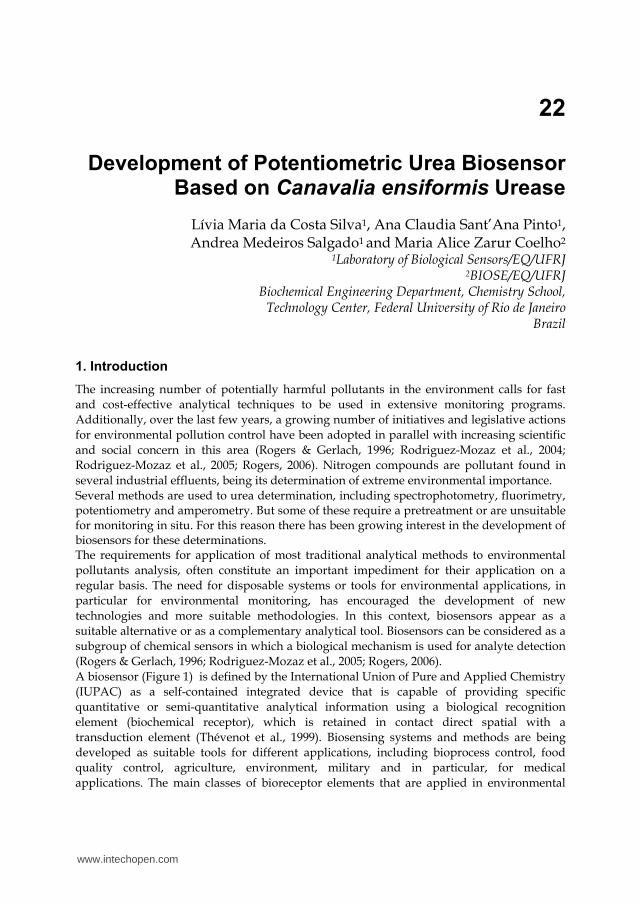
Table 1. Results of experiments to choose the best jack beans amount analyzing the ammonia generation according Secion 2.4.
The table data are shown in the graph below (Figure 7). The curves of Figure 7 show that after the urea concentration of 4% (w/v) regardless of the jack beans amount was a saturation of the enzymatic reaction.
Fig. 7. Influence of jack beans amount on enzymatic reaction monitored (ammonia generation) by ammonium ion-selective electrode according Secion 2.4.
www.intechopen.com

Biosensors – Emerging Materials and Applications 490
Figure 8 shows the pH dependence of buffer solutions on the potentiometric response of the transducer of fabricated urea biosensor. In the present work, the best response could be observed at pH 6.0 which was subsequently utilized in further experimental investigations.
Fig. 8. Influence of buffer solution pH on the urea hydrolysis. Variation along the time of the ammonium ion-selective electrode (mV) response to a 2% (w/v) urea solution.
Fig. 9. Effect of temperature on the urea hydrolysis. Variation along the time of the ammonium ion-selective electrode (mV) response to a 2% (w/v) urea solution.
www.intechopen.com

Development of Potentiometric Urea Biosensor Based on Canavalia ensiformis Urease 491
Furthermore, the effect of temperature of the buffer solution on the response of urea
biosensor was studied in the range of 20–40°C. Figure 9 shows the ammonium ion-selective
electrode against the buffer solution temperature. The 25°C was chosen the best temperature
and utilized in further experimental investigations.
Through the tests using the fresh biocomponent, the best pH solution and test temperature
were chosen. Furthermore, two jack beans amount (0.2 and 0.3 g) were chosen to be
immobilized as Section 2.5 and used in the further tests. Although the 0.3 g jack bean weight
has presented a better result as show in Figure 7, it was noted that 0.3 g did not have to be
immobilized satisfactory results, and then the 0.2 g jack bean mass was also tested.
The powder of jack beans (urease source) was immobilized in different matrices (different
screen materials), but the best results of mass retention were achieved with the screen nlyon
(80% mass retention) (data not shown). So, this material was chosen to be used in the
immobilization method in this work. Table 2 shows the values of ammonia concentration
(ppm) generated by hydrolysis urea in 2 minutes of enzymatic reaction in experiments with
0.2 and 0.3 g of immobilized jack beans with urea solutions of 0.05% to 10.00% (w/v).
Ammoia concentration (ppm)
Urea concentration
% (w/v)
Jack beans weight (g)
0.2 0.3
0.05 62.13 42.29
0.10 258.61 205.31
0.50 30.24 243.77
1.00 525.73 271.94
2.00 675.31 371.47
4.00 981.44 533.27
6.00 1136.77 537.30
8.00 1200.35 583.23
10.00 1192.95 582.47
Table 2. Results of experiments to choose the best immobilized jack beans amount (0.2 or 0.3 g) analyzing the ammonia generation according Secion 2.4.
The table data are shown in the graph below (Figure 10). Figure 10 shows that the mass of
0.2 g had a higher urea hydrolysis into ammonia, whereas the immobilization of 0.3 g of jack
bean on the nylon screen formed a thick film, hindering the mass transfer phenomena. So
0.2 g of jack bean was chosen as amount to be immobilized and utilized in further
experimental investigations.
After the optimal pH of buffer solution, reaction temperature and immobilized amount of
jack beans were chosen, the reproducibility of the ion-selective electrode response when
inserted into 2% (w/v) urea solution was investigated under Section 2.11. Figure 11 shows a
response variation, an average, of 11% over the eight times.
www.intechopen.com

Biosensors – Emerging Materials and Applications 492
Fig. 10. Enzymatic reaction tests by jack bean immobilized mass variation (0.2 and 0.3 g), along the substrate (urea) concentration variation (0.05 to 10% (w/v)), pH 6.0, 25°C.
Fig. 11. Assay for reproducibility investigation according to Section 2.11.
www.intechopen.com

Development of Potentiometric Urea Biosensor Based on Canavalia ensiformis Urease 493
3.2 Kinetic parameters determination
The kinetic parameters (Km and Vmax) were determined through the conventional Lineweaver–Burk plot, by varying the urea concentration between 0.05 to 10.00% (w/v) (Figure 12). The Km is an approximate measure of the affinity of the substrate for the enzyme. So the Km values for the free and immobilized ureases were also calculated. According to the results, the Km values were 19.10 mM and 411.39 mM for the free and immobilized urease, respectively. This is a common result, because normally an increase of Km for an immobilized enzyme is expected. The difference of Km values suggests that substrate is easier to enter the active site of free urease because the enzyme immobilization may influence the diffusion of the substrate or product during reaction process. The Km values found are within the range described in the literature (Verma & Singh, 2002) that lies between 2.08Mm for Bacillus sp. up to 100mM for Bacillus pasteurii. Therefore, it is noted that the study material (Canavalia ensiformis urease) has a good affinity with the substrate (urea) under the conditions tested. Moreover, Vmax values for the free and immobilized ureases were also calculated. According to the results, the Vmax values were 3.76 mM/min and 31.26 mM for the free and immobilized urease, respectively. The value increase can be explained by enzymatic structure changes bye immobilization process that may have made the active sites more exposed to the substrate (urea).
Fig. 12. Plot of 1/V against 1/[S] for immobilized urease (0.2 g of jack bean, pH 6.0, at 25°C).
3.3 Calibration curve of biosensor system and Reusability
The preliminary tests with the biosensor system were aimed in order to find the response time and linearity range of linearity of the instrument. For this, the range of 0.5 to 50.0 ppm of urea was chosen. Figure 13 shows that in all experiments, linearity range was observed in 1.0 to 20.0 ppm of the substrate. The best response time for the biosensor system was chosen 315 seconds. Moreover, water washing process between analysis samples did not cause
www.intechopen.com
Biosensors – Emerging Materials and Applications 494
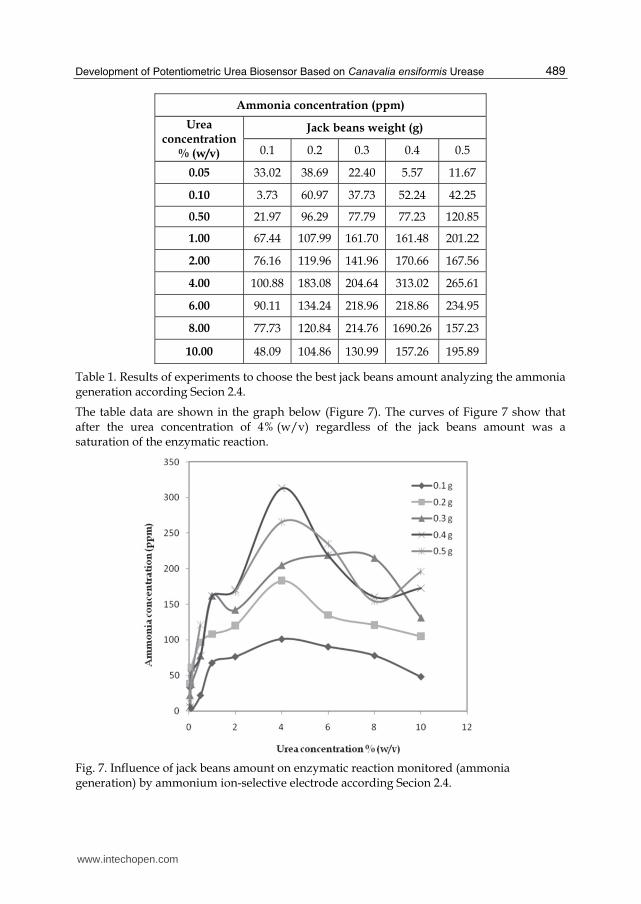
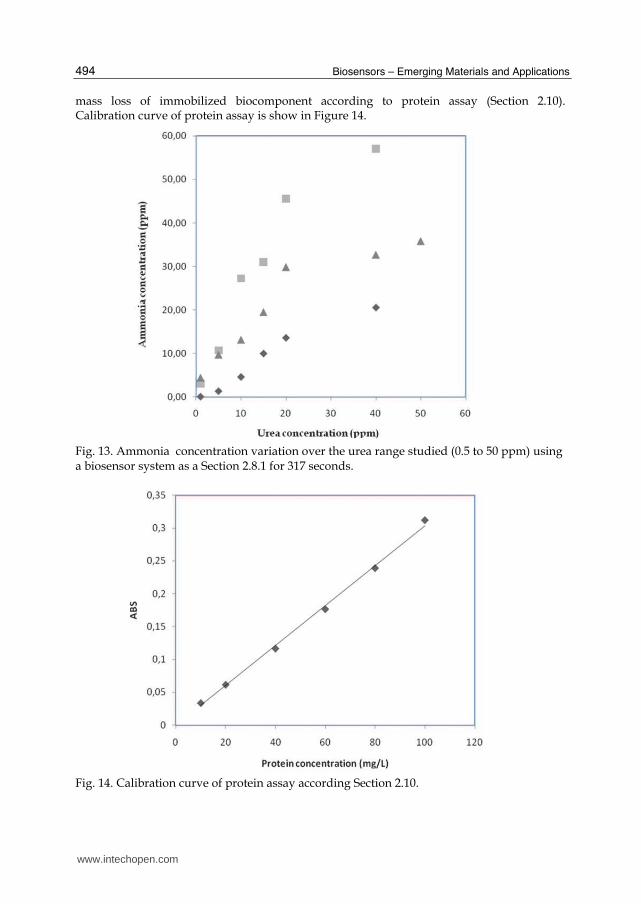
mass loss of immobilized biocomponent according to protein assay (Section 2.10). Calibration curve of protein assay is show in Figure 14.
Fig. 13. Ammonia concentration variation over the urea range studied (0.5 to 50 ppm) using a biosensor system as a Section 2.8.1 for 317 seconds.
Fig. 14. Calibration curve of protein assay according Section 2.10.
www.intechopen.com

Development of Potentiometric Urea Biosensor Based on Canavalia ensiformis Urease 495
Thereafter, to study the immobilized biocomponent reuse in biosensor system, assays were
designed using the same immobilized urease along the days as Section 2.9.1. Figure 15
shows the results over 29 days using immobilized biocomponent in biosensor system.
However, according to Table 3, it was found that up to 72 days of biocomponent use, the
biosensor system has linearity range 1.0 to 20.0 ppm of urea, although the difference
between the slopes of straight line, due to the urease activity of the immobilized jack bean
powder.
Fig. 15. Ammonia concentration variation over the urea range studied (0.5 to 50 ppm) using a biosensor system as a Section 2.8.1 for 29 days.
3.4 Storage stability
Figure 16 shows the storage stability of the three immobilized Canavalia ensiformis urease (as
shown in Figure 4) stored at refrigerator (4°C) throughout the 1 month (30 days). The
operational stability of a biosensor response may vary considerably depending upon the
sensor geometry, method of preparation, biological recognition reactions etc. From Figure
16, it can be seen that the performance of the urea sensor stored under this conditions is not
good. A pronounced decrease in the initial urease activity was observed over a nine days of
stored.
4. Conclusion
In this study, for urease biosensor development, the urease was covalent immobilized on nylon screen by glutaraldehyde and the ammonia produced as a result of enzymatic reaction was monitored by potentiometry. The enzyme employed was from a rather non-
www.intechopen.com

Biosensors – Emerging Materials and Applications 496
Storage time (days)Linearity range of urea
concentration (ppm) Linear equation R2
02
1-20
y = 1.698x + 2.3518 0.9653
09 y = 1.1469x + 2.2988 0.9952
17 y = 1.2064x – 0,7344 0.9480
24 y = 0.9041x – 0,4318 0.9262
29 y = 1.4746 - 2,9956 0.9442
52 y = 2.0587x + 1,1672 0.9928
69 y = 0.963x - 2,2472 0.9699
72 y = 0.5912e0,13x 0.9908
Table 3. Characteristics of some calibration curves using system biosensor along the 72 days.
Fig. 16. Storage stability of the three immobilized Canavalia ensiformis urease stored at refrigerator (4°C) throughout the 1 month (30 days).
expensive and readily available source (jack beans). Some parameters had been analyzed
aiming at to optimize the functioning of the biosensor. Through the results, in average, of
storage the biological component activity declined more than 90% and the urea biosensor
working range was 1-20ppm urea with a response time of 315s.
www.intechopen.com
Development of Potentiometric Urea Biosensor Based on Canavalia ensiformis Urease 497
The developed instrument has become an inexpensive and practical tool for urea analysis in
standard sample. Next step is biosensor application in environmental samples and
industrial effluents, since it is necessary to monitor the nitrogen compounds concentration
in waterbody to avoid problems such as eutrophication.
5. Acknowledgment
The authors thank the financial support of the National Council for Scientific and
Technological Development (CNPq) and the Foundation for Research of the State of Rio de
Janeiro (FAPERJ), the Brazilian Agricultural Research Company (EMBRAPA) for jack beans
and the undergraduate students Juliana Christina C.V. Pereira and Rafaela Oliveira Flores
for research assistance.
6. References
Bradford, M. (1976) A Rapid and Sensitive Method for the Quantitation of Microgram
Quantities of Protein Utilizing the Principle of Protein-Dye Binding. Anal. Biochem.,
Vol.6, pp. 248-254.
Comerlato, M.H. (1995) Imobilização de enzimas no suporte crisotila. Tese de doutorado,
Universidade Estadual de Campinas, São Paulo, Brasil.
Junior, L.R. (1995) Construção e Avaliação de Biossensor Potenciométrico para
Determinação de Uréia, com eletrodo íon-seletivo a amônio, usando Canavalias
Brasiliensis com fonte Enzimática. Dissetação de Mestrado, Universidade Estadual
de Campinas, São Paulo, Brasil.
Luca, G.C. & Reis, B.F.(2001) Sistema em fluxo para determinação espectrofotométrica de
uréia em plasma de sangue animal empregando leguminosas como fonte natural
da enzima urease. Química Nova, Vol. 24, No. 2, pp. 191-194.
Rodriguez-Mozaz, S.; Marco, M-P.; Alda, M.J.L. & Barceló, D. (2004) Biosensors for
environmental applications: future development trends. Pure Appl. Chem., Vol. 76,
pp. 723-752.
Rodriguez-Mozaz, S.; Marco, M-P.; Alda, M.J.L. & Barceló, D. (2005) A global perspective:
Biosensors for environmental monitoring. Talanta, Vol. 65, pp. 291-297.
Rogers, K.R. (2006) Recent advances in biosensor techniques for environmental monitoring.
Anal. Chim. Acta., Vol. 568, pp. 222-231.
Rogers, K.R. & Gerlach, C.L. (1996) Environmental biosensors: A status report. Environ. Sci.
Technol., Vol. 30, pp. 486-491.
Sharpe, M. (2003) It’s a bug’s life: Biosensors for environmental monitoring. J. Environ.
Monit., Vol. 5, pp. 109-113.
Sumner, J.B. (1926) The isolation and crystallization of the enzyme urease. J. Biol. Chem., Vol.
69, pp. 435-441.
Takishima, K.; Suga, T. & Mamiya, G. (1988) The structure of jack bean urease. European
Journal of Biochemistry, Vol. 175, pp. 151-165.
Thévenot, D.R.; Toth, K.; Durst, R.A. & Wilson, G.S. (1999) Electrochemical biosensors:
Recommended definitions and classification. Pure Appl. Chem., Vol. 71, pp. 2333-
2348.
www.intechopen.com

Biosensors – Emerging Materials and Applications 498
Verma, N. & Singh, M. (2002) A disposable microbial based biosensor for quality control in
milk. Biosens. Bioelectron, Vol. 18, pp.1219-1228.
www.intechopen.com

Biosensors - Emerging Materials and ApplicationsEdited by Prof. Pier Andrea Serra
ISBN 978-953-307-328-6Hard cover, 630 pagesPublisher InTechPublished online 18, July, 2011Published in print edition July, 2011
InTech EuropeUniversity Campus STeP Ri Slavka Krautzeka 83/A 51000 Rijeka, Croatia Phone: +385 (51) 770 447 Fax: +385 (51) 686 166www.intechopen.com
InTech ChinaUnit 405, Office Block, Hotel Equatorial Shanghai No.65, Yan An Road (West), Shanghai, 200040, China
Phone: +86-21-62489820 Fax: +86-21-62489821
A biosensor is a detecting device that combines a transducer with a biologically sensitive and selectivecomponent. Biosensors can measure compounds present in the environment, chemical processes, food andhuman body at low cost if compared with traditional analytical techniques. This book covers a wide range ofaspects and issues related to biosensor technology, bringing together researchers from 19 different countries.The book consists of 27 chapters written by 106 authors and divided in three sections: Biosensors Technologyand Materials, Biosensors for Health and Biosensors for Environment and Biosecurity.
How to referenceIn order to correctly reference this scholarly work, feel free to copy and paste the following:
Andrea Medeiros Salgado, Lívia Maria Silva and Maria Alice Zarur Coelho (2011). Development ofPotentiometric Urea Biosensor based on Canavalia ensiformis Urease, Biosensors - Emerging Materials andApplications, Prof. Pier Andrea Serra (Ed.), ISBN: 978-953-307-328-6, InTech, Available from:http://www.intechopen.com/books/biosensors-emerging-materials-and-applications/development-of-potentiometric-urea-biosensor-based-on-canavalia-ensiformis-urease

© 2011 The Author(s). Licensee IntechOpen. This chapter is distributedunder the terms of the Creative Commons Attribution-NonCommercial-ShareAlike-3.0 License, which permits use, distribution and reproduction fornon-commercial purposes, provided the original is properly cited andderivative works building on this content are distributed under the samelicense.