Embed Size (px)
Citation preview
Introduction Biotherapeutic proteins, such as monoclonal antibodies, have proven to be highly effective as drugs. Antibodies against these drugs (anti-drug antibodies) can be utilized
in assays to detect the drugs in patient samples. In this application note, we show how different types of anti-drug antibodies can be used with AlphaLISA® technology to not only quantify the amount of drug in serum, but also to detect, distinguish, and quantify free and bound drug in a single sample.
Anti-inflammatory monoclonal antibody drugs that specifically target TNFα, such as Humira®, have been highly successful in the market. As patents expire on these top-selling drugs, effort has been placed on developing biosimilars. Biosimilars differ from small molecule generic drugs in that their chemical structure does not have to be exactly the same as the patented drug. Therefore, the FDA has stringent requirements for proving that the biosimilars have the same efficacy and safety profile as the patented drug. Companies that develop biosimilars are tasked with proving that the biosimilar shows equivalent pharmacokinetics as the patented drug. Proving “biosimilarity” involves comparing parameters such as overall exposure, absorption, half-life, and clearance time using patient samples. Sensitive, robust, and fast assays are needed to measure these parameters. Traditional methods for detecting and quantifying these drugs in patient samples include time-consuming, wash-based ELISA and MSD methods. In contrast, AlphaLISA allows for fast, no-wash, high-throughput detection and quantification of the drug of interest in a variety of sample matrices.
Development of Pharmacokinetic (PK) Assays for Detecting Biosimilars Targeting TNFα Using AlphaLISA
A P P L I C A T I O N N O T E
Authors:
Jen Carlstrom
Todd Wilchek
Anne Kwei
Stephen Hurt
PerkinElmer, Inc. Hopkinton, MA
AlphaLISA Technology
2
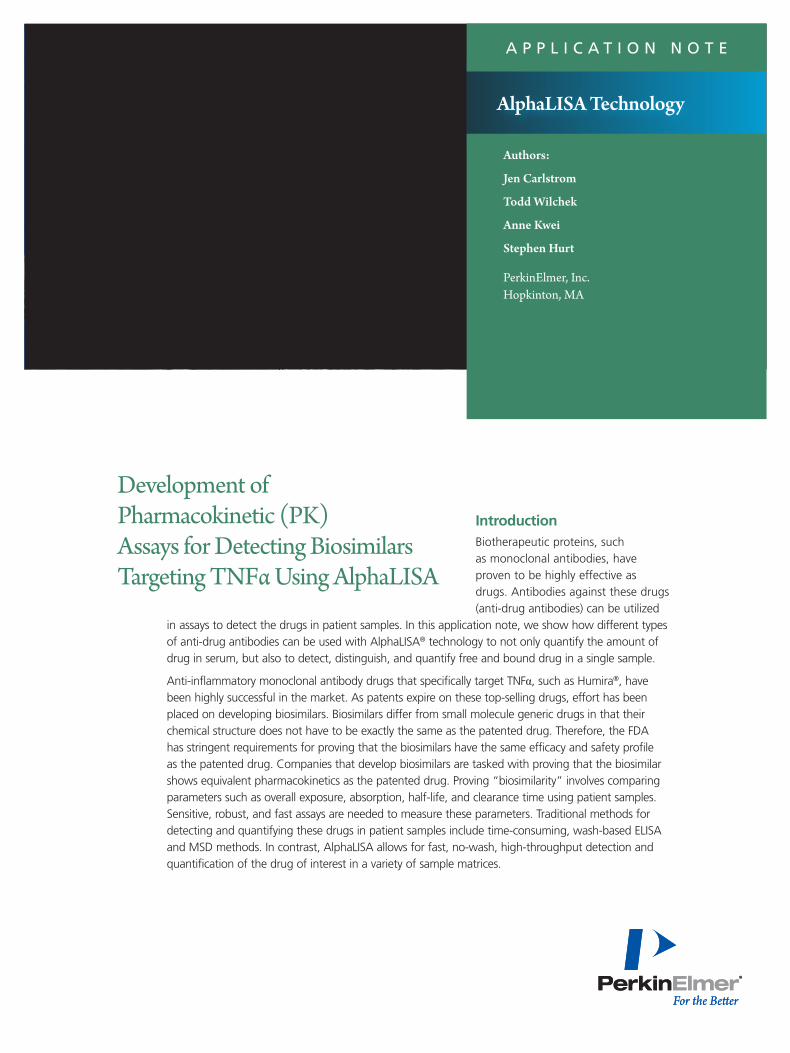
Anti-drug antibodies (ADA) can be naturally developed in patients that take drugs on a regular basis. Anti-drug antibodies have also been developed in vitro and utilized in assays to detect these drugs in patient samples. For example, Bio-Rad Laboratories has developed three types of drug-specific antibodies with different binding modes that can be used to detect drugs targeting TNFα in various forms within patient samples. Type 1 anti-drug antibodies are defined as antibodies that detect only the free drug (Figure 1). These are inhibitory in the sense that they can disrupt binding of the drug to its target. Type 2 anti-drug antibodies are defined as antibodies that can detect total drug (both free and bound drug). Type 3 anti-drug antibodies are defined as those that can only detect the drug in complex with its target. In collaboration with Bio-Rad we have developed fast, sensitive, and specific assays for detection of drugs within patient samples using AlphaLISA technology.
To detect the biosimilar drug in a sample using AlphaLISA, the different types of anti-drug antibodies were either biotinylated or conjugated to the acceptor beads. The biotinylated antibody binds the streptavidin donor beads. The biosimilar drug binds both antibodies, bringing the donor and acceptor beads in proximity. Once the beads are in proximity, Alpha signal is generated by exciting the donor beads and measuring the signal generated by the acceptor beads. Figure 2 shows a schematic representation of the AlphaLISA assay for detecting a biosimilar drug in a patient sample. Alpha technology can be used to detect samples in a variety of matrices. In this application note, we explore using different combinations of Type 1, 2, and 3 antibodies for detection and quantification of free and complexed drug in serum samples.
Materials and Methods
InstrumentationAll AlphaLISA measurements were performed on the PerkinElmer EnVision™ Multimode Plate Reader. Mirror module barcode 653 (Cat# 2102-5900) was used for simultaneous reads of AlphaLISA (Europium) and AlphaPlex 545 (Terbium). The filter used was Resorufine/Amplex Red (cat# 2102-5570).
Biosimilars and Antibodies to BiosimilarsAnti-Adalimumab (HCA204, HCA205, HCA232), Anti-Infliximab (HCA213, HCA216), Anti-Golimumab (HCA241, HCA243, HCA245) antibodies and TNFα (PHP051A) are commercially available from Bio-Rad. The Adalimumab, Infliximab, and Golimumab analytes were gifts from Bio-Rad.
Figure 1. Schematic for modes of binding for different types of anti-drug antibodies (ADA) for TNFα. Type 1 anti-drug antibodies only detect the free drug and interfere with the drug binding to the target (in this case TNFα). Type 2 anti-drug antibodies detect total drug (free, partially bound, and fully bound) and they do not interfere with TNFα binding. Type 3 anti-drug antibodies only detect the drug in complex with the TNFα and do not interfere with TNFα binding.
Figure 2. AlphaLISA schematic representation for detecting biosimilar drugs in patient samples. The biotinylated anti-drug antibody and anti-drug antibody conjugated acceptor beads are incubated with the drug. Then streptavidin donor beads are added and incubated with the drug-anti-drug complex. When the donor beads are excited at 680 nM, singlet oxygen is formed. When the acceptor beads are close enough (within 200 nm), the singlet oxygen excites the acceptor beads leading to a signal.
Antibody Biotinylation and AlphaLISA Acceptor Bead Conjugation Biotinylation of antibodies (Bio-Rad) was performed with the ChromaLink™ biotinylating reagent using standard biotinylation and purification procedures. Briefly, 0.05 mg of antibody and 3.8 μL of biotinylating reagent (2 mg/mL) were mixed together at a 30:1 molar biotin/antibody ratio. The reaction volume was completed to 0.1 mL with PBS pH 7.4, and the reaction was incubated for two hours at room temperature (~23 °C). Purification of the biotinylated antibody was performed using a Zeba 0.5 mL desalting column. The ratio of biotinylation of the final product and the protein recovery were determined from absorbance readings at 354 nm and 280 nm, respectively.
For AlphaLISA Acceptor Bead (PerkinElmer cat# 6772001) conjugations, 0.05 mg of antibody (Bio-Rad), 0.0625% of Tween-20, 2.5 mg of AlphaLISA beads and 1.25 mg/mL of NaBH3CN were mixed together. The reaction volume was adjusted to 0.1 mL with 50 mM Hepes pH 7.4 (final) and the reaction was incubated for 18 hours at 37 °C. The reaction was stopped by the addition of 5 μL of a 65 mg/mL CMO solution and incubation for one hour at 37 °C. Beads were then washed twice by centrifugation for 15 minutes (14,000 g/4 °C) and the bead pellet was re-suspended in 0.5 mL of 100 mM Tris pH 8.0. After a third centrifugation step, the beads were re-suspended at 5 mg/mL in PBS pH 7.2 containing 0.05% Proclin-300.
For AlphaPlex™ 545 Acceptor Bead (PerkinElmer cat# 6782002) conjugations, the same protocol was used as the AlphaLISA Acceptor Bead conjugations; however, the beads were centrifuged at room temperature instead of 4 °C.
AlphaLISA and AlphaPlex AssaysAs outlined in Figure 3A, various concentrations of drug or drug in complex with TNFα were diluted into FBS or AlphaLISA Hiblock buffer (PerkinElmer cat# AL004C) and then added to a 96-well ½-Area Plate (PerkinElmer cat# 6005560). The total reaction volume was 50 μL. The final concentration of the beads was 20 μg/mL of the anti-drug AlphaLISA Acceptor beads and 20 μg/mL of Streptavidin Donor beads. The final biotinylated antibody concentration in each reaction was 1 nM. The beads and antibodies were diluted in AlphaLISA Hiblock buffer and for most examples shown (unless otherwise stated), the final concentration of FBS (Gibco cat# 10437) in each reaction was 10%.
3
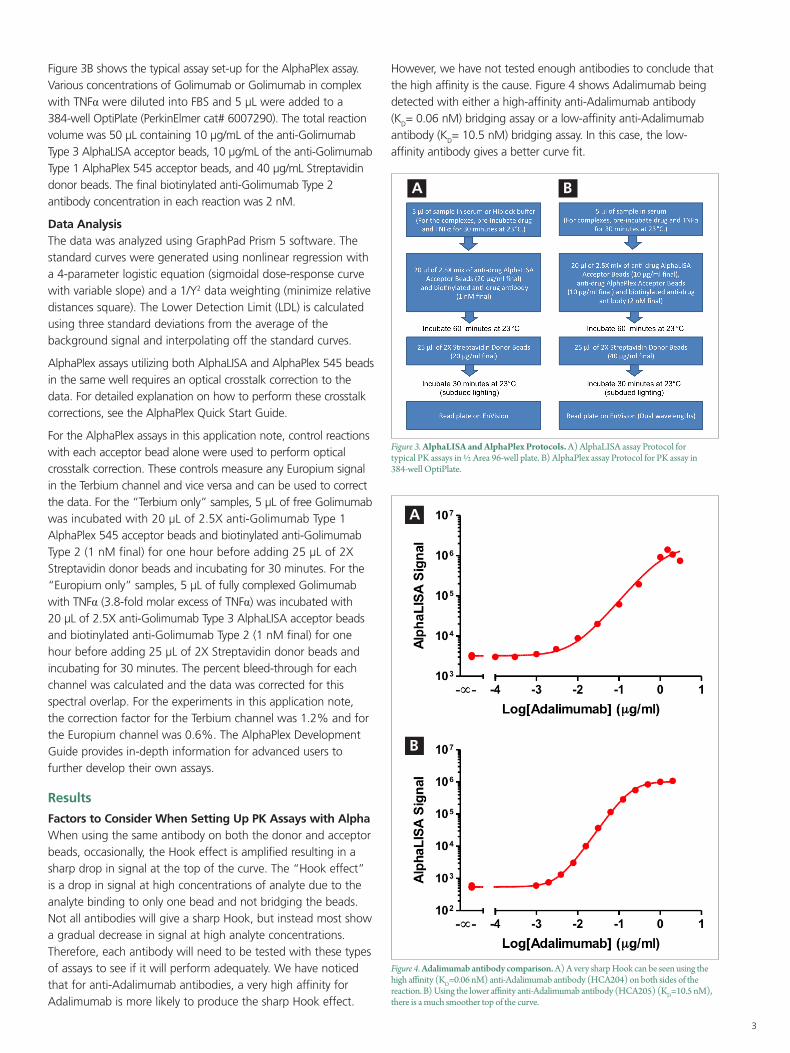
Figure 3B shows the typical assay set-up for the AlphaPlex assay. Various concentrations of Golimumab or Golimumab in complex with TNFα were diluted into FBS and 5 μL were added to a 384-well OptiPlate (PerkinElmer cat# 6007290). The total reaction volume was 50 μL containing 10 μg/mL of the anti-Golimumab Type 3 AlphaLISA acceptor beads, 10 μg/mL of the anti-Golimumab Type 1 AlphaPlex 545 acceptor beads, and 40 μg/mL Streptavidin donor beads. The final biotinylated anti-Golimumab Type 2 antibody concentration in each reaction was 2 nM.
Data AnalysisThe data was analyzed using GraphPad Prism 5 software. The standard curves were generated using nonlinear regression with a 4-parameter logistic equation (sigmoidal dose-response curve with variable slope) and a 1/Y2 data weighting (minimize relative distances square). The Lower Detection Limit (LDL) is calculated using three standard deviations from the average of the background signal and interpolating off the standard curves.
AlphaPlex assays utilizing both AlphaLISA and AlphaPlex 545 beads in the same well requires an optical crosstalk correction to the data. For detailed explanation on how to perform these crosstalk corrections, see the AlphaPlex Quick Start Guide.
For the AlphaPlex assays in this application note, control reactions with each acceptor bead alone were used to perform optical crosstalk correction. These controls measure any Europium signal in the Terbium channel and vice versa and can be used to correct the data. For the “Terbium only” samples, 5 μL of free Golimumab was incubated with 20 μL of 2.5X anti-Golimumab Type 1 AlphaPlex 545 acceptor beads and biotinylated anti-Golimumab Type 2 (1 nM final) for one hour before adding 25 μL of 2X Streptavidin donor beads and incubating for 30 minutes. For the “Europium only” samples, 5 μL of fully complexed Golimumab with TNFα (3.8-fold molar excess of TNFα) was incubated with 20 μL of 2.5X anti-Golimumab Type 3 AlphaLISA acceptor beads and biotinylated anti-Golimumab Type 2 (1 nM final) for one hour before adding 25 μL of 2X Streptavidin donor beads and incubating for 30 minutes. The percent bleed-through for each channel was calculated and the data was corrected for this spectral overlap. For the experiments in this application note, the correction factor for the Terbium channel was 1.2% and for the Europium channel was 0.6%. The AlphaPlex Development Guide provides in-depth information for advanced users to further develop their own assays.
Results
Factors to Consider When Setting Up PK Assays with AlphaWhen using the same antibody on both the donor and acceptor beads, occasionally, the Hook effect is amplified resulting in a sharp drop in signal at the top of the curve. The “Hook effect” is a drop in signal at high concentrations of analyte due to the analyte binding to only one bead and not bridging the beads. Not all antibodies will give a sharp Hook, but instead most show a gradual decrease in signal at high analyte concentrations. Therefore, each antibody will need to be tested with these types of assays to see if it will perform adequately. We have noticed that for anti-Adalimumab antibodies, a very high affinity for Adalimumab is more likely to produce the sharp Hook effect.
However, we have not tested enough antibodies to conclude that the high affinity is the cause. Figure 4 shows Adalimumab being detected with either a high-affinity anti-Adalimumab antibody (KD= 0.06 nM) bridging assay or a low-affinity anti-Adalimumab antibody (KD= 10.5 nM) bridging assay. In this case, the low-affinity antibody gives a better curve fit.
Figure 3. AlphaLISA and AlphaPlex Protocols. A) AlphaLISA assay Protocol for typical PK assays in ½ Area 96-well plate. B) AlphaPlex assay Protocol for PK assay in 384-well OptiPlate.
A B
Figure 4. Adalimumab antibody comparison. A) A very sharp Hook can be seen using the high affinity (KD=0.06 nM) anti-Adalimumab antibody (HCA204) on both sides of the reaction. B) Using the lower affinity anti-Adalimumab antibody (HCA205) (KD=10.5 nM), there is a much smoother top of the curve.
A
B
4
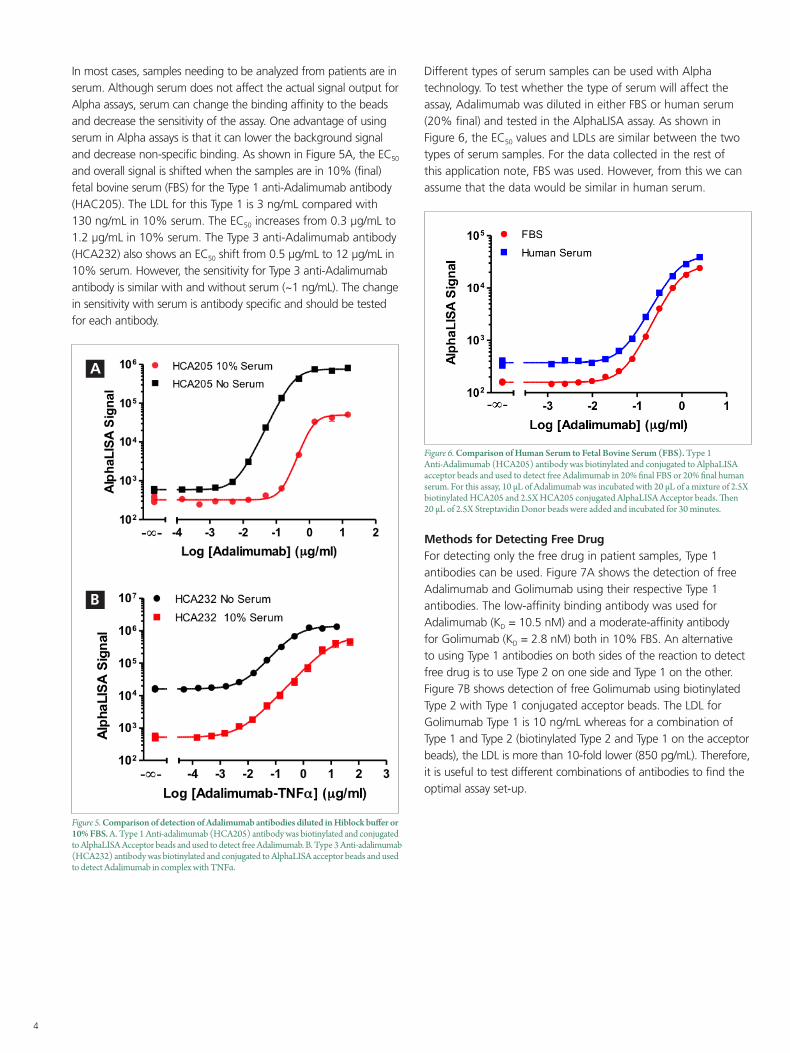
In most cases, samples needing to be analyzed from patients are in serum. Although serum does not affect the actual signal output for Alpha assays, serum can change the binding affinity to the beads and decrease the sensitivity of the assay. One advantage of using serum in Alpha assays is that it can lower the background signal and decrease non-specific binding. As shown in Figure 5A, the EC50 and overall signal is shifted when the samples are in 10% (final) fetal bovine serum (FBS) for the Type 1 anti-Adalimumab antibody (HAC205). The LDL for this Type 1 is 3 ng/mL compared with 130 ng/mL in 10% serum. The EC50 increases from 0.3 µg/mL to 1.2 µg/mL in 10% serum. The Type 3 anti-Adalimumab antibody (HCA232) also shows an EC50 shift from 0.5 µg/mL to 12 µg/mL in 10% serum. However, the sensitivity for Type 3 anti-Adalimumab antibody is similar with and without serum (~1 ng/mL). The change in sensitivity with serum is antibody specific and should be tested for each antibody.
Figure 5. Comparison of detection of Adalimumab antibodies diluted in Hiblock buffer or 10% FBS. A. Type 1 Anti-adalimumab (HCA205) antibody was biotinylated and conjugated to AlphaLISA Acceptor beads and used to detect free Adalimumab. B. Type 3 Anti-adalimumab (HCA232) antibody was biotinylated and conjugated to AlphaLISA acceptor beads and used to detect Adalimumab in complex with TNFα.
A
B
Different types of serum samples can be used with Alpha technology. To test whether the type of serum will affect the assay, Adalimumab was diluted in either FBS or human serum (20% final) and tested in the AlphaLISA assay. As shown in Figure 6, the EC50 values and LDLs are similar between the two types of serum samples. For the data collected in the rest of this application note, FBS was used. However, from this we can assume that the data would be similar in human serum.
Figure 6. Comparison of Human Serum to Fetal Bovine Serum (FBS). Type 1 Anti-Adalimumab (HCA205) antibody was biotinylated and conjugated to AlphaLISA acceptor beads and used to detect free Adalimumab in 20% final FBS or 20% final human serum. For this assay, 10 µL of Adalimumab was incubated with 20 µL of a mixture of 2.5X biotinylated HCA205 and 2.5X HCA205 conjugated AlphaLISA Acceptor beads. Then 20 µL of 2.5X Streptavidin Donor beads were added and incubated for 30 minutes.
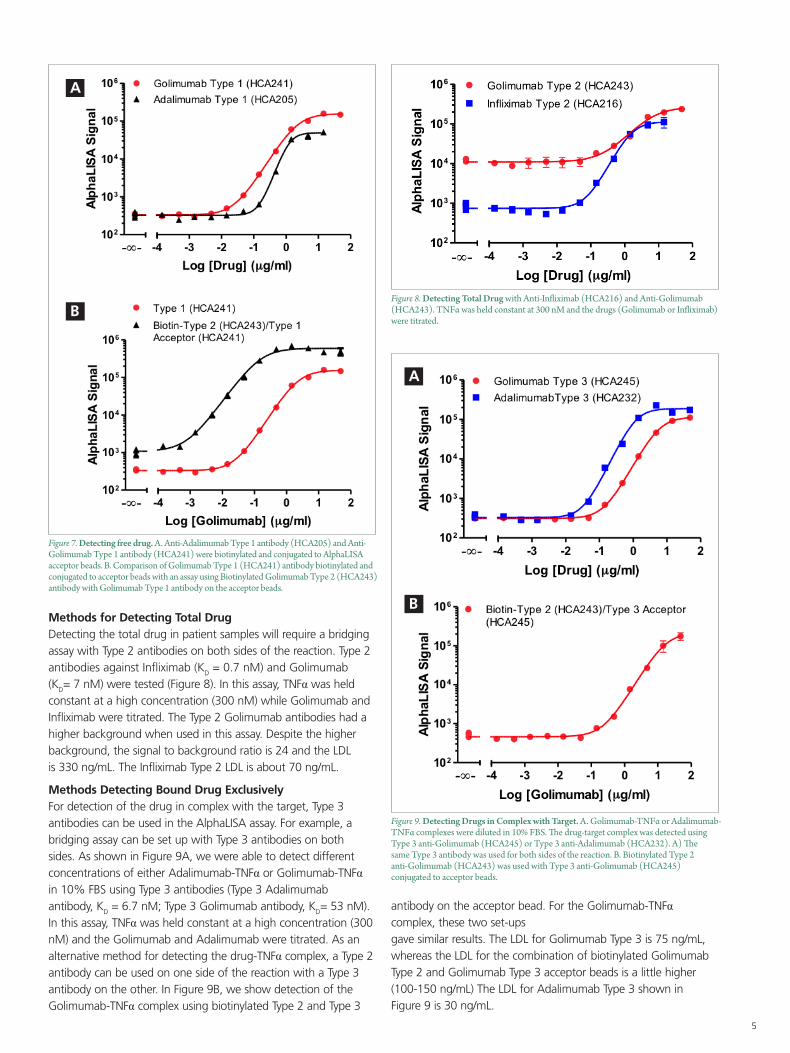
Methods for Detecting Free DrugFor detecting only the free drug in patient samples, Type 1 antibodies can be used. Figure 7A shows the detection of free Adalimumab and Golimumab using their respective Type 1 antibodies. The low-affinity binding antibody was used for Adalimumab (KD = 10.5 nM) and a moderate-affinity antibody for Golimumab (KD = 2.8 nM) both in 10% FBS. An alternative to using Type 1 antibodies on both sides of the reaction to detect free drug is to use Type 2 on one side and Type 1 on the other. Figure 7B shows detection of free Golimumab using biotinylated Type 2 with Type 1 conjugated acceptor beads. The LDL for Golimumab Type 1 is 10 ng/mL whereas for a combination of Type 1 and Type 2 (biotinylated Type 2 and Type 1 on the acceptor beads), the LDL is more than 10-fold lower (850 pg/mL). Therefore, it is useful to test different combinations of antibodies to find the optimal assay set-up.
5
Figure 7. Detecting free drug. A. Anti-Adalimumab Type 1 antibody (HCA205) and Anti-Golimumab Type 1 antibody (HCA241) were biotinylated and conjugated to AlphaLISA acceptor beads. B. Comparison of Golimumab Type 1 (HCA241) antibody biotinylated and conjugated to acceptor beads with an assay using Biotinylated Golimumab Type 2 (HCA243) antibody with Golimumab Type 1 antibody on the acceptor beads.
A
B
Methods for Detecting Total DrugDetecting the total drug in patient samples will require a bridging assay with Type 2 antibodies on both sides of the reaction. Type 2 antibodies against Infliximab (KD = 0.7 nM) and Golimumab (KD= 7 nM) were tested (Figure 8). In this assay, TNFα was held constant at a high concentration (300 nM) while Golimumab and Infliximab were titrated. The Type 2 Golimumab antibodies had a higher background when used in this assay. Despite the higher background, the signal to background ratio is 24 and the LDL is 330 ng/mL. The Infliximab Type 2 LDL is about 70 ng/mL.
Methods Detecting Bound Drug ExclusivelyFor detection of the drug in complex with the target, Type 3 antibodies can be used in the AlphaLISA assay. For example, a bridging assay can be set up with Type 3 antibodies on both sides. As shown in Figure 9A, we were able to detect different concentrations of either Adalimumab-TNFα or Golimumab-TNFα in 10% FBS using Type 3 antibodies (Type 3 Adalimumab antibody, KD = 6.7 nM; Type 3 Golimumab antibody, KD= 53 nM). In this assay, TNFα was held constant at a high concentration (300 nM) and the Golimumab and Adalimumab were titrated. As an alternative method for detecting the drug-TNFα complex, a Type 2 antibody can be used on one side of the reaction with a Type 3 antibody on the other. In Figure 9B, we show detection of the Golimumab-TNFα complex using biotinylated Type 2 and Type 3
Figure 8. Detecting Total Drug with Anti-Infliximab (HCA216) and Anti-Golimumab (HCA243). TNFα was held constant at 300 nM and the drugs (Golimumab or Infliximab) were titrated.
Figure 9. Detecting Drugs in Complex with Target. A. Golimumab-TNFα or Adalimumab-TNFα complexes were diluted in 10% FBS. The drug-target complex was detected using Type 3 anti-Golimumab (HCA245) or Type 3 anti-Adalimumab (HCA232). A) The same Type 3 antibody was used for both sides of the reaction. B. Biotinylated Type 2 anti-Golimumab (HCA243) was used with Type 3 anti-Golimumab (HCA245) conjugated to acceptor beads.
A
B
antibody on the acceptor bead. For the Golimumab-TNFα complex, these two set-ups gave similar results. The LDL for Golimumab Type 3 is 75 ng/mL, whereas the LDL for the combination of biotinylated Golimumab Type 2 and Golimumab Type 3 acceptor beads is a little higher (100-150 ng/mL) The LDL for Adalimumab Type 3 shown in Figure 9 is 30 ng/mL.
6
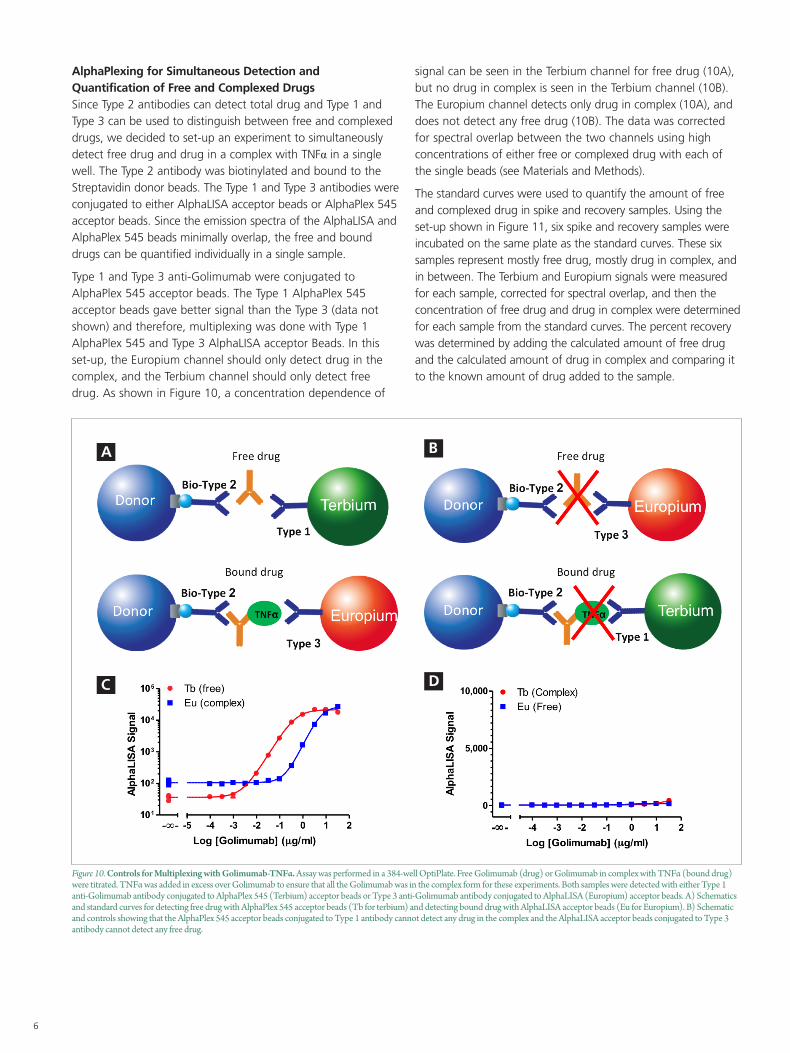
AlphaPlexing for Simultaneous Detection and Quantification of Free and Complexed DrugsSince Type 2 antibodies can detect total drug and Type 1 and Type 3 can be used to distinguish between free and complexed drugs, we decided to set-up an experiment to simultaneously detect free drug and drug in a complex with TNFα in a single well. The Type 2 antibody was biotinylated and bound to the Streptavidin donor beads. The Type 1 and Type 3 antibodies were conjugated to either AlphaLISA acceptor beads or AlphaPlex 545 acceptor beads. Since the emission spectra of the AlphaLISA and AlphaPlex 545 beads minimally overlap, the free and bound drugs can be quantified individually in a single sample.
Type 1 and Type 3 anti-Golimumab were conjugated to AlphaPlex 545 acceptor beads. The Type 1 AlphaPlex 545 acceptor beads gave better signal than the Type 3 (data not shown) and therefore, multiplexing was done with Type 1 AlphaPlex 545 and Type 3 AlphaLISA acceptor Beads. In this set-up, the Europium channel should only detect drug in the complex, and the Terbium channel should only detect free drug. As shown in Figure 10, a concentration dependence of
signal can be seen in the Terbium channel for free drug (10A), but no drug in complex is seen in the Terbium channel (10B). The Europium channel detects only drug in complex (10A), and does not detect any free drug (10B). The data was corrected for spectral overlap between the two channels using high concentrations of either free or complexed drug with each of the single beads (see Materials and Methods).
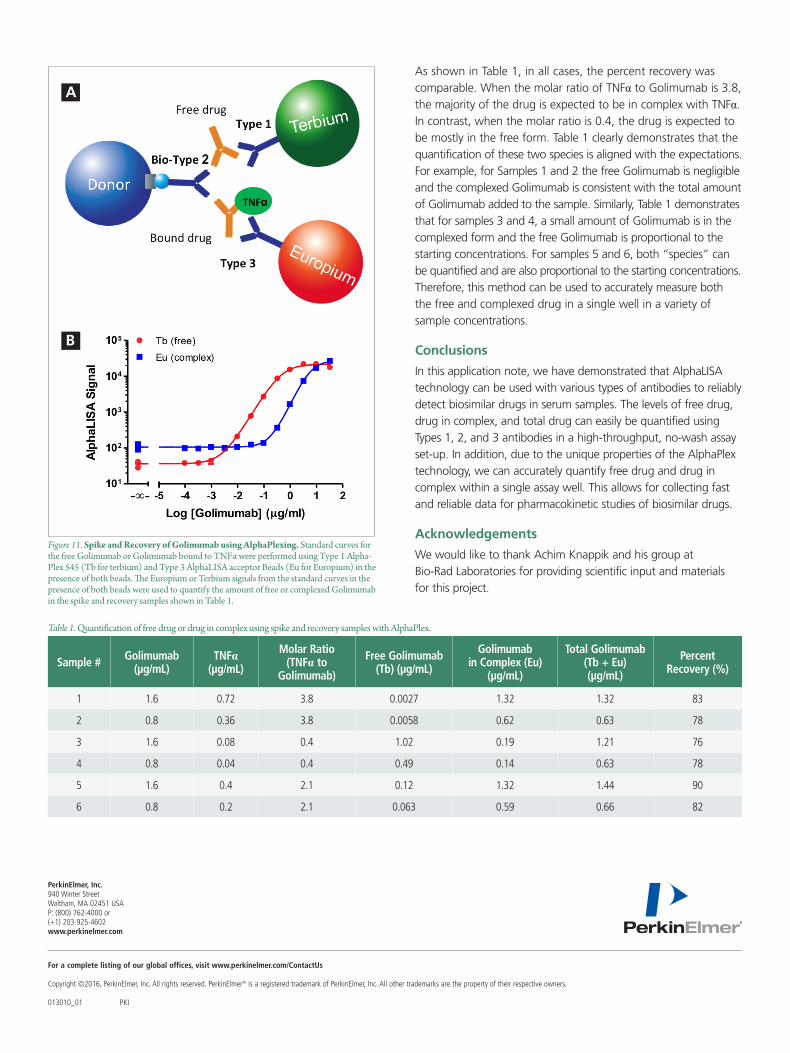
The standard curves were used to quantify the amount of free and complexed drug in spike and recovery samples. Using the set-up shown in Figure 11, six spike and recovery samples were incubated on the same plate as the standard curves. These six samples represent mostly free drug, mostly drug in complex, and in between. The Terbium and Europium signals were measured for each sample, corrected for spectral overlap, and then the concentration of free drug and drug in complex were determined for each sample from the standard curves. The percent recovery was determined by adding the calculated amount of free drug and the calculated amount of drug in complex and comparing it to the known amount of drug added to the sample.
Figure 10. Controls for Multiplexing with Golimumab-TNFα. Assay was performed in a 384-well OptiPlate. Free Golimumab (drug) or Golimumab in complex with TNFα (bound drug) were titrated. TNFα was added in excess over Golimumab to ensure that all the Golimumab was in the complex form for these experiments. Both samples were detected with either Type 1 anti-Golimumab antibody conjugated to AlphaPlex 545 (Terbium) acceptor beads or Type 3 anti-Golimumab antibody conjugated to AlphaLISA (Europium) acceptor beads. A) Schematics and standard curves for detecting free drug with AlphaPlex 545 acceptor beads (Tb for terbium) and detecting bound drug with AlphaLISA acceptor beads (Eu for Europium). B) Schematic and controls showing that the AlphaPlex 545 acceptor beads conjugated to Type 1 antibody cannot detect any drug in the complex and the AlphaLISA acceptor beads conjugated to Type 3 antibody cannot detect any free drug.
A
C
B
D
For a complete listing of our global offices, visit www.perkinelmer.com/ContactUs
Copyright ©2016, PerkinElmer, Inc. All rights reserved. PerkinElmer® is a registered trademark of PerkinElmer, Inc. All other trademarks are the property of their respective owners. 013010_01 PKI
PerkinElmer, Inc. 940 Winter Street Waltham, MA 02451 USA P: (800) 762-4000 or (+1) 203-925-4602www.perkinelmer.com
Figure 11. Spike and Recovery of Golimumab using AlphaPlexing. Standard curves for the free Golimumab or Golimumab bound to TNFα were performed using Type 1 Alpha-Plex 545 (Tb for terbium) and Type 3 AlphaLISA acceptor Beads (Eu for Europium) in the presence of both beads. The Europium or Terbium signals from the standard curves in the presence of both beads were used to quantify the amount of free or complexed Golimumab in the spike and recovery samples shown in Table 1.
A
B
As shown in Table 1, in all cases, the percent recovery was comparable. When the molar ratio of TNFα to Golimumab is 3.8, the majority of the drug is expected to be in complex with TNFα. In contrast, when the molar ratio is 0.4, the drug is expected to be mostly in the free form. Table 1 clearly demonstrates that the quantification of these two species is aligned with the expectations. For example, for Samples 1 and 2 the free Golimumab is negligible and the complexed Golimumab is consistent with the total amount of Golimumab added to the sample. Similarly, Table 1 demonstrates that for samples 3 and 4, a small amount of Golimumab is in the complexed form and the free Golimumab is proportional to the starting concentrations. For samples 5 and 6, both “species” can be quantified and are also proportional to the starting concentrations. Therefore, this method can be used to accurately measure both the free and complexed drug in a single well in a variety of sample concentrations.
Conclusions
In this application note, we have demonstrated that AlphaLISA technology can be used with various types of antibodies to reliably detect biosimilar drugs in serum samples. The levels of free drug, drug in complex, and total drug can easily be quantified using Types 1, 2, and 3 antibodies in a high-throughput, no-wash assay set-up. In addition, due to the unique properties of the AlphaPlex technology, we can accurately quantify free drug and drug in complex within a single assay well. This allows for collecting fast and reliable data for pharmacokinetic studies of biosimilar drugs.
Acknowledgements
We would like to thank Achim Knappik and his group at Bio-Rad Laboratories for providing scientific input and materials for this project.
Table 1. Quantification of free drug or drug in complex using spike and recovery samples with AlphaPlex.
Sample # Golimumab (µg/mL)
TNFα (µg/mL)
Molar Ratio (TNFα to
Golimumab)
Free Golimumab (Tb) (µg/mL)
Golimumab in Complex (Eu)
(µg/mL)
Total Golimumab (Tb + Eu) (µg/mL)
Percent Recovery (%)
1 1.6 0.72 3.8 0.0027 1.32 1.32 83
2 0.8 0.36 3.8 0.0058 0.62 0.63 78
3 1.6 0.08 0.4 1.02 0.19 1.21 76
4 0.8 0.04 0.4 0.49 0.14 0.63 78
5 1.6 0.4 2.1 0.12 1.32 1.44 90
6 0.8 0.2 2.1 0.063 0.59 0.66 82


![Provincial Constituency Reference Map - District Peshawar · T uc l fa j n between ALHASAN [] ... PK - 9 PK - 5 PK - 11 PK - 4 PK - 3 PK - 2 PK - 1 Legend Districts Boundary Provincial](https://img.pdfslide.us/doc/110x75/5c01b81309d3f22b088d1121/provincial-constituency-reference-map-district-t-uc-l-fa-j-n-between-alhasan.jpg)