Embed Size (px)
Citation preview

Development of Non-Proprietary UHPC Mix: Application to Deck
Panel Joints
Quarterly Progress Report
For the period ending February 28, 2021
Submitted by:
PI- Mohamed Moustafa
Graduate Student- Mohamed Abokifa
Department of Civil and Environmental Engineering
University of Nevada, Reno
Submitted to:
ABC-UTC
Florida International University
Miami, FL
March 2021

1
1. PROJECT ABSTRACT
One of the most common application of Accelerated Bridge Construction (ABC) nowadays is the
use of precast deck panels and fill the joints in the field using advanced materials such as Ultra-
high performance concrete (UHPC). This application has been used around the country in several
ABC projects in Iowa, New York, etc. A lot of research has been done on optimizing the field joint
reinforcement details such as shortest lap length and shear key shape and dimensions. However,
most of the applications used proprietary UHPC mixes, which can sometimes constrain the DOTs
bidding process due to lack of several UHPC vendors. Accordingly, research on the non-
proprietary UHPC is growing and many state DOTs are interested in developing their own mixes
using local materials. UHPC is cementitious composite material with mechanical and durability
properties far exceeding those of conventional concrete, which makes it an ideal material for bridge
deck joints. It combines a high percentage of steel fibers with an optimized gradation of granular
constituents, resulting in a compressive strength more than 22 ksi, a high post-cracking tensile
strength, and exceptional durability. In this collaborative effort among all five institutions in the
ABC-UTC consortium, comprehensive research on non-proprietary UHPC mix design and
extension to common ABC applications is sought. The coordination efforts are led by the
University of Oklahoma as explained in the next section. The objective of this part of the project
which will be conducted by the University of Nevada, Reno is to finalize the selection of best
feasible non-proprietary UHPC mix and demonstrate its validity for the use for precast deck panel
transverse and longitudinal joints. The goal is to optimize and provide confidence in the new
materials for this type of joints rather than optimizing the joint detail itself given that a lot of
previous work has already investigated best details for deck panel joints.
2. RESEARCH PLAN
2.1. STATEMENT OF PROBLEM
Prefabricating bridge elements and systems (PBES) offers major time savings, cost savings, safety
advantages, and convenience for travelers. According to the FHWA, the use of PBES is also
solving many constructability challenges while revolutionizing bridge construction in the US. In
the past decade, innovative PBES connections have been evolved and many of these connections
used Ultra-High performance concrete (UHPC). UHPC has superior mechanical properties and
durability. However, some of the limitations associated with UHPC wide spread use include: the
very expensive price tag and most of the robust mixes are currently proprietary. Several DOTs see
the proprietary nature of UHPC leads sometimes to sole-sourcing and in turn, bidding issues.
Accordingly, research on the non-proprietary UHPC is growing and many state DOTs are
interested in developing their own mixes using local materials. The goal of this project is to finalize
the selection of the best feasible non-proprietary UHPC mix and demonstrate its validity for use
as a closure pour material into precast deck panel transverse and longitudinal field joints.
2.2. RESEARCH APPROACH AND OBJECTIVES
Our approach for this proposed study is mainly an experimental approach with the main activity
is large-scale structural tests at UNR laboratories. The specific research objective of this study is
to collaborate with OU and ISU on acquiring local materials for non-proprietary UHPC mix design
and optimization, and conduct full-scale testing of deck panel joints to study the response of the
finalized mix design as used in actual structural ABC applications.
2
This study will coordinate the efforts of researchers at the five ABC-UTC partner institutions to
investigate bond strength, shear strength, and full-scale structural performance of non-proprietary
UHPC developed by the partner institutions. Two mix designs developed by the partner institutions
(one at OU and one at ISU) will be shared with the other partner institutions for comparative testing
with the proprietary UHPC Ductal® used as the baseline. Fiber content and fiber type will be
considered as primary variables for a given mix design. Figure 1 shows the overall organization
of the project. The primary objective is to determine whether a mix design developed with local
materials can achieve the necessary bond strength and durability for use in bridge component
connections, thereby providing an additional option for DOTs. Sharing of information between the
partner institutions will allow for consideration of repeatability of the proposed mix designs and
the combined efforts of the partner institutions will lead to more significant results than could be
obtained by any of the institutions working individually. Understanding the effect of fiber type and
content on bond, shear, and overall structural performance will identify the optimum fiber content
required for a non-proprietary material to achieve the properties required for a given application.
For example, minimum joint width for precast panel connections may be set by constructability
concerns, so a sufficiently short development length may be greater than the shortest development
length that could be obtained using UHPC.
Figure 1 – Overall organization of project and information sharing
Researchers from OU and ISU will provide UHPC mix designs developed at those institutions to
the team members at UNR, UW, and FIU for use in structural testing. OU and ISU will also have
the exact cementitious materials and admixtures used for each mixture shipped to UNR, UW, and
FIU so that each institution can exactly recreate the mix designs. OU and ISU will provide enough
aggregate (sand) for a sufficient quantity of material for one of the proposed structural tests. For
the other tests, researchers at UNR, UW, and FIU will use their own local aggregates. Researchers
at UNR, UW, and FIU will provide local cementitious materials and admixtures to researchers at
OU and ISU, such that they can obtain sufficient quantities of material to investigate the effects of

3
locally available cementitious materials and admixtures on non-proprietary mix designs.
Researchers at OU and ISU will consider concrete compressive strength and modulus of rupture
for comparison of the effects of local cementitious materials on mix design performance. They
will also conduct at least one set of bond tests (OU) and durability tests (ISU) considering local
cementitious variations provided by the other partner universities. In all cases, researchers will
obtain the same ½ in. steel fibers produced by Bekaert for use as the base fiber case. Institutions
sharing the exact materials will allow all institutions to begin their work at the same time, without
needing to wait for additional mix design development.
The focus of this project is to apply non-proprietary UHPC mixes with optimized characteristics
to deck panel field joints as shown in Figure 2 to demonstrate the validity of such materials.
Figure 2 – Field connections/joints for precast deck slabs (photo credit: Georgia DOT)
2.2.1. SUMMARY OF PROJECT ACTIVITIES
An experimental approach will be used and several research activities will be executed to
accomplish the objectives of this study. A summary of the proposed research tasks is as follows:
Task 1 – Updated literature search on precast deck panel connections
Task 2 – Development of experimental program and specimens design
Task 3 – Experimental testing of deck slabs joints
Task 4 – Summarize the results in a final report
2.2.2. DETAILED WORK PLAN
A detailed description of the proposed research tasks is presented in this section.
Task 1 – Update the literature review on precast deck panel joints:
A fresh update for the literature review of previous work on deck panel joints was conducted. The
goal of this task is to summarize the most common and feasible design details of deck panel joints.
In other words, a summary of recommended deck reinforcement overlap, lap splice length, shear
key shape and dimensions, and overall joint dimensions will be provided.

4
Our scope in this part of the study is to review and report the previous experimental and numerical
studies in the precast bridge deck field joints. Through the last decade, many researches started
working on using the “UHPC” in the precast deck panels field joints like the work done by Ben
Graybeal (2010). While all the research before this period was directed into investigating the
behavior of the PBES connections with using different materials such as advanced grouts, high
performance concrete (HPC) and HPC with fiber reinforcement. A current experimental study was
conducted at UNR Laboratories on using polymer concrete as a closure pour material into precast
deck field joints. This study investigated the structural performance of the transverse and
longitudinal filed joints under static vertical loading.
AASHTO conducted three research programs which focused specifically on advancing the state-
of-the-art regarding to non-post-tensioned deck-level connections details between prefabricated
concrete components.
The first research project “Full-Depth Precast Concrete Bridge Deck Panel Systems” and
frequently referred to as NCHRP 12-65. A primary focus of this project was to develop an
economical, non-post-tensioned transverse connection detail capable of developing the yield
strength of straight lengths of mild steel.
The second project “Design and Construction Guidelines for Long-Span Decked Precast,
Prestressed Concrete Girder Bridges” and frequently referred to as NCHRP 12-69. This research
demonstrated that redesign of the traditional connection systems used in the longitudinal
connections between decked girders could allow for a simpler connection.
The third project “Cast-in-Place Concrete Connections for Precast Deck Systems” and frequently
referred to as NCHRP 10-71. This project focused on both transverse and longitudinal
connections between precast concrete components as shown in Figure 3.
Figure 3 – Transverse and longitudinal field connections/joints for precast deck slabs

5
Task 2 – Development of experimental program and specimens design
Specimen design
The objective of this task is to finalize the number and type of specimens to consider for validating
and demonstrating the different non-proprietary UHPC mixes, which was developed in
collaboration with other ABC-UTC partner universities as part of this project. This project is also
building on another ongoing ABC-UTC project led by PI Moustafa at UNR which focuses on
using polymer concrete for deck panel joints as another alternative to UHPC. Thus, similar joint
types and specimen design were implemented in this project for comparison purposes. Two types
of connections and tests were proposed which are: (1) longitudinal connections of deck bulb tee
girders that will be tested for flexure; (2) deck panels’ transverse connections that will be tested
for flexure. Figures 4 through 7 show the details of reinforcement of the test specimens. Four
specimens were constructed to conduct three transverse and one longitudinal joint test. The details
of the tested specimens are reported in Table 1. The design of the specimens was performed
according to the AASHTO LRFD Bridge Design Specification (AASHTO, 2018). The positive
and negative design moments were determined based on the AASHTO Equivalent strip method.
The moment values provided in this method takes into account the largest values that could be
experienced by the deck slabs with respect to different loading conditions. The bridge example
that was used to analyze the reinforced concrete deck slab for the transverse specimens in this
study has a cross-section consisted of five steel girders spaced at 12 ft on center and a deck slab of
8 in thickness. The instrumentation plan of the test specimens was also finalized, and the
reinforcement strain gage locations were also reported in Figures 4 through 7.
Table 1. Test specimens details
Specimen Joint width
Lap length
Lap detail
Field joint type
Closure material Overall specimen dimensions
SP1 6.0 in 5.0 in straight Transverse Nevada mix – 2% 9’x8’x8”
SP2 6.0 in 4.5 in U-bar Transverse Nevada mix – 2% 9’x8’x8”
SP3 8.0 in 7.0 in straight Transverse Nevada mix – 1% 9’x8’x8”
SP4 6.0 in 5.0 in straight Longitudinal Nevada mix – 2% 8’x7’x6”

6
Figure 4 – Structural details and instrumentation plan for the first transverse specimen (SP-1).
Figure 5 – Structural details and instrumentation plan for the second transverse specimen (SP-2).

7
Figure 6 – Structural details and instrumentation plan for the third transverse specimen (SP-3).
Figure 7 – Structural details and instrumentation plan for the longitudinal specimen (SP-4).

8
Materials and Mix Design
This task also includes the collaboration with the OU University to finalize the non-proprietary
UHPC mix. The baseline mix design for the non-proprietary UHPC was developed by the OU
University. While the mix developed at UNR implemented the same mixing proportions but with
using the local materials that are available on the west coast. The mix design and the suppliers of
the OU and UNR mixes are shown in Table 2. The baseline mix design included in Table 3 is
developed for the 2% steel fiber content. However, this mixing proportions should be adjusted for
different fiber contents. We coordinated with the OU University to send their local materials to be
mixed and tested under compression and flexure at UNR to verify if there could be any variabilities
associated with the difference in mixing, specimen preparation, curing or testing.
Once we had these materials, we started to mix four trial batches with using the Nevada local
materials in addition to one mix with using the OU materials for comparison purposes. Overall,
five trial batches were mixed at UNR to identify the best mix that could be used as a closure pour
material inside the precast bridge deck connections. Many parameters were tested including the
variation in the fiber content e.g. 1% vs 2%, using sieved and not-sieved crushed aggregate sand,
and the variation of the local materials used in the mix e.g. OU vs UNR. The five trial batches that
were mixed at UNR are shown in Table 3. Several material tests were conducted at UNR at
different concrete ages as recommended by the FHWA for the mechanical characterization of the
new Non-Proprietary UHPC mixes. The Material property tests recommended by the FHWA to
be conducted on the “ABC-UTC Non-Proprietary UHPC Mix” using materials from other states
are shown in Table 4. We increased the required material tests to include compression and flexure
testing of the trial mixes at more ages to have more verification and enrich the comparison between
the test results from UNR compared to OU.
Table 2. Baseline non-proprietary UHPC mix design for OU and UNR
Material Quantity OU Supplier UNR Supplier
Type I Cement, lb/yd3
1179.6 Ash Grove Chanute,
Kansas
Type I/II Nevada
Cement, Reno
Slag, lb/yd3
589.8 Holcim,
South Chicago
Lehigh,
Sacramento
Silica Fume, lb/yd3
196.6 Norchem
Ohio
BASF
(Master Life SF 100)
w/cm 0.2 NA NA
Fine Masonry Sand, lb/yd3
1966 Metro Materials
Norman, OK
Crushed Aggregate
Martin Marietta
Sparks, NV
Steel Fibers, lb/yd3
255.2 Bekaert
(Dramix® OL 13/0.2)
Bekaert
(Dramix® OL 13/0.2) Steel Fibers, % 2.0
Superplasticizer, oz./cwt 18 BASF
(Glenium 7920)
BASF
(Glenium 7920)

9
Note: All the sand or the crushed aggregate that were used in the mixes were oven dried for one
day before mixing.
Table 3. Non-Proprietary UHPC trial mixes developed by UNR.
Batch No. Local Materials Fiber content Sand type
B1 – NV – 2% – NS Nevada 2 % Crushed aggregate sand
Not Sieved
B2 – NV – 2% – S Nevada 2 % Crushed aggregate sand
Sieved
B3 – NV – 1% – NS Nevada 1 % Crushed aggregate sand
Not Sieved
B4 – NV – 1% – S Nevada 1 % Crushed aggregate sand
Sieved
B5 – OU – 2% – NS Oklahoma 2 % Fine sand
Not Sieved
NS: Not sieved crushed aggregate sand, S: Sieved crushed aggregate sand
Table 4. Material property tests recommended by FHWA
Property Test Method Specimen Size Testing
Ages
#Specimens
Per Test
Flowability ASTM C1437 Per ASTM At
casting
1
Compressive Strength ASTM C39 3x6 in. cylinder 3 and 28
days
3
Flexural Strength ASTM C78/ASTM
C1609
3x3x11 in.
rectangular prism
28 days 3
The general mixing procedure recommended by OU for the developed Non-Proprietary UHPC
followed the following general procedure with variations based on the particular mixture
composition and mixer used.
1. Blend dry constituents for 10 minutes.
2. Add water mixed with ½ of the required superplasticizer gradually over the course of 2
minutes while mixing.
3. Mix for 1 minute.
4. Add the second ½ of the HRWR over the course of 1 minute while mixing.
5. Mix for an additional 5-10 minutes until the mix turns to flowable material and add steel
fibers over the course of 2 minutes.
6. Mix for an additional 1 minute after fibers are dispersed.

10
Average total mixing time is 20-30 minutes.
A crushed aggregate sand that is locally known as concrete sand was used in the trial mixes with
the Nevada materials. This type of sand is a mix between fine to moderate sand and a crushed
aggregate where the maximum size of this crushed aggregate is less than 4.76 mm (0.187 in). The
sieved crushed aggregate sand was determined based on the amount of sand that passes #30 and
retained at #200 sieve sizes. Figure 8 shows the different steps established for sand preparation
and the different sand types used in the trial mixes.
Figure 8 – (a) packing of the crushed aggregate sand, (b) sand drying, (c) sand sieving, (d) crushed
aggregate sand without sieving, (e) Crushed aggregate sand after sieving, and (f) OU sand.
Figure 9 shows the mixing stages of one of the trial batches that was done at UNR with using the
Nevada local materials.
(a) (b) (c)
(d) (e) (f)

11
Figure 9 – Non-proprietary UHPC mixing of trial mix “B2-NV-2%-S” at UNR.
Test Results and Comparisons
1- Flow Test:
The flowability of the mix was measured using a spread cone mold in accordance with
ASTM C 1437/230. The results of the flow test are reported in Table 5. Figure 10 shows the flow
test photos of the trial batches developed at UNR.
Table 5. Flow test results for the OU and UNR non-proprietary UHPC
Batch No. Static Flow (in.) Dynamic Flow (in) OU recommended flow (in) B1 – NV – 2% – NS 8.0 > 10.0 9.5
B2 – NV – 2% – S 9.2 > 10.0 9.5 B3 – NV – 1% – NS 9.7 > 10.0 9.5 B4 – NV – 1% – S 9.5 > 10.0 9.5 B5 – OU – 2% – NS 8.3 > 10.0 9.5

12
Figure 10 – Flow tests of the trial Non-proprietary UHPC mixes at UNR.
2- Compressive Strength:
The compressive strength of the five trial batches were determined according to ASTM C1856. A
total of 12 cylinders of 3 in. diameter and 6 in. height were taken from each batch to be tested at
different ages e.g. 3, 7, 28, and 56 days. All the test cylinders were left on-site for one day after
mixing before transferring them to a curing room with normal humidity and room temperature of
about 72 oF. All cylinders were surface prepared before testing. The top surface of the cylinders
were cut using the saw machine to remove approximately ¼ in of the top surface that has many air
voids (see Figure 11-e). Then both ends were surface ground using the grinding machine (see
Figures 11-a,11-c, and 11-d) and then tested in a Satic compression machine (see Figure 10-b).
The test cylinders were preloaded to half of the expected compressive strength and then loaded to
failure at 150 psi/sec. The test results of the UNR trial batches compared to the OU test results are
shown in Table 6 and they are graphically represented in Figures 12 and 13.
B1 B2 B3 B4

13
Figure 11 – (a) Grinding machine at UNR, (b) Satic compression machine at UNR, (c) UHPC cylinder
from B3 after surface grinding, (d) UHPC cylinder from B4 after surface grinding, and (e) UHPC cylinder
with air voids at the top part before saw cutting and grinding.
Table 6. Compressive strength results for UNR and OU non-proprietary UHPC.
Batch No. 3 Days (psi) 7 Days (psi) 28 Days (psi) 56 Days (psi) B1 – NV – 2% – NS 11,860 14,100 16,655 18,945 B2 – NV – 2% – S 9,960 12,850 15,830 18,865 B3 – NV – 1% – NS 12,890 15,390 18,685 21,565 B4 – NV – 1% – S 10,600 12,970 16,270 18,285 B5 – OU – 2% – NS 11,050 14,220 18,240 18,445 OU Results – 1 % 12,170 13,410 13,250 17,020 OU Results – 2 % 12,540 14,480 17,220 18,140
Note: The compressive strength of “B2 – NV – 2% – S” at 14 Days was 14,620 psi.
TBT: To be tested
(a)
(e)(d)(c)
(b)

14
Figure 12 – Compressive strength of the 2% non-proprietary UHPC mixes versus age of concrete.
Figure 13 – Compressive strength of the 1% non-proprietary UHPC mixes versus age of concrete.
3- Flexural Strength:
Flexural strength tests were conducted on 3 in. x 3 in. x 11 in. prisms with a 9 in. span and loads
applied at the third points according to ASTM C1856. A displacement rate was applied on the
0
2000
4000
6000
8000
10000
12000
14000
16000
18000
20000
0 10 20 30 40 50 60
Co
mp
ress
ive
stre
ngt
h (
psi
)
Age (Days)
OU Results – 2 % B2 - NV - 2% - S B1 – NV – 2% – NS B5 – OU – 2% – NS
0
2000
4000
6000
8000
10000
12000
14000
16000
18000
20000
22000
0 10 20 30 40 50 60
Co
mp
ress
ive
stre
ngt
h (
psi
)
Age (Days)
OU Results - 1% B3 – NV – 1% – NS B4 – NV – 1% – S

15
specimen according to ASTM C1609. The displacement rate at the beginning of the test was
0.003 in/min till reaching 0.01 in mid-span vertical displacement, then the rate was increased to
0.005 in/min till the end of the test. The vertical displacements measured for the 7 days and 14
days flexure tests were measured based on the movement of the loading head of the machine.
While different testing procedure was implemented on testing the 28 and 56 days flexure
samples as the midspan deflection of the beams was measured using laser extensometer device
with one laser target attached at the middle of the beam and the other laser target is attached at a
fixed point as shown in Figure 14. Results of the flexural strength tests at 7, 28, and 56 days of
age are reported in Table 7.
Figure 14 – Bending tests of the non-proprietary UHPC beams using the laser extensometer at UNR.
Table 7. Flexural strength results for UNR and OU non-proprietary UHPC.
Batch No. 7 Days (psi) 14 Days (psi) 28 Days (psi) 56 Days (psi) B1 – NV – 2% – NS 2,520 N.A. 3,005 2,970 B2 – NV – 2% – S N.A. 2,570 2,630 3,210 B3 – NV – 1% – NS 1,660 N.A. 2,075 1,440 B4 – NV – 1% – S 2,095 N.A. 2,350 2,635 B5 – OU – 2% – NS 2,680 N.A. 2,845 2,975 OU Results – 1 % N.A. N.A. 1,750 2,450 OU Results – 2 % N.A. N.A. 2,570 3,000
4- Direct Tension Test:
The direct tensile strength of the non-proprietary UHPC mixes was determined based on testing
dog-bone samples with a nominal cross-section of 1” by 1” dimensions. Laser targets were
attached at the ends of the reduced section to measure the tensile strains in this area and relate
them to the corresponding direct tension stress. Figure 15 shows the direct tension test of one of
the dog bone specimens at UNR.
Laser extensometer
Laser targets

16
Figure 15 – tension tests of the non-proprietary UHPC dog-bone samples at UNR.
Table 8. Direct tension strength results for UNR and OU non-proprietary UHPC.
Batch No. 7 Days (psi) 15 Days (psi) 28 Days (psi) B1 – NV – 2% – NS 800 N.A. 820 B2 – NV – 2% – S N.A. 910 1,070 B3 – NV – 1% – NS 460 N.A. 650 B4 – NV – 1% – S 780 N.A. 775 B5 – OU – 2% – NS 660 N.A. 970
Task 4 – Conduct experimental testing of precast deck slabs with a new joint connection
Testing procedures from our previous experimental work done at UNR Laboratories were adopted
to conduct large-scale testing on deck panels connected using the non-proprietary UHPC mixes.
Four full-scale tests were conducted in this task. Monotonic loading until failure was considered
to determine the capacity and the modes of failure. All the test specimens were properly
instrumented to measure strains in the slab reinforcement inside the panels and the joint location
and measure the displacement and curvature of the slab. Data from the tests were processed and
interpreted to investigate whether the new sought non-proprietary UHPC mixes valid for this type
of connection and if so, provide confidence on the large-scale applications of the new materials.
The actual photos and schematic diagrams of the test-setups for the transverse and longitudinal
specimens included in this study are shown in Figures 16 and 17, respectively.

17
Figure 16 – Test setup for transverse specimens.

18
Figure 17 – Test setup for longitudinal specimens.
The construction and assembly of all the deck panels for the test specimens have been completed
at UNR as shown in Figures 18-22. The figures show also the sequence of construction. We have
finished pouring the Non-proprietary UHPC closure pour inside the joints as shown in Figure 22.
An early assessment has been done to determine the most proper UHPC mix that could be used
inside the field joints. Since the results from the material tests were very comparable we decided
to use the locally available Nevada material mixes without using sand sieving to facilitate the use
of the raw sand as it is from the local source and to avoid any extra costs that could be associated
in the future if we proposed to do sieving of the sand. However, using this type of coarse sand
could widen the use of different sand sizes inside the non-proprietary UHPC mixes without
severely affecting the UHPC mix properties. Recently, we have conducted large-scale testing of
the four test specimens. The damage schemes of specimen S1, S2, S3, and S4 are shown in Figures
23 to 26, respectively.
7 ft (2.13 m)
8 ft (2.44 m)
6 ft (1.83 m)
6 in
6 in
Load Application
6"
MT
S-2
20 K
ips A
ctu
ato
r
8'
12'-7"
2'-714"
Strong Floor
Seat beams spaced 6 ft
center to center
Elastomeric pad
(1x10x20 in)
Steel Plate
(1x20x20 in)
Elastomeric pad
(2x8x96 in)

19
Figure 18 – Formwork and reinforcement for construction of deck panels and specimens
Figure 19 – Deck panels’ construction, reinforcement, and cast concrete

20
Figure 20 – Close-up views of the constructed deck panels and shear keys for the field joints.

21
Figure 21 – Alignment and assembly of the test specimens at UNR.
Figure 22 – Pouring the non-proprietary UHPC inside the field joints at UNR.

22
Figure 23 – Damage scheme of specimen S1.
Figure 24 – Damage scheme of specimen S2.
Figure 25 – Damage scheme of specimen S3.
23
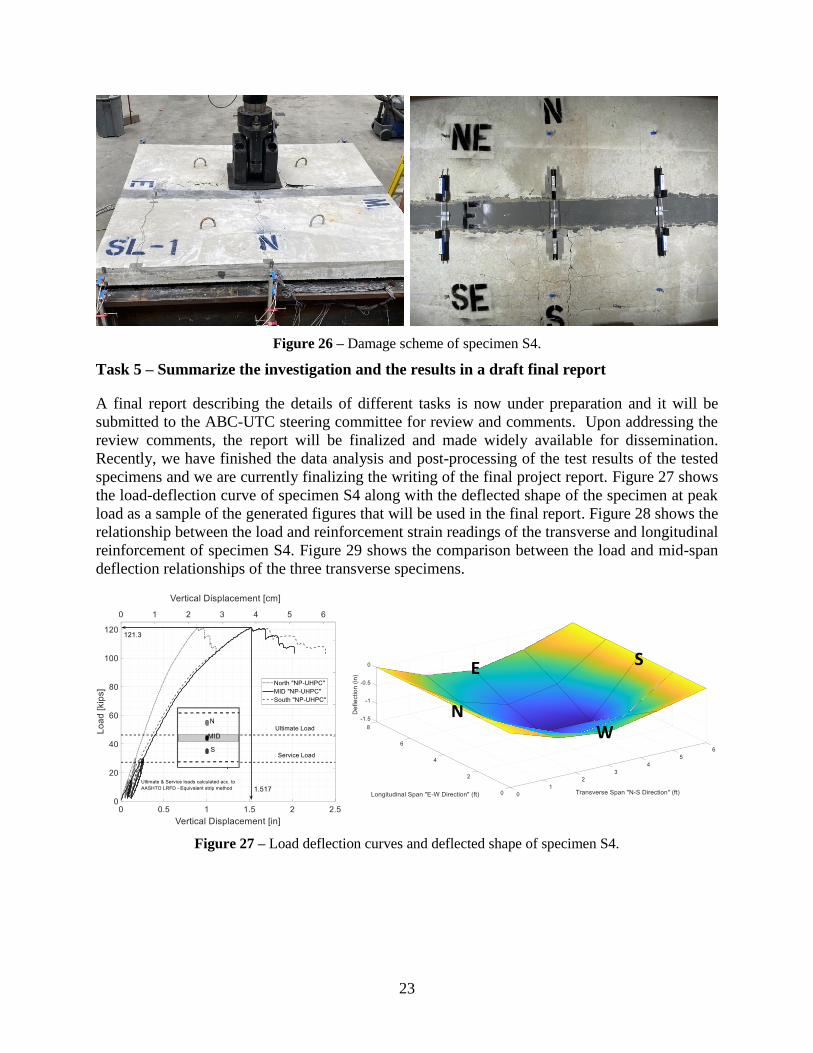
Figure 26 – Damage scheme of specimen S4.
Task 5 – Summarize the investigation and the results in a draft final report
A final report describing the details of different tasks is now under preparation and it will be
submitted to the ABC-UTC steering committee for review and comments. Upon addressing the
review comments, the report will be finalized and made widely available for dissemination.
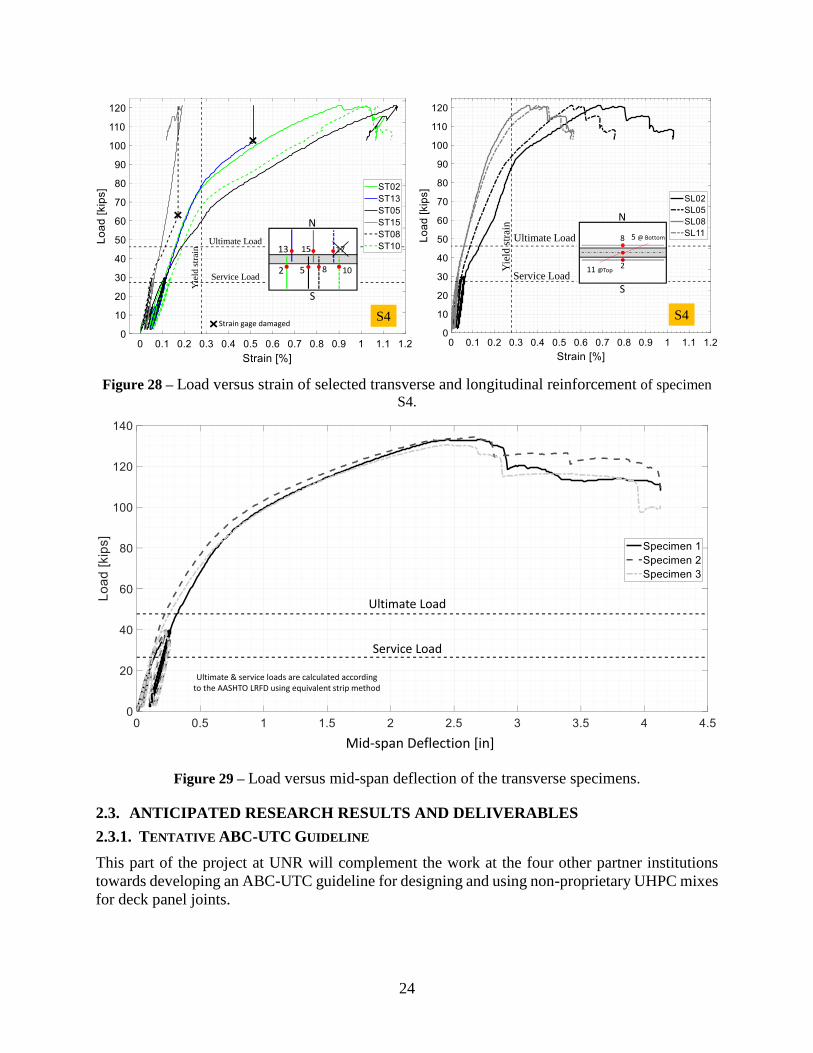
Recently, we have finished the data analysis and post-processing of the test results of the tested
specimens and we are currently finalizing the writing of the final project report. Figure 27 shows
the load-deflection curve of specimen S4 along with the deflected shape of the specimen at peak
load as a sample of the generated figures that will be used in the final report. Figure 28 shows the
relationship between the load and reinforcement strain readings of the transverse and longitudinal
reinforcement of specimen S4. Figure 29 shows the comparison between the load and mid-span
deflection relationships of the three transverse specimens.
Figure 27 – Load deflection curves and deflected shape of specimen S4.
0.3190.9201.5100.9400.436
0.5981.1241.5101.1950.698
0.4460.7830.8940.8080.522
S
N
WE
WEN S
N
SE
W
24
Figure 28 – Load versus strain of selected transverse and longitudinal reinforcement of specimen
S4.
Figure 29 – Load versus mid-span deflection of the transverse specimens.
2.3. ANTICIPATED RESEARCH RESULTS AND DELIVERABLES
2.3.1. TENTATIVE ABC-UTC GUIDELINE
This part of the project at UNR will complement the work at the four other partner institutions
towards developing an ABC-UTC guideline for designing and using non-proprietary UHPC mixes
for deck panel joints.
Ultimate Load
Service Load
Yie
ld s
trai
n
N
S
952
13 16 19
12
15
8 10
17
S4Strain gage damaged
Ultimate Load
Service Load
Yie
ld s
trai
n
N
S
8
2
5 @ Bottom
11 @Top
S4
Ultimate Load
Service Load
Ultimate & service loads are calculated according to the AASHTO LRFD using equivalent strip method
Mid-span Deflection [in]

25
2.3.2. A FIVE-MINUTE VIDEO SUMMARIZING THE PROJECT
Another format to disseminate the results from this project and contribute to workforce
development and outreach is to develop a video and presentation slides to summarize the project.
A webinar format can be sued to publish and make available such videos or presentations.
2.3.3. FINAL REPORT AND PUBLICATIONS
As mentioned before, a comprehensive report will be developed to summarize all the experimental
results. Data sets could also be produced and published using existing or new cyber infrastructure
or data platforms if a unified one will be eventually used for ABC-UTC related projects.
Publications in peer-reviewed journals and conference presentations will also be considered for
delivering project results.
3. TIME REQUIREMENTS (GANT CHART)
To allow for the completion of all the project tasks, the study will be conducted over a period of
12 months (4 quarters) following the schedule in Table 4.
Table 4 – Gant schedule of major project tasks
Percent work completed: 90%
Remaining work: 10%
Completed or work in progress Remaining


![Rolling Fatigue Test of Large-Sized UHPC Member for Cable ... · tion of UHPC to cable stayed bridge [1-4]. As part of this project, SuperBridge800, a UHPC cable stayed bridge with](https://img.pdfslide.us/doc/110x75/5ebf1c7878e2f9654370ef61/rolling-fatigue-test-of-large-sized-uhpc-member-for-cable-tion-of-uhpc-to-cable.jpg)