Embed Size (px)
Citation preview

Predicting terrestrial gravity noise in the Virgo detectorbased on new data from site characterization
Susan M. BlackburnColumbia University, New York, New York 10027, USA
European Gravitational Observatory (EGO), I-56021 Cascina, Pisa, Italy
Characterization of terrestrial gravity (Newtonian) noise in the Virgo detector represents an im-portant preliminary step in developing a predictive model designed to filter this noise from theinterferometer’s output signal. Seismometer and accelerometer arrays placed in and around Virgo’sWest End Building in June and July 2016 yielded data that were analyzed with the aim of gather-ing information about the seismic waves responsible for Newtonian noise effects on the test masses.Following some additional investigations, several persistent spectral lines in the 10 to 20 Hz fre-quency band were identified and excluded as sources of Newtonian noise. Construction of a model,combining the results of the analysis and structural details of the laboratory buildings and near-surface geology at the Virgo site, is planned. This model will not only allow us to predict andeliminate the spectrum of terrestrial gravity noise in the Virgo detector, but will also contribute tothe development of Newtonian noise mitigation schemes in proposed ground-based interferometers.
I. INTRODUCTION
Gravitational waves (GWs) are perturbations in thespace-time metric that propagate at the speed of lightfrom high-energy astrophysical events such as the coa-lescence of compact binary objects. Measuring the massdistortions produced by these waves represents a tech-nological challenge due to the relative weakness of thegravitational force. While Hulse and Taylor achieved in-direct detection of GWs in 1975 by measuring the pe-riodic variation of a pulsar in a binary system [1], di-rect detection has been the decades-long goal of inten-sive efforts to develop laser interferometry. The success-ful detection of GWs in 2015 by the Laser InterferometerGravitational-Wave Observatory (LIGO) experiment inthe United States has confirmed the viability of ground-based interferometry in the 101 to 104 Hz range, andhas opened an important new window on astrophysicalobservation. Efforts are now under way to improve thesensitivity of detectors such as LIGO and Virgo (locatednear Pisa, Italy) which are limited by various sources ofnoise in the low-frequency band. Among these, Newto-nian noise (NN), is currently of interest in the 10 to 20 Hzrange, and may limit sensitivity down to 5 Hz. NN can re-sult from variations in atmospheric pressure or from seis-mic motion in the medium (soil or rock) surrounding thedetector. Seismic waves, particularly those propagatingalong the surface, can vary the density of this medium,translating to fluctuations in the local gravitational fieldwhich couple directly to the test masses. Moreover, thesesurface waves are subject to scattering and reflection,and can interact with a detector’s structural components,generating complex effects. Since shielding from NN isnot possible, the implementation of an accurate filteringmodel of the seismic wave field is necessary. The balanceof this paper will present recent efforts to characterizeNN at the Virgo detector.
II. NEWTONIAN NOISE
The following subsections provide background on theseismic origins of NN, its mathematical expression, anda brief look at the effects of NN on an interferometer testmass.
A. Seismic motion
Seismic motion represents the dominant source of NNin gravitational wave detectors. While direct mechani-cal coupling of seismic vibrations to optical componentscan occur, seismic motion also produces changes in thedensity of the soil under and around the interferometer,affecting the local value of gravitational acceleration (g),and producing fluctuating Newtonian forces on the sus-pended test masses.
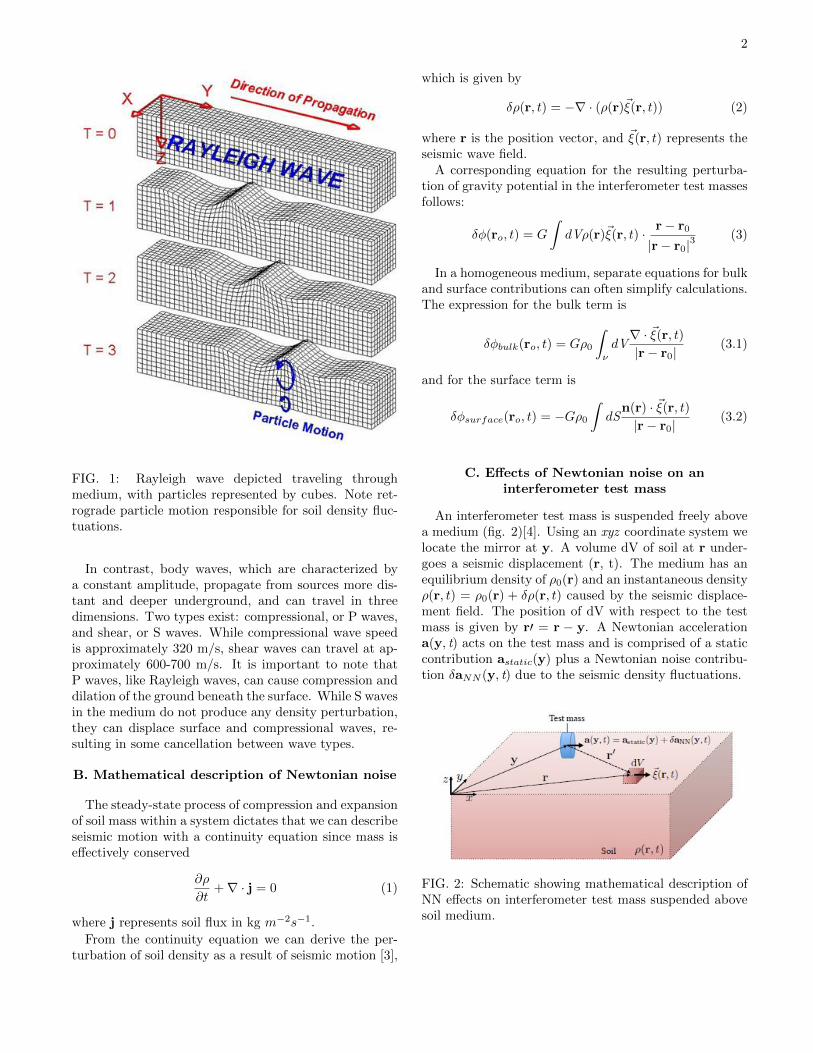
Seismic waves can be categorized as either surface orbody waves. Surface waves travel through the Earth’scrust at a lower frequency than body waves, and are re-sponsible for much of the destruction resulting from seis-mic events. Of particular interest to studies of NN aresurface Rayleigh waves (fig. 1), which dominate in the 10to 20 Hz regime. These have a rolling, elliptical motionwith an amplitude that falls off exponentially as a func-tion of depth, producing an evanescent extension of thedisplacement field [2]. The retrograde particle motion ofthe Rayleigh wave is limited to the vertical plane in thedirection of propagation. This displacement in the nor-mal direction causes a decrease in density of air pocketsin the soil, and a corresponding increase in the density ofthe surrounding soil medium. While precise wave speed isdetermined by wave frequency and wavelength, Rayleighwaves travel at approximately 300 m/s, and are subjectto dispersion and reflection from topography and otherobstacles.
2
FIG. 1: Rayleigh wave depicted traveling throughmedium, with particles represented by cubes. Note ret-rograde particle motion responsible for soil density fluc-tuations.
In contrast, body waves, which are characterized bya constant amplitude, propagate from sources more dis-tant and deeper underground, and can travel in threedimensions. Two types exist: compressional, or P waves,and shear, or S waves. While compressional wave speedis approximately 320 m/s, shear waves can travel at ap-proximately 600-700 m/s. It is important to note thatP waves, like Rayleigh waves, can cause compression anddilation of the ground beneath the surface. While S wavesin the medium do not produce any density perturbation,they can displace surface and compressional waves, re-sulting in some cancellation between wave types.
B. Mathematical description of Newtonian noise
The steady-state process of compression and expansionof soil mass within a system dictates that we can describeseismic motion with a continuity equation since mass iseffectively conserved
∂ρ
∂t+∇ · j = 0 (1)
where j represents soil flux in kg m−2s−1.
From the continuity equation we can derive the per-turbation of soil density as a result of seismic motion [3],
which is given by
δρ(r, t) = −∇ · (ρ(r)~ξ(r, t)) (2)
where r is the position vector, and ~ξ(r, t) represents theseismic wave field.
A corresponding equation for the resulting perturba-tion of gravity potential in the interferometer test massesfollows:
δφ(ro, t) = G
∫dVρ(r)~ξ(r, t) · r− r0
|r− r0|3(3)
In a homogeneous medium, separate equations for bulkand surface contributions can often simplify calculations.The expression for the bulk term is
δφbulk(ro, t) = Gρ0
∫ν
dV∇ · ~ξ(r, t)|r− r0|
(3.1)
and for the surface term is
δφsurface(ro, t) = −Gρ0∫dS
n(r) · ~ξ(r, t)|r− r0|
(3.2)
C. Effects of Newtonian noise on aninterferometer test mass
An interferometer test mass is suspended freely abovea medium (fig. 2)[4]. Using an xyz coordinate system welocate the mirror at y. A volume dV of soil at r under-goes a seismic displacement (r, t). The medium has anequilibrium density of ρ0(r) and an instantaneous densityρ(r, t) = ρ0(r) + δρ(r, t) caused by the seismic displace-ment field. The position of dV with respect to the testmass is given by r′ = r − y. A Newtonian accelerationa(y, t) acts on the test mass and is comprised of a staticcontribution astatic(y) plus a Newtonian noise contribu-tion δaNN (y, t) due to the seismic density fluctuations.
FIG. 2: Schematic showing mathematical description ofNN effects on interferometer test mass suspended abovesoil medium.

3
III. WEST END BUILDING ENVIRONMENT
Since seismic surface waves have the potential to bescattered and reflected by an interferometer’s structuralcomponents, building characteristics become a key con-sideration in producing an accurate NN profile. It is valu-able therefore to examine environmental features thatmight contribute to or otherwise alter these effects. AtVirgo, both West and North End Buildings are effectivelyidentical in construction and layout, so it is reasonableto infer that site studies conducted at one are applicableto the other. The West End Building (WEB) was chosenfor data-taking due to ongoing commissioning activitiesin the North End Building.
FIG. 3: Technical drawing showing Virgo’s West EndBuilding (WEB) tower in profile. Note basement roomextending beneath tower and supporting piles.
The WEB is constructed of two independent concreteslabs. The inner slab, 6 m wide and 15 m long supportsthe vacuum tank (hereinafter referred to as the “tower”)which hosts the mirror test mass suspension. It is im-portant to note that unlike LIGO’s simple slab design,Virgo’s tower construction includes a clean room base-ment (fig. 3), consisting of a hollow space cut into theconcrete slab, which is used for payload installation. Thetower floor sits on piles 1200 mm in diameter that pen-etrate the soil to reach the compact and stable gravellayer located 52 m beneath the surface, and is separatedby a 5 cm gap from the outer floor in order to improve
isolation with respect to vibrations of the building. Theouter slab supports the building’s external concrete shelland is supported by piles sitting at a reduced depth onthe softer clay soil.
At the western extremity of the tower building are ap-pended technical rooms hosting the 15 kV power connec-tion, transformers, uninterrupted power supplies, a dieselgenerator, and pumps for chilled and hot water circula-tion to the HVAC. These sit on a third concrete layerresting on the soil surface with no supporting piles.
IV. SEISMIC FIELD CHARACTERIZATION
Investigations of the seismic field in and around theWEB were carried out in June and July 2016, and aredescribed in the following subsections.
A. Comparative seismicity inside and outsidethe West End Building
Relative levels of seismicity between the WEB towerfloor and exterior environment were investigated by de-ploying two triaxial low-frequency Nanometrics TrilliumC20 velocimeters, with a measuring range of 0.1 Hz to50 Hz. The indoor sensor was placed on the tower floor,to the east of the tower, and the outdoor sensor placedsouth of the WEB parking lot (fig. 4).
FIG. 4: Aerial view of Virgo’s West End Building show-ing approximate locations of outdoor and indoor sensors.
Distance between the two sensors was approximately35 m. Signal was output to a Nanometrics Centaur dig-ital datalogger with 24-bit ADC, GPS antenna receiverand 16 GB removable SD card. Dynamic range for theindoor sensor was 40 V, and for the outdoor sensor 4V, with both sensors sampling at 250 Hz. Both sensorswere powered by rechargeable 12 V batteries. Data weretaken from June 9, approximately 11:00 UTC, to June15, approximately 14:00 UTC. Vacuum pumps on andaround the tower were switched off on Sunday June 12for most of the day, replicating “science mode” condi-tions when the WEB is restricted to human and vehicle

4
traffic. Approximately 24 hours of data were analyzedfrom this period, and seismic spectra were produced asshown in fig. 5 and 6 below.
FIG. 5: Seismic spectrogram showing 10th, 50th and90th percentiles for interior (tower floor) sensor.
FIG. 6: Seismic spectrogram showing 10th, 50th and90th percentiles for exterior sensor
A comparison of the two median, or 50th percentile,spectra (fig. 7) confirms that the tower floor is seismicallyquieter than the exterior of the WEB by approximatelya factor of three, beginning from about 2 Hz. This re-sult is not unexpected given that the tower is effectively“moated” by a gap between it and the building slab, asexplained previously.
At approximately 17 Hz and 20-25 Hz it was notedthat seismic noise is the same both inside and outside theWEB. This prompted further investigation of potentiallocal noise sources, which is discussed in detail later in
this paper.
FIG. 7: Comparison of 50th percentile spectra for indoorand outdoor sensors. Dashed lines show highest and low-est levels of observed seismic noise at “seismically-quiet”sites, based on the USGS Peterson model (1993).
B. Seismicity within the West End Building
Three accelerometer arrays in configurations paral-lel to the interferometer arm (z-array) perpendicularto the arm (x-array) and in a circle surrounding thetower (c-array) were used to investigate seismicity withinthe WEB. Array configurations and sensor locations areshown in fig. 8 below.
FIG. 8: Location and placement of z, x and c accelerom-eter arrays on Virgo’s WEB floor.
All arrays were placed symmetric with respect to theaxis suggested by the direction of the arm, and all sensorswere located at a distance from the test mass representinga fraction of the seismic wavelength of interest in order toavoid diminishing correlation with NN due to limitationsof sensor signal-to-noise ratio.

5
Wilcoxon Meggit-731 single-axis (vertical) accelerom-eters with sensitivity 1 V/g were employed in these in-vestigations. Sensors were positioned vertically and fixedto the painted concrete floor with double-sided tape (fig.9).
FIG. 9: Wilcoxon Meggit-731 accelerometer affixed toWEB floor
The sensors were powered with Wilcoxon P703B powerunits, and data were output to the WEB ADC channels.Eight sensors were used in the x and c-arrays with oneadditional sensor (PCB-393B12) employed in the z-array.
Data were taken over three successive weekends in or-der to reduce the incidence of anthropogenic noise fromactivity in and around the tower and WEB environs.Dates of data-taking for z-array were June 10-13, x-arrayJune 17-20, and c-array June 24 to 27.
To evaluate the performance of the sensors and cabling,and to identify any equipment faults, a huddle test wasconducted on the WEB floor on June 24, resulting in theamplification of one sensor by a factor of 10.
An intrinsic noise budget for the accelerometers andADC (z-array configuration) is plotted in fig. 10, anddemonstrates a signal-to-noise ratio on the tower floor ofapproximately order 10.
FIG. 10: Accelerometer noise budget (z-array) indicatingintrinsic sensor and ADC noise.
48 hours of averaged data from the z-array confirmedthat the tower floor is seismically quieter than the build-ing floor as evidenced by the comparison plot of medianspectra for sensors on and off the tower floor (fig. 11). In
the region of interest between 10 and 20 Hz, a mysteriouspeak persists at 17 Hz.
FIG. 11: Comparison of median spectra of z-array towerfloor accelerometers (shown in red) and building flooraccelerometers (shown in blue). Note 17 Hz peak.
A similar result was obtained from x-array data (fig.12), which also shows a lower noise level on the towerfloor. This suggests again that the tower-platform inter-face is responsible for a mechanical filtering effect.
FIG. 12: Comparison of median spectra of x-array towerfloor accelerometers (shown in red) and building flooraccelerometers (shown in blue).
It is worth noting that the noise contributions from avacuum scroll pump located on the tower floor were elim-inated from this analysis by choosing data taken duringtimes that this pump was switched off, as it would beduring science mode.
It was also seen that the 17 Hz peaks first identifiedby the interior-exterior array persisted in data collectedin the z and x-arrays. In addition, bumps at 12 Hz, anda modulated line between approximately 17.5 and 20.5Hz were noted and subsequently investigated. Details ofthese investigations are described below.
6
Following from the conclusion that the WEB towerfloor is, relatively speaking, a seismically quiet environ-ment, comparison plots (fig. 13 and 14) between noise onthe Virgo WEB tower floor and at LIGO Hanford andLIGO Livingston sites were produced using data fromthe interior Trillium seismometer.
FIG. 13: Comparison of median seism between Virgotower floor (red), LIGO Hanford (blue) and LIGO Liv-ingston (green) in units of displacement.
FIG. 14: Comparison of median seism between Virgotower floor Red), LIGO Hanford (blue) and LIGO Liv-ingston (green) in units of velocity.
Our analysis revealed that between 5 and 20 Hz,Virgo’s tower floor is seismically quieter than both LIGOsites. Again it is a reasonable assumption that the inter-face between the tower floor and building floor (absentat both LIGO sites) is acting as a filtering mechanism,and suggests that seismic waves may be reflected from it.
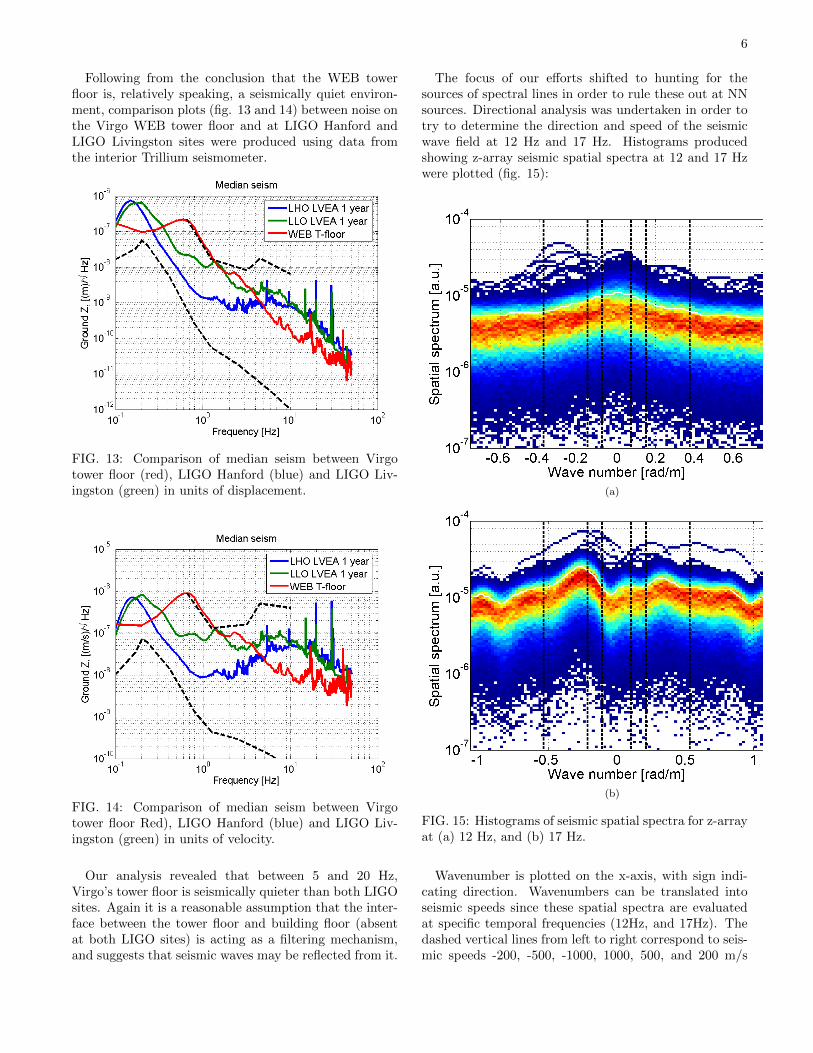
The focus of our efforts shifted to hunting for thesources of spectral lines in order to rule these out at NNsources. Directional analysis was undertaken in order totry to determine the direction and speed of the seismicwave field at 12 Hz and 17 Hz. Histograms producedshowing z-array seismic spatial spectra at 12 and 17 Hzwere plotted (fig. 15):
(a)
(b)
FIG. 15: Histograms of seismic spatial spectra for z-arrayat (a) 12 Hz, and (b) 17 Hz.
Wavenumber is plotted on the x-axis, with sign indi-cating direction. Wavenumbers can be translated intoseismic speeds since these spatial spectra are evaluatedat specific temporal frequencies (12Hz, and 17Hz). Thedashed vertical lines from left to right correspond to seis-mic speeds -200, -500, -1000, 1000, 500, and 200 m/s

7
respectively.
At 12Hz the seismic energy is in high-speed waves,while at 17Hz, the maximum amplitude is at about -350m/s, suggesting that the wave comes from the directionof the corner station. However, since the array is 1D, thisresult is inconclusive.
It is likely, based on previous seismic studies of thearea surrounding the Virgo site (see https://tds.ego-gw.it/itf/tds/index.php?callContent=2callCode=1463),that the 12 Hz line is due to automobile and truck trafficover local bridges.
Adopting this as a reasonable hypothesis, we pro-ceeded with a systematic hunt for the unidentified noisesources. We switched off and back on several mechanicalcomponents in the WEB while the c-array was deployedand taking data. These components are indicated in themap below (fig. 16)
FIG. 16: Map of Virgo’s WEB infrastructure compo-nents.
By switching off the air conditioner, and hot and coldwater pumps we saw a clear reduction in noise in the 20to 30 Hz range (fig. 17)
FIG. 17: Spectrogram showing reduction of noise in 20 to30 Hz range due to WEB mechanical component switch-ing tests with c-array sensors active.
Switch on and off times of the cold water pump cor-responded closely to the noise reduction in this range.Further switching tests of the air compressor, heater andchiller were undertaken to eliminate the uncertainty sur-rounding the variable noise at 17.5 to 20.5 Hz (fig. 18).Unfortunately no conclusive results were obtained.
FIG. 18: Spectrogram showing persistent modulated linebetween 17.5 and 20.5 Hz.
Five sensors were then placed the walls of the structurehousing the suspended bench (SWEB) at the end of thewest arm. Here, by performing a similar switching test,it was conclusively determined that cooling fans on topof the structure are the source of the 17 Hz line (fig. 19).

8
FIG. 19: SWEB fans clearly identified as source of 17 Hzspectral line.
C. Miscellaneous Noise-Hunting Tests
Further investigations were carried out using a singleaccelerometer and a portable spectrum analyzer to at-tempt to determine the source of the modulated noisejumping between 17.5 and 20.5 Hz. We observed thatthe signal amplitude increases approaching the technicalrooms hosting the mechanical infrastructure and foundit to be loudest close to the wall separating the waterpumps and the air conditioning unit. An examination ofdata from the Trillium sensors used in the indoor-outdoornoise tests revealed that this line has virtually equal am-plitude at both interior and exterior (fig. 20) sensor lo-cations, and appears also on spectra from the permanentepisensor located on the tower platform. Efforts are on-going to identify the source of this line.
FIG. 20: Exterior Trillium sensor showing modulated linein 17.5 to 20.5 Hz range.
D. Seismometer WEB Tower Floor CorrelationTest
The correlation properties of seismic motion are notonly important to our understanding of the impact ofNN on test masses, but also for optimizing the sensorarrays designed to cancel out this noise.
Correlation describes the degree to which two signalsare in phase. When they are perfectly in phase, the cor-relation is 1, whereas if they are 180 degrees out of phase,the correlation is -1.
Coherence is a measure of similarity between two sig-nals, and describes how closely the signals would resembleeach other under a linear transformation in time. Thismeans that if one seismic signal can be obtained from alinear transformation of the other, the coherence is equalto one. Completely unrelated signals have a coherence ofzero.
A largely coherent soil mass will require a less dense ar-ray of sensors, whereas relatively incoherent ground willneed a larger number of sensors placed more closely to-gether.
Correlation tests were performed on the tower floor byfixing the location of one Trillium sensor, while placing asecond sensor at consecutively increasing distances. Dis-tances of 2, 7 and 9 meters were chosen. Plots for eachare displayed below in fig. 21, 22, and 23:
FIG. 21: WEB tower floor correlation test at distance 2m.

9
FIG. 22: WEB tower floor correlation test at distance 7m.
FIG. 23: WEB tower floor correlation test at distance 9m.
It appears that while a component of the seismic fieldhas a short correlation length, there is a component at ap-proximately 11 Hz that maintains correlation over longerdistances. It is hypothesized that this component couldbe due to an independent wave source below 10 Hz. It
could also indicate different sources on or off the towerplatform, or wave propagation through the supportingpiles of the tower. This suggests once again that Virgo’sseismic environment is unexpectedly complex and war-rants more detailed study.
IV. CONCLUSIONS
Several local noise sources in 10-20 Hz band, not allof which have been identified, contribute to the complex-ity of Virgo’s NN profile. This suggests that existingNN cancellation models, such as have been developed atLIGO Hanford, are too simple in their current form toimplement at Virgo, and will require much more exten-sive development to be used effectively.
Similarly, structural components in Virgo’s WEB, pri-marily the basement clean room and building-tower in-terface, are causing scattering and reflection of seismicwaves, again making existing NN cancellation models dif-ficult to implement. This is in contrast to the relativelysimple situation at LIGO, where the interferometer sitson a simple concrete slab.
Finally, correlation lengths are quite short at Virgo asevidenced from our tests, and therefore an optimized sen-sor array will require a small diameter and very precisesensor placement.
It is hoped that ongoing efforts to develop more sophis-ticated models will enable the accurate prediction of NNand its subtraction from the Virgo interferometer outputsignal.
ACKNOWLEDGEMENTS
I am grateful to the National Science Foundation forsupporting my participation in the University of Florida’sIREU program in Gravitational Physics. I thank my ad-visors, Dr. Irene Fiori, Dr. Jan Harms, and Dr. Gian-carlo Cella for generously sharing their time and exper-tise. Thanks also to many others at EGO for contribut-ing technical and practical assistance, and for extendingkindness and hospitality during my stay. Finally, I wouldlike to thank the organizers of the IREU program formaking this outstanding opportunity possible.