Embed Size (px)
Citation preview
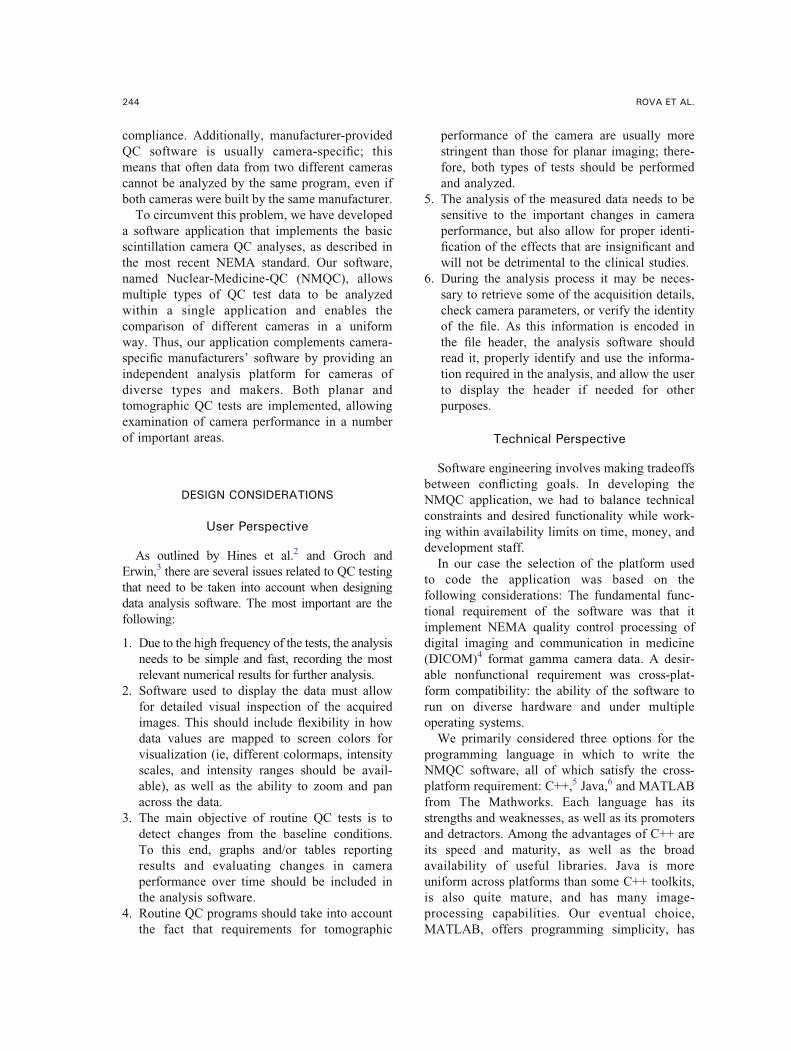
Development of NEMA-based Software for GammaCamera Quality Control
Andrew Rova,1 Anna Celler,2,3 and Ghassan Hamarneh1
We have developed a cross-platform software applica-tion that implements all of the basic standardizednuclear medicine scintillation camera quality controlanalyses, thus serving as an independent complementto camera manufacturers' software. Our applicationallows direct comparison of data and statistics fromdifferent cameras through its ability to uniformly analyzea range of file types. The program has been tested usingmultiple gamma cameras, and its results agree withcomparable analysis by the manufacturers' software.
KEY WORDS: Nuclear medicine, quality control, single-photon emission computed tomography (SPECT), performancemeasurement, image quality analysis
INTRODUCTION
T he flawless performance of nuclear medicine
cameras is of paramount importance for the
accuracy of clinical diagnostic studies because any
malfunction may create image artifacts and alter
patient diagnoses. Therefore, special series of
quality control (QC) tests have been designed to
ensure optimal camera performance. Depending
on the objectives, the extent and scope of these
tests varies. After camera installation, the broadest
and most complete QC assessments or Bacceptancetests^ are done to ensure the correct performance
of the system, verify its compliance with the
published (or manufacturers’) specifications, and
establish the benchmark conditions for all future
measurements. Later, over a camera’s entire
period of clinical operation, hospital technicians
and/or physicists regularly perform various QC
tests—some daily, others weekly, monthly, or
yearly. The purpose of these tests is to monitor
day-to-day camera performance and detect
changes from the baseline values. Additionally,
QC tests may be performed to compare character-
istics of different systems and to optimize the
quality of clinical studies.
To standardize these tests, the National Electri-
cal Manufacturers Association (NEMA) regularly
compiles documents that describe how to perform,
analyze, and report QC tests for scintillation
cameras. The latest of the NEMA standards for
single-photon emission computed tomography
cameras is NU-1 2001.1
The results of tests performed according to
NEMA recommendations allow for easy monitor-
ing and reporting of camera performance, com-
parison of different systems, and/or creation of
consistent QC protocols. However, the fair com-
parison of different systems requires not only
standardized acquisition practices but also that
analysis be done with standardized data process-
ing software. The lack of such software poses a
major challenge in the clinical environment as, in
the majority of cases, the QC analysis is done
using programs supplied by the camera manufac-
turer, many times without a guarantee of NEMA
1From the School of Computing Science, Simon Fraser
University, Burnaby, British Columbia, Canada V5A 1S6.2From the Department of Radiology, University of British
Columbia, Vancouver, British Columbia, Canada.3From the Division of Nuclear Medicine, Vancouver
Hospital and Health Sciences Center, Vancouver, British
Columbia, Canada.
Correspondence to: Andrew Rova, School of Computing
Science, Simon Fraser University, Burnaby, British Columbia,
Canada V5A 1S6; tel: +1-604-5414199; fax: +1-604-2913045;
e-mail: [email protected]
Copyright * 2007 by Society for Imaging Informatics in
Medicine
Online publication 28 March 2007
doi: 10.1007/s10278-007-9030-y
Journal of Digital Imaging, Vol 21, No 2 (June), 2008: pp 243Y255 243
compliance. Additionally, manufacturer-provided
QC software is usually camera-specific; this
means that often data from two different cameras
cannot be analyzed by the same program, even if
both cameras were built by the same manufacturer.
To circumvent this problem, we have developed
a software application that implements the basic
scintillation camera QC analyses, as described in
the most recent NEMA standard. Our software,
named Nuclear-Medicine-QC (NMQC), allows
multiple types of QC test data to be analyzed
within a single application and enables the
comparison of different cameras in a uniform
way. Thus, our application complements camera-
specific manufacturers’ software by providing an
independent analysis platform for cameras of
diverse types and makers. Both planar and
tomographic QC tests are implemented, allowing
examination of camera performance in a number
of important areas.
DESIGN CONSIDERATIONS
User Perspective
As outlined by Hines et al.2 and Groch and
Erwin,3 there are several issues related to QC testing
that need to be taken into account when designing
data analysis software. The most important are the
following:
1. Due to the high frequency of the tests, the analysis
needs to be simple and fast, recording the most
relevant numerical results for further analysis.
2. Software used to display the data must allow
for detailed visual inspection of the acquired
images. This should include flexibility in how
data values are mapped to screen colors for
visualization (ie, different colormaps, intensity
scales, and intensity ranges should be avail-
able), as well as the ability to zoom and pan
across the data.
3. The main objective of routine QC tests is to
detect changes from the baseline conditions.
To this end, graphs and/or tables reporting
results and evaluating changes in camera
performance over time should be included in
the analysis software.
4. Routine QC programs should take into account
the fact that requirements for tomographic
performance of the camera are usually more
stringent than those for planar imaging; there-
fore, both types of tests should be performed
and analyzed.
5. The analysis of the measured data needs to be
sensitive to the important changes in camera
performance, but also allow for proper identi-
fication of the effects that are insignificant and
will not be detrimental to the clinical studies.
6. During the analysis process it may be neces-
sary to retrieve some of the acquisition details,
check camera parameters, or verify the identity
of the file. As this information is encoded in
the file header, the analysis software should
read it, properly identify and use the informa-
tion required in the analysis, and allow the user
to display the header if needed for other
purposes.
Technical Perspective
Software engineering involves making tradeoffs
between conflicting goals. In developing the
NMQC application, we had to balance technical
constraints and desired functionality while work-
ing within availability limits on time, money, and
development staff.
In our case the selection of the platform used
to code the application was based on the
following considerations: The fundamental func-
tional requirement of the software was that it
implement NEMA quality control processing of
digital imaging and communication in medicine
(DICOM)4 format gamma camera data. A desir-
able nonfunctional requirement was cross-plat-
form compatibility: the ability of the software to
run on diverse hardware and under multiple
operating systems.
We primarily considered three options for the
programming language in which to write the
NMQC software, all of which satisfy the cross-
platform requirement: C++,5 Java,6 and MATLAB
from The Mathworks. Each language has its
strengths and weaknesses, as well as its promoters
and detractors. Among the advantages of C++ are
its speed and maturity, as well as the broad
availability of useful libraries. Java is more
uniform across platforms than some C++ toolkits,
is also quite mature, and has many image-
processing capabilities. Our eventual choice,
MATLAB, offers programming simplicity, has
244 ROVA ET AL.
excellent image-processing and plotting capaci-
ties, and features built-in DICOM support. Also,
the speed of development afforded by MAT-
LAB’s built-in functionality made its use advan-
tageous. For example, the integrated plotting
functionality that exists in MATLAB would re-
quire additional external libraries and substantially
more programming to implement in C++.
Another attractive feature of MATLAB is the
Graphical User Interface (GUI) Design Environ-
ment.7 This drag-and-drop user interface design
tool allowed quick prototyping of the applica-
tion’s user interface. While this capability is not
unique to MATLAB, it provides a good comple-
ment to the quick development cycle typical of
MATLAB algorithmic code.
For all its development advantages, MATLAB
would not be a desirable platform if users were
required to own a copy of MATLAB to execute
our program. This was the primary concern with
choosing a software platform created by a private
company rather than an industry standard such as
C++. However, by installing the free MATLAB
Common Runtime (MCR), anyone can run our
software, even if they do not own a license for
MATLAB or the Image Processing Toolbox.
Alternatively, the program can be run directly from
within MATLAB by users who do have a copy
installed. In our opinion, MATLAB is used and
accepted in both industry and academia to a degree
which gives us confidence that, despite being a
private company’s offering, it is a safe choice in
terms of both longevity and cross-platform support.
METHODS
General—File Formats and Display
Our NMQC software reads image and header
information from DICOM files, which have
become a generally recognized format for medical
imaging files. Alternatively, for backwards com-
patibility and historical comparisons, our program
also supports the Interfile8 format, which is still
used in older nuclear medicine cameras. As
mentioned in the BUser Perspective^ section, our
software displays and uses in the analysis some of
the information included in the file header. In
particular, the pixel calibration values that are
necessary for determination of the spatial resolu-
tion of the camera are obtained from the header.
The user, however, can check and override this
information, if appropriate. In our clinical experi-
ence, this is an important feature for ensuring
accurate analyses, especially if incorrect header
information has been saved onto read-only media
such as CD-ROM. Similarly, based on the header
information, the software automatically decides if
the data contains a single image or corresponds to
a multislice tomographic data set.
NEMA QC Tests
The basic design principle of NMQC was to
closely follow NEMA recommendations regarding
processing and analysis of the data.
Uniformity Measurement
Planar uniformity measurement is the most
important QC test. It is performed daily and is
designed to verify camera spatial uniformity and
measure deviations from perfectly uniform count
distributions.
Both intrinsic (acquired without a collimator
and using a point source) and system (with
collimator measured with a flood source) unifor-
mities are analyzed using the same method.
According to NEMA, the acquired data should
be collapsed into a matrix with pixel size equal to
6.4T1.9 mm and filtered with a smoothing filter.
The values of integral or differential uniformities,
defined as
Uniformityð%Þ ¼ Max�Min
MaxþMin
� �� 100% ð1Þ
are calculated over the whole area of the
camera or over five consecutive pixels, respec-
tively. Max and Min are the maximum and
minimum pixel counts, respectively. Both calcu-
lations are done for the full useful field of view
(UFOV) of the camera and the central field of
view (CFOV) corresponding to the middle 75% of
the UFOV.
For every matrix size that may be used in data
acquisition, our software automatically finds the
appropriate compression factor, smoothes the data
and performs calculation for the largest detector
area unaffected by filter boundary effects.
SOFTWARE FOR GAMMA CAMERA QUALITY CONTROL 245
Resolution/Linearity Measurement
The measurement of camera intrinsic resolution
and linearity are performed simultaneously using
a dedicated lead mask with 1-mm slits spaced
every 30 mm in the X or Y direction. The analysis
of intrinsic resolution involves calculation of the
full width at half maximum (FWHM) and the full
width at tenth maximum (FWTM) for each of a
series of profiles drawn across the slit lines. The
mean, maximum, and minimum values for the set
of profiles are then determined. Linearity assess-
ment requires calculation of the deviation of the
maximum value of the profile across each line and
over the whole surface of the camera.
Profile Analysis
Evaluation of the camera spatial resolution in
planar and tomographic modes requires determi-
nation of the FWHM and FWTM of a profile
drawn across the image of a point or line source
(capillary tube filled with activity). The same type
of analysis is applied to a single planar image or
to a series of reconstructed tomographic slices.
For tomographic images, the user has an option to
run through the complete data set of reconstructed
images to select a single slice image for analysis
or to sum several slices and perform the analysis
on a multislice image.
Additionally, the distance between two peaks
can be calculated and displayed, again in pixels
and millimeters. This last test is necessary for
verification and/or determination of the pixel
calibration values.
Center of Rotation Evaluation
Mathematical formalism of tomographic image
reconstruction assumes consistency of the projec-
tions. Therefore, verifying the position of the
camera’s center of rotation (COR) is crucial to the
quality of the reconstructed images. The same rule
applies and the same test is performed for single-
and multidetector systems where tomographic
data of a point source (or sources) is acquired
over a full 360- rotation of each head. This test
must be performed for all collimators and detector
configurations that are used in clinical studies.
Additionally, for cardiac/general purpose cameras
with low-energy high-resolution collimators, the
COR tests include both 90- and 180- detector
configurations.
Data analysis includes display of the sinogram
(a visualization at a particular axial slice showing
transaxial distance on the ordinate and rotation
angle on the abscissa) and linogram (a visualiza-
tion where each successive column is the hori-
zontal sum of the tomographic image at the
respective rotation angle) for visual inspection
for breaks and discontinuities and calculation of
the deviation of the COR value. Figure 5 shows an
example of a linogram break caused by mis-
aligned camera detector heads.
Tomographic Uniformity Measurement
Tomographic performance of a camera is usually
assessed using a tomographic acquisition of a large
cylinder filled with activity. Although a Jaszczak9
phantom contains additional elements such as cold
or hot spheres and rods, its uniform parts are often
used in tomographic uniformity evaluation.
Planar Uniformity Trend Analysis
As mentioned in the BUniformity Measurement^section, the most important QC test that is
performed daily is the measurement of camera
uniformity. Besides allowing for a visual evalua-
tion of image quality, the NMQC software
provides the user with quantitative measurements
of integral and differential uniformity values for
the UFOV and CFOV.
The NMQC Trend Analysis function, described
further in the BPlanar Uniformity Trend Analysis^section, was implemented to facilitate the moni-
toring of camera performance changes over time
by providing a graphical plot of aggregated daily
planar uniformity test results. Currently, only
planar uniformity history is saved, although more
extensive historical archiving of test data is
planned for future versions.
RESULTS AND DISCUSSION
The following discussion parallels the BNEMA
QC Tests^ section and gives the details of our
implementation of each of the previously de-
scribed NEMA QC tests. The figures in this
section show examples of our software variously
246 ROVA ET AL.
analyzing output from GE, Siemens, and Philips
gamma cameras. NMQC has been tested on
numerous gamma camera models, including GE
Infinia and Infinia Hawkeye; Sopha-GE DST;
Philips Forte, Skylight, and Vertex; and Siemens
Ecam, MS2, MS3, Diacam, Orbiter, and Symbia
cameras.
General Features
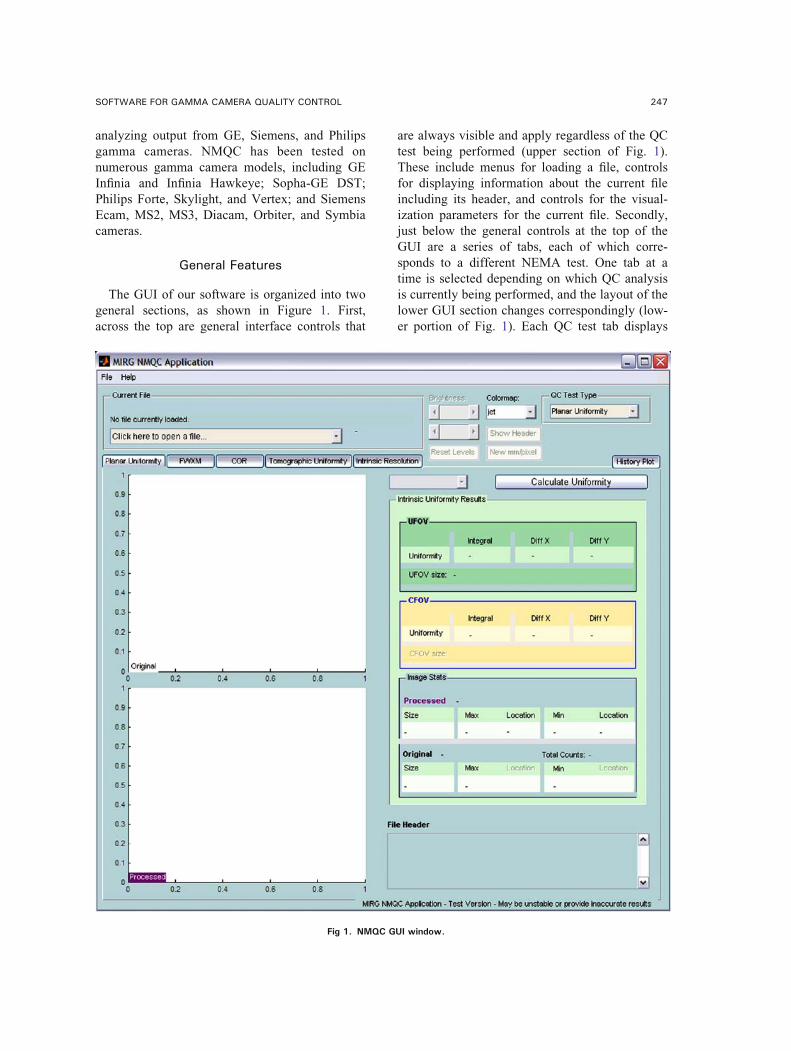
The GUI of our software is organized into two
general sections, as shown in Figure 1. First,
across the top are general interface controls that
are always visible and apply regardless of the QC
test being performed (upper section of Fig. 1).
These include menus for loading a file, controls
for displaying information about the current file
including its header, and controls for the visual-
ization parameters for the current file. Secondly,
just below the general controls at the top of the
GUI are a series of tabs, each of which corre-
sponds to a different NEMA test. One tab at a
time is selected depending on which QC analysis
is currently being performed, and the layout of the
lower GUI section changes correspondingly (low-
er portion of Fig. 1). Each QC test tab displays
Fig 1. NMQC GUI window.
SOFTWARE FOR GAMMA CAMERA QUALITY CONTROL 247
different data and provides different functionality
depending on that particular test’s requirements.
Because each NEMA test is essentially a stand-
alone analysis, organizing the application this way
allows the convenience of access to multiple types
of QC test processing while at the same time
displaying only information and controls applica-
ble to the current method of analysis.
The visualization options that apply to all
modes of analysis provide control for how data
values are displayed on the screen. There are 16
colormaps provided with adjustable upper- and
lower-intensity scale limits, allowing the user to
tailor the visualization of individual data files. The
general section of the program also provides
options related to the currently loaded file’s
header, including controls to view, search, and
export header information.
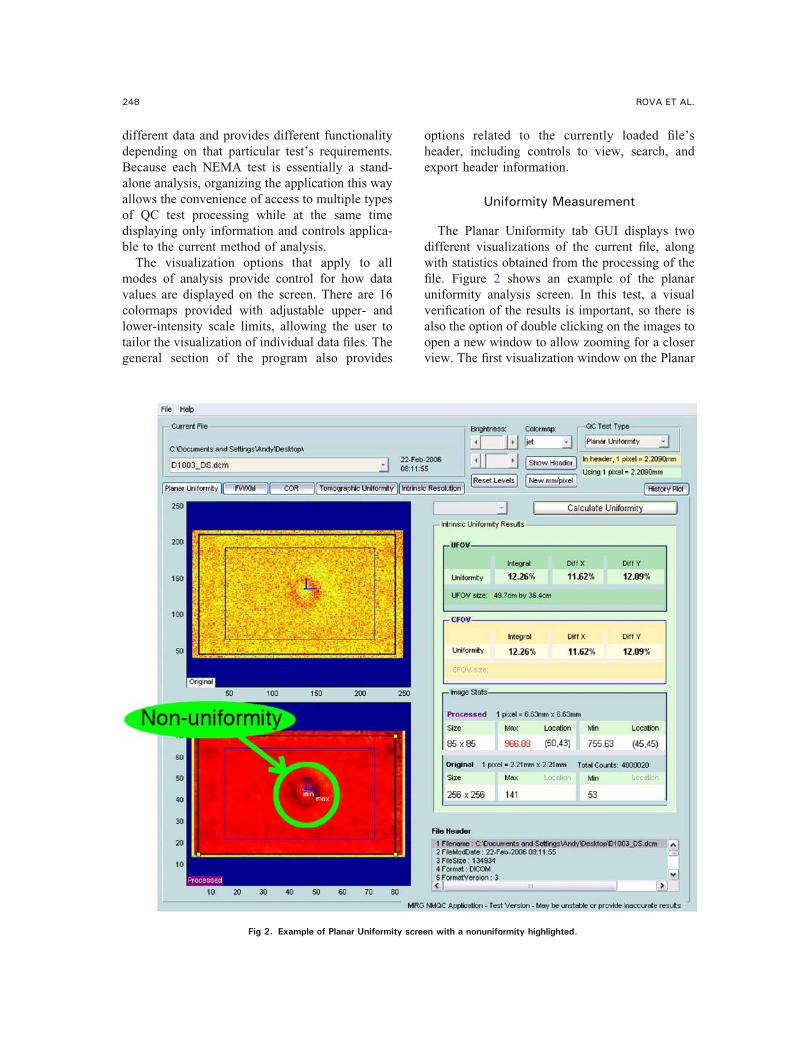
Uniformity Measurement
The Planar Uniformity tab GUI displays two
different visualizations of the current file, along
with statistics obtained from the processing of the
file. Figure 2 shows an example of the planar
uniformity analysis screen. In this test, a visual
verification of the results is important, so there is
also the option of double clicking on the images to
open a new window to allow zooming for a closer
view. The first visualization window on the Planar
Fig 2. Example of Planar Uniformity screen with a nonuniformity highlighted.
248 ROVA ET AL.
Uniformity tab shows the original, unprocessed
file. After processing, the second visualization
window on the Planar Uniformity tab shows the
image that has been filtered according to NEMA
specifications. Also, after analysis, both visualiza-
tion windows show overlays denoting the UFOV
and CFOV, the locations of the maximum and
minimum counts, and the locations of the maxi-
mum horizontal and vertical count derivatives.
Equally importantly, the postanalysis display also
provides integral and differential uniformity sta-
tistics for both the UFOV and CFOV, along with
image and header information, such as pixel size
and total number of counts.
An option to save the results of planar unifor-
mity analysis to a plain-text file is available. The
uniformity statistics, processing parameters, and
header information are saved in a file with a
descriptive name that includes the date, the name
of the file analyzed, and the corresponding detector
number. This allows archiving of daily QC results in
a simple, widely accessible format, and comple-
ments the automatic history functionality described
in the BPlanar Uniformity Trend Analysis^ section.
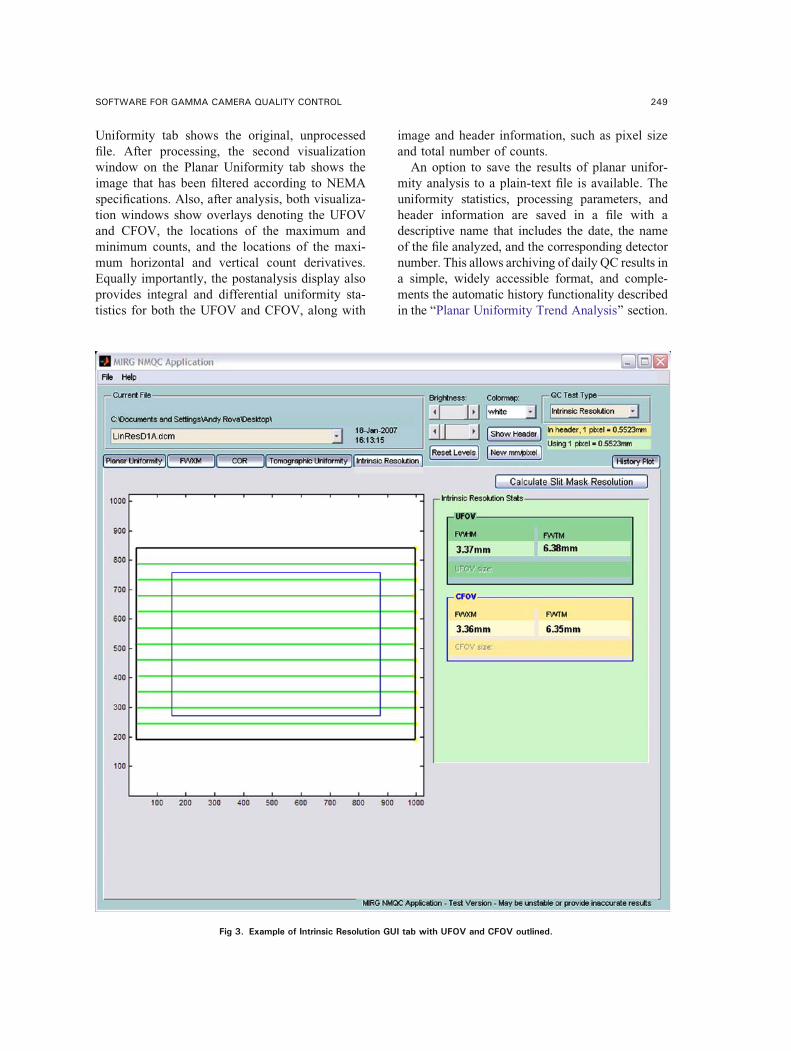
Fig 3. Example of Intrinsic Resolution GUI tab with UFOV and CFOV outlined.
SOFTWARE FOR GAMMA CAMERA QUALITY CONTROL 249
Resolution/Linearity Measurement
The IntrinsicResolutionGUI tab, shown in Figure 3,
allows automated analysis of images captured with an
uncollimated detector covered with a special lead
mask with slits, as described in the BResolution/Linearity Measurement^ section. The NMQC soft-
ware automatically searches the image to identify the
directions and locations of the lines, determines the
boundaries of the UFOV, samples profiles, and
performs the aggregated calculations. The numerical
results are displayed and the calculated UFOV,
CFOV, and detected lines are overlaid on the image
for visual verification of the automated processing.
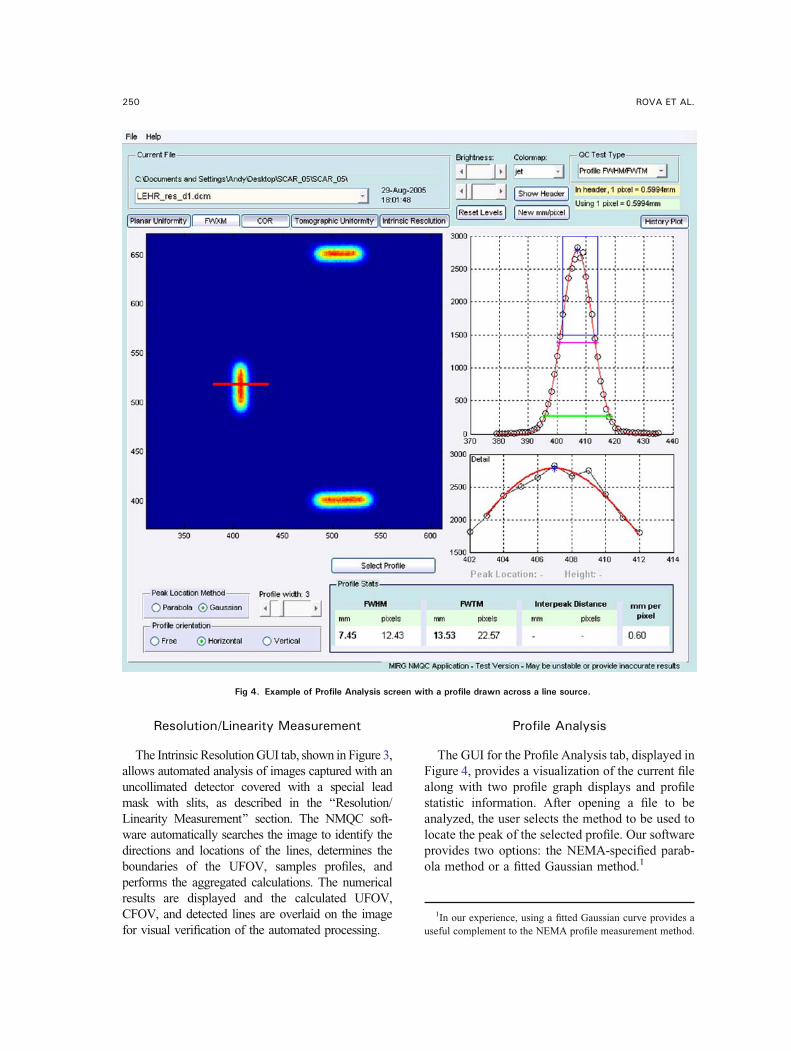
Profile Analysis
The GUI for the Profile Analysis tab, displayed in
Figure 4, provides a visualization of the current file
along with two profile graph displays and profile
statistic information. After opening a file to be
analyzed, the user selects the method to be used to
locate the peak of the selected profile. Our software
provides two options: the NEMA-specified parab-
ola method or a fitted Gaussian method.1
Fig 4. Example of Profile Analysis screen with a profile drawn across a line source.
1In our experience, using a fitted Gaussian curve provides a
useful complement to the NEMA profile measurement method.
250 ROVA ET AL.
At this point the user can also adjust the desired
width of the profile to be analyzed and choose
whether the orientation of allowable profile
selections should be arbitrary, constrained to be
horizontal, or constrained to be vertical. Once the
desired profile characteristics are selected, the
user clicks the Select Profile button and then
clicks twice on the visualization image, the first
click to specify the profile starting point and the
second click to specify the profile’s end. Between
specification of the profile start and end, the
mouse’s image coordinates and a dynamic profile
line are displayed to assist the user in choosing the
desired end point.
Once the start and end points are selected, the
profile is processed. The first graph display shows
the profile plotted with pixels on the abscissa and
counts on the ordinate. In addition, the calculated
peak location, FWHM, and FWTM are displayed.
Also, in the case of the Gaussian method, the
fitted curve is overlaid on the graph. The second
graph display shows a detail of the profile peak,
along with the fitted curve and peak location. If a
profile spanning two peaks is selected, the
interpeak distance (in both millimeters and pixels)
will be calculated and displayed instead of
FWHM/FWTM statistics. In addition, the Profile
Analysis GUI image visualization supports zooming
and panning of the current image to facilitate easier
selection of specific profiles for measurement.
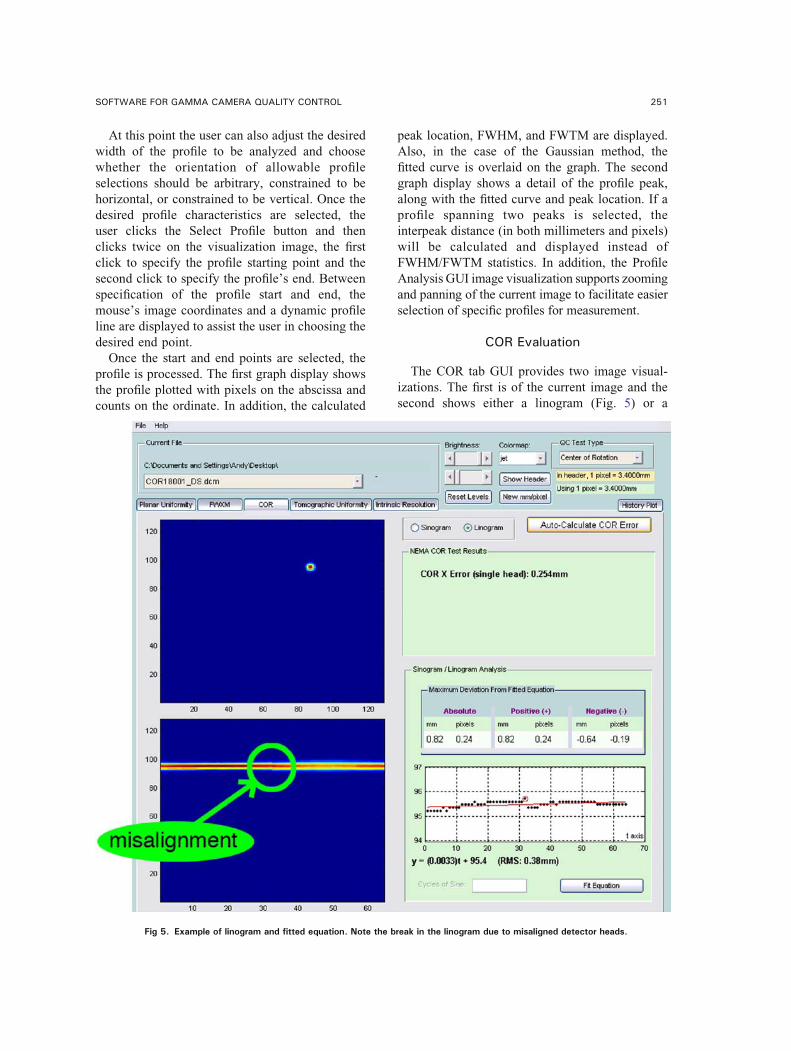
COR Evaluation
The COR tab GUI provides two image visual-
izations. The first is of the current image and the
second shows either a linogram (Fig. 5) or a
Fig 5. Example of linogram and fitted equation. Note the break in the linogram due to misaligned detector heads.
SOFTWARE FOR GAMMA CAMERA QUALITY CONTROL 251
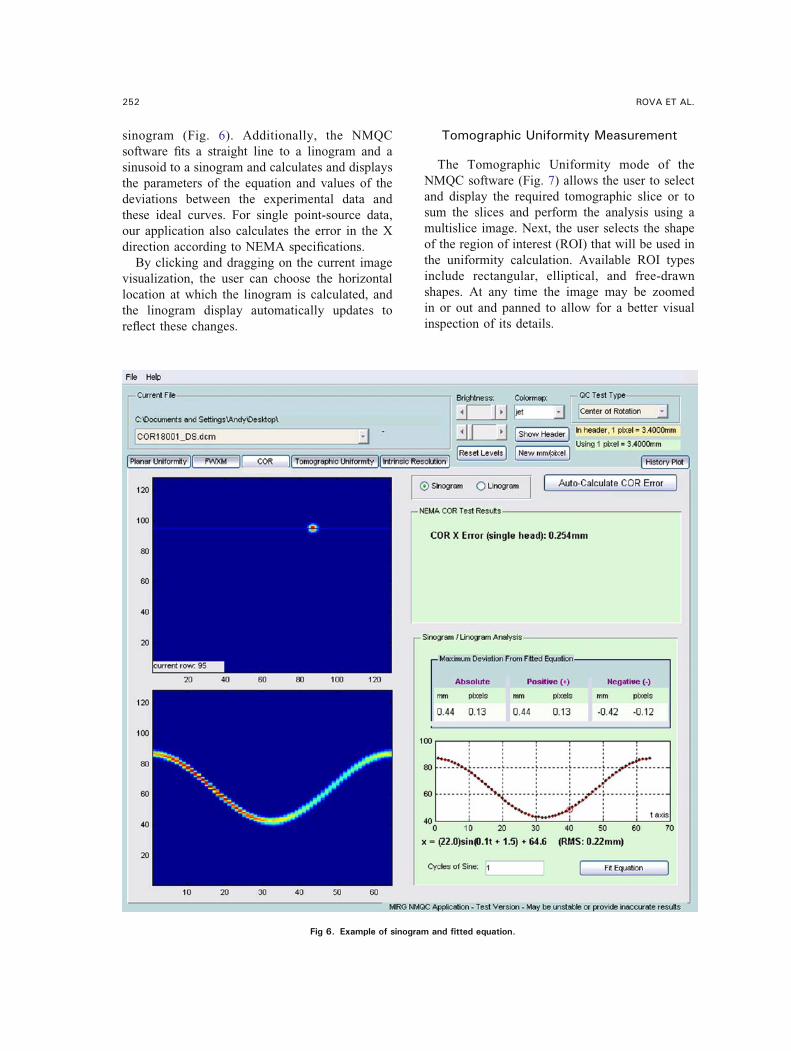
sinogram (Fig. 6). Additionally, the NMQC
software fits a straight line to a linogram and a
sinusoid to a sinogram and calculates and displays
the parameters of the equation and values of the
deviations between the experimental data and
these ideal curves. For single point-source data,
our application also calculates the error in the X
direction according to NEMA specifications.
By clicking and dragging on the current image
visualization, the user can choose the horizontal
location at which the linogram is calculated, and
the linogram display automatically updates to
reflect these changes.
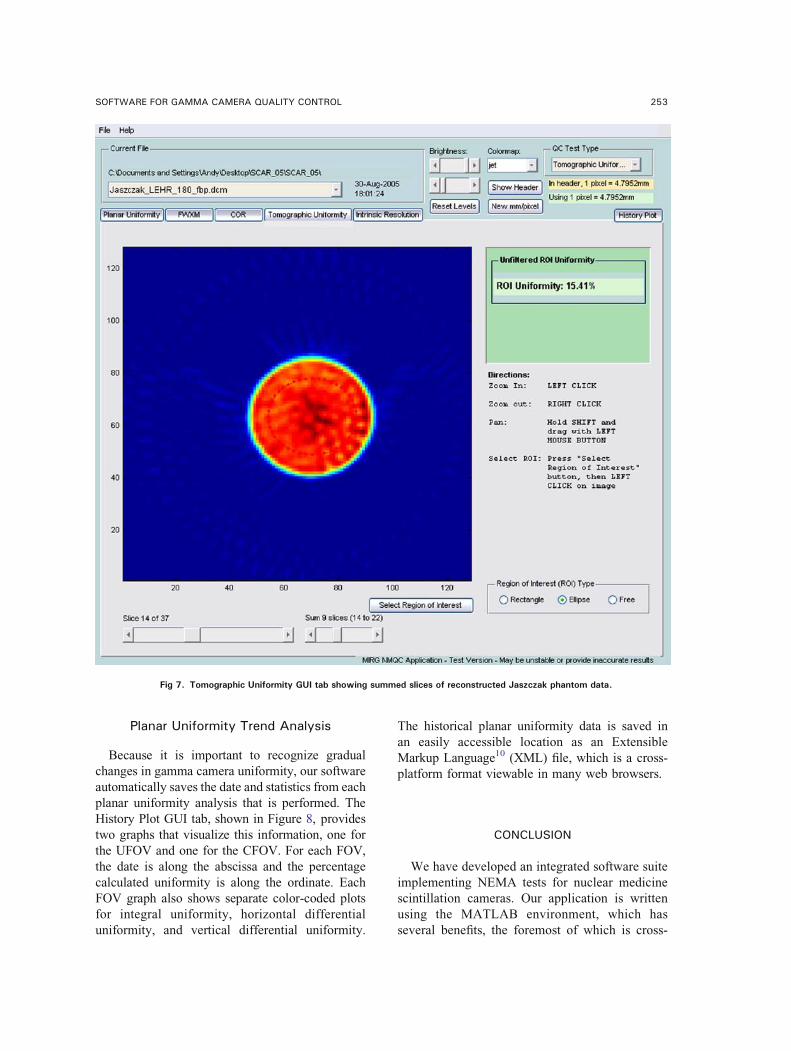
Tomographic Uniformity Measurement
The Tomographic Uniformity mode of the
NMQC software (Fig. 7) allows the user to select
and display the required tomographic slice or to
sum the slices and perform the analysis using a
multislice image. Next, the user selects the shape
of the region of interest (ROI) that will be used in
the uniformity calculation. Available ROI types
include rectangular, elliptical, and free-drawn
shapes. At any time the image may be zoomed
in or out and panned to allow for a better visual
inspection of its details.
Fig 6. Example of sinogram and fitted equation.
252 ROVA ET AL.
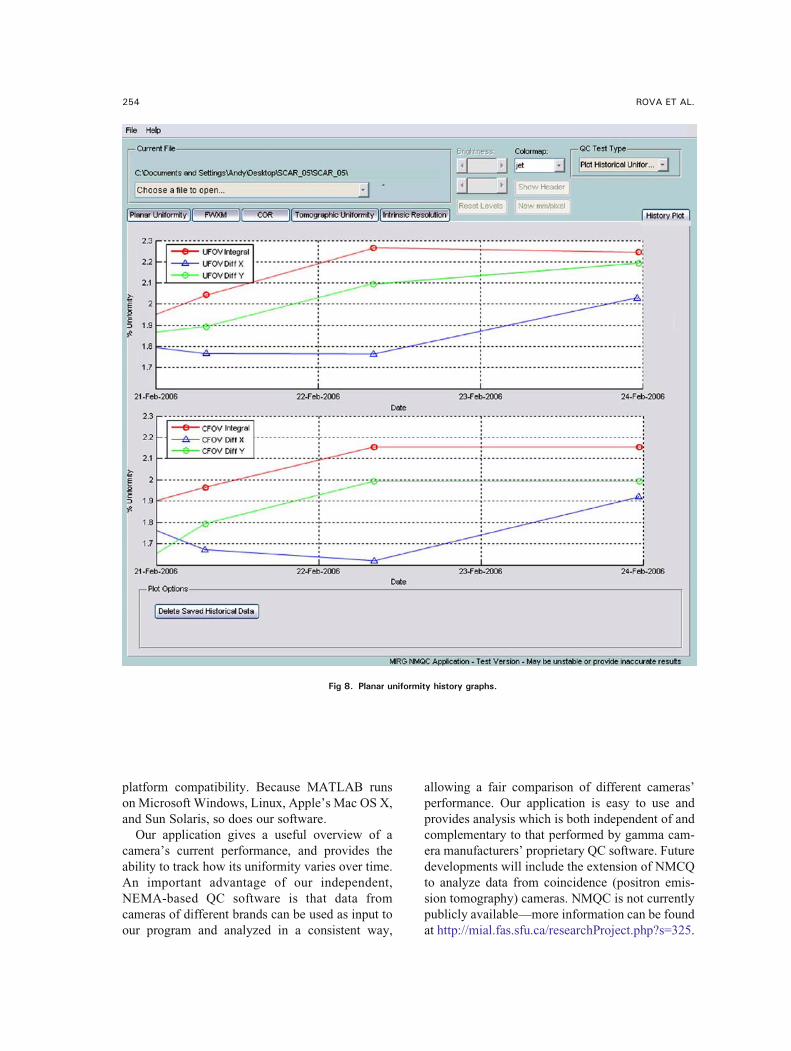
Planar Uniformity Trend Analysis
Because it is important to recognize gradual
changes in gamma camera uniformity, our software
automatically saves the date and statistics from each
planar uniformity analysis that is performed. The
History Plot GUI tab, shown in Figure 8, provides
two graphs that visualize this information, one for
the UFOV and one for the CFOV. For each FOV,
the date is along the abscissa and the percentage
calculated uniformity is along the ordinate. Each
FOV graph also shows separate color-coded plots
for integral uniformity, horizontal differential
uniformity, and vertical differential uniformity.
The historical planar uniformity data is saved in
an easily accessible location as an Extensible
Markup Language10 (XML) file, which is a cross-
platform format viewable in many web browsers.
CONCLUSION
We have developed an integrated software suite
implementing NEMA tests for nuclear medicine
scintillation cameras. Our application is written
using the MATLAB environment, which has
several benefits, the foremost of which is cross-
Fig 7. Tomographic Uniformity GUI tab showing summed slices of reconstructed Jaszczak phantom data.
SOFTWARE FOR GAMMA CAMERA QUALITY CONTROL 253
platform compatibility. Because MATLAB runs
on Microsoft Windows, Linux, Apple’s Mac OS X,
and Sun Solaris, so does our software.
Our application gives a useful overview of a
camera’s current performance, and provides the
ability to track how its uniformity varies over time.
An important advantage of our independent,
NEMA-based QC software is that data from
cameras of different brands can be used as input to
our program and analyzed in a consistent way,
allowing a fair comparison of different cameras’
performance. Our application is easy to use and
provides analysis which is both independent of and
complementary to that performed by gamma cam-
era manufacturers’ proprietary QC software. Future
developments will include the extension of NMCQ
to analyze data from coincidence (positron emis-
sion tomography) cameras. NMQC is not currently
publicly available—more information can be found
at http://mial.fas.sfu.ca/researchProject.php?s=325.
Fig 8. Planar uniformity history graphs.
254 ROVA ET AL.
REFERENCES
1. National Electrical Manufacturers Association: NEMA
NU 1-2001: Performance measurements of scintillation cam-
eras. http://www.nema.org/stds/nu1.cfm. Rosslyn: National
Electrical Manufacturers Association, 2001
2. Hines H, Kayayan R, Colsher J, Hashimoto D, Schubert
R, Fernando J, Simcic V, Vernon P, Sinclair RL: Recommen-
dations for implementing SPECT instrumentation quality
control. Eur J Nucl Med 26:527Y532, 19993. Groch M, Erwin WD: Single-photon emission computed
tomography in the year 2001: instrumentation and quality
control. J Nucl Med Technol 29:9Y15, 20014. National Electrical Manufacturers Association: Digital
imaging and communications in medicine (DICOM).
http://medical.nema.org. Rosslyn, National Electrical Manu-
facturers Association, 2004
5. Stroustrup B: The C++ Programming Language. Read-
ing: Addison-Wesley, 2004
6. Joy B, Steele G, Gosling J, Bracha G: The Java Language
Specification. Boston: Addison-Wesley, 2000
7. The Mathworks: MATLAB Creating graphical user
interfaces. http://www.mathworks.com/access/helpdesk/help/
pdf_doc/matlab/buildgui.pdf. Natick: The Mathworks, 2000
8. Todd-Pokropek A, Cradduck TD, Deconinck F: A file format
for the exchange of nuclear medicine image data: a specification of
Interfile version 3.3. Nucl Med Commun 13(9):673Y699, 19929. Data Spectrum: http://www.spect.com/pub/Flanged_
Jaszczak_Phantoms.pdf. Hillsborough: Data Spectrum
10. World Wide Web Consortium: Extensible Markup
Language (XML). http://www.w3.org/XML/. Cambridge:
World Wide Web Consortium, 2006
SOFTWARE FOR GAMMA CAMERA QUALITY CONTROL 255