Embed Size (px)
Citation preview
Wor
king
Pape
r
Development of the Monsoonal Asia Climate Risk Analysis MaproomsWorking Paper No. 233
CGIAR Research Program on Climate Change, Agriculture and Food Security (CCAFS)
Aisha OwusuSebastian BonelliAndrew W. RobertsonJames Hansen
Monsoonal Asia Climate Risk Analysis Maprooms Working Paper No. 233 CGIAR Research Program on Climate Change, Agriculture and Food Security (CCAFS) Aisha Owusu Sebastian Bonelli Andrew W. Robertson James Hansen
2
Correct citation: Owusu A, Bonelli S, Robertson A, Hansen J, 2018. Development of Monsoonal Asia Climate Risk Analysis Maprooms. CCAFS Working Paper no. 233. Wageningen, The Netherlands: CGIAR Research Program on Climate Change, Agriculture and Food Security (CCAFS). Available online at: www.ccafs.cgiar.org Titles in this Working Paper series aim to disseminate interim climate change, agriculture and food security research and practices and stimulate feedback from the scientific community. The CGIAR Research Program on Climate Change, Agriculture and Food Security (CCAFS) is a strategic partnership of CGIAR and Future Earth, led by the International Center for Tropical Agriculture (CIAT). The Program is carried out with funding by CGIAR Fund Donors, Australia (ACIAR), Ireland (Irish Aid), Netherlands (Ministry of Foreign Affairs), New Zealand Ministry of Foreign Affairs & Trade; Switzerland (SDC); Thailand; The UK Government (UK Aid); USA (USAID); The European Union (EU); and with technical support from The International Fund for Agricultural Development (IFAD). Contact: CCAFS Program Management Unit - Wageningen University & Research, Lumen building, Droevendaalsesteeg 3a,6708 PB Wageningen, The Netherlands Email: [email protected] Creative Commons License
This Working Paper is licensed under a Creative Commons Attribution – NonCommercial–NoDerivs 3.0 Unported License. Articles appearing in this publication may be freely quoted and reproduced provided the source is acknowledged. No use of this publication may be made for resale or other commercial purposes. © 2018 CGIAR Research Program on Climate Change, Agriculture and Food Security (CCAFS). CCAFS Working Paper no. 233. DISCLAIMER: This Working Paper has been prepared as an output for the Flagship 4: Climate Services and Safety Nets under the CCAFS program and has not been peer reviewed. Any opinions stated herein are those of the author(s) and do not necessarily reflect the policies or opinions of CCAFS, donor agencies, or partners. All images remain the sole property of their source and may not be used for any purpose without written permission of the source.
3
Abstract
The Asian monsoon plays a major role in the variability of seasonal temperature and
precipitation and the sub-seasonal statistics of these and other climate variables. Due to its
considerable impact on the quality and quantity of agricultural output, there is an essential
need for greater understanding of the historical risk associated with the Asian monsoon, with
the ultimate goal being better climate risk analysis to support agricultural decision-making in
South and Southeast Asia. In response to partner demand expressed by the CCAFS South
Asia Regional Program, CCAFS worked with the International Research Institute for Climate
and Society (IRI) to develop a suite of online Maproom tools for analyzing agriculturally
important aspects of climate variability, based on gridded historical daily precipitation and
temperature data. This report documents the rationale, development, and use of the Monsoon
Asia Historical Precipitation and Temperature Monitoring Maprooms. These tools aim to
provide enough flexibility to support a demanding range of analysis and decision support
needs. The weather factors that impact agriculture, and the analyses that are needed to
support agricultural decision-making, vary considerably by location, production system and
time of year. These Maprooms serve as the precursors to the Daily Climate Analysis
Maprooms that was developed later.
Keywords
Monsoon; analysis; statistic; precipitation; temperature; Maprooms
4
About the authors
Aisha Owusu is a Staff Associate at IRI. She contributes to research, education, outreach,
and project management efforts within the Climate Information for Public Health Action and
Enhancing National Climate Services teams. In addition, she serves as an instructor and
lecturer for the Master’s in Climate and Society Program at Columbia University. Contact:
Sebastian Bonelli is at Water Security Specialist at The Nature Conservancy.
Andrew W. Robertson is a Research Scientist at the International Research Institute for
Climate and Society (IRI) at Columbia University. He currently leads IRI’s climate group,
which works on a number of climate prediction, observation and forecasting projects across
the globe. His current work focuses on bringing climate information into regional projects that
seek to demonstrate the value of climate risk management through targeted research, tool
development and training and outreach. Contact: [email protected]
James Hansen is a Senior Research Scientist at the International Research Institute for
Climate and Society (IRI) at Columbia University, USA. He leads the CCAFS Flagship on
Climate Services and Safety Nets. Contact: [email protected]
5
Contents
Introduction .................................................................................................................... 6Maproom Features ......................................................................................................... 7
Underlying data .......................................................................................................... 7Derived variables ....................................................................................................... 8Selection of Time and Spatial Domain .................................................................... 10Visualization of Results ........................................................................................... 10
Maproom Examples ..................................................................................................... 10Analyzing Drought Risk (Number of Dry Spells) in Bangladesh ........................... 10Analysing Heat Risk (Number of Hot Days) in India .............................................. 12
Conclusion ................................................................................................................... 14Appendix: Navigating the Maproom Interface ............................................................ 16References .................................................................................................................... 21
6
Introduction
Year-to-year variability in growing season weather conditions, driven in part by the Asian
Monsoon system, exposes agriculture to a high degree of risk. This is particularly true for
smallholder farming in marginal rainfed environments. Extreme events, such as droughts,
flooding and heat waves, lead to loss of crops, livestock and farmer livelihoods. Even in
years with favorable climatic conditions, the resulting uncertainty is a disincentive to
investment in agriculture and adoption of available production technology.
In response to partner demand expressed by the CCAFS South Asia Regional Program,
CCAFS worked with the International Research Institute for Climate and Society (IRI) to
develop a suite of online Maproom tools for analyzing agriculturally important aspects of
climate variability, based on gridded historical daily precipitation and temperature data.
The design of these tools aims to provide enough flexibility to support a demanding range of
analysis and decision support needs. The weather factors that impact agriculture, and the
analyses that are needed to support agricultural decision-making, vary considerably by
location, production system and time of year. Furthermore, we anticipated that farmers, their
advisors and other local decision-makers would need location-specific analyses, while
governments and institutions working at an aggregate scale would likely be interested in
spatial patterns of risk. Finally, many of the meteorological risks that are important for
agriculture cannot be characterized adequately by season average conditions, but require
analyses based on daily time series data. Harvest yields are sensitive to the dynamic
interactions between crop phenology, the impact of daily precipitation and evapotranspiration
on the soil water balance, and the timing of temperature or water stress.
This report describes the development and main features of the resulting Monsoonal Asia
Climate Risk Analysis Maproom, provides guidance on navigating its interface and presents
two hypothetical examples that illustrate potential for decision support applications. The
development of the Monsoonal Asia Climate Risk Analysis Maproom, in 2013-2014,
followed and built on earlier development of an online Maproom to support spatial analysis of
7
seasonal rainfall predictability across South Asia, to inform the development of downscaled
seasonal forecast systems (Robertson et al., 2013).
Maproom Features
The Monsoon Asia Historical Precipitation and Temperature Monitoring Maprooms allows
for the calculation of different statistics based in historical daily precipitation and temperature
data. Some examples of the rainfall statistics include the historical probability of receiving
less than a specified number of rain days within a growing season and the historical risk of
dry spells (of user-chosen durations) within a critical crop stage. Statistics for temperature
include heating degrees days (accumulated deficits between the mean daily temperature and a
user-defined reference temperature during the season), and the number of cold and hot days
relative to a user-defined threshold. The user can visualize these statistics and other results in
a map grid and also check the historic observations for one specific grid box.
The Monsoon Asia Historical Precipitation Maproom can be accessed online at
http://iridl.ldeo.columbia.edu/maproom/Agriculture/Historical_Monitoring/SouthAsia_Precip.
html and the Monsoon Asia Historical Temperature Maproom at
http://iridl.ldeo.columbia.edu/maproom/Agriculture/Historical_Monitoring/SouthAsia_Temp.
html.
Underlying data
The Monsoon Asia Historical Precipitation and Temperature Monitoring Maprooms make use
of the Asian Precipitation - Highly-Resolved Observational Data Integration Towards
Evaluation of the Water Resources (APHRODITE) daily rainfall dataset (1951– 2007) (Xie et
al., 2007) and interpolated temperature dataset (1973-2007) (Yasutomi et al., 2011) of
monsoon Asia (15°S-55°N, 60°E-155°E). APHRODITE datasets were created in
collaboration with Research Institute for Humanity and Nature and Meteorological Research
Institute of Japan Meteorological Agency. The 0.5x0.5 and 0.25x0.25-degree gridded
precipitation suite (version: V1003R1) was derived from original rain-gauge data,
precompiled datasets, and global telecommunication system reports. The temperature suite
8
(version: V1204R1), also at the same resolution, was developed by utilizing the collection of
observed temperature data.
Derived variables
The Maprooms provide analysis of several variables, derived for user-specified time windows
from gridded daily time series data, that are relevant to agriculture. In rainfed production, crop
yields are a function of dynamic, nonlinear interactions between daily rainfall, the soil water
balance and crop growth stage. The soil water balance, and hence water available to the crop,
is sensitive to the distribution of rainfall within the growing season. In addition to total
rainfall in a user-selected window, the Monsoon Asia Historical Precipitation Monitoring
Maproom provides several higher-order statistics of rainfall that affect the soil water balance
and hence the soil’s ability to meet crop water requirements: rainfall intensity, number of rain
days, and number of dry and wet spells of a user-selected length. Disaggregating total rainfall
during a particular time of year into frequency of rain days and mean intensity on rain days
provides an indication of how much observed year-to-year variability is due to the frequency
of storms versus the intensity of storms. Setting the dry spells for periods that are long enough
to deplete soil water in the root zone is often used an indicator of risk of crop water stress
(Sivakumar, 1992; Stern & Cooper 2011; Barron et al., 2003). The intensity of rainfall
influences how much rainfall infiltrates the soil, risk of soil erosion, and nutrient movement
within the soil (Dourte et al., 2015).
The Monsoon Asia Historical Temperature Monitoring Maproom provides analysis of number
of cold days below a threshold, number of hot days above a threshold, growing degree days,
and chilling degree days. Frequency of hot and cold extremes relative to user-selected
thresholds is included because of the negative impact that temperature extremes can have on
crop yields and on livestock health. The concept of thermal time, expressed as has the
accumulation over time of temperature relative to a baseline, multiplied by the amount of time
the temperature is above or below this baseline, is used extensively for analyzing crop
phenology (Trudgill et al., 2005). Growing degree-days, defined as the thermal time above a
crop-specific baseline temperature and summed across days from the time of germination, is a
widely used predictor of time to flowering and maturity, for crops that are not sensitive to
daylength and do not require cold temperatures to stimulate flowering (McMaster & Wilhelm,
1997; Li et al., 2012). A number of crops, including winter wheat and many deciduous fruit
9
species, require an accumulation of chill units to stimulate flowering (Luedeling, 2012). Chill
units are analogous to growing degree days but are typically expressed in unites of degree-
hours below a crop-specific threshold temperature. Analyses of thermal time and damaging
extreme temperature events are normally based on daily minimum and maximum
temperature, or data at a higher temporal resolution, to account for the important diurnal
variations in temperature. Thermal time calculations were simplified to use daily averages
because APHRODITE gridded daily temperature data was only available as a daily average.
The resulting bias could be substantial relative to thermal time calculations that account for
the diurnal temperature range.
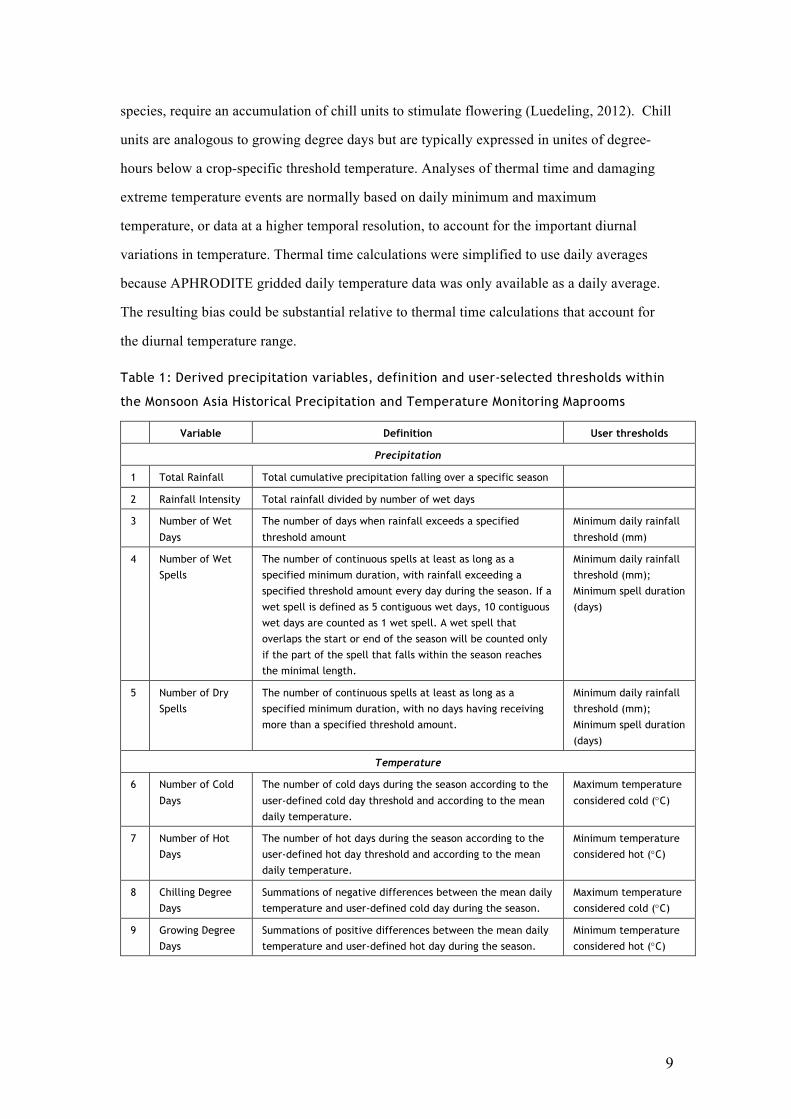
Table 1: Derived precipitation variables, definition and user-selected thresholds within
the Monsoon Asia Historical Precipitation and Temperature Monitoring Maprooms
Variable Definition User thresholds
Precipitation
1 Total Rainfall Total cumulative precipitation falling over a specific season
2 Rainfall Intensity Total rainfall divided by number of wet days
3 Number of Wet
Days
The number of days when rainfall exceeds a specified
threshold amount
Minimum daily rainfall
threshold (mm)
4 Number of Wet
Spells
The number of continuous spells at least as long as a
specified minimum duration, with rainfall exceeding a
specified threshold amount every day during the season. If a
wet spell is defined as 5 contiguous wet days, 10 contiguous
wet days are counted as 1 wet spell. A wet spell that
overlaps the start or end of the season will be counted only
if the part of the spell that falls within the season reaches
the minimal length.
Minimum daily rainfall
threshold (mm);
Minimum spell duration
(days)
5 Number of Dry
Spells
The number of continuous spells at least as long as a
specified minimum duration, with no days having receiving
more than a specified threshold amount.
Minimum daily rainfall
threshold (mm);
Minimum spell duration
(days)
Temperature
6 Number of Cold
Days
The number of cold days during the season according to the
user-defined cold day threshold and according to the mean
daily temperature.
Maximum temperature
considered cold (°C)
7 Number of Hot
Days
The number of hot days during the season according to the
user-defined hot day threshold and according to the mean
daily temperature.
Minimum temperature
considered hot (°C)
8 Chilling Degree
Days
Summations of negative differences between the mean daily
temperature and user-defined cold day during the season.
Maximum temperature
considered cold (°C)
9 Growing Degree
Days
Summations of positive differences between the mean daily
temperature and user-defined hot day during the season.
Minimum temperature
considered hot (°C)
10
Selection of Time and Spatial Domain
The user has the ability to specify the range of years over which to perform the analysis and
choose the start and end dates of the season (e.g. Jan 1-Jun 15) over which the diagnostics are
to be performed. All Maproom results and statistics (total rainfall, number of cold days, etc.)
shown will be associated with these years and season. The Maproom will then default to
displaying the entire monsoon Asia (15°S-55°N, 60°E-155°E) map. To select a more specific
region, the user can draw a rectangle with the left click of the mouse on top of the map and
select that region (i.e. click, drag and release).
Visualization of Results
After the selection of the aforementioned variables, a map view presents the variables selected
for the chosen season and range of years produces maps. Users can view the results spatially
as either the mean, the standard deviation, probability of exceeding a user specified threshold,
coefficient of variation (ratio of standard deviation to the mean) in percentage, or percentile of
historical distribution (e.g., 0.1, 0.25, 0.5, 0.75 and 0.9). After a map has been generated, the
user has the ability to click on any point on the map in order to create a timeseries line graph
for that specific location. The timeseries graph—which captures the years, season, and
seasonal variable previously selected—provides pixel-scale information about climate
variability and trends.
Maproom Examples
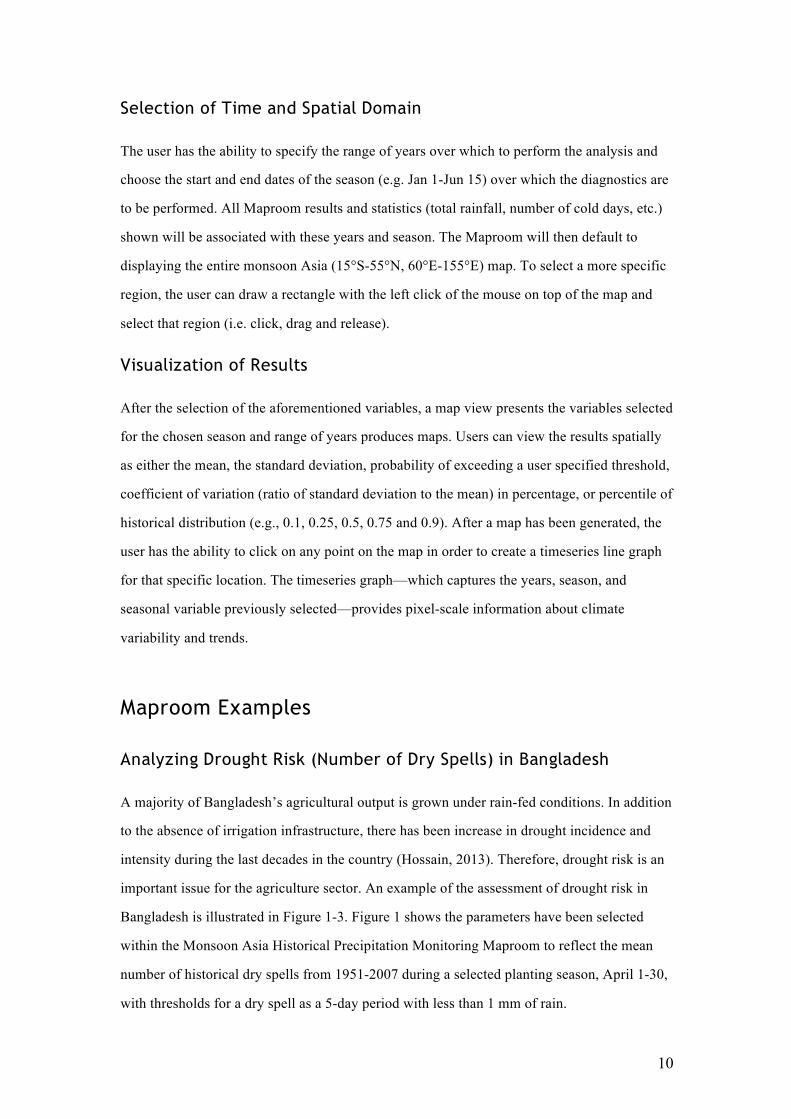
Analyzing Drought Risk (Number of Dry Spells) in Bangladesh
A majority of Bangladesh’s agricultural output is grown under rain-fed conditions. In addition
to the absence of irrigation infrastructure, there has been increase in drought incidence and
intensity during the last decades in the country (Hossain, 2013). Therefore, drought risk is an
important issue for the agriculture sector. An example of the assessment of drought risk in
Bangladesh is illustrated in Figure 1-3. Figure 1 shows the parameters have been selected
within the Monsoon Asia Historical Precipitation Monitoring Maproom to reflect the mean
number of historical dry spells from 1951-2007 during a selected planting season, April 1-30,
with thresholds for a dry spell as a 5-day period with less than 1 mm of rain.
11
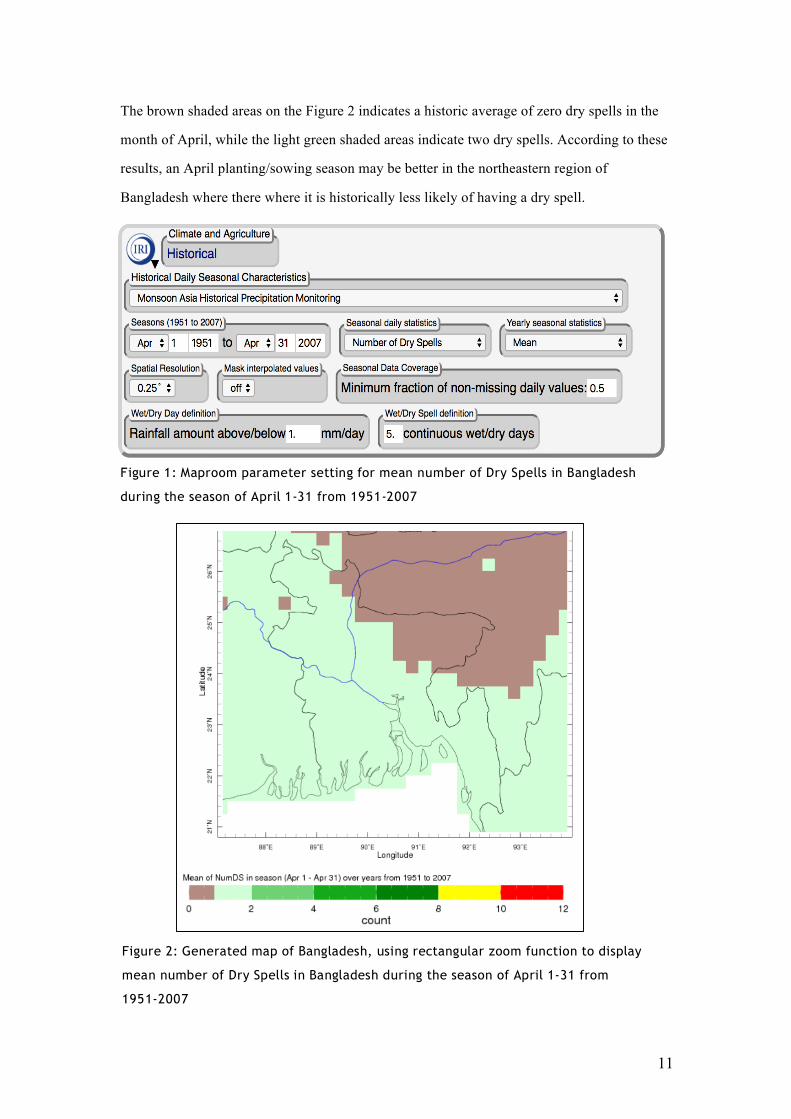
The brown shaded areas on the Figure 2 indicates a historic average of zero dry spells in the
month of April, while the light green shaded areas indicate two dry spells. According to these
results, an April planting/sowing season may be better in the northeastern region of
Bangladesh where there where it is historically less likely of having a dry spell.
Figure 1: Maproom parameter setting for mean number of Dry Spells in Bangladesh
during the season of April 1-31 from 1951-2007
Figure 2: Generated map of Bangladesh, using rectangular zoom function to display
mean number of Dry Spells in Bangladesh during the season of April 1-31 from
1951-2007
12
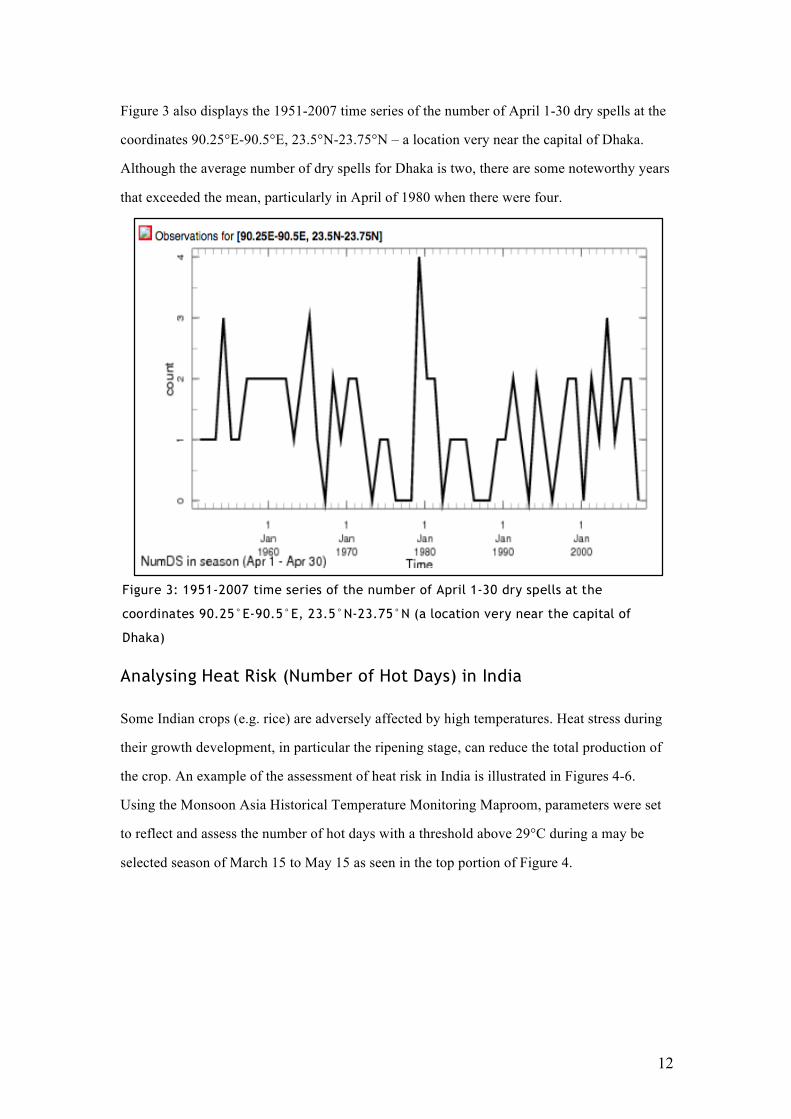
Figure 3 also displays the 1951-2007 time series of the number of April 1-30 dry spells at the
coordinates 90.25°E-90.5°E, 23.5°N-23.75°N – a location very near the capital of Dhaka.
Although the average number of dry spells for Dhaka is two, there are some noteworthy years
that exceeded the mean, particularly in April of 1980 when there were four.
Analysing Heat Risk (Number of Hot Days) in India
Some Indian crops (e.g. rice) are adversely affected by high temperatures. Heat stress during
their growth development, in particular the ripening stage, can reduce the total production of
the crop. An example of the assessment of heat risk in India is illustrated in Figures 4-6.
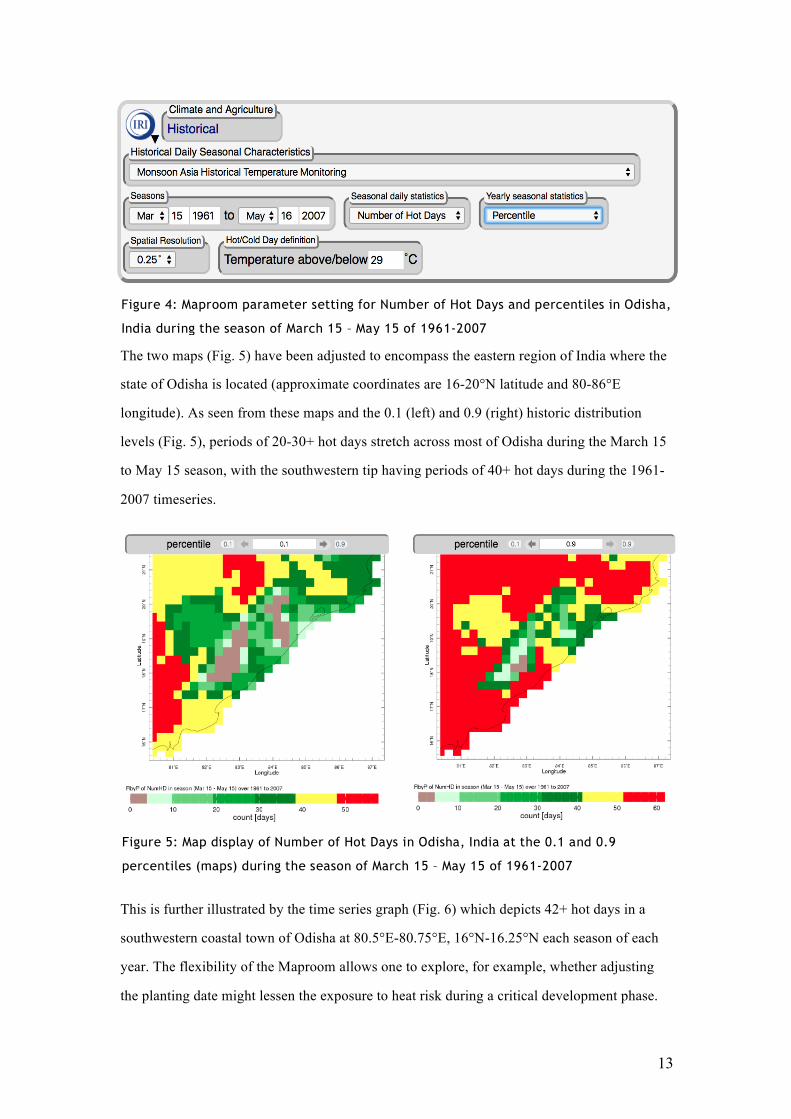
Using the Monsoon Asia Historical Temperature Monitoring Maproom, parameters were set
to reflect and assess the number of hot days with a threshold above 29°C during a may be
selected season of March 15 to May 15 as seen in the top portion of Figure 4.
Figure 3: 1951-2007 time series of the number of April 1-30 dry spells at the
coordinates 90.25°E-90.5°E, 23.5°N-23.75°N (a location very near the capital of
Dhaka)
13
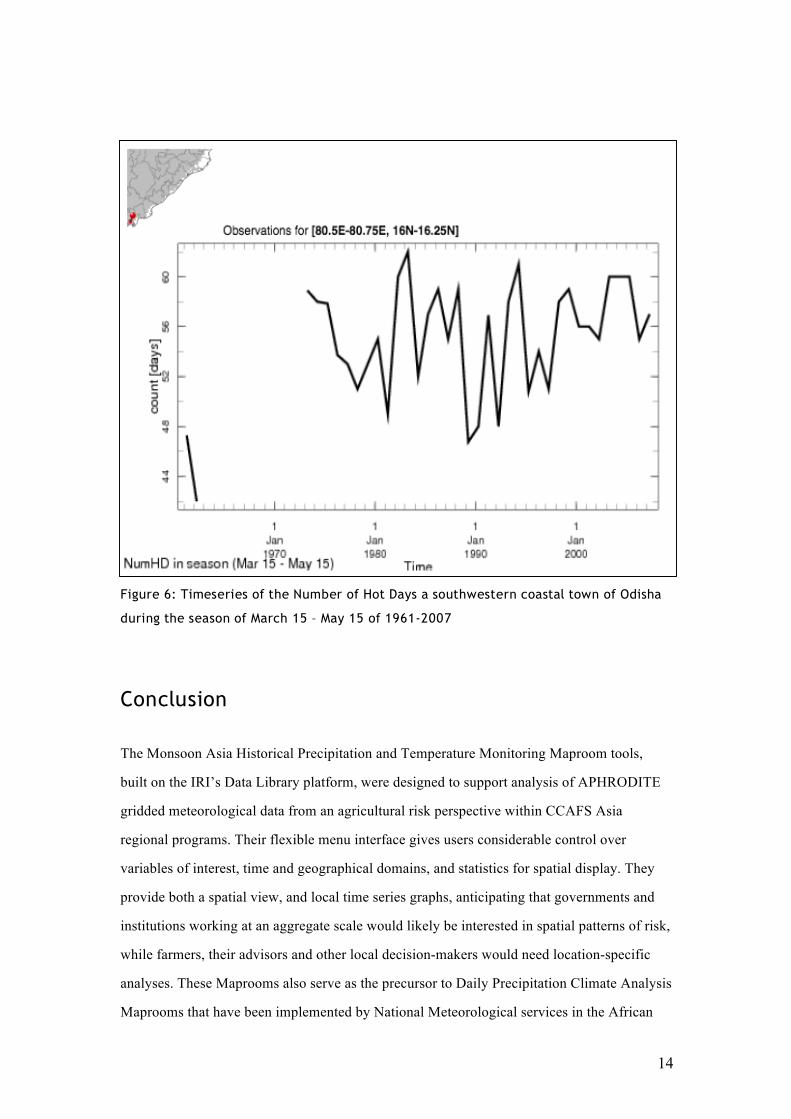
The two maps (Fig. 5) have been adjusted to encompass the eastern region of India where the
state of Odisha is located (approximate coordinates are 16-20°N latitude and 80-86°E
longitude). As seen from these maps and the 0.1 (left) and 0.9 (right) historic distribution
levels (Fig. 5), periods of 20-30+ hot days stretch across most of Odisha during the March 15
to May 15 season, with the southwestern tip having periods of 40+ hot days during the 1961-
2007 timeseries.
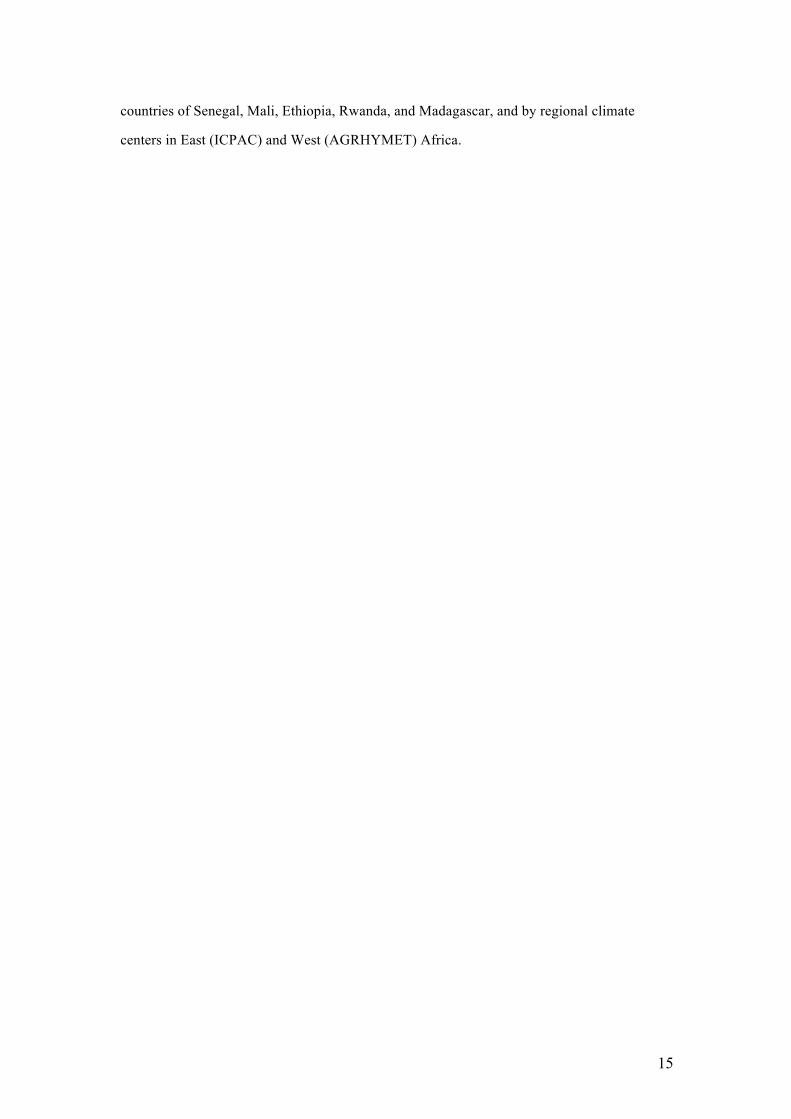
This is further illustrated by the time series graph (Fig. 6) which depicts 42+ hot days in a
southwestern coastal town of Odisha at 80.5°E-80.75°E, 16°N-16.25°N each season of each
year. The flexibility of the Maproom allows one to explore, for example, whether adjusting
the planting date might lessen the exposure to heat risk during a critical development phase.
Figure 4: Maproom parameter setting for Number of Hot Days and percentiles in Odisha,
India during the season of March 15 – May 15 of 1961-2007
Figure 5: Map display of Number of Hot Days in Odisha, India at the 0.1 and 0.9
percentiles (maps) during the season of March 15 – May 15 of 1961-2007
14
Conclusion
The Monsoon Asia Historical Precipitation and Temperature Monitoring Maproom tools,
built on the IRI’s Data Library platform, were designed to support analysis of APHRODITE
gridded meteorological data from an agricultural risk perspective within CCAFS Asia
regional programs. Their flexible menu interface gives users considerable control over
variables of interest, time and geographical domains, and statistics for spatial display. They
provide both a spatial view, and local time series graphs, anticipating that governments and
institutions working at an aggregate scale would likely be interested in spatial patterns of risk,
while farmers, their advisors and other local decision-makers would need location-specific
analyses. These Maprooms also serve as the precursor to Daily Precipitation Climate Analysis
Maprooms that have been implemented by National Meteorological services in the African
Figure 6: Timeseries of the Number of Hot Days a southwestern coastal town of Odisha
during the season of March 15 – May 15 of 1961-2007
15
countries of Senegal, Mali, Ethiopia, Rwanda, and Madagascar, and by regional climate
centers in East (ICPAC) and West (AGRHYMET) Africa.
16
Appendix: Navigating the Maproom Interface
Main elements of the Maproom
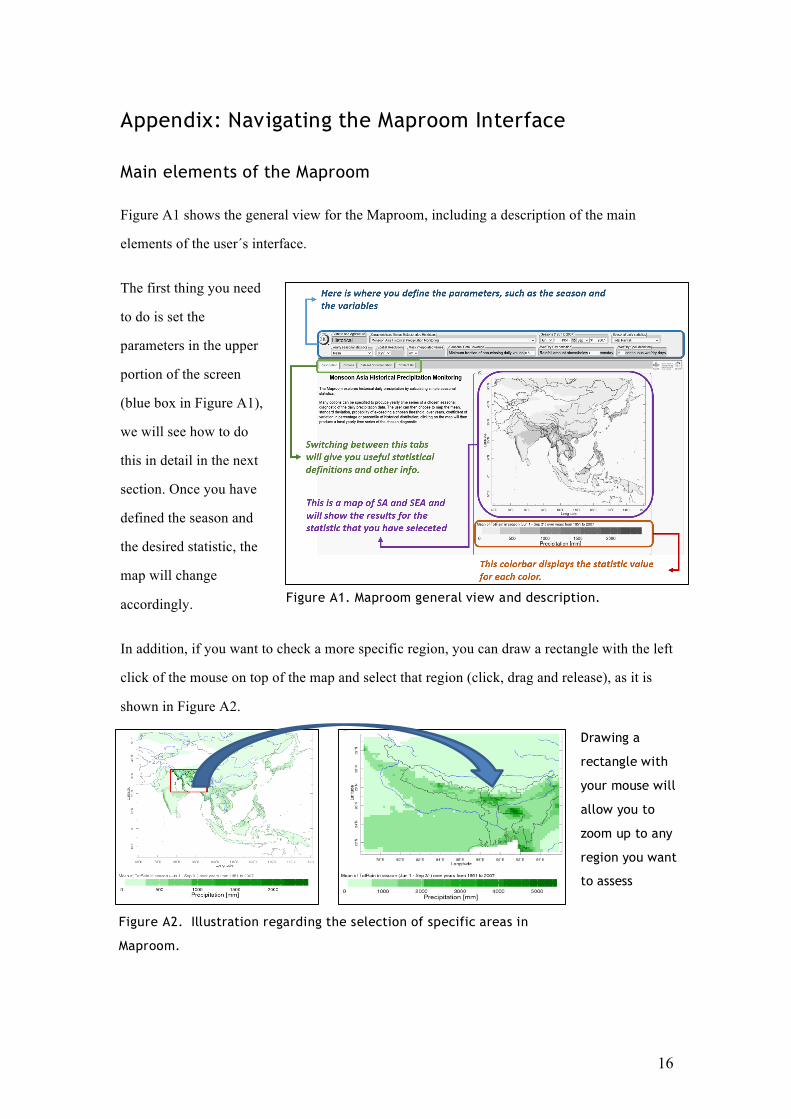
Figure A1 shows the general view for the Maproom, including a description of the main
elements of the user´s interface.
The first thing you need
to do is set the
parameters in the upper
portion of the screen
(blue box in Figure A1),
we will see how to do
this in detail in the next
section. Once you have
defined the season and
the desired statistic, the
map will change
accordingly.
In addition, if you want to check a more specific region, you can draw a rectangle with the left
click of the mouse on top of the map and select that region (click, drag and release), as it is
shown in Figure A2.
Drawing a
rectangle with
your mouse will
allow you to
zoom up to any
region you want
to assess
Figure A1. Maproom general view and description.
Figure A2. Illustration regarding the selection of specific areas in
Maproom.
17
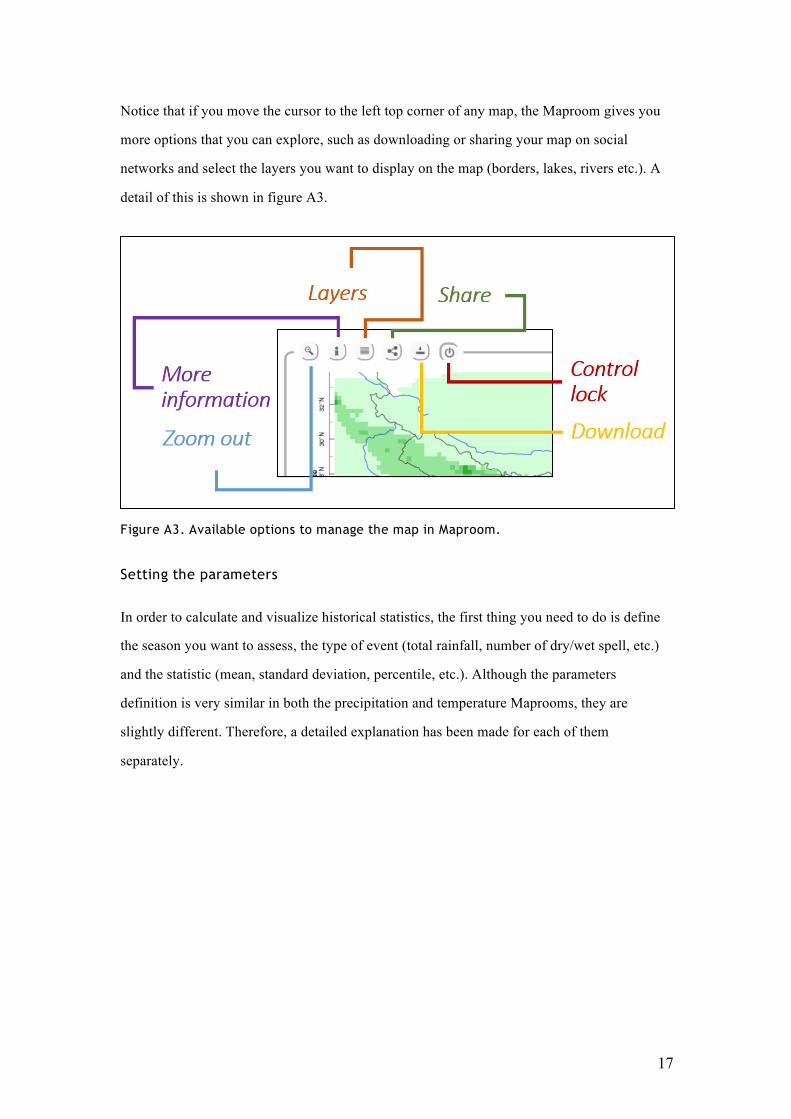
Notice that if you move the cursor to the left top corner of any map, the Maproom gives you
more options that you can explore, such as downloading or sharing your map on social
networks and select the layers you want to display on the map (borders, lakes, rivers etc.). A
detail of this is shown in figure A3.
Figure A3. Available options to manage the map in Maproom.
Setting the parameters
In order to calculate and visualize historical statistics, the first thing you need to do is define
the season you want to assess, the type of event (total rainfall, number of dry/wet spell, etc.)
and the statistic (mean, standard deviation, percentile, etc.). Although the parameters
definition is very similar in both the precipitation and temperature Maprooms, they are
slightly different. Therefore, a detailed explanation has been made for each of them
separately.
18
Precipitation Maproom parameters
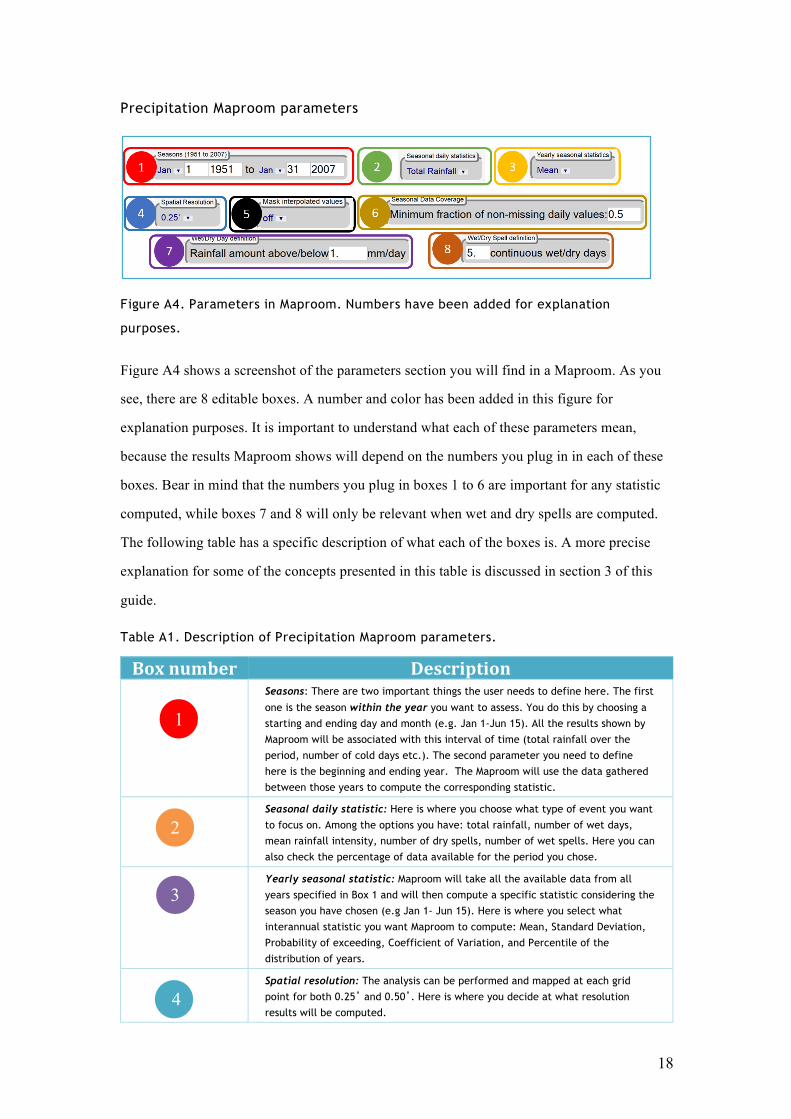
Figure A4. Parameters in Maproom. Numbers have been added for explanation
purposes.
Figure A4 shows a screenshot of the parameters section you will find in a Maproom. As you
see, there are 8 editable boxes. A number and color has been added in this figure for
explanation purposes. It is important to understand what each of these parameters mean,
because the results Maproom shows will depend on the numbers you plug in in each of these
boxes. Bear in mind that the numbers you plug in boxes 1 to 6 are important for any statistic
computed, while boxes 7 and 8 will only be relevant when wet and dry spells are computed.
The following table has a specific description of what each of the boxes is. A more precise
explanation for some of the concepts presented in this table is discussed in section 3 of this
guide.
Table A1. Description of Precipitation Maproom parameters.
Boxnumber Description Seasons: There are two important things the user needs to define here. The first
one is the season within the year you want to assess. You do this by choosing a
starting and ending day and month (e.g. Jan 1-Jun 15). All the results shown by
Maproom will be associated with this interval of time (total rainfall over the
period, number of cold days etc.). The second parameter you need to define
here is the beginning and ending year. The Maproom will use the data gathered
between those years to compute the corresponding statistic.
Seasonal daily statistic: Here is where you choose what type of event you want
to focus on. Among the options you have: total rainfall, number of wet days,
mean rainfall intensity, number of dry spells, number of wet spells. Here you can
also check the percentage of data available for the period you chose.
Yearly seasonal statistic: Maproom will take all the available data from all
years specified in Box 1 and will then compute a specific statistic considering the
season you have chosen (e.g Jan 1- Jun 15). Here is where you select what
interannual statistic you want Maproom to compute: Mean, Standard Deviation,
Probability of exceeding, Coefficient of Variation, and Percentile of the
distribution of years.
Spatial resolution: The analysis can be performed and mapped at each grid
point for both 0.25˚ and 0.50˚. Here is where you decide at what resolution
results will be computed.
2
3
4
1
19
Mask interpolated values: When periods of historical observations are missing,
the Maproom can fill in these missing data by using a temporal interpolation
method. Here is where you decide to use the interpolation or not, by also
defining –in Box 6- what fraction of non-missing daily values are you willing to
consider.
Minimum fraction of non-masked days per season: As described in Box 5, a
minimum fraction of non-masked days per season can be required in order for
the seasonal diagnostic to be defined at that gridbox — if this minimum threshold
is not met, then the seasonal diagnostic is assigned a missing value at that
gridbox, for that season and year.
Wet/dry day definition: This parameter is only relevant when you want
Maproom to compute the number of wet days or number of dry/wet spells. Here
is where you define the threshold (in mm) for what you want to consider as a dry
day (rainfall below), or a wet day (rainfall above).
Wet/dry spell definition: This parameter is only relevant when you want
Maproom to compute the number of dry/wet spells. Here is where you define the
number of continuous wet/dry days. The definition for what is a wet/dry day is
defined in Box 7.
Temperature Maproom parameters
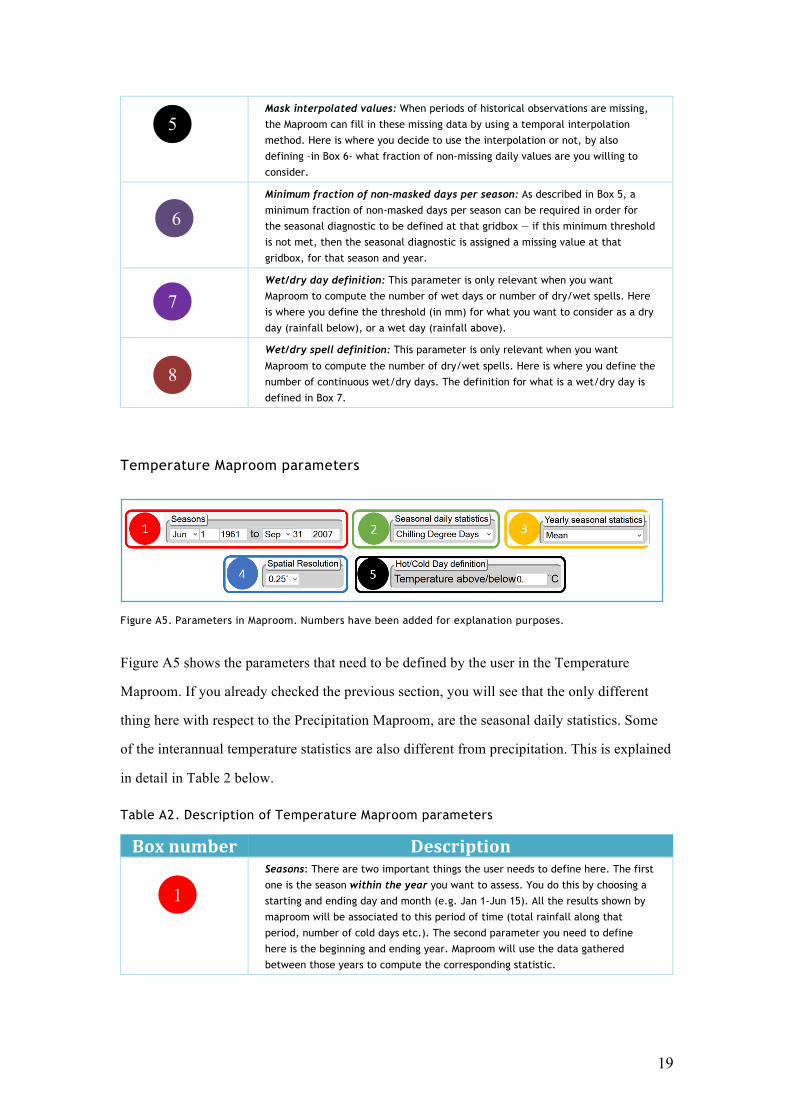
Figure A5. Parameters in Maproom. Numbers have been added for explanation purposes.
Figure A5 shows the parameters that need to be defined by the user in the Temperature
Maproom. If you already checked the previous section, you will see that the only different
thing here with respect to the Precipitation Maproom, are the seasonal daily statistics. Some
of the interannual temperature statistics are also different from precipitation. This is explained
in detail in Table 2 below.
Table A2. Description of Temperature Maproom parameters
Boxnumber Description Seasons: There are two important things the user needs to define here. The first
one is the season within the year you want to assess. You do this by choosing a
starting and ending day and month (e.g. Jan 1-Jun 15). All the results shown by
maproom will be associated to this period of time (total rainfall along that
period, number of cold days etc.). The second parameter you need to define
here is the beginning and ending year. Maproom will use the data gathered
between those years to compute the corresponding statistic.
5
6
7
8
1
20
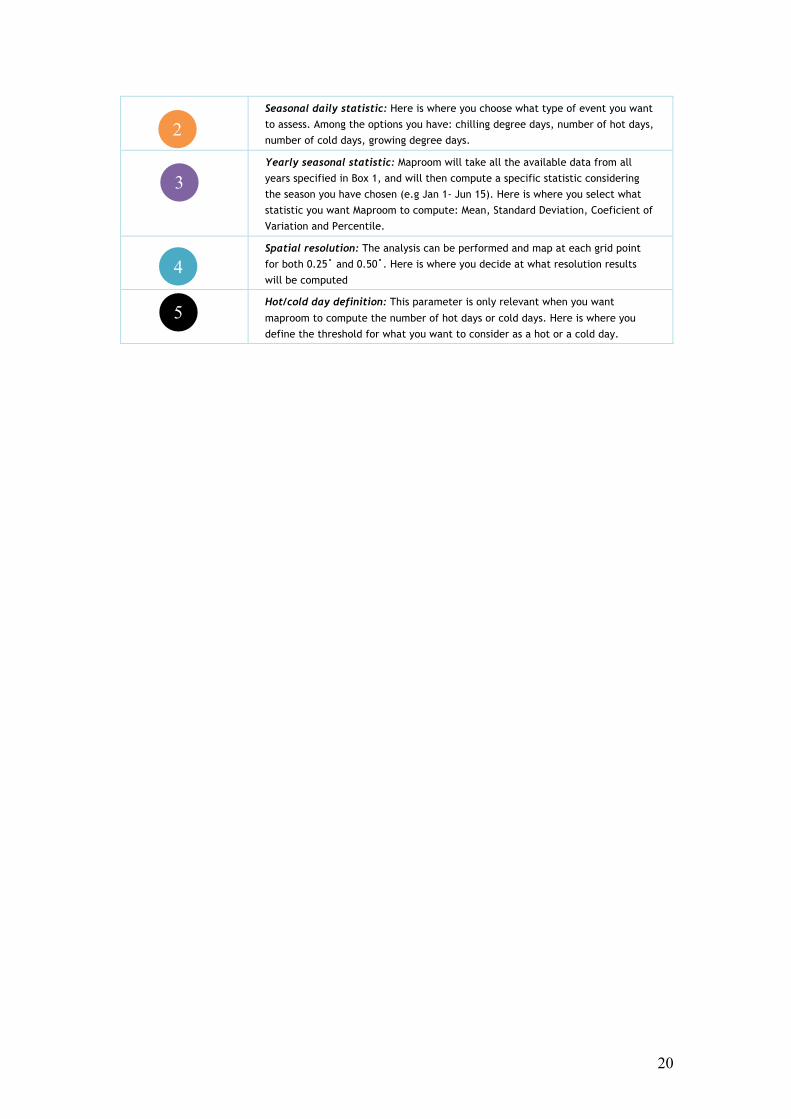
Seasonal daily statistic: Here is where you choose what type of event you want
to assess. Among the options you have: chilling degree days, number of hot days,
number of cold days, growing degree days.
Yearly seasonal statistic: Maproom will take all the available data from all
years specified in Box 1, and will then compute a specific statistic considering
the season you have chosen (e.g Jan 1- Jun 15). Here is where you select what
statistic you want Maproom to compute: Mean, Standard Deviation, Coeficient of
Variation and Percentile.
Spatial resolution: The analysis can be performed and map at each grid point
for both 0.25˚ and 0.50˚. Here is where you decide at what resolution results
will be computed
Hot/cold day definition: This parameter is only relevant when you want
maproom to compute the number of hot days or cold days. Here is where you
define the threshold for what you want to consider as a hot or a cold day.
2
3
4
5
21
References
Ayanlade, A., Radeny, M., Morton, J.F. and Muchaba, T., 2018. Rainfall variability and
drought characteristics in two agro-climatic zones: An assessment of climate change
challenges in Africa. Science of the Total Environment, 630, pp.728-737.
Barron, J., Rockström, J., Gichuki, F. and Hatibu, N., 2003. Dry spell analysis and maize
yields for two semi-arid locations in east Africa. Agricultural and forest meteorology,
117(1-2), pp.23-37.
Dourte, D.R., Fraisse, C.W. and Bartels, W.L., 2015. Exploring changes in rainfall intensity
and seasonal variability in the Southeastern US: Stakeholder engagement, observations,
and adaptation. Climate Risk Management, 7, pp.11-19.
Hossain, A. and Teixeira da Silva, J.A., 2013. Wheat production in Bangladesh: its future in
the light of global warming. AoB Plants, 5.
Luedeling, E., 2012. Climate change impacts on winter chill for temperate fruit and nut
production: a review. Scientia Horticulturae, 144, pp.218-229.
McMaster, G.S. and Wilhelm, W.W., 1997. Growing degree-days: one equation, two
interpretations. Agricultural and forest meteorology, 87(4), pp.291-300.
Robertson, A.W., Bell, M., Cousin, R., Curtis, A. and Li, S., 2013. Online tools for assessing
the climatology and predictability of rainfall and temperature in the Indo-Gangetic Plains
based on observed datasets and seasonal forecast models. Working paper no. 27. Cali,
Colombia: CGIAR Research Program on Climate Change, Agriculture and Food Security
(CCAFS).
Sivakumar, M.V.K., 1992. Empirical analysis of dry spells for agricultural applications in
West Africa. Journal of Climate, 5(5), pp.532-539.
Stern, R.D. and Cooper, P.J.M., 2011. Assessing climate risk and climate change using
rainfall data–a case study from Zambia. Experimental Agriculture, 47(2), pp.241-266.
Stern, R.D. and Cooper, P.J.M., 2011. Assessing climate risk and climate change using
rainfall data–a case study from Zambia. Experimental Agriculture, 47(2), pp.241-266.
Xie, P., Chen, M., Yang, S., Yatagai, A., Hayasaka, T., Fukushima, Y. and Liu, C., 2007. A
gauge-based analysis of daily precipitation over East Asia. Journal of Hydrometeorology,
8(3), pp.607-626.
Yasutomi, N., Hamada, A. and Yatagai, A., 2011. Development of a long-term daily gridded
temperature dataset and its application to rain/snow discrimination of daily
precipitation. Global Environ. Res, 15(2), pp.165-172.
The CGIAR Research Program on Climate Change, Agriculture and Food
Security (CCAFS) is a strategic initiative of CGIAR and Future Earth, led by the
International Center for Tropical Agriculture (CIAT). CCAFS is the world’s most
comprehensive global research program to examine and address the critical
interactions between climate change, agriculture and food security.
For more information, visit www.ccafs.cgiar.org
Titles in this Working Paper series aim to disseminate interim climate change,
agriculture and food security research and practices and stimulate feedback
from the scientific community.
Research supported by:
CCAFS is led by: Strategic partner: