Embed Size (px)
Citation preview

Sheahan et al. Reprod Health (2021) 18:47 https://doi.org/10.1186/s12978-021-01105-y
RESEARCH
Development of integration indexes to determine the extent of family planning and child immunization services integration in health facilities in urban areas of NigeriaKate L. Sheahan1* , Jennifer Orgill‑Meyer2, Ilene S. Speizer3, Siân Curtis3, John Paul3, Morris Weinberger3 and Antonia V. Bennett3
Abstract
Background: Integrating family planning into child immunization services may address unmet need for contracep‑tion by offering family planning information and services to postpartum women during routine child immunization visits. However, policies and programs promoting integration are often based on insubstantial or conflicting evidence about its effects on service delivery and health outcomes. While integration models vary, many studies measure integration as binary (a facility is integrated or not) rather than a multidimensional and varying continuum. It is thus challenging to ascertain the determinants and effects of integrated service delivery. This study creates Facility and Provider Integration Indexes, which measure capacity to support integrated family planning and child immunization services and applies them to analyze the extent of integration across 400 health facilities.
Methods: This study utilizes cross‑sectional health facility (N = 400; 58% hospitals, 42% primary healthcare centers) and healthcare provider (N = 1479) survey data that were collected in six urban areas of Nigeria for the impact evalua‑tion of the Nigerian Urban Reproductive Health Initiative. Principal Component Analysis was used to develop Provider and Facility Integration Indexes that estimate the extent of integration in these health facilities. The Provider Integra‑tion Index measures provider skills and practices that support integrated service delivery while the Facility Integra‑tion Index measures facility norms that support integrated service delivery. Index scores range from zero (low) to ten (high).
Results: Mean Provider Integration Index score is 5.42 (SD 3.10), and mean Facility Integration Index score is 6.22 (SD 2.72). Twenty‑three percent of facilities were classified as having low Provider Integration scores, 32% as medium, and 45% as high. Fourteen percent of facilities were classified as having low Facility Integration scores, 38% as medium, and 48% as high.
Conclusion: Many facilities in our sample have achieved high levels of integration, while many others have not. Results suggest that using more nuanced measures of integration may (a) more accurately reflect true variation in integration within and across health facilities, (b) enable more precise measurement of the determinants or effects
© The Author(s) 2021. Open Access This article is licensed under a Creative Commons Attribution 4.0 International License, which permits use, sharing, adaptation, distribution and reproduction in any medium or format, as long as you give appropriate credit to the original author(s) and the source, provide a link to the Creative Commons licence, and indicate if changes were made. The images or other third party material in this article are included in the article’s Creative Commons licence, unless indicated otherwise in a credit line to the material. If material is not included in the article’s Creative Commons licence and your intended use is not permitted by statutory regulation or exceeds the permitted use, you will need to obtain permission directly from the copyright holder. To view a copy of this licence, visit http://creat iveco mmons .org/licen ses/by/4.0/. The Creative Commons Public Domain Dedication waiver (http://creat iveco mmons .org/publi cdoma in/zero/1.0/) applies to the data made available in this article, unless otherwise stated in a credit line to the data.
Open Access
*Correspondence: [email protected] The Durham Center of Innovation to Accelerate Discovery and Practice Transformation (ADAPT), (CIN 13‑410) at the Durham VA Health Care System, Durham, NC, USAFull list of author information is available at the end of the article

Page 2 of 16Sheahan et al. Reprod Health (2021) 18:47
Plain English summaryInadequate spacing between pregnancies can lead to adverse health outcomes among women and babies. The WHO recommends an interval of 24 months between pregnancies. Access to postpartum contraception is critical, yet many women wishing to space their pregnan-cies do not use it. Integrating family planning services into child immunization services may increase access to postpartum contraception. While previous research shows that integration is acceptable to women, evidence about its effects on service delivery and health outcomes is scarce and inconsistent. This is due, in part, to chal-lenges surrounding the measurement of integration. One such challenge is that integration within health facilities is often measured as binary (i.e., a facility is designated as integrated or not), though numerous factors influ-ence the extent of integration within facilities over time. Without capturing variation in integration, analyzing the effects of integration is difficult. This study addresses that challenge by developing Provider (i.e., nurse/mid-wife) and Facility Integration Indexes, which measure capacity to support integrated family planning and child immunization services. Utilizing cross-sectional data collected for the Nigerian Urban Reproductive Health Initiative, we apply the indexes to describe the extent of integration across 400 facilities: 23% of facilities have low Provider Integration scores, 32% have medium, and 45% have high. Fourteen percent of facilities have low Facil-ity Integration scores, 38% have medium, and 48% have high. These results suggest that nuanced measures of integration, like those described in this paper, may enable more accurate evaluation of integration’s effects, and pro-vide more specific information about whether and how to support integration.
IntroductionNigeria has among the highest maternal and infant mor-tality rates in the world. In 2017, Nigeria had a maternal mortality ratio (MMR) of 917/100,000 live births, which was the fifth highest in the world [1]. At the same time, Nigeria’s infant mortality rate (IMR) was 67/1000 live births [2]. Nigeria signed on, and recently reconfirmed its resolve, to achieve Sustainable Development Goal 3 to reduce MMR to below 70/100,000 live births and to end preventable deaths of newborns and children under age 5 years by 2030 [3].
Family planning use has the potential to drastically reduce newborn and maternal deaths globally [4]. Yet, unmet need for contraception remains high among Nigerian women; 24.8% of women of reproductive age (15–49 years) want to stop or delay childbearing but are not using contraception [5]. The Federal Government of Nigeria set a target to increase the modern contraceptive prevalence rate from 10% in 2012 to 27% by 2020 [6]. By 2018, the modern contraceptive prevalence rate among all women had increased to 13.8%, though this remains well below the target [5]. Thus, increasing access to and utilization of family planning methods remains an urgent priority in Nigeria.
Contraception among postpartum women: critical to maternal and infant healthPostpartum contraceptive use is particularly critical to the health of women and babies. Interpregnancy intervals of fewer than 18 months are associated with increased risk of infant and maternal morbidity and mortality [7]. Further, under-five mortality is significantly higher among children born fewer than 24-months after the preceding birth. One in four children in Nigeria are born less than 2 years after a sibling. The under-five mortal-ity rate is 183/1000 among these children; this declines to 93/1000 among children born 3 years after the previ-ous birth [2]. The World Health Organization (WHO) recommends an interval of at least 24 months after a live birth prior to attempting the next pregnancy [8]. In Nigeria, 65% of women who have given birth within the last 23 months may have an unmet need for contracep-tion [9]. Meeting this postpartum need for contraception would contribute substantially to contraceptive preva-lence, which would in turn decrease MMR and IMR.
Integration of family planning and child immunization servicesIntegrating family planning into routine child immuni-zation services has the potential to address unmet need for contraception among postpartum women by leverag-ing repeated immunization consultations to offer family planning information and services. Although modern contraceptive use in the postpartum period may be low in many contexts, immunization coverage is generally high. Immunization services may thus provide a solid platform for the integration of family planning services [10]. In 2019, 85% of infants globally received the recommended
of integration, and (c) provide more tailored, actionable information about how best to improve integration. Overall, results reinforce the importance of utilizing more nuanced measures of facility‑level integration.
Keywords: Family planning, Immunization, Integration, Measurement, Nigeria

Page 3 of 16Sheahan et al. Reprod Health (2021) 18:47
three doses of the diphtheria-tetanus-pertussis (DPT-3) vaccine, although coverage in Nigeria is lower at around 50% [11, 12]. While integration models vary in purpose and design, two primary models are commonly imple-mented [13, 14]. The first, combined service provision, entails offering both family planning and immunization services on the same day at the same location. The sec-ond, single service provision plus referral, entails offering either family planning or immunization services along with education, screening, and/or referral for the other service at a different place or time. Previous research has shown that integration can be feasible and acceptable to providers and clients [15–18]. However, numerous fac-tors and challenges influence the extent of integration attained within a facility, including health system charac-teristics, provider and client characteristics, staffing and space constraints, and the cultural context [19–21].
Within health facilities, family planning services may be integrated into child immunization services at the primary and secondary levels. The Nigerian Ministry of Health promotes the integration of family planning into immunization services as an important approach to increasing family planning availability and accessibil-ity [22]. The Minimum Standards for Primary Healthcare (MSPH) in Nigeria identify both family planning and immunization services as minimum components of pri-mary healthcare and require provision of these services at all public primary healthcare facilities while advocating that privately owned facilities align with these standards [23]. Both immunization and family planning services form part of a standard package of primary healthcare services commonly provided within hospitals.
Evidence and measurement gapsPolicy and programming recommendations that promote integrating family planning and child immunization ser-vices are often based on insubstantial or conflicting evi-dence about its impact on health services delivery and patient outcomes [24–27]. Given the scarcity of evidence and the resource and planning implications of integra-tion, it is critical to develop context specific evidence that captures the nature, extent, and effects of integration in order to inform policy and program design [13].
The complexity of implementing integrated service delivery combined with the varied integration models and definitions prompt questions related to how inte-gration and its effects should be measured [28–30]. Many studies measure integration as a binary vari-able (a facility is integrated or not) rather than a mul-tidimensional continuum that varies across time and place [17, 18, 28]. A few studies have developed more nuanced measures of integration and assessed asso-ciations between these levels and health and service
delivery outcomes. For example, the Integra Initiative developed indexes that measure the extent and type of HIV and reproductive health integration, and Church [20] analyzed whether degree of HIV and reproductive health integration was associated with client demand for services and unmet need for family planning [20, 30]. Mackenzie (2018) identified that the level of maternal, newborn, and child health and family plan-ning integration varies widely across facilities as well as across clinical areas [31]. Multi-dimensional, con-tinuous measures of integration are valuable because they enable analyses related to the extent of integration within and across facilities and the effects of varying degrees of integration on service delivery and health outcomes. No studies, to our knowledge, have meas-ured the extent of family planning and child immuni-zation services integration [32, 33]. This study aims to address this gap by developing integration indexes that quantify the extent of facility-level family planning and child immunization services integration as a varying and multifaceted outcome. Indexes like these may be used to analyze associations between the extent of inte-gration and outcomes such as receipt of services, client satisfaction, and quality of care. The methodological process demonstrated in this study may be adapted by those aiming to better understand the extent of integra-tion within facilities and over time.
MethodsSetting and data sourceThe data for this study were collected by the Measure-ment, Learning & Evaluation (MLE) project for the impact evaluation of the Nigerian Urban Reproductive Health Initiative (NURHI). NURHI, funded by the Bill & Melinda Gates Foundation, aimed to increase mod-ern family planning use among the urban poor through a multi-pronged approach that included improving the quality of family planning services in high-volume urban health facilities. The intervention supported con-traceptive supply chains and logistics, training for fam-ily planning counseling and provision, and facility level management systems. This study utilizes health facility (N = 400, 58% hospitals, 42% primary healthcare cent-ers) and healthcare provider (N = 1479) baseline survey data that were collected in 2011 from Abuja (Nigeria’s capital), Benin City, Ibadan, Ilorin, Kaduna and Zaria [34]. NURHI selected these cities because they include both northern and southern regions of the country and each has a population of approximately, or more than, one million. The northern and southern regions of Nigeria differ in their cultural, economic, and religious characteristics; the north is poorer and predominantly
Page 4 of 16Sheahan et al. Reprod Health (2021) 18:47
Muslim while the south is more affluent and predomi-nantly Christian.
Study sampleTwo categories of healthcare facilities are included in the sample: high-volume facilities (HVF) (n = 112) and pre-ferred- provider facilities (PPF) (n = 288). HVF and PPF can be either public or private, and they can be either primary or secondary facilities. The sample includes all public facilities in the study cities. HVF, generally the top service delivery sites by client load, offered both antena-tal care and immunization services; these facilities served more than 1000 antenatal clients per year. The NURHI program supported all HVF, and all of these facilities are included in the sample [34]. PPF were identified from a baseline household survey conducted by MLE that con-tained a representative sample of 16,144 women aged 15–49. Women were asked the name of each facility where they went for family planning, maternal health, and child health services. Using this information, MLE created a list of facilities that women reported by study cluster (primary sampling unit). The most commonly mentioned facility in each primary sampling unit was categorized as a PPF. If the PPF was already included in the sample as a public facility or an HVF, then the second most-commonly mentioned facility was included. If the second most-commonly stated facility was already in the sample, no additional facility was included. Including the PPFs along with the public facilities and HVFs ensures that the sample includes facilities that women in these urban areas actually visit.
Survey instrumentsThis study utilizes instruments developed for the NURHI impact evaluation, which draws upon validated tools selected from the Quick Investigation of Quality [35]. Facility and provider surveys were conducted in each facility by trained interviewers hired by Data Research and Mapping Corporation; the MLE project provided technical assistance for training of interviewers. The sur-veys collected information on the readiness of facilities and providers to offer integrated services, usual or ‘nor-mal’ family planning service provision practices in spe-cific circumstances (e.g., usual or ‘normal’ practice within the facility if a woman has come for a child health service visit and is interested in receiving a hormonal method of contraception), gaps in commodities, equipment, train-ing and resources, the extent of family planning integra-tion into maternal, newborn and child health services, and other health facility characteristics. One facility audit was conducted per facility by asking questions of a manager or another administrator. In larger facilities,
four providers were selected through simple random sampling to complete the provider survey; in the event that a provider declined another provider was randomly selected until four eligible providers consented to inter-view. In facilities with four or fewer providers, all were approached for interview. Providers eligible for inclusion were medically qualified to provide clinical services and assigned to provide direct family planning and/or mater-nal, newborn and child health services to clients at that facility; their responses are analyzed in this study.
Statistical methodThis study employs Principal Component Analysis (PCA) to create two family planning and child immunization services integration indexes: a Provider Integration Index and a Facility Integration Index. All analyses were con-ducted using Stata version 13.1 (Stata Corp, LP, College Station, Texas).
Constructing and interpreting the indexesSelection of variables for inclusion in the PCADrawing on Mayhew [30], we posit that numerous char-acteristics and processes interact within a health facility to result in varying degrees of integrated service delivery. While the Nigerian Ministry of Health does not provide a specific definition of integrated family planning and immunization services, their 2008 National Guidelines for the Integration of Reproductive Health and HIV Pro-grammes offers this explanation:
Integration in the health sector has been defined by offering two or more services at the same facility during the same operating hour, with the provider of one service actively encouraging clients to con-sider using the other services during the same visit, in order to make those services more convenient and efficient. Integrated services should be offered at the same point but where that is not possible, strong referral systems are required to ensure that clients receive high quality service [36].
NURHI’s Strategy for Integrating Family Planning into Maternal, Newborn, Child Health and HIV/AIDS Ser-vices references this guidance [37]. This study also refers to this guidance to inform the attributes measured in the indexes. Additionally, we reviewed the integration lit-erature to identify facility-level attributes that support service integration. Several critical attributes emerged, including (a) facility norms that support concurrent ser-vice provision (e.g., operational management standards and procedures that support the availability of both child immunization and family planning services at the same consultation or on the same day), and (b) provider capac-ity to offer multiple services (e.g., provider(s) has the

Page 5 of 16Sheahan et al. Reprod Health (2021) 18:47
skills and willingness to offer family planning informa-tion or services during a child immunization visit) [26, 30, 38–41].
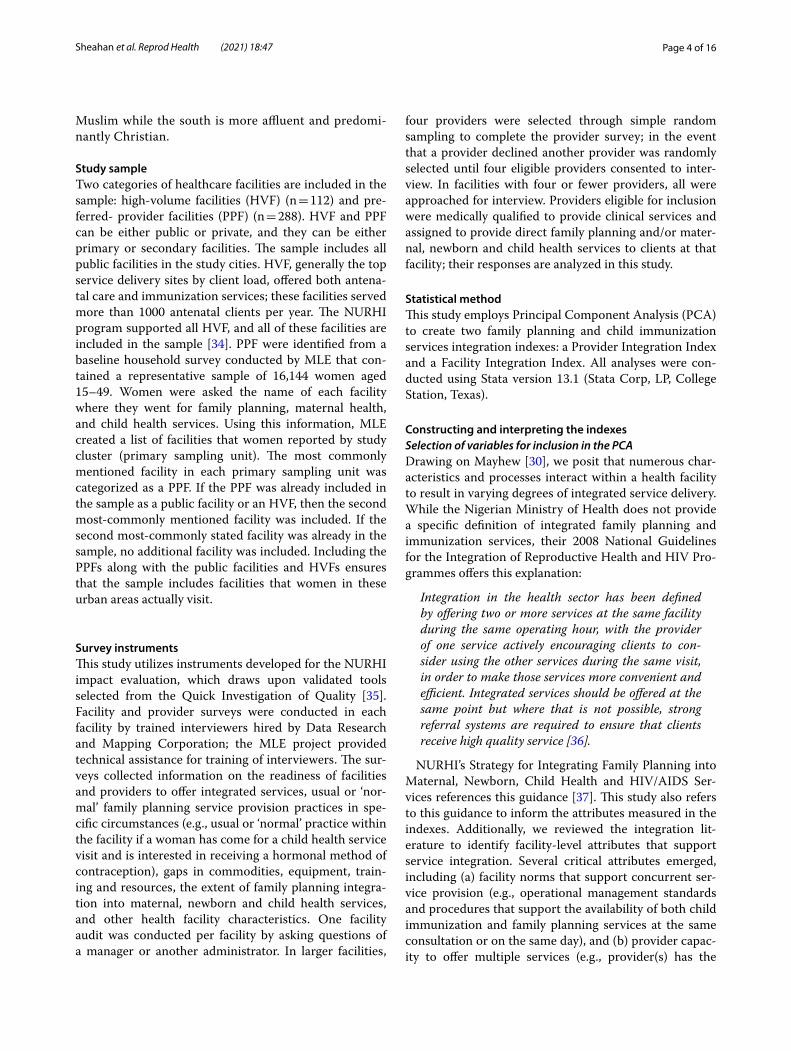
Because this study was conceptualized after data col-lection, we leveraged the available data and selected eight indicators for inclusion in the indexes (Table 1). Table 2 describes these and other facility characteris-tics. A few of these indicators warrant additional expla-nation. The indicators used to develop the integration indexes focus primarily on family planning information and services that are provided during the child immu-nization visits. The indexes are thus most appropriate for use within that context, though they do also meas-ure a range of referral scenarios. Improving outcomes through integration relies upon both high coverage and quality of integrated services. A substantial body of research links higher quality family planning services with increased contraceptive adoption, prevalence, and continuation; poor family planning service qual-ity can hinder use [42]. Therefore, the level of quality provided and the absence of barriers that limit coverage and quality are essential indicators of effective integra-tion [40, 43]. We analyzed quality of integrated family planning services by measuring the range and breadth of family planning topics that providers discuss with a client during child health service visits. Because the extent of integration can be influenced by provider bias [44–46], we include social norm-based service barriers by measuring the extent to which providers at a facility require partner consent prior to provision of a family planning method during an integrated visit. In Nigeria, partner consent is a tenacious barrier to contraceptive use that may be mitigated by training providers that standard service provision guidelines do not include a requirement for partner consent, providing supportive supervision on guideline implementation, and utilizing more comprehensive behavior change approaches with providers [47]. While numerous such barriers exist and could have been employed in the indexes this is the only variable in our dataset that captures such barri-ers to family planning specifically during immunization visits.
Several variables refer to child immunization, child growth monitoring, or child health service visits. Child health services visits include either immunization or growth monitoring visits, but not sick child visits. In vari-ables referring to child health services, it was not possible to differentiate data pertaining only to child immuniza-tions from data pertaining only to child growth moni-toring. However, child immunization visits comprise the vast majority of all child health services visits. In the concurrent health facility client exit interview, 1714 peo-ple attended the facility for a child health service visit. Of
these, only 90 (5%) report that child growth monitoring was the primary purpose of their visit while the remain-ing 95% reported immunization as the primary purpose of their visit. Facility-level variables are based on a sum-mary of provider responses. Means were imputed for missing data.
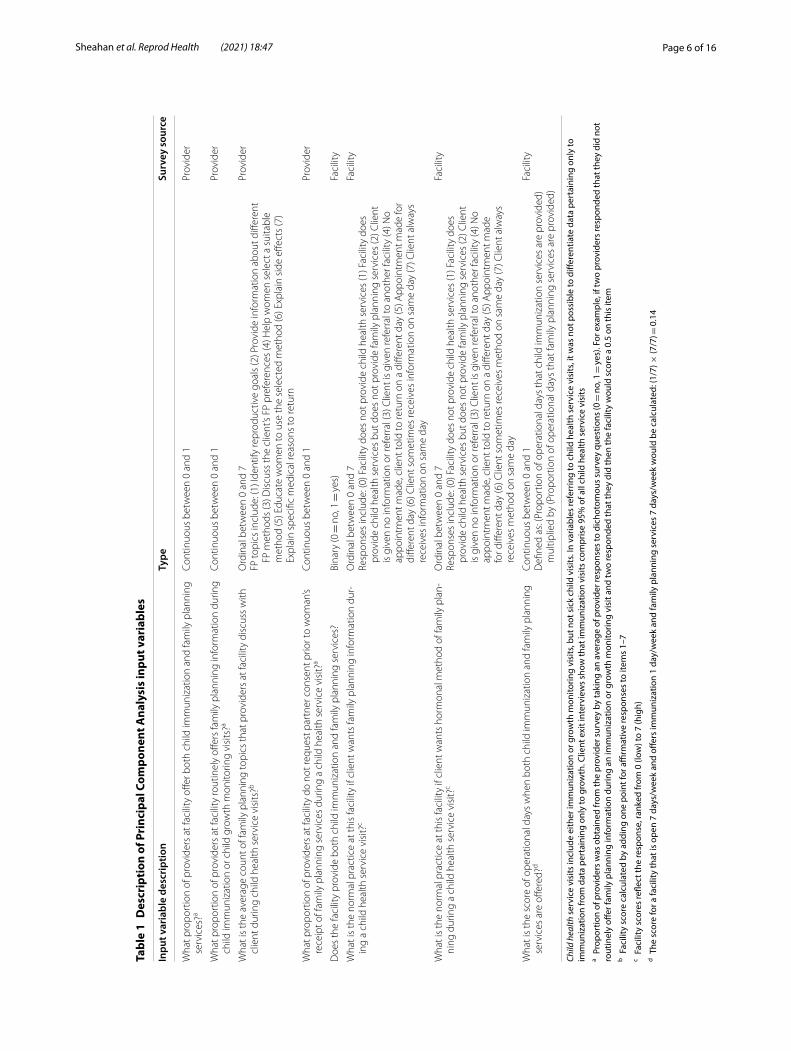
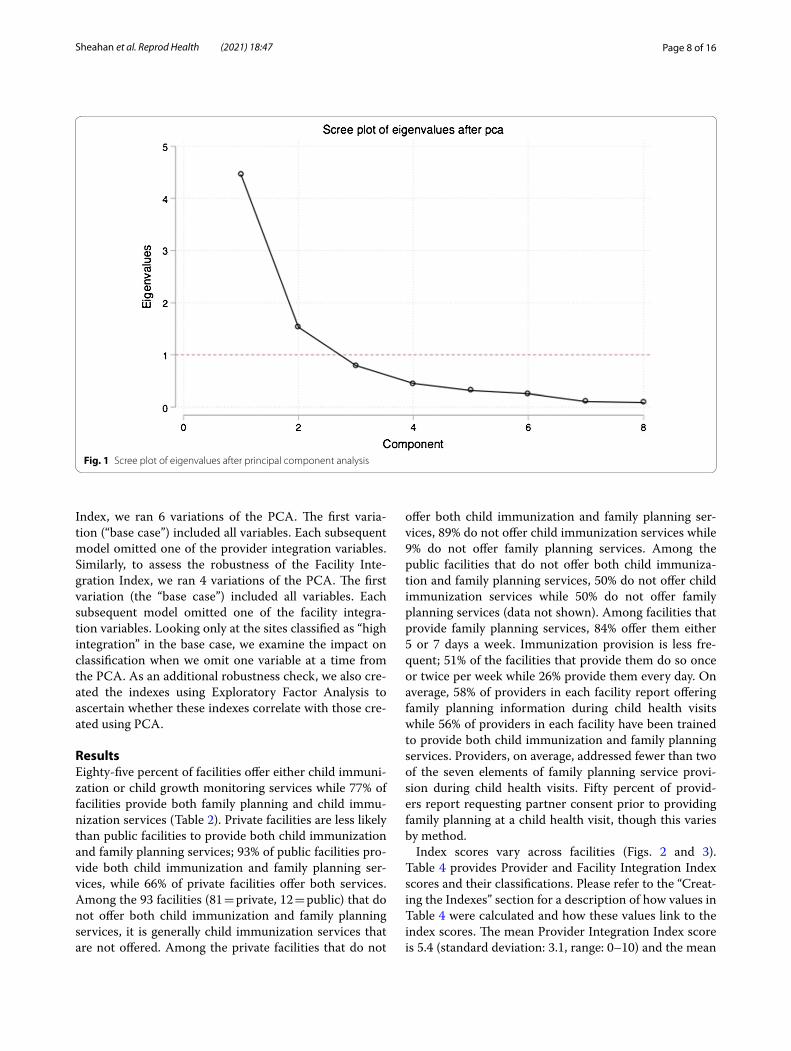
PCA applicationPCA was applied following the selection and transforma-tion of variables. Input variables were standardized to a mean of zero and a standard deviation of one prior to the analysis to prevent variables with greater variance from dominating each component. The Kaiser–Meyer–Olkin (KMO) test of sampling adequacy was used to ascertain the suitability of the data for use in a PCA. Our KMO test yielded a score of 0.8, indicating sampling adequacy for each variable and the complete model. Based on evalua-tion of the eigenvalues (Table 3) and the scree plot (Fig. 1) we retained two components. The factor loading scores (see factor loadings column in Table 4), which show the correlation coefficient between each variable and com-ponent, were examined to determine which dimensions of integration are represented by the components. The scores confirmed the anticipated dimensions: provider integration and facility integration.
Creating the indexesWe constructed the Provider Integration Index and Facil-ity Integration Index using weights calculated for each of the variables by dividing its factor loading by the sum of the factor loadings of all variables in that component (see weights column in Table 4). Next, we multiplied the variables included in each component by their associated weights and summed the values. Finally, we calculated the Provider Integration Index score and the Facility Integration Index score for each facility by multiplying these values by ten. The indexes thus range in value from zero to ten, with a higher score indicating a higher level of integration. Each facility was classified as having “low integration” (index score 0–3.29), “medium integration” (3.30–6.59) or “high integration” (6.60–10.00). These classifications were determined by dividing raw scores equally into tertiles along the score continuum of zero to ten. A sensitivity analysis was conducted to identify the effects of excluding from the sample those facilities that do not offer child immunization (n = 61); there were no statistically significant differences between the indexes that include all facilities versus those with the restricted set of facilities. We retained these facilities in the sam-ple because one goal of the paper is to assess integration across the range of facilities and circumstances repre-sented by our sample. Excluding these facilities would prevent us from knowing the full extent of integration
Page 6 of 16Sheahan et al. Reprod Health (2021) 18:47
Tabl
e 1
Des
crip
tion
of P
rinc
ipal
Com
pone
nt A
naly
sis
inpu
t var
iabl
es
Child
hea
lth s
ervi
ce v
isits
incl
ude
eith
er im
mun
izat
ion
or g
row
th m
onito
ring
visi
ts, b
ut n
ot s
ick
child
vis
its. I
n va
riabl
es re
ferr
ing
to c
hild
hea
lth s
ervi
ce v
isits
, it w
as n
ot p
ossi
ble
to d
iffer
entia
te d
ata
pert
aini
ng o
nly
to
imm
uniz
atio
n fr
om d
ata
pert
aini
ng o
nly
to g
row
th. C
lient
exi
t int
ervi
ews
show
that
imm
uniz
atio
n vi
sits
com
pris
e 95
% o
f all
child
hea
lth s
ervi
ce v
isits
a Pro
port
ion
of p
rovi
ders
was
obt
aine
d fr
om th
e pr
ovid
er s
urve
y by
taki
ng a
n av
erag
e of
pro
vide
r res
pons
es to
dic
hoto
mou
s su
rvey
que
stio
ns (0
= n
o, 1
= ye
s). F
or e
xam
ple,
if tw
o pr
ovid
ers
resp
onde
d th
at th
ey d
id n
ot
rout
inel
y off
er fa
mily
pla
nnin
g in
form
atio
n du
ring
an im
mun
izat
ion
or g
row
th m
onito
ring
visi
t and
two
resp
onde
d th
at th
ey d
id th
en th
e fa
cilit
y w
ould
sco
re a
0.5
on
this
item
b Fac
ility
sco
re c
alcu
late
d by
add
ing
one
poin
t for
affi
rmat
ive
resp
onse
s to
item
s 1–
7c F
acili
ty s
core
s re
flect
the
resp
onse
, ran
ked
from
0 (l
ow) t
o 7
(hig
h)d T
he s
core
for a
faci
lity
that
is o
pen
7 da
ys/w
eek
and
offer
s im
mun
izat
ion
1 da
y/w
eek
and
fam
ily p
lann
ing
serv
ices
7 d
ays/
wee
k w
ould
be
calc
ulat
ed: (
1/7)
× (7
/7) =
0.1
4
Inpu
t var
iabl
e de
scri
ptio
nTy
peSu
rvey
sou
rce
Wha
t pro
port
ion
of p
rovi
ders
at f
acili
ty o
ffer b
oth
child
imm
uniz
atio
n an
d fa
mily
pla
nnin
g se
rvic
es?a
Cont
inuo
us b
etw
een
0 an
d 1
Prov
ider
Wha
t pro
port
ion
of p
rovi
ders
at f
acili
ty ro
utin
ely
offer
s fa
mily
pla
nnin
g in
form
atio
n du
ring
child
imm
uniz
atio
n or
chi
ld g
row
th m
onito
ring
visi
ts?a
Cont
inuo
us b
etw
een
0 an
d 1
Prov
ider
Wha
t is
the
aver
age
coun
t of f
amily
pla
nnin
g to
pics
that
pro
vide
rs a
t fac
ility
dis
cuss
with
cl
ient
dur
ing
child
hea
lth s
ervi
ce v
isits
?bO
rdin
al b
etw
een
0 an
d 7
FP to
pics
incl
ude:
(1) I
dent
ify re
prod
uctiv
e go
als
(2) P
rovi
de in
form
atio
n ab
out d
iffer
ent
FP m
etho
ds (3
) Dis
cuss
the
clie
nt’s
FP p
refe
renc
es (4
) Hel
p w
omen
sel
ect a
sui
tabl
e m
etho
d (5
) Edu
cate
wom
en to
use
the
sele
cted
met
hod
(6) E
xpla
in s
ide
effec
ts (7
) Ex
plai
n sp
ecifi
c m
edic
al re
ason
s to
retu
rn
Prov
ider
Wha
t pro
port
ion
of p
rovi
ders
at f
acili
ty d
o no
t req
uest
par
tner
con
sent
prio
r to
wom
an’s
rece
ipt o
f fam
ily p
lann
ing
serv
ices
dur
ing
a ch
ild h
ealth
ser
vice
vis
it?a
Cont
inuo
us b
etw
een
0 an
d 1
Prov
ider
Doe
s th
e fa
cilit
y pr
ovid
e bo
th c
hild
imm
uniz
atio
n an
d fa
mily
pla
nnin
g se
rvic
es?
Bina
ry (0
= n
o, 1
= ye
s)Fa
cilit
y
Wha
t is
the
norm
al p
ract
ice
at th
is fa
cilit
y if
clie
nt w
ants
fam
ily p
lann
ing
info
rmat
ion
dur‑
ing
a ch
ild h
ealth
ser
vice
vis
it?c
Ord
inal
bet
wee
n 0
and
7Re
spon
ses
incl
ude:
(0) F
acili
ty d
oes
not p
rovi
de c
hild
hea
lth s
ervi
ces
(1) F
acili
ty d
oes
prov
ide
child
hea
lth s
ervi
ces
but d
oes
not p
rovi
de fa
mily
pla
nnin
g se
rvic
es (2
) Clie
nt
is g
iven
no
info
rmat
ion
or re
ferr
al (3
) Clie
nt is
giv
en re
ferr
al to
ano
ther
faci
lity
(4) N
o ap
poin
tmen
t mad
e, c
lient
told
to re
turn
on
a di
ffere
nt d
ay (5
) App
oint
men
t mad
e fo
r di
ffere
nt d
ay (6
) Clie
nt s
omet
imes
rece
ives
info
rmat
ion
on s
ame
day
(7) C
lient
alw
ays
rece
ives
info
rmat
ion
on s
ame
day
Faci
lity
Wha
t is
the
norm
al p
ract
ice
at th
is fa
cilit
y if
clie
nt w
ants
hor
mon
al m
etho
d of
fam
ily p
lan‑
ning
dur
ing
a ch
ild h
ealth
ser
vice
vis
it?c
Ord
inal
bet
wee
n 0
and
7Re
spon
ses
incl
ude:
(0) F
acili
ty d
oes
not p
rovi
de c
hild
hea
lth s
ervi
ces
(1) F
acili
ty d
oes
prov
ide
child
hea
lth s
ervi
ces
but d
oes
not p
rovi
de fa
mily
pla
nnin
g se
rvic
es (2
) Clie
nt
is g
iven
no
info
rmat
ion
or re
ferr
al (3
) Clie
nt is
giv
en re
ferr
al to
ano
ther
faci
lity
(4) N
o ap
poin
tmen
t mad
e, c
lient
told
to re
turn
on
a di
ffere
nt d
ay (5
) App
oint
men
t mad
e fo
r diff
eren
t day
(6) C
lient
som
etim
es re
ceiv
es m
etho
d on
sam
e da
y (7
) Clie
nt a
lway
s re
ceiv
es m
etho
d on
sam
e da
y
Faci
lity
Wha
t is
the
scor
e of
ope
ratio
nal d
ays
whe
n bo
th c
hild
imm
uniz
atio
n an
d fa
mily
pla
nnin
g se
rvic
es a
re o
ffere
d?d
Cont
inuo
us b
etw
een
0 an
d 1
Defi
ned
as: (
Prop
ortio
n of
ope
ratio
nal d
ays
that
chi
ld im
mun
izat
ion
serv
ices
are
pro
vide
d)
mul
tiplie
d by
(Pro
port
ion
of o
pera
tiona
l day
s th
at fa
mily
pla
nnin
g se
rvic
es a
re p
rovi
ded)
Faci
lity
Page 7 of 16Sheahan et al. Reprod Health (2021) 18:47
across our sample. Additionally, one key benefit of devel-oping these indexes is the ability to apply them to under-stand the effects of integration on health and service delivery outcomes. Having a score for facilities that do not offer child immunization allows future research to better identify correlations between level of integration (even very low level) and other outcomes.
Index coherence and robustnessFollowing Filmer and Pritchett [48], we assessed the internal coherence and robustness of the indexes. We examined internal coherence by comparing facility char-acteristics and index scores across low (0–3.29), medium (3.30–6.59), and high integration groups (6.60–10). We assessed robustness by examining how the classifications of facilities having high Integration Index scores changed when different sub-sets of variables were entered into the PCA. To assess the robustness of the Provider Integration
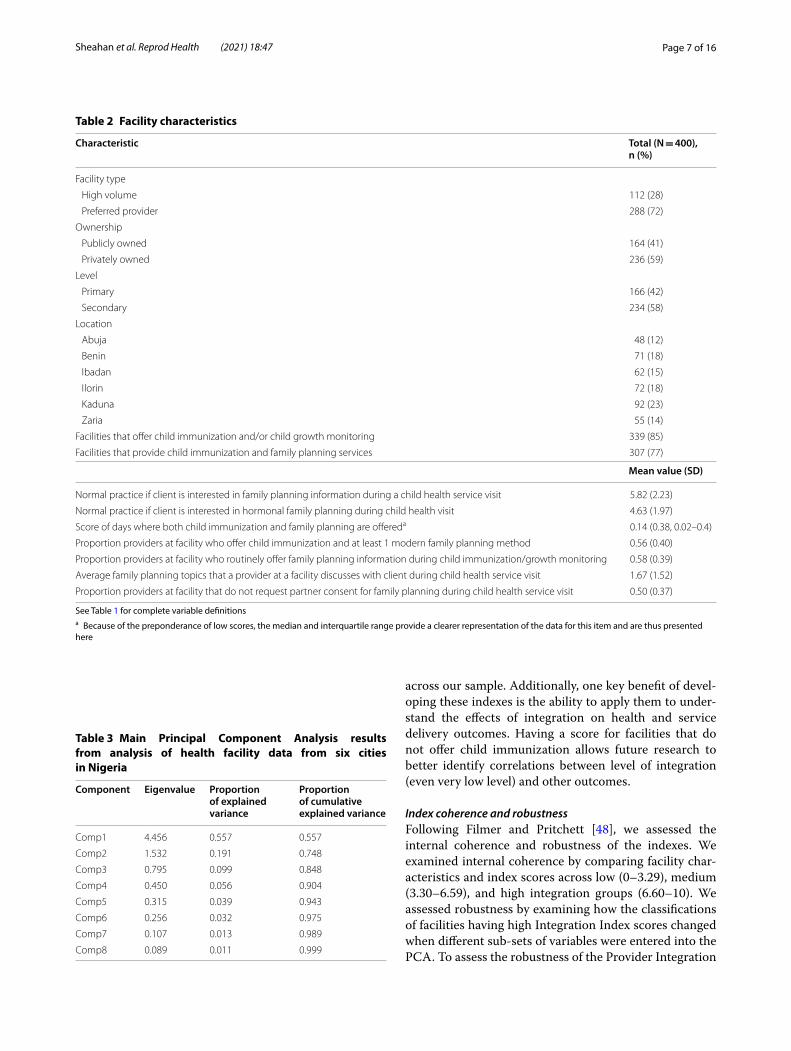
Table 2 Facility characteristics
See Table 1 for complete variable definitionsa Because of the preponderance of low scores, the median and interquartile range provide a clearer representation of the data for this item and are thus presented here
Characteristic Total (N = 400), n (%)
Facility type
High volume 112 (28)
Preferred provider 288 (72)
Ownership
Publicly owned 164 (41)
Privately owned 236 (59)
Level
Primary 166 (42)
Secondary 234 (58)
Location
Abuja 48 (12)
Benin 71 (18)
Ibadan 62 (15)
Ilorin 72 (18)
Kaduna 92 (23)
Zaria 55 (14)
Facilities that offer child immunization and/or child growth monitoring 339 (85)
Facilities that provide child immunization and family planning services 307 (77)
Mean value (SD)
Normal practice if client is interested in family planning information during a child health service visit 5.82 (2.23)
Normal practice if client is interested in hormonal family planning during child health visit 4.63 (1.97)
Score of days where both child immunization and family planning are offereda 0.14 (0.38, 0.02–0.4)
Proportion providers at facility who offer child immunization and at least 1 modern family planning method 0.56 (0.40)
Proportion providers at facility who routinely offer family planning information during child immunization/growth monitoring 0.58 (0.39)
Average family planning topics that a provider at a facility discusses with client during child health service visit 1.67 (1.52)
Proportion providers at facility that do not request partner consent for family planning during child health service visit 0.50 (0.37)
Table 3 Main Principal Component Analysis results from analysis of health facility data from six cities in Nigeria
Component Eigenvalue Proportion of explained variance
Proportion of cumulative explained variance
Comp1 4.456 0.557 0.557
Comp2 1.532 0.191 0.748
Comp3 0.795 0.099 0.848
Comp4 0.450 0.056 0.904
Comp5 0.315 0.039 0.943
Comp6 0.256 0.032 0.975
Comp7 0.107 0.013 0.989
Comp8 0.089 0.011 0.999
Page 8 of 16Sheahan et al. Reprod Health (2021) 18:47
Index, we ran 6 variations of the PCA. The first varia-tion (“base case”) included all variables. Each subsequent model omitted one of the provider integration variables. Similarly, to assess the robustness of the Facility Inte-gration Index, we ran 4 variations of the PCA. The first variation (the “base case”) included all variables. Each subsequent model omitted one of the facility integra-tion variables. Looking only at the sites classified as “high integration” in the base case, we examine the impact on classification when we omit one variable at a time from the PCA. As an additional robustness check, we also cre-ated the indexes using Exploratory Factor Analysis to ascertain whether these indexes correlate with those cre-ated using PCA.
ResultsEighty-five percent of facilities offer either child immuni-zation or child growth monitoring services while 77% of facilities provide both family planning and child immu-nization services (Table 2). Private facilities are less likely than public facilities to provide both child immunization and family planning services; 93% of public facilities pro-vide both child immunization and family planning ser-vices, while 66% of private facilities offer both services. Among the 93 facilities (81 = private, 12 = public) that do not offer both child immunization and family planning services, it is generally child immunization services that are not offered. Among the private facilities that do not
offer both child immunization and family planning ser-vices, 89% do not offer child immunization services while 9% do not offer family planning services. Among the public facilities that do not offer both child immuniza-tion and family planning services, 50% do not offer child immunization services while 50% do not offer family planning services (data not shown). Among facilities that provide family planning services, 84% offer them either 5 or 7 days a week. Immunization provision is less fre-quent; 51% of the facilities that provide them do so once or twice per week while 26% provide them every day. On average, 58% of providers in each facility report offering family planning information during child health visits while 56% of providers in each facility have been trained to provide both child immunization and family planning services. Providers, on average, addressed fewer than two of the seven elements of family planning service provi-sion during child health visits. Fifty percent of provid-ers report requesting partner consent prior to providing family planning at a child health visit, though this varies by method.
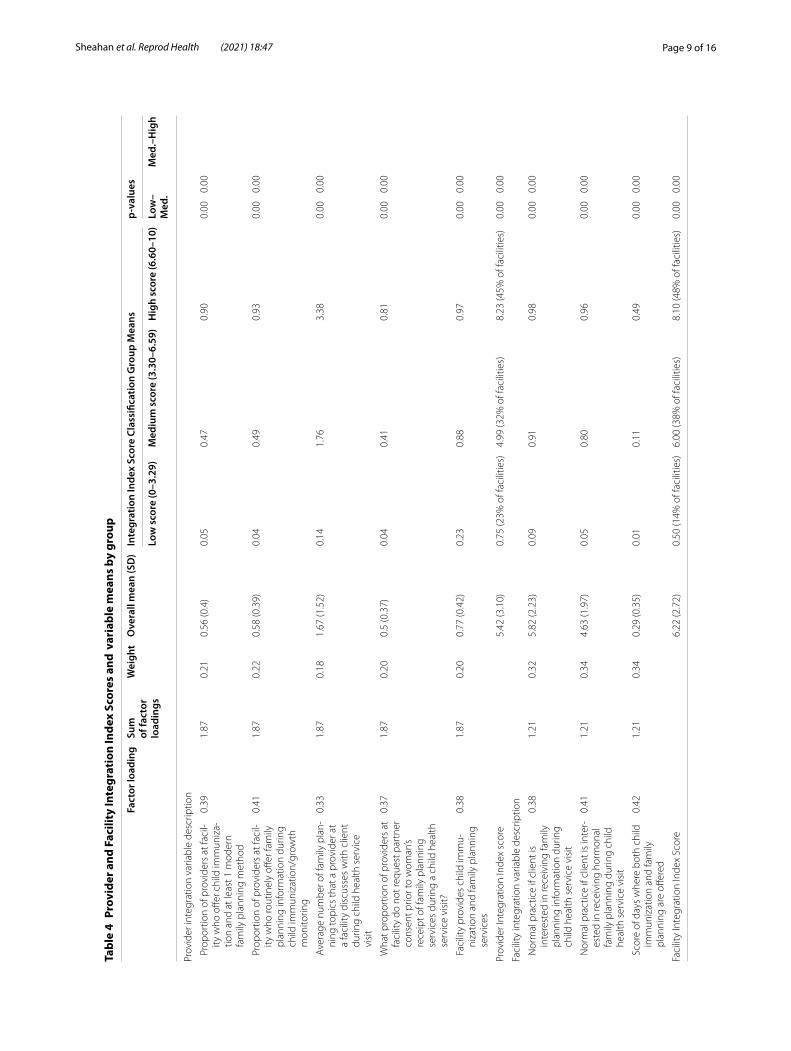
Index scores vary across facilities (Figs. 2 and 3). Table 4 provides Provider and Facility Integration Index scores and their classifications. Please refer to the “Creat-ing the Indexes” section for a description of how values in Table 4 were calculated and how these values link to the index scores. The mean Provider Integration Index score is 5.4 (standard deviation: 3.1, range: 0–10) and the mean
Fig. 1 Scree plot of eigenvalues after principal component analysis
Page 9 of 16Sheahan et al. Reprod Health (2021) 18:47
Tabl
e 4
Prov
ider
and
Fac
ility
Inte
grat
ion
Inde
x Sc
ores
and
var
iabl
e m
eans
by
grou
p
Fact
or lo
adin
gSu
m
of fa
ctor
lo
adin
gs
Wei
ght
Ove
rall
mea
n (S
D)
Inte
grat
ion
Inde
x Sc
ore
Clas
sific
atio
n G
roup
Mea
nsp-
valu
es
Low
sco
re (0
–3.2
9)M
ediu
m s
core
(3.3
0–6.
59)
Hig
h sc
ore
(6.6
0–10
)Lo
w–
Med
.M
ed.–
Hig
h
Prov
ider
inte
grat
ion
varia
ble
desc
riptio
n
Pro
port
ion
of p
rovi
ders
at f
acil‑
ity w
ho o
ffer c
hild
imm
uniz
a‑tio
n an
d at
leas
t 1 m
oder
n fa
mily
pla
nnin
g m
etho
d
0.39
1.87
0.21
0.56
(0.4
)0.
050.
470.
900.
000.
00
Pro
port
ion
of p
rovi
ders
at f
acil‑
ity w
ho ro
utin
ely
offer
fam
ily
plan
ning
info
rmat
ion
durin
g ch
ild im
mun
izat
ion/
grow
th
mon
itorin
g
0.41
1.87
0.22
0.58
(0.3
9)0.
040.
490.
930.
000.
00
Ave
rage
num
ber o
f fam
ily p
lan‑
ning
topi
cs th
at a
pro
vide
r at
a fa
cilit
y di
scus
ses
with
clie
nt
durin
g ch
ild h
ealth
ser
vice
vi
sit
0.33
1.87
0.18
1.67
(1.5
2)0.
141.
763.
380.
000.
00
Wha
t pro
port
ion
of p
rovi
ders
at
faci
lity
do n
ot re
ques
t par
tner
co
nsen
t prio
r to
wom
an’s
rece
ipt o
f fam
ily p
lann
ing
serv
ices
dur
ing
a ch
ild h
ealth
se
rvic
e vi
sit?
0.37
1.87
0.20
0.5
(0.3
7)0.
040.
410.
810.
000.
00
Fac
ility
pro
vide
s ch
ild im
mu‑
niza
tion
and
fam
ily p
lann
ing
serv
ices
0.38
1.87
0.20
0.77
(0.4
2)0.
230.
880.
970.
000.
00
Prov
ider
Inte
grat
ion
Inde
x sc
ore
5.42
(3.1
0)0.
75 (2
3% o
f fac
ilitie
s)4.
99 (3
2% o
f fac
ilitie
s)8.
23 (4
5% o
f fac
ilitie
s)0.
000.
00
Faci
lity
inte
grat
ion
varia
ble
desc
riptio
n
Nor
mal
pra
ctic
e if
clie
nt is
in
tere
sted
in re
ceiv
ing
fam
ily
plan
ning
info
rmat
ion
durin
g ch
ild h
ealth
ser
vice
vis
it
0.38
1.21
0.32
5.82
(2.2
3)0.
090.
910.
980.
000.
00
Nor
mal
pra
ctic
e if
clie
nt is
inte
r‑es
ted
in re
ceiv
ing
horm
onal
fa
mily
pla
nnin
g du
ring
child
he
alth
ser
vice
vis
it
0.41
1.21
0.34
4.63
(1.9
7)0.
050.
800.
960.
000.
00
Sco
re o
f day
s w
here
bot
h ch
ild
imm
uniz
atio
n an
d fa
mily
pl
anni
ng a
re o
ffere
d
0.42
1.21
0.34
0.29
(0.3
5)0.
010.
110.
490.
000.
00
Faci
lity
Inte
grat
ion
Inde
x Sc
ore
6.22
(2.7
2)0.
50 (1
4% o
f fac
ilitie
s)6.
00 (3
8% o
f fac
ilitie
s)8.
10 (4
8% o
f fac
ilitie
s)0.
000.
00
Page 10 of 16Sheahan et al. Reprod Health (2021) 18:47
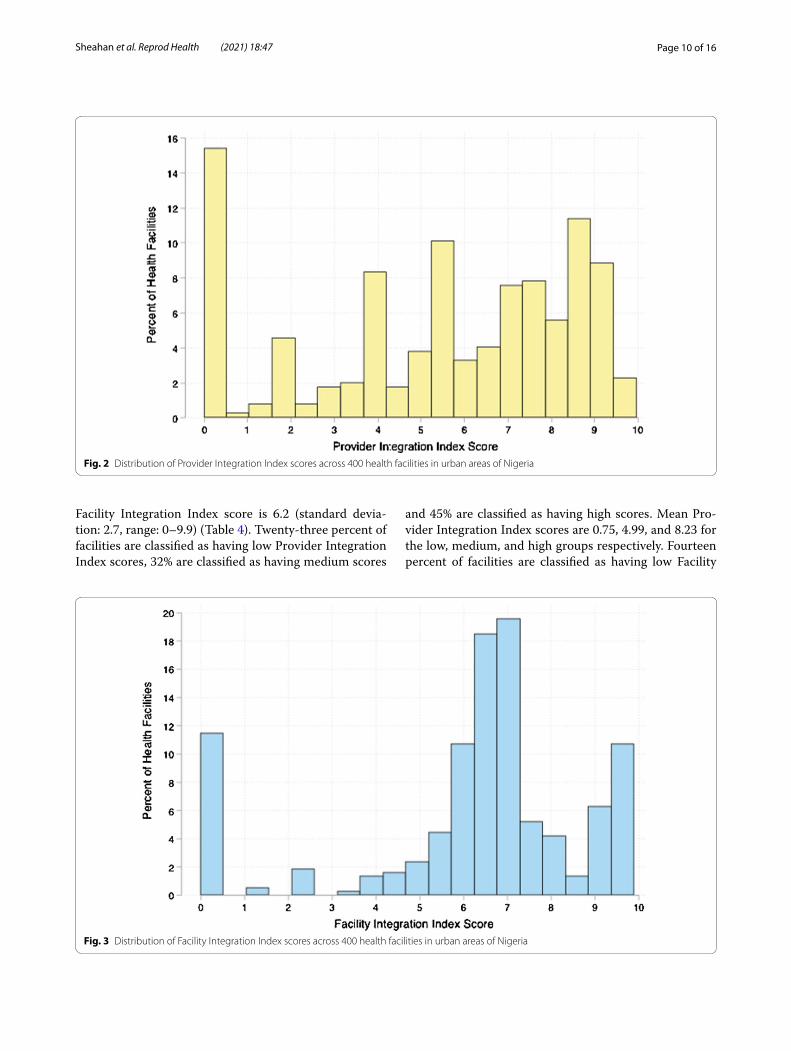
Facility Integration Index score is 6.2 (standard devia-tion: 2.7, range: 0–9.9) (Table 4). Twenty-three percent of facilities are classified as having low Provider Integration Index scores, 32% are classified as having medium scores
and 45% are classified as having high scores. Mean Pro-vider Integration Index scores are 0.75, 4.99, and 8.23 for the low, medium, and high groups respectively. Fourteen percent of facilities are classified as having low Facility
Fig. 2 Distribution of Provider Integration Index scores across 400 health facilities in urban areas of Nigeria
Fig. 3 Distribution of Facility Integration Index scores across 400 health facilities in urban areas of Nigeria
Page 11 of 16Sheahan et al. Reprod Health (2021) 18:47
Tabl
e 5
Prov
ider
Inte
grat
ion
Inde
x sc
ore
clas
sific
atio
n di
ffer
ence
s in
faci
litie
s cl
assi
fied
as “h
igh
inte
grat
ion”
in b
ase
case
Prov
ider
Inte
grat
ion
Inde
x sc
ore
clas
sific
atio
n
Inde
x sc
ore
Base
cas
e: a
ll va
riab
les
(%)
Om
itted
var
iabl
e
Prop
ortio
n pr
ovid
ers
who
offe
r chi
ld
imm
uniz
atio
n an
d at
leas
t 1 m
oder
n fa
mily
pla
nnin
g m
etho
d (%
)
Prop
ortio
n pr
ovid
ers
who
rout
inel
y off
er
fam
ily p
lann
ing
info
rmat
ion
duri
ng c
hild
im
mun
izat
ion
and
grow
th m
onito
ring
(%
)
Aver
age
num
ber
of fa
mily
pla
nnin
g to
pics
that
a p
rovi
der
disc
usse
s w
ith c
lient
du
ring
chi
ld h
ealth
se
rvic
e vi
sit (
%)
Prop
ortio
n pr
ovid
ers
who
do
not r
eque
st
part
ner c
onse
nt
duri
ng c
hild
hea
lth
serv
ice
visi
t (%
)
Faci
lity
prov
ides
bo
th c
hild
imm
uniz
atio
n an
d fa
mily
pla
nnin
g (%
)
Low
0.00
–3.2
90
00
00
0
Med
ium
3.30
–6.5
90
75
05
24
Hig
h6.
60–1
0.00
100
9395
100
9576

Page 12 of 16Sheahan et al. Reprod Health (2021) 18:47
Integration Index scores, 38% have medium scores and 48% have high scores. The mean Facility Integration Index scores are 0.50, 6.00, and 8.10 for the low, medium, and high groups respectively. The mean value of each component within each classification group is presented within the Integration Index Score Classification Group Means columns. For example, on average, 4% of provid-ers in facilities classified as having low integration index scores routinely offer family planning information during child immunization visits, 49% of providers in facilities with medium scores do, and 93% of providers in facilities with high integration index scores do. As another exam-ple, on average, providers in facilities classified as having low integration index scores discuss less than one (0.14) key family planning topic with clients during a child health services visit, while providers in facilities with medium integration index scores discuss fewer than two (1.76), and providers in facilities with high integration index scores discuss more than three (3.38) key topics.
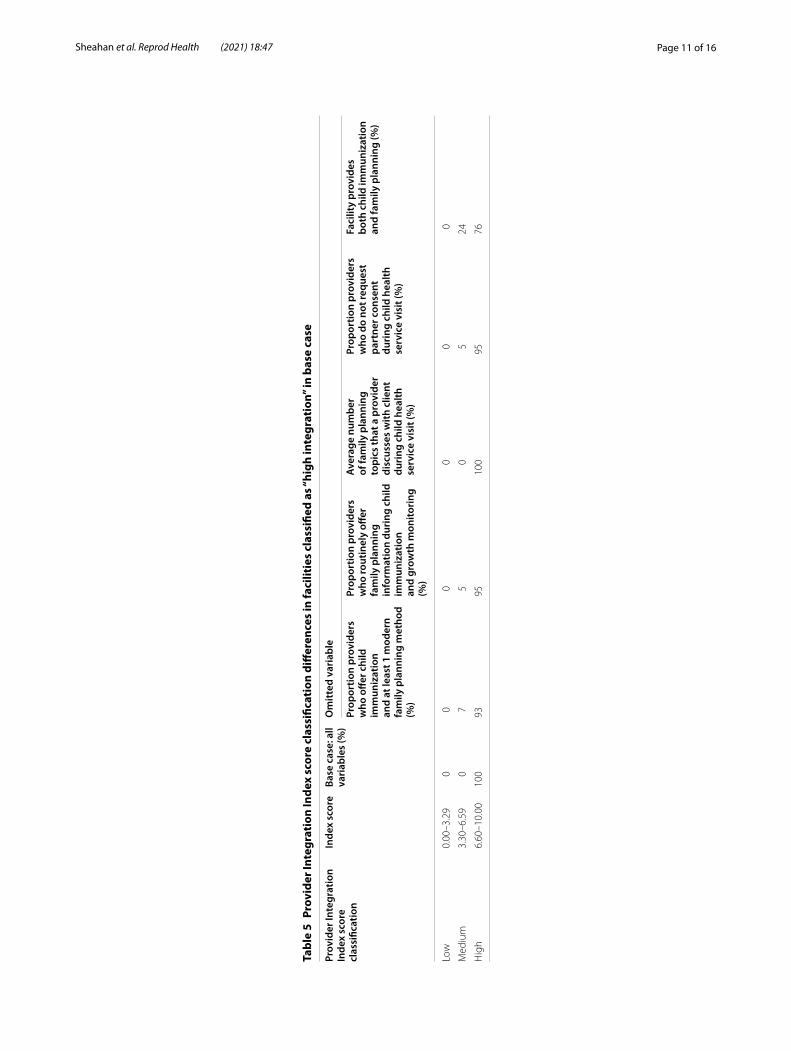
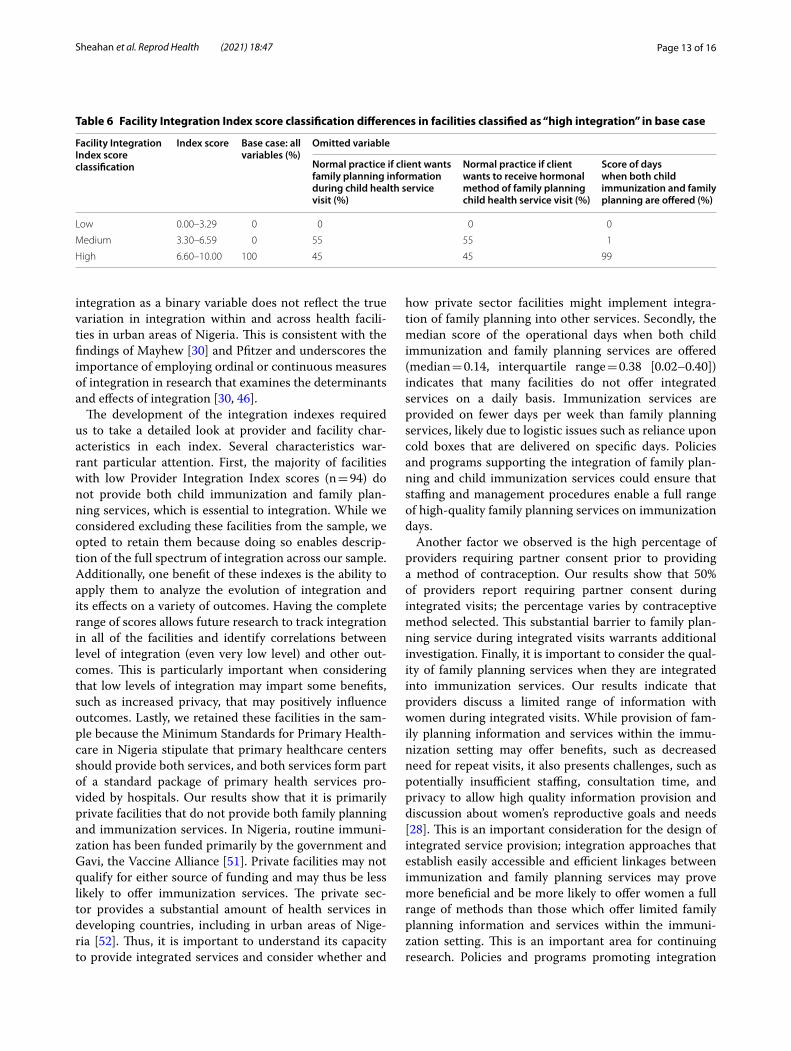
Internal coherence and robustness of the indexesBoth indexes demonstrate strong internal coherence. This is indicated by significant differences in facility char-acteristics and overall index scores across all groups for both indexes, meaning that the integration variables were significantly different between the low and medium score groups and the medium and high score groups (see p-val-ues in Table 4). The Provider Integration Index is highly robust to the inclusion of different sub-sets of variables in the model. This is evidenced by the very similar classifi-cation results among facilities with high scores following the use of variable sub-sets. Table 5 shows the percent of facilities classified as “high integration” in the base case compared with the percent of facilities classified as “high integration” in the subsequent models, which each omit a variable. The table also shows the percent of facilities classified as “high integration” that shift to the “medium integration” in each of the subsequent models. For exam-ple, when the variable “proportion of providers who offer child immunization and at least one modern family plan-ning method” is omitted from the PCA, 93% of the facili-ties that were classified as “high integration” in the base case remain in the “high integration” classification group while 7% shift to the “medium integration” group and 0% shift to the “low integration group”. Table 6 presents the same results for the Facility Integration Index. Unlike the Provider Integration Index, the Facility Integration Index shows considerable sensitivity to the different sub-sets of variables included in the PCA models. When the vari-ables indicating normal practices at the facility are omit-ted, the Facility Integration Index score shifts towards the mean value of the score of operational days when both child immunization and family planning services
are offered. Based on these assessments, we retained all base case variables in the model in order to reflect more characteristics of provider and facility integration [49]. Finally, the indexes created using EFA correlate strongly with the indexes created using PCA (Spearman rank cor-relation 0.99 for the Provider Indexes and 0.89 for the Facility Indexes), indicating that the results are robust to the use of either method.
DiscussionThe purpose of this paper is to demonstrate the develop-ment of novel indexes that may be adapted and applied to measure integration along a continuum, and to apply these indexes to describe the extent of family planning and child immunization integration across a large sam-ple of primary and secondary health facilities. The index scores allow for individual facility scoring and ranking; the components within the indexes enable even more nuanced analyses to inform policy and program strength-ening. These integration indexes may be adapted and employed to enrich understanding of integration levels within and across health facilities, identify facilities for intervention, inform and monitor the effectiveness of interventions, and investigate the effect of integration on a range of service delivery and health outcomes. The NURHI survey instruments are publicly available and provide a valuable reference for the adaptation or devel-opment of indicators for future programs and research [50]. Some widely used surveys offer the opportunity to adapt this methodology to analyze integration of family planning into other services. For example, the Demo-graphic and Health Survey (DHS) Program’s Service Provision Assessment (SPA) and the Performance Moni-toring for Action (PMA) surveys include indicators that assess service availability, provider training and/or scope of practice, and client receipt of family planning informa-tion and services during other consultations, though not immunization services. Future revisions of these surveys may offer the opportunity to include questions related to immunization services, which could facilitate analy-ses about the integration of family planning and child immunization services. With these other survey tools, a similar non-binary index of integration can be created to assess family planning integration into other reproduc-tive health services.
Our results suggest that facility norms and provider capacity to support integrated family planning and child immunization service delivery varies considerably across our sample. The identification of two distinct dimen-sions of integration, the heterogeneity of the scores and the substantial percentage of facilities within each inte-gration index classification level, suggests that measuring
Page 13 of 16Sheahan et al. Reprod Health (2021) 18:47
integration as a binary variable does not reflect the true variation in integration within and across health facili-ties in urban areas of Nigeria. This is consistent with the findings of Mayhew [30] and Pfitzer and underscores the importance of employing ordinal or continuous measures of integration in research that examines the determinants and effects of integration [30, 46].
The development of the integration indexes required us to take a detailed look at provider and facility char-acteristics in each index. Several characteristics war-rant particular attention. First, the majority of facilities with low Provider Integration Index scores (n = 94) do not provide both child immunization and family plan-ning services, which is essential to integration. While we considered excluding these facilities from the sample, we opted to retain them because doing so enables descrip-tion of the full spectrum of integration across our sample. Additionally, one benefit of these indexes is the ability to apply them to analyze the evolution of integration and its effects on a variety of outcomes. Having the complete range of scores allows future research to track integration in all of the facilities and identify correlations between level of integration (even very low level) and other out-comes. This is particularly important when considering that low levels of integration may impart some benefits, such as increased privacy, that may positively influence outcomes. Lastly, we retained these facilities in the sam-ple because the Minimum Standards for Primary Health-care in Nigeria stipulate that primary healthcare centers should provide both services, and both services form part of a standard package of primary health services pro-vided by hospitals. Our results show that it is primarily private facilities that do not provide both family planning and immunization services. In Nigeria, routine immuni-zation has been funded primarily by the government and Gavi, the Vaccine Alliance [51]. Private facilities may not qualify for either source of funding and may thus be less likely to offer immunization services. The private sec-tor provides a substantial amount of health services in developing countries, including in urban areas of Nige-ria [52]. Thus, it is important to understand its capacity to provide integrated services and consider whether and
how private sector facilities might implement integra-tion of family planning into other services. Secondly, the median score of the operational days when both child immunization and family planning services are offered (median = 0.14, interquartile range = 0.38 [0.02–0.40]) indicates that many facilities do not offer integrated services on a daily basis. Immunization services are provided on fewer days per week than family planning services, likely due to logistic issues such as reliance upon cold boxes that are delivered on specific days. Policies and programs supporting the integration of family plan-ning and child immunization services could ensure that staffing and management procedures enable a full range of high-quality family planning services on immunization days.
Another factor we observed is the high percentage of providers requiring partner consent prior to providing a method of contraception. Our results show that 50% of providers report requiring partner consent during integrated visits; the percentage varies by contraceptive method selected. This substantial barrier to family plan-ning service during integrated visits warrants additional investigation. Finally, it is important to consider the qual-ity of family planning services when they are integrated into immunization services. Our results indicate that providers discuss a limited range of information with women during integrated visits. While provision of fam-ily planning information and services within the immu-nization setting may offer benefits, such as decreased need for repeat visits, it also presents challenges, such as potentially insufficient staffing, consultation time, and privacy to allow high quality information provision and discussion about women’s reproductive goals and needs [28]. This is an important consideration for the design of integrated service provision; integration approaches that establish easily accessible and efficient linkages between immunization and family planning services may prove more beneficial and be more likely to offer women a full range of methods than those which offer limited family planning information and services within the immuni-zation setting. This is an important area for continuing research. Policies and programs promoting integration
Table 6 Facility Integration Index score classification differences in facilities classified as “high integration” in base case
Facility Integration Index score classification
Index score Base case: all variables (%)
Omitted variable
Normal practice if client wants family planning information during child health service visit (%)
Normal practice if client wants to receive hormonal method of family planning child health service visit (%)
Score of days when both child immunization and family planning are offered (%)
Low 0.00–3.29 0 0 0 0
Medium 3.30–6.59 0 55 55 1
High 6.60–10.00 100 45 45 99
Page 14 of 16Sheahan et al. Reprod Health (2021) 18:47
should ensure sufficient support to individual providers and facility systems to ensure that integration approaches enhance family planning service quality.
This study has several limitations. First, while the Nigerian Ministry of Health promotes the integration of family planning and child immunization services, it does not provide a precise definition of integration. We therefore relied upon Nigeria’s 2008 National Guidelines for the Integration of Reproductive Health and HIV Pro-grammes (this, to our knowledge, is the most detailed and comprehensive definition of integration promoted by the Nigerian Ministry of Health), the NURHI integra-tion strategy, and the broader integration literature to shape the attributes included in the indexes. This issue has challenged previous research; the lack of precise defi-nitions of integration has long complicated its measure-ment [53]. Also, because this was a secondary analysis, we could not get precise information about some factors that are important to integration, such as service overlap. While we know the number of days per week immuniza-tion and family planning services are offered, we do not know which days of the week, so although family plan-ning services are provided 5–7 days per week in the majority (approximately 85%) of facilities that provide family planning services, it is possible that we misrepre-sented the overlap in some instances (e.g., a facility that offers immunization on Monday and family planning on Monday, Wednesday and Friday would score the same as a facility that offers immunization on Tuesday and fam-ily planning on Monday, Wednesday and Friday). Future research could address this by collecting more specific information about the days and hours when these ser-vices are offered. Similarly, while we assume that pro-viders are aware of normal practices in the facility, it is possible that they lack completely accurate knowledge. Either of these situations may lead to inaccuracies that would affect the index scores. Additionally, the provider and facility survey responses may be subject to social desirability bias. Future studies may address this issue by triangulating information between clients and providers. Our sampling strategy ensured inclusion of public facili-ties, which was NURHI’s focus, as well as private facilities that women actually attended. This provided an oppor-tunity to collect relevant information about a variety of well-attended facilities across the six cities. However, the high number of private facilities precluded a census. Thus, our results are specific to our sample and are not generalizable to all urban facilities in Nigeria or other contexts. For example, because of NURHI’s focus on high-volume facilities, the sample includes 58% hospitals and thus over represents secondary facilities, which com-prise 12% of total health facilities in Nigeria [54]. Last, this data was collected in 2011 and our results should
be interpreted as a description of the extent of integra-tion within these facilities at the time of data collection. Indeed, whether, how, and why the extent of integration changes within facilities over time is an important area for future research.
Notwithstanding these limitations, this research advances the conversation about how to measure inte-gration by describing the development of more nuanced measures of integration that identify facility and provider attributes that support integrated service delivery. Such indexes are valuable because they allow for more detailed measurement of the determinants and effects of integra-tion over time. This research also describes the nature and extent of family planning and child immunization services integration in six cities of Nigeria. This is impor-tant information in light of the Nigerian government’s goal to reduce MMR and IMR by increasing contracep-tive prevalence, in part, by reaching more postpartum women through integration of family planning and child immunization services.
ConclusionIntegration of family planning and immunization ser-vices is complex and challenging, and evidence about its effects on service delivery and health outcomes has been inconsistent. Previous research on the integra-tion of family planning and child immunization has des-ignated health facilities as integrated or not based on whether the facility received an intervention intended to increase integration. This study takes a novel approach by developing indexes that offer continuous measures of facility-level family planning and child immunization services integration and using the indexes to identify the extent of integration within a sample of 400 health facili-ties in six urban sites of Nigeria. Measuring the degree of integration is valuable as a means of monitoring health facility and system performance. Over time, such meas-urement will enable clearer understanding of the extent, patterns, and adoption of integration as well the effect of integration programs on on service delivery and health outcomes.
This research underscores the need for policies and programs seeking to promote or improve integration to start with a clear, context-specific definition and approach that recognizes the dual provider and facility dimensions. The definition should align with specific Ministry of Health and program objectives and strategies and should be captured in data collection initiatives from the outset. While the method outlined in this paper is most appro-priate for programs that include a large number of facili-ties and have the necessary data collection and analytic expertise, smaller programs may incorporate some of the approaches highlighted in this paper. Such programs
Page 15 of 16Sheahan et al. Reprod Health (2021) 18:47
can articulate a precise and context-specific definition of integration and ensure that project implementation and routine monitoring and evaluation activities capture this definition with a variety of measures. Future research should analyze the determinants of integration and the effects of varying degrees of integration on service deliv-ery and health outcomes. While this research focuses specifically on service delivery within health facilities, further research should examine how health systems pillars such as governance, human resources, logistics, financing, and information management systems influ-ence integrated service delivery. A more robust evidence base is essential to the development of integration poli-cies and programs that will increase contraceptive prev-alence among postpartum women to promote healthy birth spacing and, ultimately, reduce maternal and infant morbidity and mortality globally.
AbbreviationsAIDS: Acquired immune deficiency syndrome; EFA: Exploratory factor analysis; FP: Family planning; HIV: Human immunodeficiency syndrome; HVF: High‑volume facility; IMR: Infant mortality rate; KMO: Kaiser–Meyer–Olkin; MLE: Measurement, Learning & Evaluation; MMR: Maternal mortality ratio; MSPH: Minimum Standards for Primary Healthcare; NURHI: Nigerian Urban Repro‑ductive Health Initiative; PCA: Principal Component Analysis; PPF: Preferred Provider Facility; SD: Standard deviation; WHO: World Health Organization.
AcknowledgementsNot applicable.
Authors’ contributionsKS led the design and implementation of research, data analysis, interpreta‑tion of results and manuscript writing. JOM contributed to data analysis and interpretation of results. IS provided critical contextual, theoretical, and meth‑odological guidance and expertise. SC provided theoretical and methodologi‑cal expertise. MW and JP contributed to conceptualization and presentation of the research. AVB contributed to conceptualization and presentation of the research and provided overall guidance and direction. All authors provided critical feedback and helped shape the research, interpretation of results and manuscript. All authors read and approved the final manuscript.
FundingThe Bill & Melinda Gates Foundation provided funding for the data collection of the data used in this study. The Bill & Melinda Gates Foundation did not play a role in the design of this study or in the analysis or interpretation of data.
Data availabilityData from this study and all documentation are available upon request through the MLE Dataverse website at: https ://datav erse.unc.edu/datav erse/mle.
Ethics approval and consent to participateThe study protocol and all consent procedures and consent forms were approved by the Institutional Review Board at the University of North Carolina at Chapel Hill and by the National Health Research Ethics Committee of Nigeria in Nigeria. All facility respondents were asked to consent to participate in the study. Prior to being surveyed, health providers were asked to sign consent forms that included details on the purpose of the study, potential benefits and potential risk, and clarified that the information provided would not be identifiable. Facility administrators who were asked questions about the services offered at the facility through a facility audit were asked for verbal consent to participate.
Consent for publicationNot applicable.
Competing interestsThe authors declare that they have no competing interests.
Author details1 The Durham Center of Innovation to Accelerate Discovery and Practice Transformation (ADAPT), (CIN 13‑410) at the Durham VA Health Care System, Durham, NC, USA. 2 Franklin and Marshall College, Lancaster, Pennsylvania, USA. 3 University of North Carolina at Chapel Hill, Chapel Hill, NC, USA.
Received: 26 June 2020 Accepted: 10 February 2021
References 1. Trends in maternal mortality 2000 to 2017: estimates by WHO, UNICEF,
UNFPA, World Bank Group and the United Nations Population Division. Geneva: World Health Organization; 2019. Licence: CCBY‑NC‑SA 3.0 IGO. https ://www.who.int/repro ducti vehea lth/publi catio ns/mater nal‑morta lity‑2000‑2017/en/. Accessed 21 Jan 2021.
2. National Population Commission (NPC) and ICF. Nigeria Demographic and Health Survey 2018. Abuja: NPC; 2019. https ://www.dhspr ogram .com/publi catio ns/publi catio n‑fr359 ‑dhs‑final ‑repor ts.cfm.
3. Government of the Federal Republic of Nigeria. Integration of the SDGs into National Development Planning: a voluntary review. Abuja; 2020. https ://susta inabl edeve lopme nt.un.org/conte nt/docum ents/26210 Main_Messa ges_Niger ia.pdf.
4. Bhutta ZA, Das JK, Bahl R, Lawn JE, Salam RA, Paul VK, et al. Can available interventions end preventable deaths in mothers, newborn babies, and stillbirths, and at what cost? Lancet (Lond, Engl). 2014;384(9940):347–70.
5. Family Planning 2020. Nigeria 2018 Core indicators 1–9 Country Fact Sheet 2018. http://www.famil yplan ning2 020.org/sites /defau lt/files /Niger ia%20201 8%201‑9%20Han dout.pdf. Accessed 28 Aug 2020.
6. Nigeria Family Planning 2020 Commitment Update. 2017. http://www.famil yplan ning2 020.org/sites /defau lt/files /Niger ia_FP202 0_Commi tment _2017.pdf. http://www.famil yplan ning2 020.org/niger ia. Accessed 21 Jan 2021. (press release).
7. Conde‑Agudelo A, Rosas‑Bermudez A, Kafury‑Goeta AC. Birth spac‑ing and risk of adverse perinatal outcomes: a meta‑analysis. JAMA. 2006;295(15):1809–23.
8. World Health Organization. Report of a WHO technical consultation on birth spacing. Geneva: World Health Organisation; 2006.
9. Moore Z, Pfitzer A, Gubin R, Charurat E, Elliott L, Croft T. Missed opportuni‑ties for family planning: an analysis of pregnancy risk and contraceptive method use among postpartum women in 21 low‑ and middle‑income countries. Contraception. 2015;92(1):31–9.
10. World Health Organization. Working together: an integration resource guide for immunization services throughout the life course. Geneva: World Health Organization; 2018.
11. World Health Organization. Global immunization coverage 1980 to 2019. 2019. https ://www.who.int/data/gho/data/theme s/immun izati on. Accessed 29 Mar 2020.
12. World Health Organization, Nigeria: WHO and UNICEF estimates of immunization coverage: 2019 revision. Geneva: World Health Organisa‑tion; 2019. https ://www.who.int/immun izati on/monit oring _surve illan ce/data/nga.pdf. Accessed 29 November 2020.
13. Wallace AS, Ryman TK, Dietz V. Experiences integrating delivery of mater‑nal and child health services with childhood immunization programs: systematic review update. J Infect Dis. 2012;205(Suppl 1):S6‑19.
14. High‑Impact Practices in Family Planning (HIP). Family planning and immunization integration: reaching postpartum women with family planning services. Washington, DC: USAID; 2013. http://www.fphig himpa ctpra ctice s.org. Accessed 15 Jan 2021.
15. Cooper CM, Fields R, Mazzeo CI, Taylor N, Pfitzer A, Momolu M, et al. Suc‑cessful proof of concept of family planning and immunization integration in Liberia. Glob Health Sci Pract. 2015;3(1):71–84.
16. Dulli L, Green M, Katz K. Increasing access to postpartum family planning services in Madagascar: assessing the feasibility and acceptability of immunization services as an entry point to family planning. Research Triangle Park, NC: Family Health International, Madagascar Ministry of Health and Family Planning, and Madagascar Institute of Public

Page 16 of 16Sheahan et al. Reprod Health (2021) 18:47
and Community Health. 2010. https ://www.resea rchga te.net/publi catio n/27369 2969_Incre asing _acces s_to_postp artum _famil y_plann ing_servi ces_in_Madag ascar _asses sing_the_feasi bilit y_and_accep tabil ity_of_immun izati on_servi ces_as_an_entry _point _to_famil y_plann ing. Accessed 15 Oct 2018.
17. Dulli LS, Eichleay M, Rademacher K, Sortijas S, Nsengiyumva T. Meeting postpartum women’s family planning needs through integrated family planning and immunization services: results of a cluster‑randomized controlled trial in Rwanda. Glob Health Sci Pract. 2016;4(1):73–86.
18. Huntington D, Aplogan A. The integration of family planning and child‑hood immunization services in Togo. Stud Fam Plan. 1994;25(3):176–83.
19. Cleland J, Shah IH, Daniele M. Interventions to improve postpartum fam‑ily planning in low‑ and middle‑income countries: program implications and research priorities. Stud Fam Plann. 2015;46(4):423–41.
20. Church K, Wringe A, Lewin S, Ploubidis GB, Fakudze P, Mayhew SH. Explor‑ing the feasibility of service integration in a low‑income setting: a mixed methods investigation into different models of reproductive health and HIV care in Swaziland. PLoS ONE. 2015;10(5):e0126144.
21. Ahumuza SE, Rujumba J, Nkoyooyo A, Byaruhanga R, Wanyenze RK. Chal‑lenges encountered in providing integrated HIV, antenatal and postnatal care services: a case study of Katakwi and Mubende districts in Uganda. Reprod Health. 2016;13:41.
22. Nigerian Federal Ministry of Health. Nigeria family planning blueprint (scale up plan). Abuja. 2014. https ://www.healt hpoli cypro ject.com/ns/docs/CIP_Niger ia.pdf. Accessed 20 Jan 2021.
23. Nigerian National Primary Healthcare Developement Agency. Minimum Standards for Primary Healthcare in Nigeria. Abuja. 2012. https ://www.hfr.healt h.gov.ng. Accessed 20 Jan 2021.
24. Kuhlmann AS, Gavin L, Galavotti C. The integration of family planning with other health services: a literature review. Int Perspect Sex Reprod Health. 2010;36(4):189–96.
25. Speizer IS, Fotso JC, Okigbo C, Faye CM, Seck C. Influence of integrated services on postpartum family planning use: a cross‑sectional survey from urban Senegal. BMC Public Health. 2013;13:752.
26. Vance G, Janowitz B, Chen M, Boyer B, Kasonde P, Asare G, et al. Integrat‑ing family planning messages into immunization services: a cluster‑rand‑omized trial in Ghana and Zambia. Health Policy Plan. 2014;29(3):359–66.
27. Blazer C, Prata N. Postpartum family planning: current evidence on suc‑cessful interventions. Open Access J Contracept. 2016;7:53–67.
28. Nelson AR, Cooper CM, Kamara S, Taylor ND, Zikeh T, Kanneh‑Kesselly C, et al. Operationalizing integrated immunization and family planning services in rural liberia: lessons learned from evaluating service quality and utilization. Glob Health Sci Pract. 2019;7(3):418–34.
29. Mounier‑Jack S, Mayhew SH, Mays N. Integrated care: learning between high‑income, and low‑ and middle‑income country health systems. Health Policy Plan. 2017;32(suppl_4):iv6–12.
30. Mayhew SH, Ploubidis GB, Sloggett A, Church K, Obure CD, Birdthistle I, et al. Innovation in evaluating the impact of integrated service‑delivery: the integra indexes of HIV and reproductive health integration. PLoS ONE. 2016;11(1):e0146694.
31. Mackenzie D, Pfitzer A, Maly C, Waka C, Singh G, Sanyal A. Postpartum family planning integration with maternal, newborn and child health services: a cross‑sectional analysis of client flow patterns in India and Kenya. BMJ Open. 2018;8(4):e018580. https ://doi.org/10.1136/bmjop en‑2017‑01858 0.
32. Hoang T, Goetz MB, Yano EM, Rossman B, Anaya HD, Knapp H, et al. The impact of integrated HIV care on patient health outcomes. Med Care. 2009;47(5):560–7.
33. Mattocks KM, Kroll‑Desrosiers A, Kinney R, Singer S. Understanding maternity care coordination for women veterans using an integrated care model approach. J Gen Intern Med. 2019;34(Suppl 1):50–7.
34. Measurement, Learning & Evaluation (MLE) Project; National Popula‑tion Council (NPC). 2010–2011 Nigeria baseline survey for the Urban Reproductive Health Initiative. Chapel Hill (NC): MLE Project; 2011. https ://www.nurhi toolk it.org/docum ent‑libra ry/nurhi ‑basel ine‑facil ity‑repor t#.YAiqZ i9h1R 4.
35. MEASURE Evaluation. Quick investigation of quality (QIQ): a user’s guide for monitoring quality of care in family planning. Chapel Hill, North Carolina: MEASURE Evaluation, University of North Carolina; 2016.
36. Nigeria Federal Ministry of Health. National Guidelines for the Integra‑tion of Reproductive Health and HIV programmes in Nigeria. Abuja.
2008. https ://www.child renan daids .org/sites /defau lt/files /2017‑05/Niger ia‑Integ rated ‑Natio nal‑Guild lines ‑For‑HIV‑Preve ntion ‑treat ment‑and‑care‑2014.pdf. Accessed 21 Jan 2021.
37. NURHI. Strategy for integrating family planning into maternal, new‑born, child health and HIV services, Abuja, 2009. https ://www.nurhi toolk it.org/docum ent‑libra ry/fp‑integ ratio n‑strat egy#.X9fdd C9h1R 4. Accessed 25 Sept 2019.
38. Dudley L, Garner P. Strategies for integrating primary health ser‑vices in low‐ and middle‐income countries at the point of delivery. Cochrane Database Syst Rev. 2011(7). Art. No.: CD003318. https ://doi.org/10.1002/14651 858.CD003 318.pub3.
39. Watt N, Sigfrid L, Legido‑Quigley H, Hogarth S, Maimaris W, Otero‑Garcia L, et al. Health systems facilitators and barriers to the integration of HIV and chronic disease services: a systematic review. Health Policy Plan. 2017;32(suppl_4):iv3–26.
40. Kerber KJ, de Graft‑Johnson JE, Bhutta ZA, Okong P, Starrs A, Lawn JE. Continuum of care for maternal, newborn, and child health: from slo‑gan to service delivery. Lancet (Lond, Engl). 2007;370(9595):1358–69.
41. Mayhew SH, Sweeney S, Warren CE, Collumbien M, Ndwiga C, Mutemwa R, et al. Numbers, systems, people: how interactions influence integration. Insights from case studies of HIV and repro‑ductive health services delivery in Kenya. Health Policy Plan. 2017;32(suppl_4):iv67–81.
42. RamaRao S, Lacuesta M, Costello M, Pangolibay B, Jones H. The link between quality of care and contraceptive use. Int Fam Plan Perspect. 2003;29(2):76–83.
43. Curry N, Ham C. Clinical and service integration: the route to improved outcomes. London: The King’s Fund; 2010.
44. de Jongh TE, Gurol‑Urganci I, Allen E, Jiayue Zhu N, Atun R. Barriers and enablers to integrating maternal and child health services to antenatal care in low and middle income countries. BJOG Int J Obstet Gynaecol. 2016;123(4):549–57.
45. Dynes MM, Bernstein E, Morof D, Kelly L, Ruiz A, Mongo W, et al. Client and provider factors associated with integration of family planning services among maternal and reproductive health clients in Kigoma Region, Tanzania: a cross‑sectional study, Apri–July 2016. Reprod Health. 2018;15(1):152.
46. Pfitzer A, Maly C, Tappis H, Kabue M, Mackenzie D, Healy S, et al. Charac‑teristics of successful integrated family planning and maternal and child health services: findings from a mixed‑method, descriptive evaluation. F1000Res. 2019;8:229.
47. Solo J, Festin M. Provider bias in family planning services: a review of its meaning and manifestations. Glob Health Sci Pract. 2019;7(3):371–85.
48. Filmer D, Pritchett LH. Estimating wealth effects without expenditure data—or tears: an application to educational enrollments in states of India. Demography. 2001;38(1):115–32.
49. Vyas S, Kumaranayake L. Constructing socio‑economic status indi‑ces: how to use principal components analysis. Health Policy Plan. 2006;21(6):459–68.
50. Measurement, Learning, and Evaluation Project, NURHI, & Data Research and Mapping Consult. Report of the baseline facility survey for the Nigerian Urban Reproductive Health Initiative (NURHI). 2011. http://www.nurhi toolk it.org/docum ent‑libra ry/nurhi ‑basel ine‑facil ity‑repor t#.WYx9L lKZN8 c. Accessed 10 Dec 2020.
51. Olumide F, Chidiabere O, Akinyede O, Botchway P, Soyemi K. Vaccine financing in Nigeria: are we making progress towards self‑financing/sus‑tenance? Pan Afr Med J. 2017;27(Suppl 3):9.
52. Levy JK, Curtis S, Zimmer C, Speizer IS. Assessing gaps and poverty‑related inequalities in the public and private sector family planning sup‑ply environment of urban Nigeria. J Urban Health. 2014;91(1):186–210.
53. Atun R, de Jongh T, Secci F, Ohiri K, Adeyi O. A systematic review of the evidence on integration of targeted health interventions into health systems. Health Policy Plan. 2010;25(1):1–14.
54. Makinde OA, Sule A, Ayankogbe O, Boone D. Distribution of health facili‑ties in Nigeria: implications and options for universal health coverage. Int J Health Plan Manag. 2018;33(4):e1179–92.
Publisher’s NoteSpringer Nature remains neutral with regard to jurisdictional claims in pub‑lished maps and institutional affiliations.