Embed Size (px)
Citation preview

Development of High-Durability Concrete with a Smart ArtificialLightweight AggregateJinhwan Jeon, Haruki MomoseTetsushi Kanda ,, HirozoMihashiJournal of Advanced Concrete Technology, volume ( ), pp.10 2012 231-239
Crack Self-healing Behavior of Cementitious Composites incorporating Various Mineral AdmixturesTae-Ho Ahn, Toshiharu KishiJournal of Advanced Concrete Technology, volume ( ), pp.8 2010 171-186
Experimental Study on Self-Healing Capability of FRCC Using Different Types of Synthetic FibersTomoya Nishiwaki , Hirozo Mihashi, Takatsune KikutaJournal of Advanced Concrete Technology, volume ( ), pp.10 2012 195-206
Development of Engineered Self-Healing and Self-Repairing Concrete-State-of-the-Art ReportHirozo Mihashi, Tomoya NishiwakiJournal of Advanced Concrete Technology, volume ( ), pp.10 2012 170-184
Robust Self-Healing Concrete for Sustainable InfrastructureVictor C. Li , Emily HerbertJournal of Advanced Concrete Technology, volume ( ), pp.10 2012 207-218
Marina Koda, MakotoYamada,

Journal of Advanced Concrete Technology Vol. 10, 231-239, July 2012 / Copyright © 2012 Japan Concrete Institute 231
Scientific paper
Development of High-Durability Concrete with a Smart Artificial Lightweight Aggregate Jinhwan Jeon1, Tetsushi Kanda2, Haruki Momose2 and Hirozo Mihashi3
Received 12 January 2012, accepted 8 July 2012 doi:10.3151/jact.10.231
Abstract Micro-crack development associated with the aging of concrete structure may be concerned in terms of decrease in du-rability. This study developed a smart artificial lightweight aggregate (ALA) capable of preventing micro-cracks by the internal curing with a reactive solution housed in its pore spaces. Water releasing capability of the smart ALA was first examined through laboratory tests that confirmed the improvement of water retaining capability within concrete. It was shown that water diffusion in concrete with the smart ALA was largely delayed leading to a decrease in micro-crack development and increase in compressive strength and improvement of durability indexes such as carbonation depth and air permeability.
1. Introduction
Concrete structures are subjected to drying and aging resulting in cracking and a subsequent decrease in its durability. Environmental conditions in cover concrete drive water transport and the resulting drying causes the visible and micro-cracks. One appropriate choice for the durable structures may be to achieve cover concrete with mitigating those cracks. The cracks need to be controlled by means of sufficient curing after placing but long term curing is very difficult in practice. To compensate the effects of long term curing, concrete-internal curing with water entraining media involved in concrete may miti-gate these cracks and leads to achieving durable concrete structures.
Internal curing has been recently investigated to re-duce autogenous shrinkage in high performance concrete (HPC, hereafter). HPC often suffers from early age cracking due to autogenous shrinkage, and this early-age cracking phenomena have been extensively investigated for years (e.g., Jensen and Hansen 2001). It has been proposed that HPCs’ autogenous shrinkage and early age cracking can be reduced by introducing concrete-internal curing by involving water entraining media as one of significant countermeasures for the phenomena (e.g., RILEM 2007, Jensen and Hansen 2001, Jensen and Lura 2005). The most typical water absorbed medias is artifi-cial lightweight aggregate (ALA). Henkensiefken et al. (2009) demonstrated that saturated ALA could nicely
mitigate autogenous shrinkage. Technology for durable and crack-mitigating concrete
cover should be based on normal strength concrete rather than HPCs to be widely accepted in construction industry. This is because cost of HPCs reaches 2 to 3 times higher than normal concrete typically in Japan, and durable cover concrete with normal strength may be at most 2 times higher in cost even if some supplemental con-stituent materials are added. Very few studies exist util-izing internal curing in normal strength concrete to achieve durable cover concrete. Crack mitigating effects of ALA’s concrete-internal curing on normal concrete have not been clarified. Furthermore, an expecting ob-stacle to adopt this approach is that saturated ALA rap-idly loses absorbed water as ambient RH decreasing (Tsuchiya et al. 2010). Typical concrete cover with normal lightweight concrete involving ALA cannot take advantage of internal curing effects. This is because internal water content in the lightweight concrete cover rapidly decreases with time and therefore internal curing effects may diminish. This implies that ALA’s water retaining characteristics should be modified to achieve durable concrete cover with normal concrete.
A goal in this study is to achieve durable concrete by developing a smart ALA, which is capable of preventing micro-cracks and densifies concrete microstructure by internal curing with a reactive solution housed in its pore spaces. The smart ALA is expected to bust the afore-mentioned obstacles. To reach this goal, two types of smart ALAs are produced, whose water desorption characteristics, water diffusion characteristics are ex-perimentally investigated in comparison with distilled water saturated ALA. Then the effects of the smart ALA’s internal curing are demonstrated in terms of in-creasing compressive strength, slowing carbonation progress, and decreasing micro-cracking amount in concrete.
1Research engineer, Building Construction and Materials Group, Kajima Technical Research Institute, Tokyo, Japan. E-mail:[email protected] 2Research engineer, Building Construction and Materials Group, Kajima Technical Research Institute, Tokyo, Japan. 3Professor emeritus, Tohoku University, Sendai, Japan.

J. Jeon, T, Kanda, H. Momose and H. Mihashi / Journal of Advanced Concrete Technology Vol. 10, 231-239, 2012 232
2. ALA as a smart material
2.1 Basic concept Basic concept of smart ALA is demonstrated in Fig. 1. Smart ALA is aimed at developing highly durable con-crete cover capable of preventing micro-cracks and den-sifies concrete microstructure by internal curing with a reactive solution housed in its pore spaces. We adopt four steps to reach this goal to take advantage of more effec-tive internal curing using smart ALAs. In the first step, ALA type suitable for effective internal curing is selected in this study. Adopted ALA can absorb less water in desorption process than normal ALAs but delay rapid retaining water releasing in drying condition in concrete. This delay is expected to contribute to ease the afore-mentioned obstacle to use internal curing concept to normal strength concrete. For high strength concrete, the adopted ALA has been successfully used to mitigate autogenous shrinkage in practice (Hishiki et al. 2005).
In the second step, reactive chemical solution replaces water housed in ALAs for efficient internal curing and densifying concrete microstructure. This chemical solu-tion selected in this study is colloidal silica, which is alternatively called as ultra-fine silica powder solution or nano-SiO2. Colloidal silica solution has 20 times higher viscosity than water and hence is going to strengthen function of smart ALAs, where enhances smart ALAs’ retaining water content and delaying retaining water release in desorption isotherm. Furthermore, colloidal silica released from the smart ALAs reacts with calcium hydroxide (pozzolanic reaction) and densifies concrete
microstructure. This reaction has been reported to im-prove concrete’s microstructure and permeability (e.g., Ji 2005), and may fill micro-crack formed in concrete due to drying. The colloidal silica may even heal nucleated micro-cracks due to the pozzolanic reaction, which is similar to self-healing function in other studies (e.g., Ahn and Kishi 2010). In the third step, viscosity controlled colloidal silica is used, which is modified by adding sodium bicarbonate solution. This addition leads to forming silica gel in ALAs’ pores and is expected to further increase retaining water content and delaying retaining water release. The final step is to mix fly ash in concrete in addition to the smart ALAs to strengthen microstructure densification.
2.2 Experimental plan Testing items and types of impregnated solutions for smart ALAs are shown in Table 1. Major components of adopted ALA with an absolute-dry density of 1.53 g/cm3 (maximum water content is 18.0 mass%) are coal ash and fine shale powder (Kasai et al. 2008). Properties of the adopted ALA are presented compared with a Japanese typical regular ALA product in Table 1. The adopted ALA has half of pore volume, 2/3 of water absorption rate, 2.5 times of crushing strength compared with of the regular ALA in this table. The adopted ALA has dense shell and rather porous inside in section. A scanning electron micrograph of the ALA cross section is shown in Fig. 2, where denser shell part is demonstrated than inside. Smaller pore volume in the adopted ALA has been presented than the regular ALA in Fig. 3. This fig-ure shows the former has much less pore volume ranging from 0.1 to 1 μm than the latter. This pore structure is expected to contribute to better internal curing effects for normal strength concrete.
Three types of impregnated solutions were used as shown in Table 2: distilled water, colloidal silica solution A and a viscosity-controlled colloidal silica solution B,
300μm
Surface
300μm
Inside
300μm300μm300μm
Surface
300μm300μm300μm
Inside
Fig. 2 SEM BSE image of the artificial light-weight ag-gregate cross section.
Table 1 Property of adopted ALA.
Property Adopted ALA Regular ALA Testing Density in oven-dry condition (g/cm3). 1.53 1.29 JIS A 1135
Water absorption rate (weight%) 18.0 26.0 JIS A 1135 Crashing Strength (N) 1510 576 JIS Z 8841
Total pore Volume (ml/g) 0.162 0.391 -
ALAALA
Diffusion of Chemical Solution go to the cement matrix
Artificial Light-weight Aggregate(ALA)
Impregnation of Chemical Solution
ALAALAALAALAALA
Diffusion of Chemical Solution go to the cement matrix
Artificial Light-weight Aggregate(ALA)
Impregnation of Chemical Solution
Fig. 1 Schematic concept of smartize artificial light-weight aggregate.
Diffusion of Chemical Solution to the Cement Matrix
J. Jeon, T, Kanda, H. Momose and H. Mihashi / Journal of Advanced Concrete Technology Vol. 10, 231-239, 2012 233
which are corresponding to the first to third steps ex-plained in a previous section. Solution A is a colloidal silica solution product in a market, whose average parti-cle diameter is 10 to 20 nm, solid content is 30%, pH is 10, viscosity is 15 cps at 25 °C, specific gravity is 1.21 at 25 °C. Solution B is produced from solution A by adding 0.2% sodium bicarbonate solution. This addition leads to gel formation in ALA, which appears to be caused by colloidal silica’s condensation polymerization. We con-firmed this gel formation phenomenon in preliminary test but have not yet clarified detailed chemical process.
Impregnated solution content was measured to clarify the degree of impregnation and water transport properties, while isothermal drying test was performed to check the transport of solution under various relative humidities. Absolute-dry ALA was introduced to a vacuum desic-cator in contact with three solutions mentioned above until a constant mass was confirmed. The impregnated ALA was wiped, weighed and the difference between the absolute-dry mass was divided with the absolute-dry mass as a mass-based impregnated solution content.
The isothermal desorption test was performed with a flow-division humidity generator. Impregnated ALAs were introduced to the specimen chamber, where they were dried under a controlled air flow of 10 liters per minute (variation of ± 1%) with a specified relative hu-midity at a temperature of 20°C, and changes in mass were continuously recorded. Although this method mainly evaluates water transport in gas phase and is different from that in concrete, it is still valid in com-parative evaluation of the water transport of smart ALAs in concrete.
2.3 Impregnated solution content and water diffusivity Because the maximum impregnated solution content was nearly 18 mass percent regardless of the solution type, the vacuum saturation method was found to be useful enough to attain the solution content as high as that of distilled water. The masses of the specimens with an impregnated solution showed gradual decrease with time. Specimens with solution A and B showed slower de-sorption than that with distilled water. The equilibrium impregnated solution content and diffusivity of solutions were simultaneously determined by curve-fitting the desorption data with Eq. 1 (Tada and Watanabe 2005). The equilibrium impregnated solution content corre-sponds to the equilibrium moisture content when the adsorbate is water.
m t( ) = a 1− bexp −ct( )⎡⎣ ⎤⎦ (1)
where m(t) is the total amount of mass entering or leav-ing the specimen (kg) at a time t (s), a (kg) is the equi-librium impregnated solution content after the infinite laps of time, b is a coefficient regarding to the shape of specimen (sphere in this case) and c (1/s) is a coefficient including the solution diffusion coefficient Dθ (m2/s) and is defined as c=Dθπ2/A2, where A is the radius of the specimen in millimeter. Because a represents the esti-mated equilibrium impregnated solution content θe (kg/m3) during desorption at a relative humidity, the residual amount of impregnated solution in the specimen θr (kg/m3) can be given by the following equation.
θr =θmax −θ e (2)
where θmax (kg/m3) is the maximum solution content obtained with the vacuum saturation method.
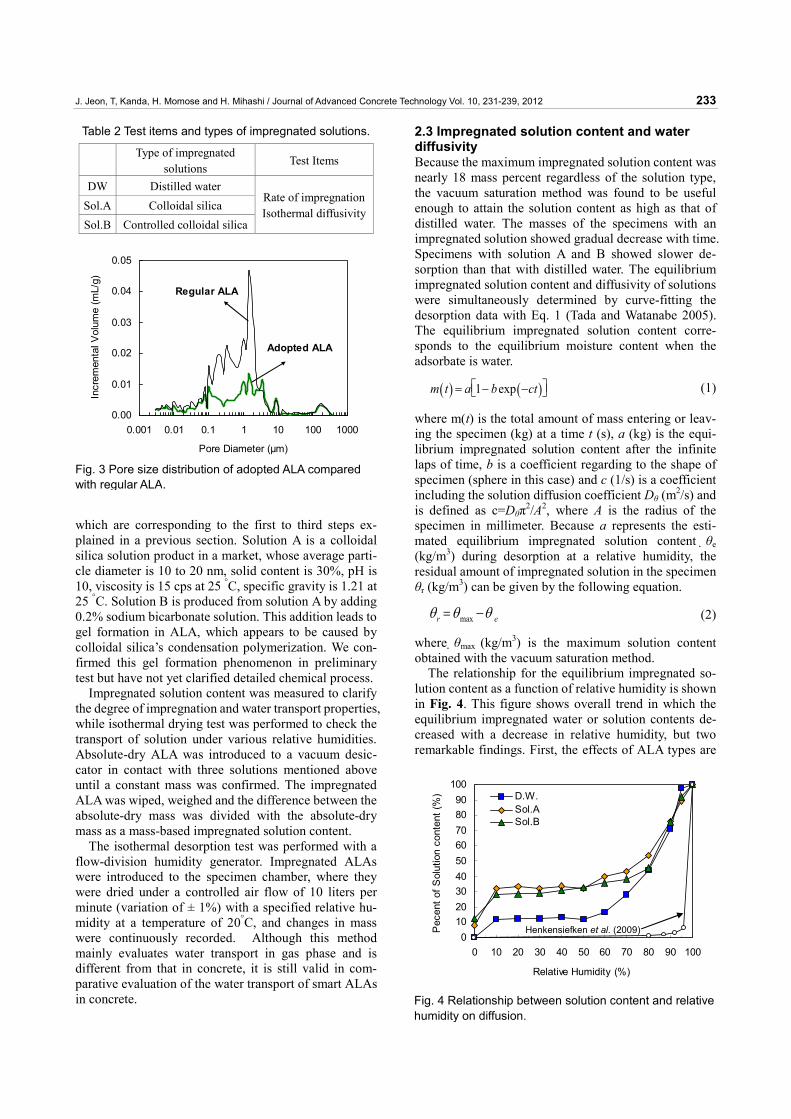
The relationship for the equilibrium impregnated so-lution content as a function of relative humidity is shown in Fig. 4. This figure shows overall trend in which the equilibrium impregnated water or solution contents de-creased with a decrease in relative humidity, but two remarkable findings. First, the effects of ALA types are
0.00
0.01
0.02
0.03
0.04
0.05
0.001 0.01 0.1 1 10 100 1000
Pore Diameter (μm)
Incr
emen
tal V
olum
e (m
L/g)
Regular ALA
Adopted ALA
Fig. 3 Pore size distribution of adopted ALA compared with regular ALA.
Table 2 Test items and types of impregnated solutions.
Type of impregnated
solutions Test Items
DW Distilled water Sol.A Colloidal silica Sol.B Controlled colloidal silica
Rate of impregnationIsothermal diffusivity
Fig. 4 Relationship between solution content and relative humidity on diffusion.
0102030405060708090
100
0 10 20 30 40 50 60 70 80 90 100
Relative Humidity (%)
Pec
ent o
f Sol
utio
n co
nten
t (%
) D.W.Sol.ASol.B
Henkensiefken et al. (2009)0
102030405060708090
100
0 10 20 30 40 50 60 70 80 90 100
Relative Humidity (%)
Pec
ent o
f Sol
utio
n co
nten
t (%
) D.W.Sol.ASol.B
Henkensiefken et al. (2009)

J. Jeon, T, Kanda, H. Momose and H. Mihashi / Journal of Advanced Concrete Technology Vol. 10, 231-239, 2012 234
significant. The equilibrium impregnated distilled water content in the adopted ALA is dramatically increased in any relative humidity revel compared with reference ALA referred from Henkensiefken et al. 2009. However, it should be noted that the reference ALA’s properties are not clear and their effects on this water retaining capa-bility is not clarified. When it is hypothesized that the regular ALA in Table 1 is similar to the reference ALA in Fig. 4, pore volume in the size from 0.1 to 1 μm may dominate this water retaining capability. Confirming this hypothesis should be a focus of further study. Second, the equilibrium impregnated solution contents with solution A and B were two to three times as large as that with distilled water under a relative humidity of 60%. This means that the adopted ALA with solution A or B has a high solution retention capability. However, differences between desorption isotherm diagrams of distilled water, solution A and solution B are not significant above RH80% in Fig. 4. This implies that intrinsic micro-structures in the adopted ALA dominates desorption properties at relative humidity above 80% and impreg-nated solution controls those under 80%. Detailed mechanisms for this trend are not clarified in this study but are remained to investigate for later study. It should be noted that equilibrium impregnated solution contents of A and B at relative humidity of 0% were smaller than that of solid content of the solution. This implied that the ultrafine particles in the solution stayed at the near-surface zone of the ALA due to a filtering effect of ALA that is rich in independent pores.
The result of solution diffusivity is shown in Fig. 5
where it is seen that the solution diffusivities of ALA were almost the same without regard to changes in rela-tive humidity.
With these results, it was confirmed that the adopted ALA has much higher water retention capability than reference one. Moreover, ALAs impregnated with the solutions are further improved in water retention capa-bility than that with distilled water because the equilib-rium impregnated solution contents were higher and diffusivities were smaller than those of ALA with dis-tilled water.
3. Highly durable concrete
3.1 Experimental design Types of concretes with smart ALAs and their constitu-ents are shown in Table 3. Five types of concrete with a common water to cement ratio of 0.5 and a fine aggregate (natural sand) content and with different coarse aggre-gate types were prepared: natural aggregate type (NA), ALA with distilled water (LW, corresponding to aggre-gate DW in Table 1), ALAs with impregnated solution (LS, corresponding to aggregate Solution A in Table 1) and with viscosity-controlled impregnated solution (LSV, corresponding to aggregate Solution B in Table 1) and LS with a fine aggregate 10-percent substituted with fly-ash (LFS). Mix proportions of the concretes are shown in Table 4. Unit cement content, unit water con-tent and type and unit content of fine aggregate excluding LSF were fixed while coarse aggregate type was varied using the ALAs.
Mixing of concrete was performed with a pan type mixer with a capacity of 100 liters. Materials were in-troduced to the mixer at one time and mixed for 90 sec-onds. Slump and air content of each mix was 20±1.5 cm and 4.5±1.0% respectively showing no particular dif-ference by mix.
1.E-10
1.E-09
1.E-08
1.E-07
0 20 40 60 80 100
Relative humidity (%)
Sol
utio
n D
iffus
ivity
(m2 /s
)
D.W.Sol.ASol.B
Fig. 5 Relationship between solution diffusivity and rela-tive humidity.
Table 3 Experimental parameters of concretes.
Aggregate types Type Types of Concrete
W/C (%) S G
Impregnation solutions Fly ash
(%)
NA Normal concrete Natural aggregates - - LW Lightweight concrete Distilled water - LS Colloidal silica -
LSV Controlled Colloidal silica - LSF
High-durability concrete 50
Natural aggregates Artificial light-weight
aggregate
Colloidal silica 10
Table 4 Mix proportions of concretes.
Weight(kg/m3) Type
W/B(%)
Air(%)
s/a (%) W C S FA G
NA 943
LW
LS
LSV
821 -
LSF
50 4.5 47 175 350
739 69
543

J. Jeon, T, Kanda, H. Momose and H. Mihashi / Journal of Advanced Concrete Technology Vol. 10, 231-239, 2012 235
3.2 Testing procedure (1) Humidity and strain measurement Dimensions of the specimen and curing conditions are shown in Table 5. Specimens for relative humidity and drying strain measurement have a dimension of 100x100x100 mm where sensors were installed as shown in Fig. 6. The relative humidity inside of the concrete specimen were measured with a polymer film type small humidity sensor with a diameter of 6 mm inserted in holes with a depth of 10, 50 and 90 mm from the open surface, which has RH measuring precision of ±3.0%. Drying strain was measured with a two-wire, single axis type mould gauge with a length of 30mm embedded at the same distance from the open surface as that of the humidity sensors.
Until the age of one week, specimens were subjected to sealed curing at a temperature of 20°C. They were then sealed with aluminum tape leaving only one surface opened for drying and subjected to drying under relative humidity of 60% and a temperature of 20°C.
(2) Microstructure and micro-crack measure-ment Specimens for the microstructure and micro-cracks de-termination were prepared with the same dimensions and curing procedure as that for the humidity and strain measurement. Specimen preparation procedure for SEM observation is as follows. 1: At the age of 28 days, specimens were cut with a
precision diamond cutter at positions 10, 50 and 90 mm from the open surface where cubes of 12x12x12
mm were extracted. Cutter was operated in the con-dition with round speed 2200 rpm and position speed 0.1mm/s.
2: Specimens were immersed in ethanol for 24 hours. 3: Specimens were dried using vacuum dry for 24 hours. 4: Specimens were placed in a vacuum container. The
container was evacuated for 20 min. to reach below 50 hPa. Then specimens were immersed into epoxy resin in the container for 30 min. The atmosphere pressure in the container was subsequently recovered in 30 min.
5: Specimens were removed from the container and cured in ambient room air at 20°C.
6: After embedded in epoxy resin, the test surfaces were polished and subjected to carbon deposition.
The microstructure of the cement paste matrix was observed with a SEM-EDX at a magnification of 500 times. Ten test areas were randomly selected and the back-scattered electron image of 245x184 μm (2048x1536 pixels) was subjected to image analysis. A region of micro pore with a diameter smaller than10 μm was extracted from the binary image, and then mi-cro-cracks were separated with EDX analysis targeting the carbon in the epoxy resin impregnated in mi-cro-cracks. Micro-cracks defined as an area of 0.75μm2, length of 1.5 μm, width of 0.5 μm, aspect ratio of 3.0, circle-equivalent diameter of 0.977 and form factor of 1.7 was subjected to image analysis and the ratio of mi-cro-crack area to the total area was calculated.
(3) Gas permeability A gas permeability test was performed on the basis of the recommendation of RILEM TC116-PCD. Specimens were prepared with a polyvinyl chloride form of 150 mm in diameter and 50 mm in height. After demolding, two specimens were accumulated to have the same height of 100 mm as the other specimens. They were subjected to sealed curing till the age of 7 days at a temperature of 20°C. Then the specimens were dried using an open surface under a relative humidity of 60% and a tem-perature of 20°C. Using nitrogen gas, gas permeability was determined when the gas flow reached a steady state condition. (4) Accelerated carbonation Specimens of 100x100x400 mm were prepared. They were subjected to sealed curing until the age of 7 days
Table 5 Dimensions of the specimen and curing conditions.
Test Item Dimensions (mm) Curing Conditions Relative humidity, Drying strain Micro-pore and Micro-crack area
100×100×100
Accelerated carbonation depth 100×100×400 Permeability φ150×50
Curing in condition of 20℃・R.H.60% after sealed curing for a week
φ100×200 Compressive strength
100×100×100
Water curing or Curing in condition of 20℃・R.H.60%
after sealed curing for a week
Fig. 6 Specimens for relative humidity(a) and dry-ing-strain(b).
Aluminum sheet
Moisture sensor
100
10
100
100
5090
50
1050
90
50
Exp
osed
sur
face
Exp
osed
surfa
ce
(a) (b)
Placing surfaceStrain gauge
Aluminum sheet
Moisture sensor
100
10
100
100
5090
5050
9050
1050
90
50
1050
90
50
Exp
osed
sur
face
Exp
osed
surfa
ce
(a) (b)
Placing surfaceStrain gauge

J. Jeon, T, Kanda, H. Momose and H. Mihashi / Journal of Advanced Concrete Technology Vol. 10, 231-239, 2012 236
and then dried under a relative humidity of 60% and a temperature of 20°C till the age of 4 weeks. Subsequently, they were cured under a CO2 content of 5.0±0.2%, a relative humidity of 60%±5% and a temperature of 20°C±2°C till the specified ages of testing. 4. Results and discussion
4.1 Relative humidity and drying strain Distributions of relative humidity within the specimens are shown in Fig. 7. For all the specimens, relative hu-midity tends to decrease as it approaches to the drying surface and with time, particularly at a position 10 mm below the drying surface. Near-surface relative humidity of the normal concrete specimen showed abrupt decrease at one week after the start of drying and that at the center and the deepest part also started to decrease gradually after the age of 4 weeks. Relative humidity at the center and the deepest part of LW concrete kept 100% until the age of 26 weeks and then showed gradual decrease. On the other hand, relative humidity of LS, LSV, and LSF specimens kept 100% until the age of 52 weeks except for the near-surface part showing its excellent water retention capability compared to that of the normal con-crete and LW.
Drying shrinkage strains in specimens are shown in Fig. 8. Upper diagram shows strains at the near-surface part, 10mm from the drying surface, and lower one shows those of bottom part, 90mm from the surface as shown in Fig. 6. The drying shrinkage strains at 10mm from the surface increased gradually with time and, for NA concrete specimen, it developed quickly at one week after the start of drying and reached -800μat the age of 52 weeks, while those of LW, LSV, and LFS concretes reached around -300μ at the age of 52 weeks. Reduction in the drying shrinkage strain was almost 500μproving excellent water retention capability of concretes involv-ing the adopted ALAs. Slightly larger drying shrinkage strain at 10mm from drying surface for LSV and LSF than LW may be due to densified microstructure for the former two concretes. LSV and LSF have higher com-pressive strength as explained in a next section and ap-
pear to have denser microstructures and higher shrinkage coefficient, which expresses the change in strain as a function of relative humidity change (e.g., Ayano and Wittman 2002), than LW. Higher shrinkage coefficient may lead to higher drying shrinkage strain even with smaller relative humidity decrease for concretes with higher compressive strength. Strain results at 90mm from the surface in Fig. 8 indicate concretes show swelling tendency except NA. This strain behavior appears to lead to very large drying shrinkage strain difference between NA and the other concretes at 10mm from the surface in the upper diagram in Fig. 8. The expansive strain of LW is largest of the four concretes involving the ALAs while its internal relative humidity at 90mm from the drying
Fig. 7 Distribution of relative humidity within the specimens.
50
60
70
80
90
100
0 10 20 30 40 50 60
材齢(日)
相対
湿度
(%
)
10mm50mm90mmLSF
50
60
70
80
90
100
0 10 20 30 40 50 60
材齢(日)
相対湿度 (%)
LSV50
60
70
80
90
100
0 10 20 30 40 50 60Age (weeks)
相対
湿度
(%
)
LS50
60
70
80
90
100
0 10 20 30 40 50 60
材齢(日)
相対湿度 (%)
LW50
60
70
80
90
100
0 10 20 30 40 50 601
Rel
ativ
e H
umid
ity
(%)
NA50
60
70
80
90
100
0 10 20 30 40 50 60
材齢(日)
相対
湿度
(%
)
10mm50mm90mmLSF
50
60
70
80
90
100
0 10 20 30 40 50 60
材齢(日)
相対湿度 (%)
LSV50
60
70
80
90
100
0 10 20 30 40 50 60Age (weeks)
相対
湿度
(%
)
LS50
60
70
80
90
100
0 10 20 30 40 50 60
材齢(日)
相対湿度 (%)
LW50
60
70
80
90
100
0 10 20 30 40 50 601
Rel
ativ
e H
umid
ity
(%)
NA
-1000
-800
-600
-400
-200
0
200
400
600
0 10 20 30 40 50 60
Age (weeks)
Stra
in
(x10
-6)
NA
10mm from Drying Surface
LSFLSV
LSLW
-1000
-800
-600
-400
-200
0
200
400
600
0 10 20 30 40 50 60
Age (weeks)
Stra
in
(x10
-6)
NA
LSLSV
LWLSF
90mm from Drying Surface
-1000
-800
-600
-400
-200
0
200
400
600
0 10 20 30 40 50 60
Age (weeks)
Stra
in
(x10
-6)
NA
10mm from Drying Surface
LSFLSV
LSLW
-1000
-800
-600
-400
-200
0
200
400
600
0 10 20 30 40 50 60
Age (weeks)
Stra
in
(x10
-6)
NA
LSLSV
LWLSF
90mm from Drying Surface
Fig. 8 Results of drying shrinkage strain.

J. Jeon, T, Kanda, H. Momose and H. Mihashi / Journal of Advanced Concrete Technology Vol. 10, 231-239, 2012 237
surface decreases with time away from 100%. The rea-sons for these tendencies are not clear in this study.
Figure 9 illustrates mass decrease of specimens with time due to drying, where mass loss is larger in LW than LS, LSV, and LSF. This is considered as a clear evidence of superior water retaining capability in the proposed smart ALAs.
4.2 Compressive strength Variations in compressive strength according to the cur-ing method are shown in Fig. 10. When subjected to the standard underwater curing, compressive strengths of the cylindrical specimen generally increased with their ages while those of high-durability concretes, LS and LSV,
were lower than that of the normal concrete (NA) and higher than LW. The compressive strength of LSF was five to ten percent greater than that of the normal con-crete. When subjected to air curing under 60% relative humidity and a temperature of 20°C, the compressive strengths of the cylindrical specimen generally decreased with their ages except for that of LSF which became 20 percent higher than that of normal concrete. Nearly the same tendency in the variation of compressive strength was observed when cubic specimens were subjected to the standard under water curing. However when sub-jected to air drying, compressive strengths of high-durability concrete tended to exceed those of the normal aggregate concrete after the age of 13 weeks and much greater after 52 weeks. These results implies that the improved water retention capability and additional reactions promoted by the solutions resulted in sufficient internal curing and densification that were responsible for the development of compressive strength.
In Fig. 10, effects of internal curing on compressive strength enhancing in dry curing under 60% relative humidity and a temperature of 20°C are more prominent in cubic specimens than in cylinder specimens. This arises from relatively weak drying driving force in cubic specimens, which lose internal water from only one side as shown in Fig. 6. Contrary to the cubic specimens, the cylinder specimens are subjected to drying in all surfaces, which means strong drying driving force. Water retention capability due to smart ALAs appears sufficient for the conditions of the cubic specimens but not for those of the cylinder specimens. However, it should be noted that internal curing capability effective for the cubic speci-mens satisfies practical requirements in actual construc-tion field. This is because the thinnest structural elements like floor slabs are subjected to similar drying driving force to the cubic specimens.
4.3 Micro-cracks An example of micro-crack as imaged by the backscat-tered electron with a scanning electron microscope is shown in Fig. 11. Almost all the micro-cracks can be observed at the boundary of calcium silicate hydrates (CSH) and unhydrated cement particles (UH).
Quantitative evaluation results of micro-pores and micro-cracks, which were conducted via SEM-image analysis following the condition explained in section 3.2 (2), are presented in Fig. 12. It may be a concern whether micro-cracks are additionally nucleated in the preparing procedure for SEM-observing specimens, which is specified as proc. 1 to 6 in section 3.2(2). There still exists possibility to generate additional micro-cracks before completing epoxy resin impregnating while we have preliminarily scrutinized this procedure to mini-mize this concern. Nucleated micro-cracks after epoxy resin impregnating are out of focus since being distin-guished as inside-empty ones. For minimizing this con-cern, degree of micro-cracking was represented using incremental micro-crack area. Incremental micro-crack
Fig. 9 Mass decreasing results of specimens due to dry-ing.
-5
-4
-3
-2
-1
0
0 10 20 30 40 50 60
Age (weeks)
Wei
ght P
erce
nt (%
)
NALWLSLSVLSF
Fig. 10 Results of compressive strength.
0
20
40
60
80
100
NA LW LS LSV LSF NA LW LS LSV LSF
Standard water curing 20℃・60%Dry curing
Type of Concrete
Com
pres
sive
Stre
ngth
(N/m
m2 ) 4weeks
13weeks52weeks
Cylindrical specimens(φ100×200cm)
0
20
40
60
80
100
NA LW LS LSV LSF NA LW LS LSV LSF
Standard water curing 20℃・60%Dry curing of one side
Type of Concrete
Com
pres
sive
Stre
ngth
(N/m
m2 )
4weeks13weeks52weeks
Cubic specimens(100×100×100mm)
Com
pres
sive
Stre
ngth
(N/m
m2 )
0
20
40
60
80
100
NA LW LS LSV LSF NA LW LS LSV LSF
Standard water curing 20℃・60%Dry curing
Type of Concrete
Com
pres
sive
Stre
ngth
(N/m
m2 ) 4weeks
13weeks52weeks
Cylindrical specimens(φ100×200cm)
0
20
40
60
80
100
NA LW LS LSV LSF NA LW LS LSV LSF
Standard water curing 20℃・60%Dry curing of one side
Type of Concrete
Com
pres
sive
Stre
ngth
(N/m
m2 )
4weeks13weeks52weeks
Cubic specimens(100×100×100mm)
Com
pres
sive
Stre
ngth
(N/m
m2 )

J. Jeon, T, Kanda, H. Momose and H. Mihashi / Journal of Advanced Concrete Technology Vol. 10, 231-239, 2012 238
area is defined as difference of micro-crack area at 10mm and 50mm points from that at 90mm. This definition is adopted since SEM-observing specimen preparing was intended to be uniform as much as possible, and amount of the additionally nucleated micro-cracks may be simi-lar independent of the depth in a specimen. Therefore, the incremental micro-crack area appears to reflect the effects of location in a specimen.
Figure 12 presents micro-pore area, micro-crack area
and incremental micro-crack area at the age of 28 days. Fig. 12 (a) and (c) show tendency in which magnitude of micro-pore area and incremental micro-crack area are larger at near-surface than inside of the specimen. This implies that drying is a responsible driving force for micro-cracks shown in Fig. 11. It was observed that both micro-pore area and incremental micro-crack area tended to decrease in the high-durability concretes compared to those of NA and LW.
4.4 Air permeability and carbonation depth Air permeability of concrete specimens is shown in Fig. 13. The air permeability tended to decrease with the age and that of the high-durability concretes was one order of magnitude smaller than that of the normal concrete im-plying the presence of sufficient internal curing and dense structures.
Accelerated carbonation test results are shown in Fig. 14. The carbonation depth tended to develop with time and that of the high-durability concretes was smaller than that of the normal lightweight concrete and a half of the normal concrete. This may be attributed to the favorable effects of high water retention capability and additional hydration reactions that contributed to the hydration development and densification of microstructure. Be-cause carbonation develops inward starting at the open surface, the relationship between carbonation depth and amounts of micro-cracks and micro-pores, at the position 10 mm below the open surface, is shown in Fig. 15. In this figure, micro-cracks and micro-pores were repre-sented as ratios of incremental micro-crack area and micro-pore area to total area respectively.
With above results, it was confirmed that the proposed high-durability concretes developed less micro-cracks and micro-pores resulting in the decrease in carbonation rate and depth. In this improvement, advantage of using colloidal silica solution is clear, which increases water retaining capability resulting better internal curing ef-fects and densifies microstructure due to additional pozzolanic reaction. Micro-pore reducing effects in Fig. 12(a) and resulting durability enhancing function shown in both Fig. 14 and Fig. 15 by using controlled colloidal silica were demonstrated in experimental data while
Fig. 11 Observation of micro-cracks by SEM-BEI (P:Pore, Cm:Microcrack,UH:Unhydrated cement particles, CSH: calcium silicate hydrates).
50μm
Cm
UH
CSH
P
50μm
Cm
UH
CSH
P
Cm
UH
CSH
P
Fig. 12Results of micro-cracks and micro-pores, (a)Micropore area,(b) Microcrack area (c)Incremental Microcrack Area.
0
0.5
1
1.5
2
2.5
0 10 20 30 40 50 60 70 80 90 100
Depth from drying surface (mm)
Mic
ropo
re A
rea
(x10
3 μm
2 )
(a)
0
50
100
150
200
0 10 20 30 40 50 60 70 80 90 100
Depth from drying surface (mm)
Mic
rocr
ack
Are
a (μ
m2 ) (b)
0
10
20
30
40
50
60
0 20 40 60 80 100
Depth from drying surface (mm)
Incr
emen
tal M
icro
crac
kA
rea
(μ
m2 )
NALWLSLSVLSF
(c)
0
0.5
1
1.5
2
2.5
0 10 20 30 40 50 60 70 80 90 100
Depth from drying surface (mm)
Mic
ropo
re A
rea
(x10
3 μm
2 )
(a)
0
50
100
150
200
0 10 20 30 40 50 60 70 80 90 100
Depth from drying surface (mm)
Mic
rocr
ack
Are
a (μ
m2 ) (b)
0
10
20
30
40
50
60
0 20 40 60 80 100
Depth from drying surface (mm)
Incr
emen
tal M
icro
crac
kA
rea
(μ
m2 )
NALWLSLSVLSF
(c)
Fig. 13 Results of permeability test.
0.01
0.1
1
10
NA LW LS LSV LSF
Types of Concrete
Per
mea
bilit
y C
oeffi
cien
t (×1
0-17 m
2 ) 4weeks13weeks
No Permeability
0.01
0.1
1
10
NA LW LS LSV LSF
Types of Concrete
Per
mea
bilit
y C
oeffi
cien
t (×1
0-17 m
2 ) 4weeks13weeks
No Permeability

J. Jeon, T, Kanda, H. Momose and H. Mihashi / Journal of Advanced Concrete Technology Vol. 10, 231-239, 2012 239
originally intended better water retaining capability than colloidal silica was not significant as shown in Fig. 9. Controlled colloidal silica may accelerate pozzolanic reaction. However, this evidence or feasible enhancing mechanism was not found in this study.
5. Conclusions
An artificial lightweight aggregate has been designed as a smart material and the high-durability concrete with the smart ALA was studied in terms of the development of compressive strength and the decrease in micro-cracks. The major findings are as follows. (1) The ALA was able to incorporate the impregnated
solutions as much as the maximum water content using vacuum saturation method and improvement of water retention capability was confirmed.
(2) The high-durability concrete with the smart ALA developed compressive strength more favorably than that of the normal concrete thanks to its high internal curing capability and the densified micro-structure due to additional hydration reactions pro-
vided by the impregnated solutions. (3) The high-durability concrete with the smart ALA
reduced the micro-cracks and micro-pores leading to an increase in durability such as decrease in car-bonation and air permeability.
References Ahn, T. and Kishi, T., (2010). “Crack self-healing
behavior of cementitious composites incorporating various mineral admixtures.” Journal of Advanced Concrete Technology, 8(2), 171-186.
Ayano, T. and Wittmann, F. H., (2002). “Drying, moisture distribution, and shrinkage o f cement-based materials.” Materials and Structures, 35, 134-140.
Henkensiefken, R., Bentz, D., Nantung, T. and Weiss, J., (2009). “Volume change and cracking in internally cured mixtures made with saturated lightweight aggregate under sealed and unsealed conditions.” Cement and Concrete Composites, 31, 427-437.
Hishiki, Y., Takada, K., Ohno, T., Ichinomiya, T., Morita, Y., (2005). “Experimental study on 150 MPa ultra high strength concrete controlling autogenous shrinkage” Journal of Japan Society of Civil Engineers, 781, 101-112.(in Japanese)
Jensen, O. M. and Hansen, P. F., (2001). “Autogenous deformation and RH-change in perspective.” Cement and Concrete Composites, 31, 1859-1865.
Jensen, O. M. and Lura, P., (2006). “Techniques and materials for internal water curing of concrete.” Materials and Structures, 39, 817-825.
Ji, T. (2005). “Preliminary study on the water permeability and microstructure of concrete incorporating nano-SiO2.” Cement and Concrete Research, 35, 1943-1947.
Kasai, H., Jeon, J. H., Wami, H., Fujiki, E., Tanaka, K. and Saito, A., (2008). “Development of artificial high strength light weight aggregate made from coal ash and expanding shale powder.” Journal of Structures and Construction Engineering, AIJ, 73(631), 1425-1432. (in Japanese)
Tsuchiya, N., Hayano, H., Iikura, H., Kanematsu, M., Maruyama, I., Nagai, H. and Noguchi, T., (2010). “Water behavior in light-weight aggregate concrete under dying condition by neutron radiography part2: distribution of amount of water vaporization in concrete.” Synopsis of annual meeting, AIJ, A-1, 1203-1204. (in Japanese)
RILEM, (2007). “Report 41: Internal Curing of Concrete - State-of-the-Art Report of RILEM Technical Committee 196-ICC,” Jensen O.M. ed., 2007.
Tada, S. and Watanabe, K., (2005). “Dynamic determination of sorption isotherm of cement based materials.” Cement and Concrete Research, 35, 2271-2277.
Fig. 14 Results of accelerated carbonation depth.
0
2
4
6
8
10
NA LW LS LSV LSF
Types of Concrete
Car
bona
tion
Dep
th
(mm
)
8weeks13weeks52weeks
Fig. 15 Effects of micro-cracks and micro-pores on car-bonation depth.
0
2
4
6
8
10
12
0 1 2 3 4 5
Ratio of Micropores and Microcracks (%)
Car
bona
tion
Dep
th (m
m)
Incremental Microcracky=39.542x + 2.0257
R2=0.61
Microporey=1.2968x+0.45
R2=0.72
10mm from Drying Surface