Embed Size (px)
Citation preview
INTERNATIONAL CONFERENCE ADRI - 5
“Scientific Publications toward Global Competitive Higher Education”
137
DEVELOPMENT OF FLOOD COUNTERMEASURES MODEL IN CAMPUS OF
KETINTANG UNESA SURABAYA
Kusnan 1)
, and Agus Wiyono2)
1,2)
Civil engineering, faculty of technique, surabaya state of university 1)
ABSTRACT
Surabaya is capital city of east java province. It is the third biggest city in Indonesia with
374.36 km2 in width. Southern Surabaya is a lowland 3-6 m above the sea level. There are
two campus of Unesa: one stands on the southern Surabaya at Jalan Ketintang district of
Gayungan and other stands on the western Surabaya at Jalan Lidah Wetan with the height
of 6-10 m above the sea level. In Ketintang, area of the puddle is 89.91 ha with the depth of
10-30 cm and needs 6 hours to shrink. Source of the problem is condition of secondary and
tertiary drainage channels which is not able to accommodate debit design. This research
aims to analyze capacity of secondary and tertiary drainage channels with the debit design
is calculated by using rain analysis design with frequency distribution method of Log
Pearson Type III with 10 years rescheduling. Another goal of this research is to make
design of extension or revitalization of channels gradually on master plan of campus.
Results of the research indicate that 13 of 21 segments of channels on area of research
have capacity of channel which is not able to accommodate debit design or Q channel < Q
design while other channels only need extra custody height. Other factors exist which may
influence the puddle in campus of Ketintang that is extra domestic waste 0.00023936 m3/s
and paddy soil hilling in left of Faculty of Technique and Rectorate that result in function
of land changes which previously to accommodate the puddle in the rain season now
becomes flat and unable to accommodate the puddle in the rain season. Several tertiary
channels should be changed into primary and secondary channels.
Keywords: extension model, flood countermeasures, drainage in campus of Unesa.
INTRODUCTION
1. Background
Surabaya is capital city of east java
province with area of 374.36 km2.
Surabaya is center of business, industry
and education especially in eastern
Indonesia. Southern Surabaya is located in
the low land with the height of 3-6 m
above sea level including here is campus
UNESA Ketintang while in western
Surabaya there is campus UNESA Lidah
Wetan with the height of 6-10 m above sea
level. River Brantas has two branches.
One of them is estuary Kali Mas.
Today Surabaya has many problems
when rainy season comes. One problem is
about flood. This situation happens almost
every year but still the problem hasn’t
been resolved yet even tends to increase
both the frequency, the extent, the depth
and the duration. This situation, of course,
is very harmful and disturbing activities
especially in campus UNESA Ketintang
such as economy, transportation,
education, and many more activities that
will be interrupted mainly teaching and
learning processes. Data about puddles in
Surabaya can be seen in Table 1 and
Figure 1-2 show flood/puddle in campus
UNESA Ketintang with the depth of 50
cm.
Table 1. Puddle areas in Surabaya
No Stagnant Region Name Large (ha)
Long (hours)
Depth (cm)
1. K. Kedurus 238,22 > 6 30-50
2. Kp. Petemon 105,77 2-4 30-50
3. Kp. Kandangan 237,12 > 6 30-50
4. Jl. Semarang 10,35 2-4 10-30
5. Ketintang 89,91 > 6 10-30
6. Jl. Gayungan I, II 29,48 > 6 10-30
7. Per. Bendul Merisi 31,86 2-4 10-30
8. Per. Jemur Andayani 31,71 > 6 10-30
9. Jl. Raya Rungkut/
Industri
122,54 > 6 50-70
INTERNATIONAL CONFERENCE ADRI - 5
“Scientific Publications toward Global Competitive Higher Education”
138
10. Medokan semampir 227,45 > 6 30-50
11. Jl. Mayjen Sungkono 8,34 > 6 > 70
12. Gunung Sari 185,17 > 6 50-70
Source: Department of Public Works and Highways drainage Surabaya 2012
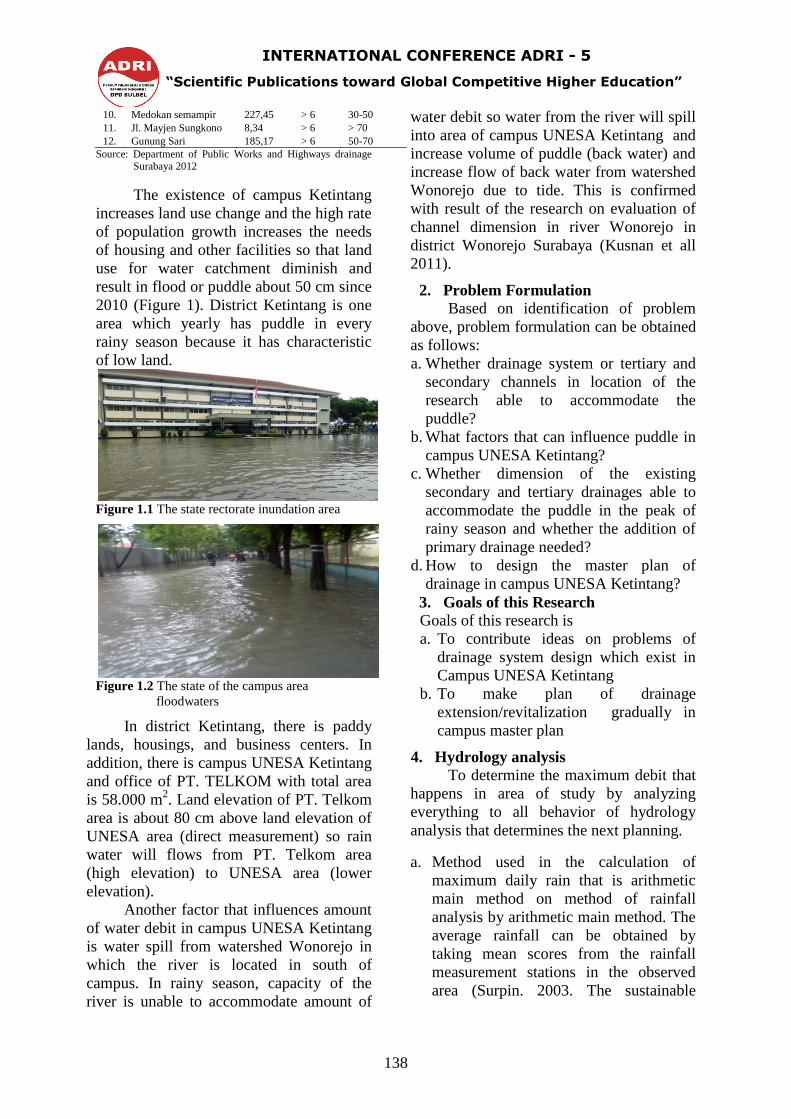
The existence of campus Ketintang
increases land use change and the high rate
of population growth increases the needs
of housing and other facilities so that land
use for water catchment diminish and
result in flood or puddle about 50 cm since
2010 (Figure 1). District Ketintang is one
area which yearly has puddle in every
rainy season because it has characteristic
of low land.
Figure 1.1 The state rectorate inundation area
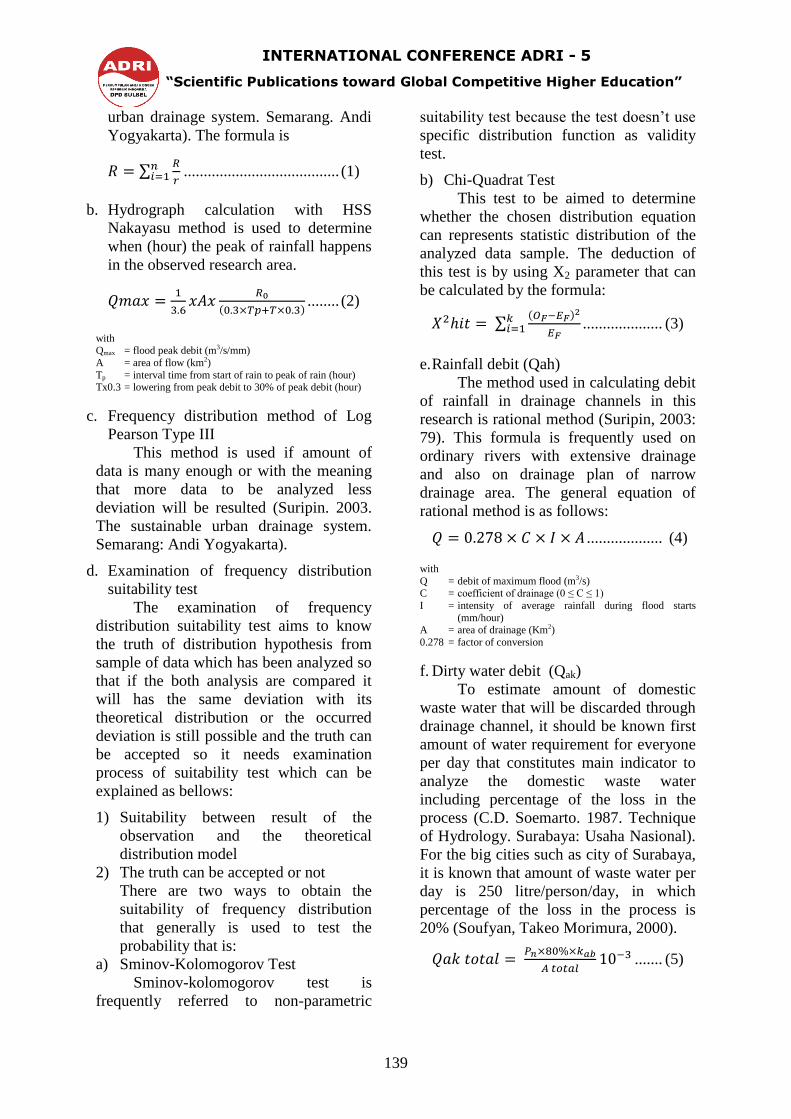
Figure 1.2 The state of the campus area
floodwaters
In district Ketintang, there is paddy
lands, housings, and business centers. In
addition, there is campus UNESA Ketintang
and office of PT. TELKOM with total area
is 58.000 m2. Land elevation of PT. Telkom
area is about 80 cm above land elevation of
UNESA area (direct measurement) so rain
water will flows from PT. Telkom area
(high elevation) to UNESA area (lower
elevation).
Another factor that influences amount
of water debit in campus UNESA Ketintang
is water spill from watershed Wonorejo in
which the river is located in south of
campus. In rainy season, capacity of the
river is unable to accommodate amount of
water debit so water from the river will spill
into area of campus UNESA Ketintang and
increase volume of puddle (back water) and
increase flow of back water from watershed
Wonorejo due to tide. This is confirmed
with result of the research on evaluation of
channel dimension in river Wonorejo in
district Wonorejo Surabaya (Kusnan et all
2011).
2. Problem Formulation
Based on identification of problem
above, problem formulation can be obtained
as follows:
a. Whether drainage system or tertiary and
secondary channels in location of the
research able to accommodate the
puddle?
b. What factors that can influence puddle in
campus UNESA Ketintang?
c. Whether dimension of the existing
secondary and tertiary drainages able to
accommodate the puddle in the peak of
rainy season and whether the addition of
primary drainage needed?
d. How to design the master plan of
drainage in campus UNESA Ketintang?
3. Goals of this Research
Goals of this research is
a. To contribute ideas on problems of
drainage system design which exist in
Campus UNESA Ketintang
b. To make plan of drainage
extension/revitalization gradually in
campus master plan
4. Hydrology analysis
To determine the maximum debit that
happens in area of study by analyzing
everything to all behavior of hydrology
analysis that determines the next planning.
a. Method used in the calculation of
maximum daily rain that is arithmetic
main method on method of rainfall
analysis by arithmetic main method. The
average rainfall can be obtained by
taking mean scores from the rainfall
measurement stations in the observed
area (Surpin. 2003. The sustainable
INTERNATIONAL CONFERENCE ADRI - 5
“Scientific Publications toward Global Competitive Higher Education”
139
urban drainage system. Semarang. Andi
Yogyakarta). The formula is
∑
....................................... (1)
b. Hydrograph calculation with HSS
Nakayasu method is used to determine
when (hour) the peak of rainfall happens
in the observed research area.
( ) ........ (2)
with Qmax = flood peak debit (m3/s/mm)
A = area of flow (km2)
Tp = interval time from start of rain to peak of rain (hour) Tx0.3 = lowering from peak debit to 30% of peak debit (hour)
c. Frequency distribution method of Log
Pearson Type III
This method is used if amount of
data is many enough or with the meaning
that more data to be analyzed less
deviation will be resulted (Suripin. 2003.
The sustainable urban drainage system.
Semarang: Andi Yogyakarta).
d. Examination of frequency distribution
suitability test
The examination of frequency
distribution suitability test aims to know
the truth of distribution hypothesis from
sample of data which has been analyzed so
that if the both analysis are compared it
will has the same deviation with its
theoretical distribution or the occurred
deviation is still possible and the truth can
be accepted so it needs examination
process of suitability test which can be
explained as bellows:
1) Suitability between result of the
observation and the theoretical
distribution model
2) The truth can be accepted or not
There are two ways to obtain the
suitability of frequency distribution
that generally is used to test the
probability that is:
a) Sminov-Kolomogorov Test
Sminov-kolomogorov test is
frequently referred to non-parametric
suitability test because the test doesn’t use
specific distribution function as validity
test.
b) Chi-Quadrat Test
This test to be aimed to determine
whether the chosen distribution equation
can represents statistic distribution of the
analyzed data sample. The deduction of
this test is by using X2 parameter that can
be calculated by the formula:
∑( )
.................... (3)
e. Rainfall debit (Qah)
The method used in calculating debit
of rainfall in drainage channels in this
research is rational method (Suripin, 2003:
79). This formula is frequently used on
ordinary rivers with extensive drainage
and also on drainage plan of narrow
drainage area. The general equation of
rational method is as follows:
................... (4)
with
Q = debit of maximum flood (m3/s) C = coefficient of drainage (0 ≤ C ≤ 1)
I = intensity of average rainfall during flood starts
(mm/hour) A = area of drainage (Km2)
0.278 = factor of conversion
f. Dirty water debit (Qak)
To estimate amount of domestic
waste water that will be discarded through
drainage channel, it should be known first
amount of water requirement for everyone
per day that constitutes main indicator to
analyze the domestic waste water
including percentage of the loss in the
process (C.D. Soemarto. 1987. Technique
of Hydrology. Surabaya: Usaha Nasional).
For the big cities such as city of Surabaya,
it is known that amount of waste water per
day is 250 litre/person/day, in which
percentage of the loss in the process is
20% (Soufyan, Takeo Morimura, 2000).
....... (5)
INTERNATIONAL CONFERENCE ADRI - 5
“Scientific Publications toward Global Competitive Higher Education”
140
g.Calculation of design flood debit
To determine amount of river based
on rainfall, we should review first
correlation between the existing rainfall
debit with topography and land use in the
observed area, parameters that influence
all hydraulic behavior of water in the
determined area reviewed against to
several factors that is : coefficient of
drainage (C), intensity of rainfall (I), and
area of drainage (A).
h.Coefficient of drainage (C)
Coefficient of drainage is ratio
between amount of water that flows in an
area due the rain is falling to amount of
rainfall that fall in the area. The magnitude
of drainage coefficient changes from time
to time in accordance with effect of land
use and river flow. Coefficient of drainage
in an area is influenced by important
factors (Imam Subarkah, 1978:42) that is:
1. Condition of rain
2. Area and configuration of drainage
area
3. Slope of drainage area and slope of
river base
4. Infiltration power and percolation of
land
5. Wetness of land
6. Air temperature, wind, and evaporation
7. Place of the drainage area to the wind
direction
8. Capacity of riverbed and area around
Coefficient of drainage is defined as
follows:
.............................................. (6)
with
C = coefficient of drainage Ro = amount of runoff
R = amount of rainfall
i. Coefficient of average drainage (cm)
A place with several kind of land use
can be determined too by considering
weight of each part in accordance with the
represented area. The formula is:
……………….(7)
with
Cm = coefficient of mean drainage Ai = area of each land use (km2)
Ci = coefficient of drainage of each land use
n = amount of land use in a drainage area
j. Intensity of rainfall (I)
Intensity of rainfall is the height of
rainfall that happens during a specific
period in an observed area in which the
water get concentrated. To analyze the
rainfall in a determined area can uses
formula as follows:
[
]
...................................... (8)
where
I = intensity of daily rainfall (mm/hour)
R24 = daily rainfall (mm) tc = time of the rainfall get concentrated
m = constant (m = 2/3)
k.Time of getting concentrated (tc)
Time of getting concentrated is time
that needed by the rainfall to flow from
one farthest point to a determined point
referred on a drainage area. To determine
time of the water flows on land surface, we
can use formula as follows:
tc= to + tf …………................... ...........(9)
................................................(10)
..................................(11)
where
tc = time of getting concentrated (hour)
t0 = time of the water takes to go to nearest drainage (hour)
tf = time of the water takes to flow in drainage (hour)
L0 = length of the farthest point on land perpendicular to the observed drainage (m)
S = mean slope of rainwater drainage
nd = coefficient of obstacle (Table 2) L = length of calculated rainwater drainage (m)
V = velocity of drainage (m/s)
∑
Cm =
Ai. Ci
Ai ∑
467,0
..44,1
S
Lndt o
o
V
Lt f
INTERNATIONAL CONFERENCE ADRI - 5
“Scientific Publications toward Global Competitive Higher Education”
141
Table 2. Coefficient of drainage roughness
Material Channel Manning (n)
Channels Without Couples
Soil 0,020 – 0,025 Sand and gravel 0,025 – 0,040
Rock 0,025 – 0,035
Channels with Couples
Cement mortar 0,015 – 0,017
Concrete 0,011 – 0,015
Masonry mortar wet 0,022 – 0,026 Masonry mortar dry 0,018 – 0,022
Channels Open Channels with stucco
Asphalt 0,013 – 0,017 Brick couple 0,012 – 0,018
Concrete 0,020 – 0,035
riprap 0,030 – 0,040
channel Excavation
Land, straight and uniform 0,030 – 0,015
Soil rock 0,050 – 0,140
Natural channel (a small river <3 m) 0,030 – 0,070
Source: Yusro Fahmi M. (2009).
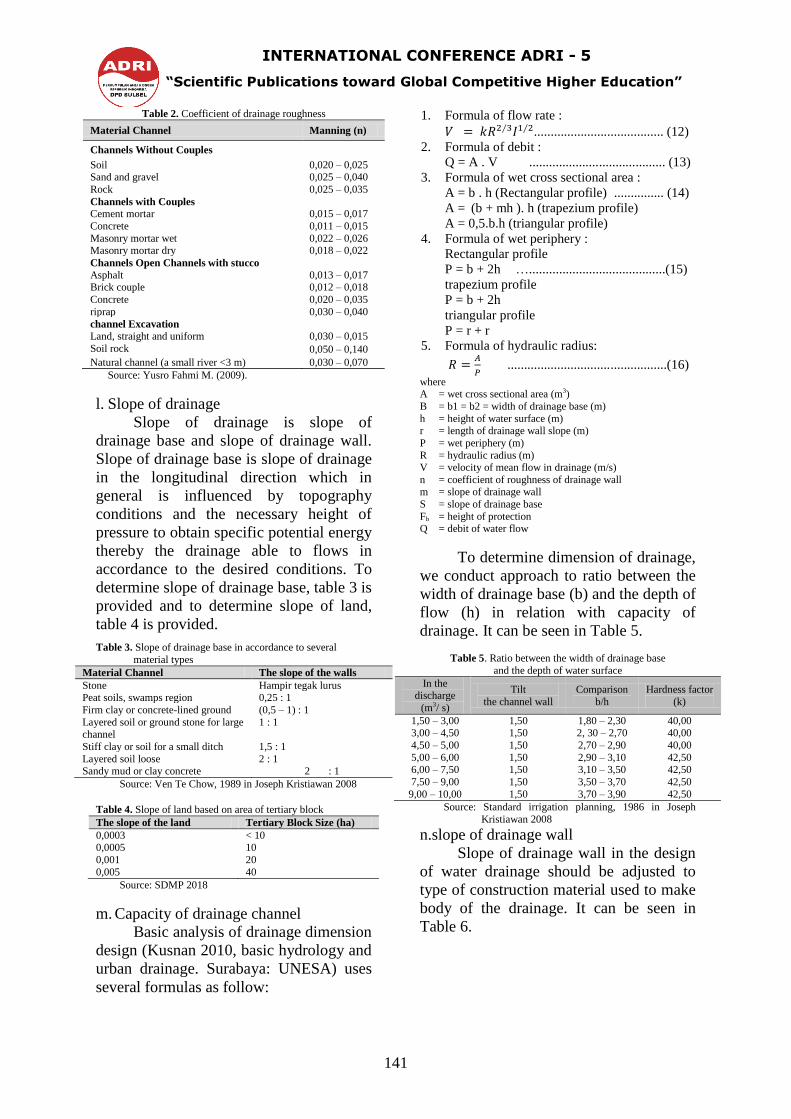
l. Slope of drainage
Slope of drainage is slope of
drainage base and slope of drainage wall.
Slope of drainage base is slope of drainage
in the longitudinal direction which in
general is influenced by topography
conditions and the necessary height of
pressure to obtain specific potential energy
thereby the drainage able to flows in
accordance to the desired conditions. To
determine slope of drainage base, table 3 is
provided and to determine slope of land,
table 4 is provided.
Table 3. Slope of drainage base in accordance to several
material types
Material Channel The slope of the walls
Stone Hampir tegak lurus Peat soils, swamps region 0,25 : 1
Firm clay or concrete-lined ground (0,5 – 1) : 1
Layered soil or ground stone for large channel
1 : 1
Stiff clay or soil for a small ditch 1,5 : 1
Layered soil loose 2 : 1 Sandy mud or clay concrete 2 : 1
Source: Ven Te Chow, 1989 in Joseph Kristiawan 2008
Table 4. Slope of land based on area of tertiary block
The slope of the land Tertiary Block Size (ha)
0,0003 < 10 0,0005 10
0,001 20
0,005 40
Source: SDMP 2018
m. Capacity of drainage channel
Basic analysis of drainage dimension
design (Kusnan 2010, basic hydrology and
urban drainage. Surabaya: UNESA) uses
several formulas as follow:
1. Formula of flow rate :
....................................... (12)
2. Formula of debit :
Q = A . V ......................................... (13)
3. Formula of wet cross sectional area :
A = b . h (Rectangular profile) ............... (14)
A = (b + mh ). h (trapezium profile)
A = 0,5.b.h (triangular profile)
4. Formula of wet periphery :
Rectangular profile
P = b + 2h ….........................................(15)
trapezium profile
P = b + 2h
triangular profile
P = r + r
5. Formula of hydraulic radius:
................................................(16)
where A = wet cross sectional area (m3)
B = b1 = b2 = width of drainage base (m)
h = height of water surface (m) r = length of drainage wall slope (m)
P = wet periphery (m)
R = hydraulic radius (m) V = velocity of mean flow in drainage (m/s)
n = coefficient of roughness of drainage wall m = slope of drainage wall
S = slope of drainage base
Fb = height of protection Q = debit of water flow
To determine dimension of drainage,
we conduct approach to ratio between the
width of drainage base (b) and the depth of
flow (h) in relation with capacity of
drainage. It can be seen in Table 5.
Table 5. Ratio between the width of drainage base
and the depth of water surface
In the discharge
(m3/ s)
Tilt
the channel wall
Comparison
b/h
Hardness factor
(k)
1,50 – 3,00 1,50 1,80 – 2,30 40,00 3,00 – 4,50 1,50 2, 30 – 2,70 40,00
4,50 – 5,00 1,50 2,70 – 2,90 40,00
5,00 – 6,00 1,50 2,90 – 3,10 42,50 6,00 – 7,50 1,50 3,10 – 3,50 42,50
7,50 – 9,00 1,50 3,50 – 3,70 42,50
9,00 – 10,00 1,50 3,70 – 3,90 42,50
Source: Standard irrigation planning, 1986 in Joseph
Kristiawan 2008
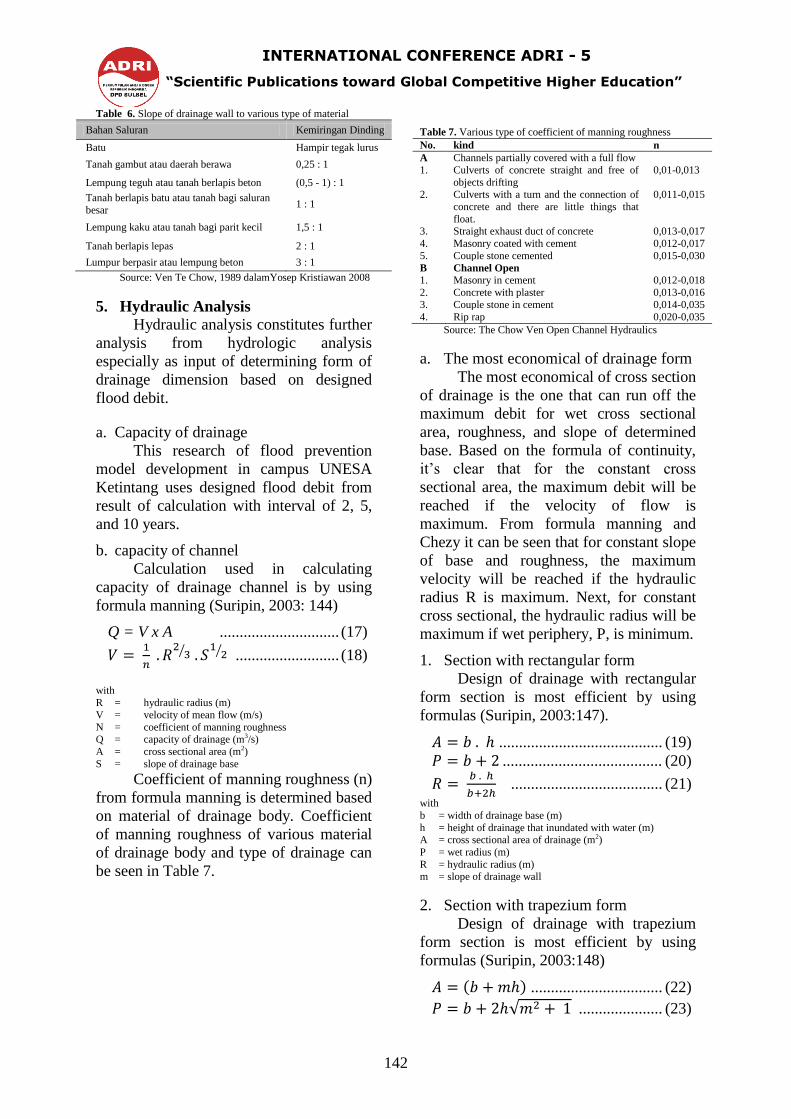
n.slope of drainage wall
Slope of drainage wall in the design
of water drainage should be adjusted to
type of construction material used to make
body of the drainage. It can be seen in
Table 6.
INTERNATIONAL CONFERENCE ADRI - 5
“Scientific Publications toward Global Competitive Higher Education”
142
Table 6. Slope of drainage wall to various type of material
Bahan Saluran Kemiringan Dinding
Batu Hampir tegak lurus
Tanah gambut atau daerah berawa 0,25 : 1
Lempung teguh atau tanah berlapis beton (0,5 - 1) : 1
Tanah berlapis batu atau tanah bagi saluran
besar 1 : 1
Lempung kaku atau tanah bagi parit kecil 1,5 : 1
Tanah berlapis lepas 2 : 1
Lumpur berpasir atau lempung beton 3 : 1
Source: Ven Te Chow, 1989 dalamYosep Kristiawan 2008
5. Hydraulic Analysis
Hydraulic analysis constitutes further
analysis from hydrologic analysis
especially as input of determining form of
drainage dimension based on designed
flood debit.
a. Capacity of drainage
This research of flood prevention
model development in campus UNESA
Ketintang uses designed flood debit from
result of calculation with interval of 2, 5,
and 10 years.
b. capacity of channel
Calculation used in calculating
capacity of drainage channel is by using
formula manning (Suripin, 2003: 144)
Q = V x A .............................. (17)
⁄
⁄ .......................... (18)
with
R = hydraulic radius (m)
V = velocity of mean flow (m/s)
N = coefficient of manning roughness Q = capacity of drainage (m3/s)
A = cross sectional area (m2)
S = slope of drainage base
Coefficient of manning roughness (n)
from formula manning is determined based
on material of drainage body. Coefficient
of manning roughness of various material
of drainage body and type of drainage can
be seen in Table 7.
Table 7. Various type of coefficient of manning roughness
No. kind n
A Channels partially covered with a full flow
1. Culverts of concrete straight and free of
objects drifting
0,01-0,013
2. Culverts with a turn and the connection of
concrete and there are little things that
float.
0,011-0,015
3. Straight exhaust duct of concrete 0,013-0,017
4. Masonry coated with cement 0,012-0,017
5. Couple stone cemented 0,015-0,030
B Channel Open
1. Masonry in cement 0,012-0,018
2. Concrete with plaster 0,013-0,016
3. Couple stone in cement 0,014-0,035
4. Rip rap 0,020-0,035
Source: The Chow Ven Open Channel Hydraulics
a. The most economical of drainage form
The most economical of cross section
of drainage is the one that can run off the
maximum debit for wet cross sectional
area, roughness, and slope of determined
base. Based on the formula of continuity,
it’s clear that for the constant cross
sectional area, the maximum debit will be
reached if the velocity of flow is
maximum. From formula manning and
Chezy it can be seen that for constant slope
of base and roughness, the maximum
velocity will be reached if the hydraulic
radius R is maximum. Next, for constant
cross sectional, the hydraulic radius will be
maximum if wet periphery, P, is minimum.
1. Section with rectangular form
Design of drainage with rectangular
form section is most efficient by using
formulas (Suripin, 2003:147).
......................................... (19)
........................................ (20)
...................................... (21)
with
b = width of drainage base (m)
h = height of drainage that inundated with water (m) A = cross sectional area of drainage (m2)
P = wet radius (m)
R = hydraulic radius (m) m = slope of drainage wall
2. Section with trapezium form
Design of drainage with trapezium
form section is most efficient by using
formulas (Suripin, 2003:148)
( ) ................................. (22)
√ ..................... (23)
INTERNATIONAL CONFERENCE ADRI - 5
“Scientific Publications toward Global Competitive Higher Education”
143
( )
√ .............................. (24)
METHOD OF RESEARCH
1. Type Of Research
This research of flood prevention
model development in campus UNESA
Ketintang uses descriptive quantitative
research method. Descriptive research is
base for all research. Descriptive research
can be done quantitatively in order to
conduct statistical analysis.
2. Data Of Research
a. Data of condition of observed area
consists of
1) Daily rainfall data in one year
2) Topography map data of observed
area
b. The necessary technical data consists
of
1) Land use map data
2) Master plan map data of observed
area
3) Profile measurement data and
dimension of drainage channel
4) Drainage network map data
5) Total population data of observed
area
c. The necessary nontechnical data
consists of
1) Direct observation in puddle
location
2) Information about events that
relevant with condition of flood
puddle from people around
3. Technique Of Data Collection
To obtain reliable data, method of
data collection uses:
a. Observation method
b. Documentation method
c. Literature method
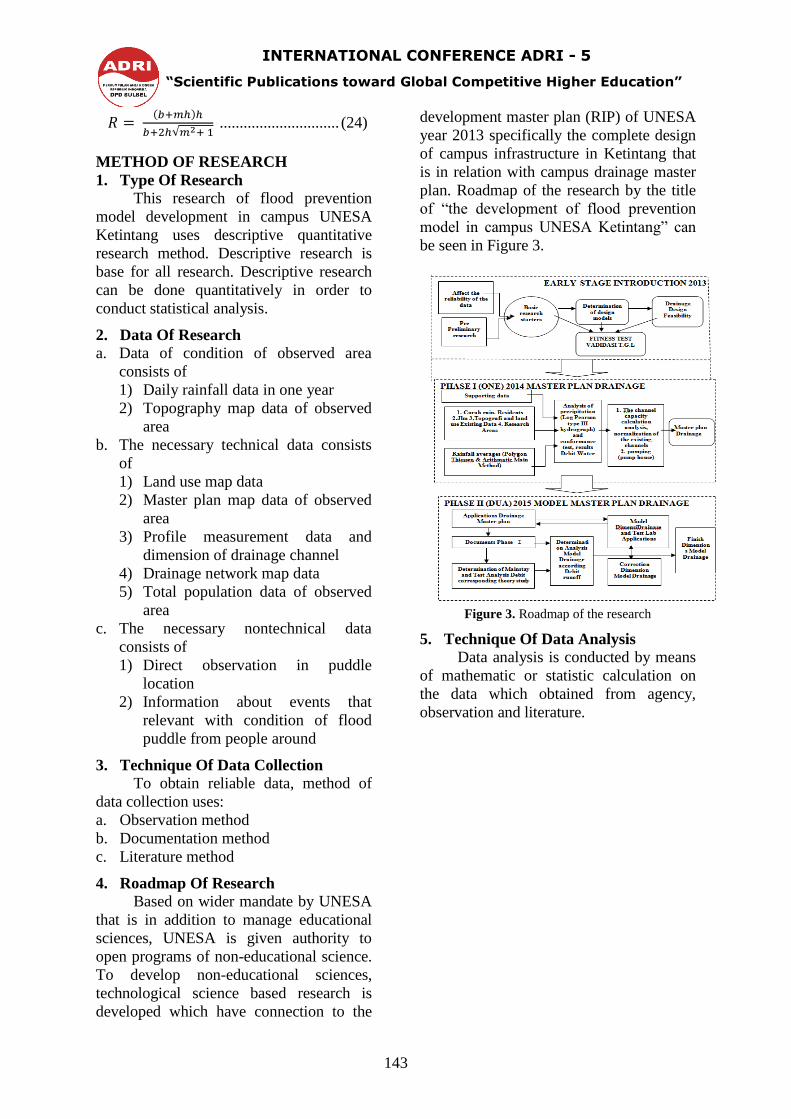
4. Roadmap Of Research
Based on wider mandate by UNESA
that is in addition to manage educational
sciences, UNESA is given authority to
open programs of non-educational science.
To develop non-educational sciences,
technological science based research is
developed which have connection to the
development master plan (RIP) of UNESA
year 2013 specifically the complete design
of campus infrastructure in Ketintang that
is in relation with campus drainage master
plan. Roadmap of the research by the title
of “the development of flood prevention
model in campus UNESA Ketintang” can
be seen in Figure 3.
Figure 3. Roadmap of the research
5. Technique Of Data Analysis
Data analysis is conducted by means
of mathematic or statistic calculation on
the data which obtained from agency,
observation and literature.
INTERNATIONAL CONFERENCE ADRI - 5
“Scientific Publications toward Global Competitive Higher Education”
144
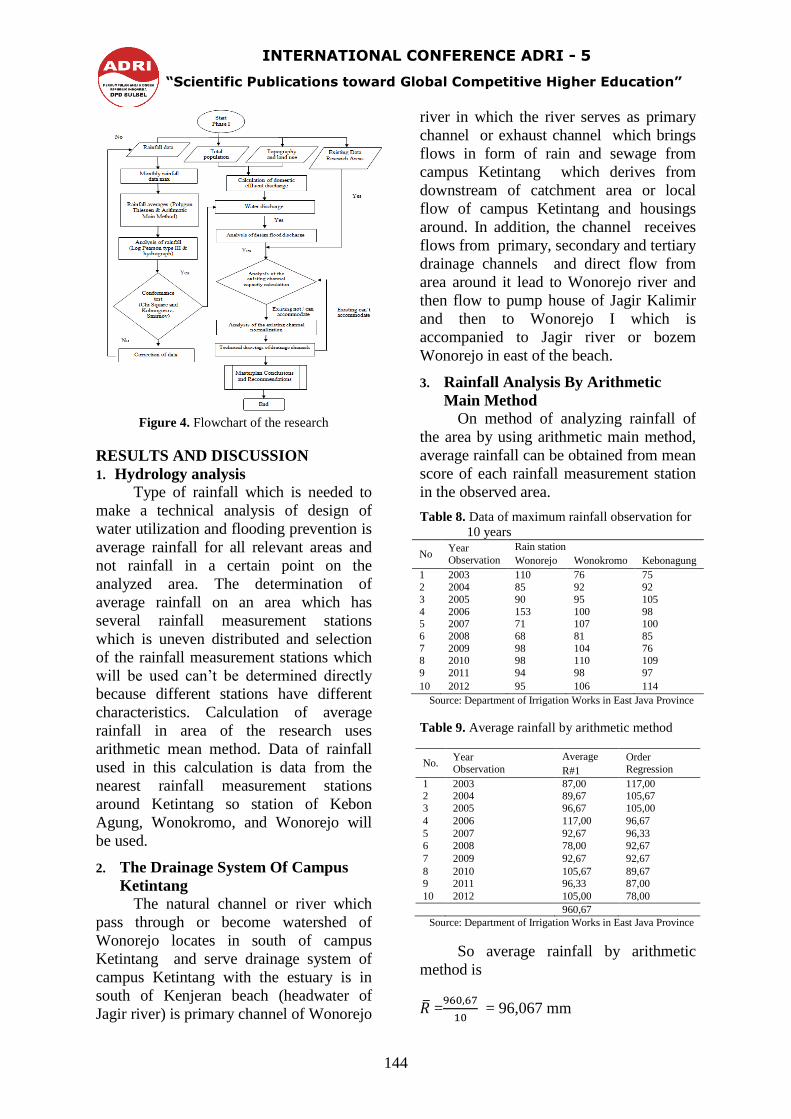
Figure 4. Flowchart of the research
RESULTS AND DISCUSSION
1. Hydrology analysis
Type of rainfall which is needed to
make a technical analysis of design of
water utilization and flooding prevention is
average rainfall for all relevant areas and
not rainfall in a certain point on the
analyzed area. The determination of
average rainfall on an area which has
several rainfall measurement stations
which is uneven distributed and selection
of the rainfall measurement stations which
will be used can’t be determined directly
because different stations have different
characteristics. Calculation of average
rainfall in area of the research uses
arithmetic mean method. Data of rainfall
used in this calculation is data from the
nearest rainfall measurement stations
around Ketintang so station of Kebon
Agung, Wonokromo, and Wonorejo will
be used.
2. The Drainage System Of Campus
Ketintang
The natural channel or river which
pass through or become watershed of
Wonorejo locates in south of campus
Ketintang and serve drainage system of
campus Ketintang with the estuary is in
south of Kenjeran beach (headwater of
Jagir river) is primary channel of Wonorejo
river in which the river serves as primary
channel or exhaust channel which brings
flows in form of rain and sewage from
campus Ketintang which derives from
downstream of catchment area or local
flow of campus Ketintang and housings
around. In addition, the channel receives
flows from primary, secondary and tertiary
drainage channels and direct flow from
area around it lead to Wonorejo river and
then flow to pump house of Jagir Kalimir
and then to Wonorejo I which is
accompanied to Jagir river or bozem
Wonorejo in east of the beach.
3. Rainfall Analysis By Arithmetic
Main Method
On method of analyzing rainfall of
the area by using arithmetic main method,
average rainfall can be obtained from mean
score of each rainfall measurement station
in the observed area.
Table 8. Data of maximum rainfall observation for
10 years
No Year Observation
Rain station
Wonorejo Wonokromo Kebonagung
1 2003 110 76 75
2 2004 85 92 92
3 2005 90 95 105
4 2006 153 100 98 5 2007 71 107 100
6 2008 68 81 85
7 2009 98 104 76 8 2010 98 110 109
9 2011 94 98 97
10 2012 95 106 114
Source: Department of Irrigation Works in East Java Province
Table 9. Average rainfall by arithmetic method
No. Year Observation
Average Order Regression R#1
1 2003 87,00 117,00 2 2004 89,67 105,67
3 2005 96,67 105,00
4 2006 117,00 96,67
5 2007 92,67 96,33
6 2008 78,00 92,67
7 2009 92,67 92,67
8 2010 105,67 89,67 9 2011 96,33 87,00
10 2012 105,00 78,00
960,67
Source: Department of Irrigation Works in East Java Province
So average rainfall by arithmetic
method is
=
= 96,067 mm
INTERNATIONAL CONFERENCE ADRI - 5
“Scientific Publications toward Global Competitive Higher Education”
145
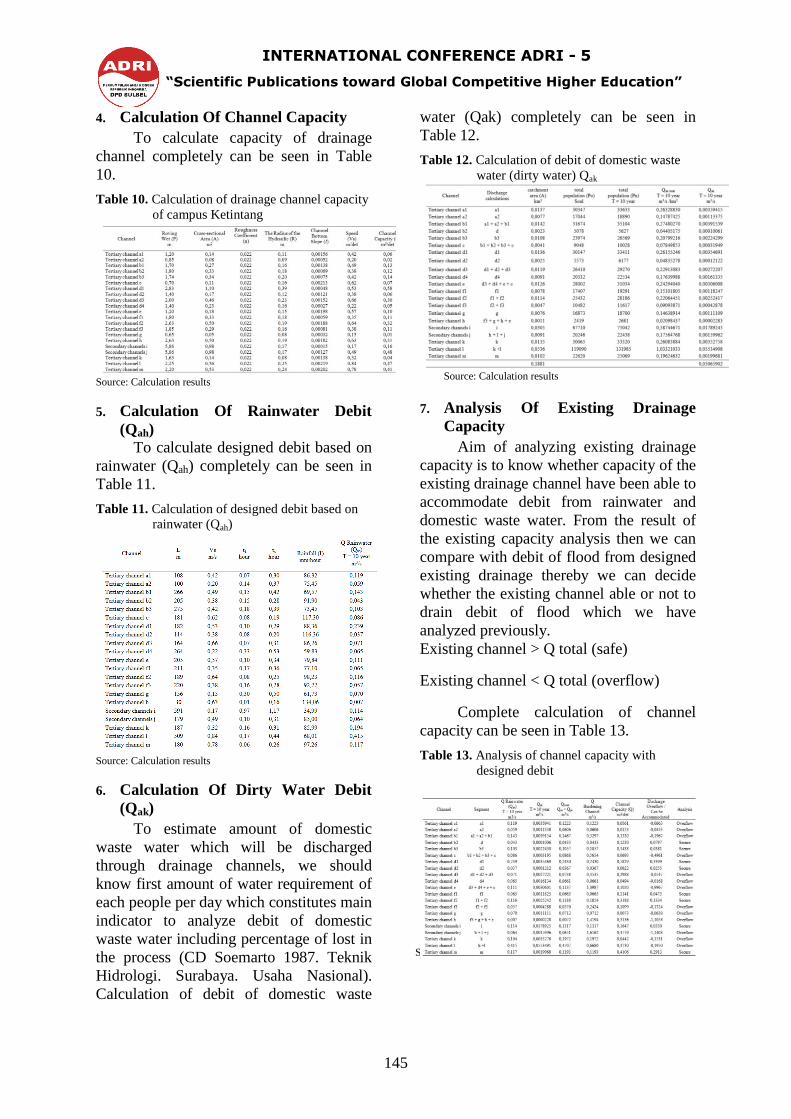
4. Calculation Of Channel Capacity
To calculate capacity of drainage
channel completely can be seen in Table
10.
Table 10. Calculation of drainage channel capacity
of campus Ketintang
Source: Calculation results
5. Calculation Of Rainwater Debit
(Qah)
To calculate designed debit based on
rainwater (Qah) completely can be seen in
Table 11.
Table 11. Calculation of designed debit based on
rainwater (Qah)
Source: Calculation results
6. Calculation Of Dirty Water Debit
(Qak)
To estimate amount of domestic
waste water which will be discharged
through drainage channels, we should
know first amount of water requirement of
each people per day which constitutes main
indicator to analyze debit of domestic
waste water including percentage of lost in
the process (CD Soemarto 1987. Teknik
Hidrologi. Surabaya. Usaha Nasional).
Calculation of debit of domestic waste
water (Qak) completely can be seen in
Table 12.
Table 12. Calculation of debit of domestic waste
water (dirty water) Qak
Source: Calculation results
7. Analysis Of Existing Drainage
Capacity
Aim of analyzing existing drainage
capacity is to know whether capacity of the
existing drainage channel have been able to
accommodate debit from rainwater and
domestic waste water. From the result of
the existing capacity analysis then we can
compare with debit of flood from designed
existing drainage thereby we can decide
whether the existing channel able or not to
drain debit of flood which we have
analyzed previously.
Existing channel > Q total (safe)
Existing channel < Q total (overflow)
Complete calculation of channel
capacity can be seen in Table 13.
Table 13. Analysis of channel capacity with
designed debit
Source: Calculation results
INTERNATIONAL CONFERENCE ADRI - 5
“Scientific Publications toward Global Competitive Higher Education”
146
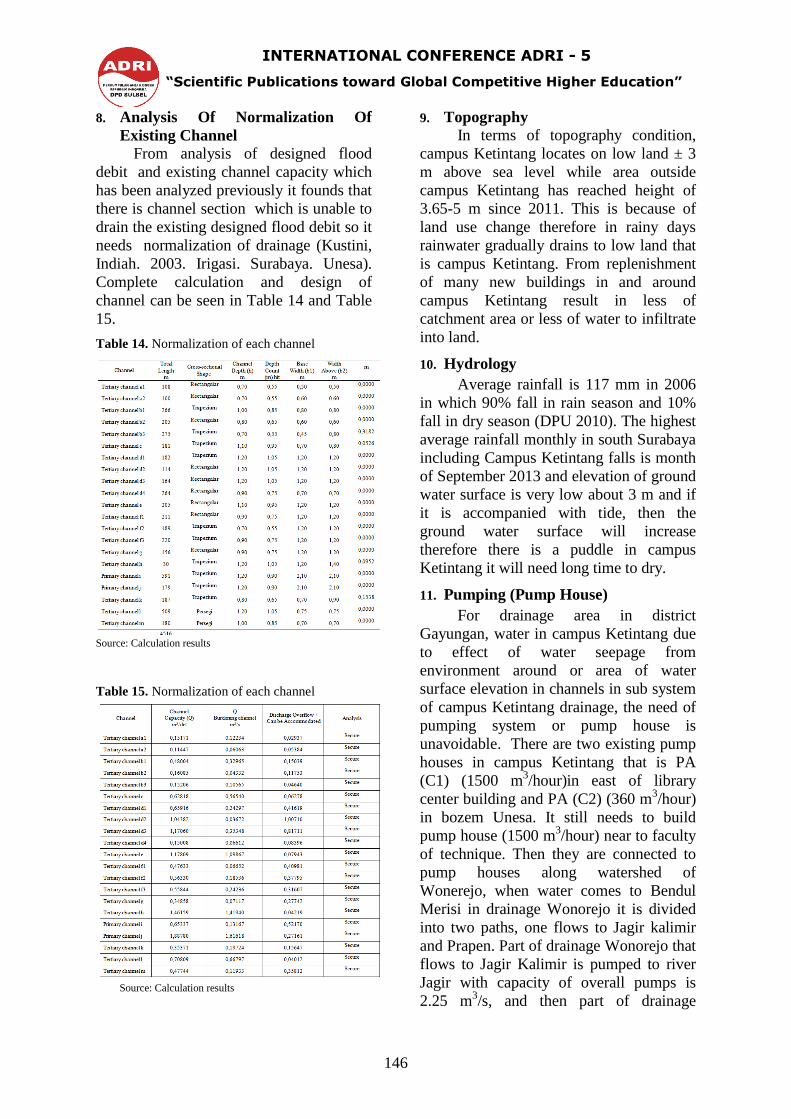
8. Analysis Of Normalization Of
Existing Channel
From analysis of designed flood
debit and existing channel capacity which
has been analyzed previously it founds that
there is channel section which is unable to
drain the existing designed flood debit so it
needs normalization of drainage (Kustini,
Indiah. 2003. Irigasi. Surabaya. Unesa).
Complete calculation and design of
channel can be seen in Table 14 and Table
15.
Table 14. Normalization of each channel
Source: Calculation results
Table 15. Normalization of each channel
Source: Calculation results
9. Topography
In terms of topography condition,
campus Ketintang locates on low land ± 3
m above sea level while area outside
campus Ketintang has reached height of
3.65-5 m since 2011. This is because of
land use change therefore in rainy days
rainwater gradually drains to low land that
is campus Ketintang. From replenishment
of many new buildings in and around
campus Ketintang result in less of
catchment area or less of water to infiltrate
into land.
10. Hydrology
Average rainfall is 117 mm in 2006
in which 90% fall in rain season and 10%
fall in dry season (DPU 2010). The highest
average rainfall monthly in south Surabaya
including Campus Ketintang falls is month
of September 2013 and elevation of ground
water surface is very low about 3 m and if
it is accompanied with tide, then the
ground water surface will increase
therefore there is a puddle in campus
Ketintang it will need long time to dry.
11. Pumping (Pump House)
For drainage area in district
Gayungan, water in campus Ketintang due
to effect of water seepage from
environment around or area of water
surface elevation in channels in sub system
of campus Ketintang drainage, the need of
pumping system or pump house is
unavoidable. There are two existing pump
houses in campus Ketintang that is PA
(C1) (1500 m3/hour)in east of library
center building and PA (C2) (360 m3/hour)
in bozem Unesa. It still needs to build
pump house (1500 m3/hour) near to faculty
of technique. Then they are connected to
pump houses along watershed of
Wonerejo, when water comes to Bendul
Merisi in drainage Wonorejo it is divided
into two paths, one flows to Jagir kalimir
and Prapen. Part of drainage Wonorejo that
flows to Jagir Kalimir is pumped to river
Jagir with capacity of overall pumps is
2.25 m3/s, and then part of drainage
INTERNATIONAL CONFERENCE ADRI - 5
“Scientific Publications toward Global Competitive Higher Education”
147
wonorejo that flows to east when comes to
Prapen some will be pumped to river Jagir
with capacity of overall pumps is 2.30 m3/s
and other will be continued to east to
Wonorejo. When water comes to Wonorejo
1 some will be pumped to river Jagir with
capacity of overall pumps is 8.9 m3/s and
other will be continued to Wonorejo 2.
When water comes to Wonorejo 2, some
will be pumped to river Jagir and other will
be continued to bozem Wonorejo. Then
after comes to bozem wonorejo, the water
will be pumped with capacity of overall
pumps is 6.25 m3/s to sea eastern Surabaya.
CONLUSION AND SUGGESTION
1. Conclusion
Based on discussion above, it can be
concluded as follows:
a. 13 of 21 channel segments in area of
the research have capacity that unable
to accommodate designed debit or Q
channel < Q designed while other
channels only need extra height of
preservation
b. other factors exist that able to
influence puddles in campus Ketintang
that is extra domestic waste
0.00023936 m3/s
c. paddy land hilling in east of faculty of
technique and rectorate that cause land
use change in area of campus
Ketintang in which previously it
gathers puddles in rainy days now to
be flat and unable to contains puddles
in rainy days.
d. there are several tertiary channels that
should be changed into secondary and
primary channels
2. Suggestion
Based on discussion above, there are
several suggestions that can be given to
design drainage in campus Ketintang for
the future as follows:
a. Dimension of drainage channels
should be designed by giving strong
point on burdens that each channel
segments have to bear
b. For the future, tertiary channels should
be designed to drain the water
smoothly into a greater channel that is
channel I (secondary channel
Ketintang)
c. For a certain period, conditions of the
existing channels should be reevaluated
to anticipate the possibility of puddles
and flooding due to the channels
shallow by sediment and land use
change.
d. The tertiary channels a2, b1, b2, f1 and
f2 should be changed into secondary
channels
e. The tertiary channels d1, d2, d3, i, and j
should be changed into primary
channels
f. Pump houses should be added in south
close to faculty of technique to
accelerate the reduction of puddles
when flooding comes
g. Extra bozem should be built in district
of Jambangan
BIBLIOGRAPHY
Anonymous. 2013. Implementation Guide
and Community Research in Higher
Education Edition IX. Jakarta:
Ministry of Education and Culture
BAPPEKO Surabaya. 2012. Surabaya
Surabaya Drainage Master Plan
2018. Surabaya: BAPPEKO
Fahmi, M Yusro. 2009. Flood Control
Primer Kebonagung duct upstream
section. Final unpublished.
Surabaya: ITS
Imam Subarkah.1978. Hydrology for
planning waterworks, Bandung; Idea
Dharma.
Kristiawan, Joseph. 2008. Analysis and
Countermeasures Puddle at the
crossroad National Institute of
Technology Malang. Unpublished
thesis. Malang: Universitas
Brawijaya
Kusnan. 2010. Fundamentals of
Hydrology and Urban Drainage.
Surabaya: Unesa
INTERNATIONAL CONFERENCE ADRI - 5
“Scientific Publications toward Global Competitive Higher Education”
148
Bambang, Triatmodjo. 2006. Applied
Hydrology. Yogyakarta: Beta Offset
Soemarto, CD. 1987. Hydrological
Engineering. Surabaya: National
Business
Soemarto, CD. 1995. Hydrological
Engineering. Jakarta: Erland
Sosrodarsono, Suyono and Kensaku
Takeda. 1993. Hydrology For
Irrigation. Jakarta: Pradnya Paramita
Sri Harto. Synthetic Unit Hydrograph
Gama-1. public Works Department
Suripin. 2003. Sustainable Urban
Drainage Systems. Yogyakarta: Andi
Offset
Ven Te Chow. 1985. Open Channel
Hydraulics. Jakarta: Erland


![AJPS 17:2 (2014), pp. 171-186] HEALING IN THE LOWLAND ... · religious practices among lowland Filipinos, this research can be broadly used throughout the lowland cultures. Since](https://img.pdfslide.us/doc/110x75/5e28aaca5b3b5737b60974b2/ajps-172-2014-pp-171-186-healing-in-the-lowland-religious-practices-among.jpg)