Embed Size (px)
Citation preview

Nature © Macmillan Publishers Ltd 1998
8
letters to nature
NATURE | VOL 394 | 9 JULY 1998 175
13. Zrzavy, J., Hypsa, V. & Vlaskova, M. in Arthropod Relationships (eds Fortey, R. A. & Thomas, R. H.)97–107 (Chapman & Hall, London, 1997).
14. Kraus, O. in Arthropod Relationships (eds Fortey, R. A. & Thomas, R. H.) 295–303 (Chapman & Hall,London, 1997).
15. Wheeler, W. C., Cartwright, P. & Hayashi, C. Y. Arthropod phylogeny: a combined approach.Cladistics 9, 1–39 (1993).
16. Ballard, J. W. et al. Evidence from 12S ribosomal RNA sequences that onychophorans are modifiedarthropods. Science 258, 1345–1348 (1992).
17. Friedrich, M. & Tautz, D. Ribosomal DNA phylogeny of the major extant arthropod classes and theevolution of myriapods. Nature 376, 165–167 (1995).
18. Wagele, J. W. & Stanjek, G. Arthropod phylogeny inferred from partial 12SrRNA revisited: monophylyof the Tracheata depends on sequence alignment. J. Zool. Syst. Evol. Res. 33, 75–80 (1995).
19. Wheeler, W. C. in Arthropod Fossils and Phylogeny (ed. Edgecombe, G. D.) 9–32 (Columbia Univ.Press, New York, 1998).
20. Manton, S. M. in Myriapod Biology (ed. Camatini, M.) 317–343 (Academic, London, 1979).21. Almond, J. E. Studies on Palaeozoic Arthropoda. Thesis, Univ. Cambridge (1986).22. Shear, W. A. & Selden, P. Eoarthropleura (Arthropoda, Arthropleurida) from the Silurian of Britain
and the Devonian of North America. Neues. Jb. Geol. Palaeontol. Abh. 196, 347–375 (1995).23. Schneider, J. Environment, biotas and taphonomy of the Lower Permian lacustrine Neiderhaslich
limestone, Dohlen Basin, Germany. Trans. R. Soc. Edinb. Earth Sci. 84, 453–464 (1994).24. McNamara, K. J. & Trewin, N. H. A euthycarcinoid arthropod from the Silurian of Western Australia.
Palaeontology 36, 319–335 (1993).25. Scotese, C. R. & McKerrow, W. S. in Palaeozoic Paleogeography and Biogeography (eds McKerrow, W. S.
& Scotese, C. R.) 1–21 (Geol. Soc. Lond., 1990).26. Li, Z.-X., Powell, C. M. & Trench, A. in Palaeozoic Vertebrate Biostratigraphy and Biogeography (ed.
Long, J. A.) 25–53 (Belhaven, London, 1993).
Acknowledgements. I thank K. S. W. Campbell and A. Ritchie for showing me the fossil sites; Z. Johanson,B. Loomes, Y.-y. Zhen and volunteers organized by M. Yeung for assistance in collecting fossils; and D. E.G. Briggs, J. A. Dunlop, W. A. Shear, and G. D. F. Wilson for comments. NSW State Forests permittedcollecting. A grant from Australian Geographic supported fieldwork.
Correspondence and requests for materials should be addressed to the author (e-mail: [email protected]).
Development of cooperativerelationships throughincreasing investmentGilbert Roberts* & Thomas N. Sherratt†
* Evolution and Behaviour Research Group, Department of Psychology,University of Newcastle upon Tyne, Newcastle upon Tyne NE1 7RU, UK† Department of Biological Sciences, University of Durham, South Road,Durham DH1 3LE, UK. . . . . . . . . . . . . . . . . . . . . . . . . . . . . . . . . . . . . . . . . . . . . . . . . . . . . . . . . . . . . . . . . . . . . . . . . . . . . . . . . . . . . . . . . . . . . . . . . . . . . . . . . . . . . . . . . . . . . . . . .
Reciprocal altruism1 can become established among selfish, unre-lated individuals if they use responsive strategies such as ‘tit-for-tat’2–4. This result raises the fundamental question: how altruisticshould one be? The problem is difficult to solve using current‘prisoner’s dilemma’ based models because they allow only thediscrete choice of cooperating or defecting. In reality, however,cooperation is rarely all-or-nothing. Furthermore, if cooperativeinvestment is variable, a new and more subtle kind of cheatingbecomes possible: individuals may invest slightly less than theirpartner. A concern is that this ‘short-changing’ will erode coop-erative ventures. Here we show that cooperation can thrive despitevariable investment through the new strategy of ‘raise-the-stakes’.This strategy offers a small amount on first meeting and then, ifmatched, raises its investment, something that no strategy in thediscrete model can do. We show that such behaviour can readilyinvade a population of non-altruists and cannot be effectivelyexploited. The practice of ‘testing the water’ rather than makingsudden cooperative ‘leaps of faith’ powerfully reinforces thestability and effectiveness of reciprocity.
How cooperative should one be? Using current theory2, thisquestion can be answered only in terms of the number of coopera-tive acts performed. But consider a typical reciprocal interactionamong guillemots (Uria aalge) preening each other. Allopreeningbouts vary from under a second to over a minute (G.R., M. P. Harrisand S. Wanless, unpublished observations). Conventionally, bothextremes are considered as cooperative events but cooperation isnot an ‘all-or-nothing’ behaviour among these allopreeners, orindeed in most instances of apparent reciprocity5–7. Once weallow variable investment, the possibility of a new and more
subtle kind of cheating arises because individuals may invest alittle less than their partner1. This is a potentially serious threat tocooperation, as such short-changing could gradually erode cooperation.Here we show for the first time, to our knowledge, that relationshipsinvolving increasing investment are robust in the face of cheats andsubtle cheats.
Earlier work recognizing that cooperation is not discrete has beenlimited to interpolating between possible outcomes in the prisoner’sdilemma (PD) payoff matrix8, which in itself represents the summedconsequence of the behaviours of two interacting individuals. Bydecomposing the PD payoff matrix, we can focus instead on eachindividual’s behaviour separately. Although, in common usage,‘defection’ often implies doing something positively harmful toanother party, in reciprocal altruism defection generally corre-sponds simply to doing nothing (for example, not grooming apartner9). Here, therefore, we consider only the costs and benefitsinvolved in altruistic acts. We introduce a scale of investment inaltruism, with each act resulting in a variable fitness cost to thealtruist of u units. Thus, an investment of zero corresponds todefection in the discrete model. We assume that the more an altruistinvests, the more a recipient benefits and that these benefits aregiven by ku. For reciprocal altruism to result in a net benefit to both,we require k . 1. Over a symmetrical course of interactions, thepayoffs sum to fit the defining inequalities of the PD: whereasreciprocity pays well, exploitation pays better; and whereas mutualfailure to cooperate pays poorly, being exploited pays worst of all.
First, we asked whether cooperation can develop in the presenceof cheats and subtle cheats. As in the conventional discrete PD, weconsider simple strategies that take into account a partner’s previousbehaviour, but in our continuous model these strategies canrespond quantitatively. As the potential range of strategies becomesenormous, we limit this range by considering strategies representa-tive of five possible responses: never investing, matching a partner’sinvestment, undercutting a partner, escalating investment, andcheating probabilistically. Our representative strategies (Table 1)are: ‘non-altruism’ (NA), which never invests but will acceptaltruism; ‘give-as-good-as-you-get’ (GGG), which matches whatits partner last invested; ‘short-changer’ (SC), which behavessimilarly to GGG but invests one less than the partner last invested;‘raise the stakes’ (RTS), which escalates its investment with partnersthat have matched or bettered its last move; ‘occasional short-changer’ (OSC), which behaves as RTS except that, with a certainprobability, it invests one less than pure RTS would; and ‘occasionalcheat’ (OC), which behaves as RTS but, with a certain probability,fails to invest at all. We confine consideration initially to thosealtruistic strategies that, like tit-for-tat, are ‘nice’2, investing one unitin altruism when they have no experience of a partner.
The success of the RTS strategy is illustrated through simulation(see Methods). Starting with an even mix of strategies, RTS spreadsto fixation (Fig. 1a). It also invades an environment of NA seededwith the other strategies (Fig. 1b), and resists invasion whenestablished (Fig. 1c). As in the discrete model2, the number ofopportunities for altruism limited the success of altruistic strategies.Nevertheless, beginning with two of each altruistic strategy andpopulation size ðNÞ ¼ 60, RTS spread to fixation in 100% ofsimulations by generations 13, 10, 9 and 9 for number of roundsðRÞ ¼ 5, 10, 20 and 100, respectively. These results are also robust tochanges in N. With R ¼ 20 and beginning with a population of NAseeded with two of each altruistic strategy, RTS spread to fixation in100% of simulations by generations 8, 8, 9 and 10 for N ¼ 12, 30, 60and 100, respectively.
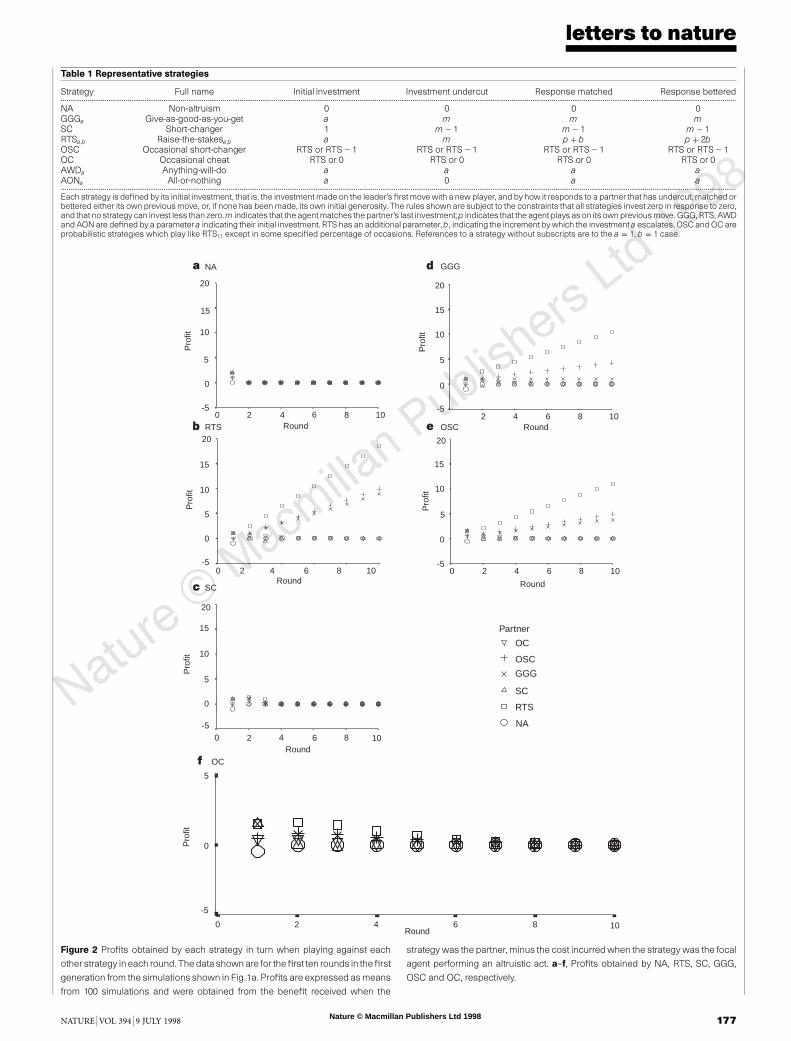
Why does RTS do so well? Like tit-for-tat in the discrete model,RTS is resistant to exploitation by other strategies while making themost of cooperative opportunities. RTS can accrue large scoreswhen playing against itself, scores that are not consistently obtain-able by non-altruistic or short-changing strategies (Fig. 2). Thepassivity of GGG means that although it can do well against RTS, it

Nature © Macmillan Publishers Ltd 1998
8
letters to nature
176 NATURE | VOL 394 | 9 JULY 1998
does poorly against itself. SC cannot exploit RTS because RTS willnot escalate its investment unless matched. The occasional cheatingof OSC means that it can exploit RTS to some extent, but it does lesswell against itself.
For ease of interpretation, we included only representative OCand OSC strategies that cheated on 50% of occasions in the abovesimulations. To determine whether lower levels of cheating are moresuccessful, we considered an environment in which all individualsplayed an OC strategy with cheating probabilities ranging from 1(equivalent to NA), through 0.5, 0.25, 0.1 and 0.05, to 0 (equivalentto pure RTS). Beginning with equal numbers of each strategy and
with N ¼ 60 and R ¼ 20, pure RTS emerged by generation 8 in100% of simulations. Using a corresponding approach, pure RTSemerged from a mix of OSC strategists by generation 46 in 100% ofsimulations. Thus, the stable probability of cheating is close to zero.
To what extent is the success of RTS due to it escalating such thatit can obtain many times its initial returns? Although investment inan activity such as grooming might escalate by a factor of 10 or even100, there are likely to be limits caused by the escalating costs ofaltruism and the diminishing returns to the recipient of furtheraltruism. We therefore repeated the set of simulations shown in Fig.1b but with imposed limits on investment. After 50 generations, andwith investment limited to 1, 2, 3, 5 and 10 units, RTS spread to 47,93, 97, 100 and 100% of the population, respectively. Thus, RTS stilltended to invade; however, with a limit of <3 units RTS came intoequilibrium with GGG, which is similar in strategy to RTS whenescalating investment is inhibited.
As in the discrete model, a single altruist cannot invade a non-altruistic population. However, we can determine the conditionsunder which RTSa,b (where a represents the initial investment and bindicates the increment by which the investment escalates) canspread in a population comprising x RTSa,b and y NA strategistswhen k . 1. If all players interact, then RTSa,b will thrive providedthat x . ðf þ yaÞ=ðf 2 kaÞ, where f ¼ Rðk 2 1Þð2bR þ 2a 2 bÞ. Asa typical numerical example, as few as 2 RTSa,b individuals caninvade a population of 100 NA individuals when k ¼ 1:5, R ¼ 10,a ¼ 1 and b ¼ 1. Thus, the more NA individuals there are the moreRTSa,b individuals are required before RTSa,b can invade, but as Rincreases, the limiting value of x required before RTSa,b can spread isx . 1. The signs of the partial derivatives with respect to a (con-sistently positive) and b (consistently negative) show that fewerRTSa,b individuals are needed to invade a population of NAindividuals if the RTSa,b strategists give as little as they can on firstmeeting (low a) and rapidly escalate if their altruism is reciprocated(high b).
The conditions required for RTS to resist invasion by raremutants can similarly be determined analytically. Using standardevolutionarily stable strategy (ESS) criteria10, we can show that aninfinitely large population of RTS1,1 individuals is stable withrespect to invasion by NA individuals when NA is initially rare,provided that Rðk 2 1Þð2bR þ 2a 2 bÞ . ka (for example, wherek > 1:2 and R > 2). We can also show that RTS2,1 is stable to SCwhere k . 1:2 and R > 2. We can also ask whether RTSa,b is resistantto invasion by initially more generous forms of RTS (defined byRTSg,b where g . a, but g , ða þ 2bÞ). As a less generous strategycan potentially gain by subtly cheating a more generous one, RTSa,b
will be an ESS if the rare invading variant is too generous,specifically when (g 2 aÞ . bðR þ kÞ=R.
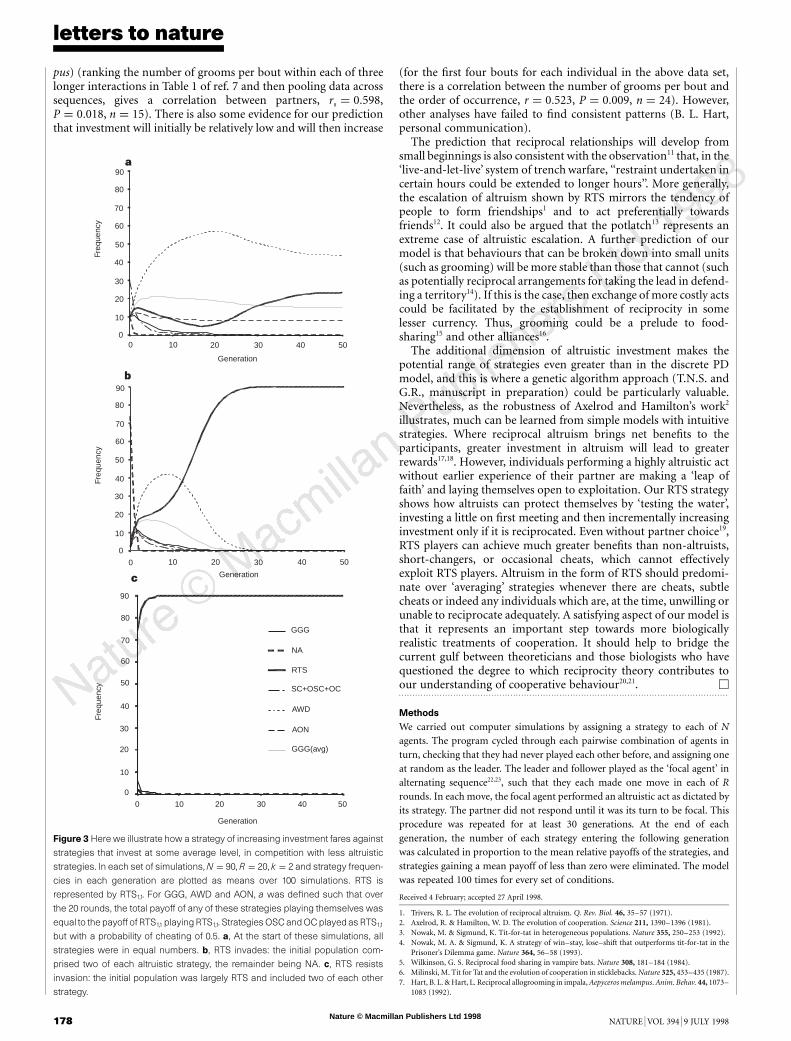
Is an escalatory strategy like RTS better than one that begins atsome intermediate level? To investigate this, we introduced three‘averaging’ strategies that, when playing against themselves over Rrounds, invest the same average amount r as RTS1,1 plays againstitself over the same R. The averaging strategies were ‘all-or-nothing’(AON), ‘anything-will-do’ (AWD) and a variant of GGG. Theyplay as defined in Table 1 with a ¼ r. As shown in Fig. 3a, in anenvironment containing a mix of strategies the outcome can be anequilibrium because the cooperative strategies are defined such thatthey do equally well against themselves and are not easily exploited.However, RTS does particularly well in invading an environmentdominated by non-altruistic strategies (Fig. 3b). This is consistentwith our earlier result that invasion of NA by RTS is facilitated bylower a. Once established, RTS again exhibits high resistance toexploitation (Fig. 3c), an observation that can be readily confirmedanalytically (for instance, RTS1,1 is guaranteed to be an ESS againstGGGg (where g . 1) if g . ð4k2 þ 4k 2 7Þ=½4ðk 2 1Þÿ).
Do animals behave as our model predicts? Some evidence for ourprediction that altruists should respond quantitatively to theirpartners comes from allogrooming in impala (Aepyceros melam-
Generation20151050
Freq
uenc
y
60
50
40
30
20
10
0
a
Generation
20151050
Freq
uenc
y
60
50
40
30
20
10
0
b
Generation20151050
Freq
uenc
y
60
50
40
30
20
10
0
c
GGG
NA
R TS
SC
O S C
OC
Figure 1 Here we illustrate how a strategy of increasing cooperative investment
fares in competition with less altruistic strategies. In each set of simulations,
N ¼ 60, R ¼ 20, k ¼ 2 and strategy frequencies in each generation are means
over 100 simulations. See Table 1 for strategy definitions. Each strategy except
NA had an initial investment of a ¼ 1 unit. RTS also had an increment of b ¼ 1.
Strategies OSC and OC played as RTS1,1 but with a probability of cheating of 0.5.
a–c, The success of the RTS strategy over 20 generations, starting from different
initial situations. a, All strategies were initially in equal numbers in this case. b,
RTS invades: the initial population comprised two of each altruistic strategy, the
remainder being NA. c, RTS resists invasion: the initial population was largely RTS
and included two of each other strategy.
Nature © Macmillan Publishers Ltd 1998
8
letters to nature
NATURE | VOL 394 | 9 JULY 1998 177
Table 1 Representative strategies
Strategy Full name Initial investment Investment undercut Response matched Response bettered...................................................................................................................................................................................................................................................................................................................................................................
NA Non-altruism 0 0 0 0GGGa Give-as-good-as-you-get a m m mSC Short-changer 1 m 2 1 m 2 1 m 2 1RTSa,b Raise-the-stakesa,b a m p þ b p þ 2bOSC Occasional short-changer RTS or RTS 2 1 RTS or RTS 2 1 RTS or RTS 2 1 RTS or RTS 2 1OC Occasional cheat RTS or 0 RTS or 0 RTS or 0 RTS or 0AWDa Anything-will-do a a a aAONa All-or-nothing a 0 a a...................................................................................................................................................................................................................................................................................................................................................................Each strategy is defined by its initial investment, that is, the investment made on the leader’s first move with a new player, and by how it responds to a partner that has undercut, matched orbettered either its own previous move, or, if none has been made, its own initial generosity. The rules shown are subject to the constraints that all strategies invest zero in response to zero,and that no strategy can invest less than zero. m indicates that the agent matches the partner’s last investment; p indicates that the agent plays as on its own previousmove. GGG, RTS,AWDand AON are defined by a parameter a indicating their initial investment. RTS has an additional parameter, b, indicating the increment by which the investment a escalates. OSC and OC areprobabilistic strategies which play like RTS1.1 except in some specified percentage of occasions. References to a strategy without subscripts are to the a ¼ 1, b ¼ 1 case.
Pro
fit
20
15
10
5
0
Pro
fit
20
15
10
5
0
Round1086420
-5
Round1086420
Pro
fit
20
15
10
5
0
-5
Round1086420
Pro
fit
20
15
10
5
0
-5
Round108642
-5
Round
1086420
Pro
fit
20
15
10
5
0
-5
a d
b
c
e
NA GGG
OSCRTS
SC
NA
Partner
OC
OSC
GGG
SC
RTS
Round100 8642
Pro
fit
5
0
-5
f OC
Figure 2 Profits obtained by each strategy in turn when playing against each
other strategy in each round. The data shown are for thefirst ten rounds in the first
generation from the simulations shown in Fig.1a. Profits are expressed as means
from 100 simulations and were obtained from the benefit received when the
strategy was the partner, minus the cost incurred when the strategy was the focal
agent performing an altruistic act. a–f, Profits obtained by NA, RTS, SC, GGG,
OSC and OC, respectively.
Nature © Macmillan Publishers Ltd 1998
8
letters to nature
178 NATURE | VOL 394 | 9 JULY 1998
pus) (ranking the number of grooms per bout within each of threelonger interactions in Table 1 of ref. 7 and then pooling data acrosssequences, gives a correlation between partners, rs ¼ 0:598,P ¼ 0:018, n ¼ 15). There is also some evidence for our predictionthat investment will initially be relatively low and will then increase
(for the first four bouts for each individual in the above data set,there is a correlation between the number of grooms per bout andthe order of occurrence, r ¼ 0:523, P ¼ 0:009, n ¼ 24). However,other analyses have failed to find consistent patterns (B. L. Hart,personal communication).
The prediction that reciprocal relationships will develop fromsmall beginnings is also consistent with the observation11 that, in the‘live-and-let-live’ system of trench warfare, ‘‘restraint undertaken incertain hours could be extended to longer hours’’. More generally,the escalation of altruism shown by RTS mirrors the tendency ofpeople to form friendships1 and to act preferentially towardsfriends12. It could also be argued that the potlatch13 represents anextreme case of altruistic escalation. A further prediction of ourmodel is that behaviours that can be broken down into small units(such as grooming) will be more stable than those that cannot (suchas potentially reciprocal arrangements for taking the lead in defend-ing a territory14). If this is the case, then exchange of more costly actscould be facilitated by the establishment of reciprocity in somelesser currency. Thus, grooming could be a prelude to food-sharing15 and other alliances16.
The additional dimension of altruistic investment makes thepotential range of strategies even greater than in the discrete PDmodel, and this is where a genetic algorithm approach (T.N.S. andG.R., manuscript in preparation) could be particularly valuable.Nevertheless, as the robustness of Axelrod and Hamilton’s work2
illustrates, much can be learned from simple models with intuitivestrategies. Where reciprocal altruism brings net benefits to theparticipants, greater investment in altruism will lead to greaterrewards17,18. However, individuals performing a highly altruistic actwithout earlier experience of their partner are making a ‘leap offaith’ and laying themselves open to exploitation. Our RTS strategyshows how altruists can protect themselves by ‘testing the water’,investing a little on first meeting and then incrementally increasinginvestment only if it is reciprocated. Even without partner choice19,RTS players can achieve much greater benefits than non-altruists,short-changers, or occasional cheats, which cannot effectivelyexploit RTS players. Altruism in the form of RTS should predomi-nate over ‘averaging’ strategies whenever there are cheats, subtlecheats or indeed any individuals which are, at the time, unwilling orunable to reciprocate adequately. A satisfying aspect of our model isthat it represents an important step towards more biologicallyrealistic treatments of cooperation. It should help to bridge thecurrent gulf between theoreticians and those biologists who havequestioned the degree to which reciprocity theory contributes toour understanding of cooperative behaviour20,21. M. . . . . . . . . . . . . . . . . . . . . . . . . . . . . . . . . . . . . . . . . . . . . . . . . . . . . . . . . . . . . . . . . . . . . . . . . . . . . . . . . . . . . . . . . . . . . . . . . . . . . . . . . . . . . . . . . . . . . . . . .
Methods
We carried out computer simulations by assigning a strategy to each of Nagents. The program cycled through each pairwise combination of agents inturn, checking that they had never played each other before, and assigning oneat random as the leader. The leader and follower played as the ‘focal agent’ inalternating sequence22,23, such that they each made one move in each of Rrounds. In each move, the focal agent performed an altruistic act as dictated byits strategy. The partner did not respond until it was its turn to be focal. Thisprocedure was repeated for at least 30 generations. At the end of eachgeneration, the number of each strategy entering the following generationwas calculated in proportion to the mean relative payoffs of the strategies, andstrategies gaining a mean payoff of less than zero were eliminated. The modelwas repeated 100 times for every set of conditions.
Received 4 February; accepted 27 April 1998.
1. Trivers, R. L. The evolution of reciprocal altruism. Q. Rev. Biol. 46, 35–57 (1971).2. Axelrod, R. & Hamilton, W. D. The evolution of cooperation. Science 211, 1390–1396 (1981).3. Nowak, M. & Sigmund, K. Tit-for-tat in heterogeneous populations. Nature 355, 250–253 (1992).4. Nowak, M. A. & Sigmund, K. A strategy of win–stay, lose–shift that outperforms tit-for-tat in the
Prisoner’s Dilemma game. Nature 364, 56–58 (1993).5. Wilkinson, G. S. Reciprocal food sharing in vampire bats. Nature 308, 181–184 (1984).6. Milinski, M. Tit for Tat and the evolution of cooperation in sticklebacks. Nature 325, 433–435 (1987).7. Hart, B. L. & Hart, L. Reciprocal allogrooming in impala, Aepyceros melampus. Anim. Behav. 44, 1073–
1083 (1992).
Generation
50403020100
Freq
uenc
y
90
80
70
60
50
40
30
20
10
0
Generation
50403020100
Freq
uenc
y
90
80
70
60
50
40
30
20
10
0
Generation
50403020100
Freq
uenc
y
90
80
70
60
50
40
30
20
10
0
GGG(avg)
GGG
NA
RTS
SC+OSC+OC
AWD
AON
a
b
c
Figure 3 Here we illustrate how a strategy of increasing investment fares against
strategies that invest at some average level, in competition with less altruistic
strategies. In each set of simulations, N ¼ 90, R ¼ 20, k ¼ 2 and strategy frequen-
cies in each generation are plotted as means over 100 simulations. RTS is
represented by RTS1,1. For GGG, AWD and AON, a was defined such that over
the 20 rounds, the total payoff of any of these strategies playing themselves was
equal to the payoff of RTS1,1 playingRTS1,1. Strategies OSC and OC playedas RTS1,1
but with a probability of cheating of 0.5. a, At the start of these simulations, all
strategies were in equal numbers. b, RTS invades: the initial population com-
prised two of each altruistic strategy, the remainder being NA. c, RTS resists
invasion: the initial population was largely RTS and included two of each other
strategy.
Nature © Macmillan Publishers Ltd 1998
8
letters to nature
NATURE | VOL 394 | 9 JULY 1998 179
8. Frean, M. R. The evolution of degrees of cooperation. J. Theor. Biol. 182, 549–559 (1996).9. Mesterton-Gibbons, M. On the iterated prisoner’s dilemma in a finite population. Bull. Math. Biol. 54,
423–443 (1992).10. Maynard Smith, J. Evolution and the Theory of Games (Cambridge Univ. Press, Cambridge, 1982).11. Axelrod, R. M. The Evolution of Cooperation (Basic Books, New York, 1984).12. Halpern, J. J. Elements of a script for friendship in transactions. J. Conflict Res. 41, 835–868 (1997).13. Benedict, R. Patterns of Culture (Routledge and Kegan Paul, London, 1935).14. Heinsohn, R. & Packer, C. Complex cooperative strategies in group-territorial African lions. Science
269, 1260–1263 (1995).15. de Waal, F. B. M. The chimpanzee’s service economy: food for grooming. Evol. Hum. Behav. 18, 375–
386 (1997).16. Seyfarth, R. M. & Cheney, D. L. Grooming alliances and reciprocal altruism in vervet monkeys. Nature
308, 541–543 (1984).17. Roberts, G. Competitive altruism: from reciprocity to the handicap principle. Proc. R. Soc. Lond. B
265, 427–431 (1998).18. Sherratt, T. N. & Roberts, G. The evolution of generosity and choosiness in co-operative exchanges. J.
Theor. Biol. (in the press).19. Peck, J. R. Friendship and the evolution of co-operation. J. Theor. Biol. 162, 195–228 (1993).20. Connor, R. C. Impala allogrooming and the parcelling model of reciprocity. Anim. Behav. 49, 528–530
(1995).21. Clements, R. & Stephens, D. C. Testing models of non-kin cooperation: mutualism and the Prisoner’s
Dilemma. Anim. Behav. 50, 527–535 (1995).22. Frean, M. R. The prisoner’s dilemma without synchrony. Proc. R. Soc. Lond. B 257, 75–79 (1994).23. Nowak, M. A. & Sigmund, K. The alternating Prisoner’s Dilemma. J. Theor. Biol. 168, 219–226 (1994).
Acknowledgements. We thank J. Lazarus, B. Charlton, R. Barton and M. Petrie for discussion andcomments. G.R. is supported by a Lord Adams Fellowship.
Correspondence and requests for materials should be addressed to G.R. (e-mail: [email protected]).
Visual synchronyaffectsbindingandsegmentationinperceptionMarius Usher & Nick Donnelly
Department of Psychology, University of Kent at Canterbury, Kent CP2 7NP, UK. . . . . . . . . . . . . . . . . . . . . . . . . . . . . . . . . . . . . . . . . . . . . . . . . . . . . . . . . . . . . . . . . . . . . . . . . . . . . . . . . . . . . . . . . . . . . . . . . . . . . . . . . . . . . . . . . . . . . . . . .
The visual system analyses information by decomposing complexobjects into simple components (visual features) that are widelydistributed across the cortex1,2. When several objects are presentsimultaneously in the visual field, a mechanism is required togroup (bind) together visual features that belong to each objectand to separate (segment) them from features of other objects. Anattractive scheme for binding visual features into a coherentpercept consists of synchronizing the activity of their neuralrepresentations3–6. If synchrony is important in binding, onewould expect that binding and segmentation are facilitated byvisual displays that are temporally manipulated to induce stimu-lus-dependent synchrony. Here we show that visual grouping isindeed facilitated when elements of one percept are presented atthe same time as each other and are temporally separated (on ascale below the integration time of the visual system7) fromelements of another percept or from background elements. Ourresults indicate that binding is due to a global mechanism ofgrouping caused by synchronous neural activation, and not to alocal mechanism of motion computation.
Despite compelling neurophysiological support for the syn-chrony-binding hypothesis from animal studies (for reviews seerefs 8, 9), the first psychophysical studies on humans that tested theeffects of temporal manipulations on visual binding did not providepositive results10–12. However, a new series of studies13–15 demon-strated that human subjects can perform texture discriminationwhen texture and background elements were spatially identical butpresented in a different temporal phase (that is, discrimination wasperformed on the basis of temporal information only). Althoughthis might be the first psychophysical confirmation of the use oftemporal synchrony for visual binding in humans, an alternativeexplanation needs to be ruled out. Texture discrimination can becomputed either on the basis of grouping (of the elements withineach texture separately) or on the basis of local gradients at textureboundaries16. In this case, one could argue that gradient computa-tions at boundaries generate a (possibly implicit) motion signal that
partially mediates the effect. To rule out such an explanation, weused two types of experiment that are different from texturediscrimination in an attempt to, first, engage global grouping andsegmentation processes but not local boundary computations,second, demonstrate the existence of a grouping mechanism thatis independent of the computation of motion (even if only implicit),and third, show that grouping by temporal asynchrony interactswith spatial information, thus excluding a statistical decision basedon two independent sources of information.
The first set of experiments tested grouping within a symmetricsquare lattice display (Fig. 1a), which is typically perceived as eitherrows or columns17,18. Three types of display were randomly pre-sented in a mixed design (Fig. 1a), and subjects were required toperform a forced choice about their perception of the lattice (rowsor columns). In condition one, all the elements were flashed on andoff together (synchronous trials); in condition two, at each succes-sive time cycle alternating rows of the lattice were flashed ontogether (asynchronous-row trials); in condition three, alternatingcolumns were flashed on together (asynchronous-column trials).The temporal asynchrony was 16 ms, which corresponds to a totaltime cycle of 32 ms. This asynchrony resulted in a perfectly steadylattice percept with no flicker or motion reported by subjects.
As expected, decisions in synchronous trials were evenly dividedbetween rows and columns (because of the symmetry of the squarelattice). However, during asynchronous displays the temporalstructure affected subjects’ perception. The probability of choosingrows or columns consistent with the temporal manipulation isshown in Fig. 1b, and is much larger than would be expected bychance (for one sample t½7ÿ ¼ 35:3, P , 0:001), although displaytimes were so short that eye movements could not be made and thetemporal asynchrony was much lower than that which can bedetected in temporal discrimination tasks using similar displays19.
A second interesting result is that the probability of correctdetection in asynchronous trials increased with contrast(Fð1; 7Þ ¼ 34:76, P , 0:01) but decreased with increasing displayduration (Fig. 1b; Fð2; 14Þ ¼ 6:84, P , 0:01). Although the effect ofdisplay duration is opposite to that predicted by Bloch’s law, it canbe explained by a simple model showing that short displays(resulting in transient activation) are more distinct than longerdisplays (which engage a steady activation pattern), as shown in Fig.1d. Finally, we found a strong trend towards better performancewhen using circles rather than crosses in the display (Fð1; 7Þ ¼ 5:3,P ¼ 0:055). This might indicate that the impact of stimulus-induced synchrony is larger when internally induced synchroniza-tion does not dominate; internal synchronization is likely to bestronger when using crosses than when using non-orientatedelements (circles) because of the lateral connections between cellswith similar orientation preference within the visual cortex20,21. Asimilar finding has been reported14 showing that the tendency tochoose a target based on temporal grouping is diminished when itspercept conflicts with another percept based on spatial grouping.
Although the subjects reported no motion in the lattice display,we attempted to rule out the possibility that these results are basedon an implicit motion computation (vertical oscillatory ‘motion’ ofrows and horizontal oscillatory ‘motion’ of columns). Anothergroup of subjects performed an experiment in which the samedisplays were used but in which the subjects were required to make a
Table 1 Stimulus–response matrix for the 3AFC task
Response R Response C Response S.............................................................................................................................................................................
Stimulus R 0.62 (0.07) 0.15 (0.04) 0.23 (0.04)Stimulus C 0.15 (0.04) 0.68 (0.07) 0.18 (0.04)Stimulus S 0.25 (0.04) 0.29 (0.05) 0.46 (0.07)Average 0.34 0.37 0.29.............................................................................................................................................................................Results are means 6 s:e:m: of response probabilities for eight subjects. The three stimuli, R(rows), C (columns) and S (synchronous), are shown in rows, and the three responses incolumns. The values are normalized to the fractions of responses generated for eachstimulus, and therefore the numbers in each row sum to unity.