Embed Size (px)
Citation preview

DEVELOPMENT OF CAST AND HEAT TREATED 7075 ALLOY RIFLE
RECEIVER
A THESIS SUBMITTED TO
THE GRADUATE SCHOOL OF NATURAL AND APPLIED SCIENCES
OF
MIDDLE EAST TECHNICAL UNIVERSITY
BY
AHMET UMUR GÜNGÖR
IN PARTIAL FULFILLMENT OF THE REQUIREMENTS
FOR
THE DEGREE OF MASTER OF SCIENCE
IN
METALLURGICAL AND MATERIALS ENGINEERING
MAY 2015

Approval of the thesis:
DEVELOPMENT OF CAST AND HEAT TREATED 7075 ALLOY RIFLE
RECEIVER
submitted by AHMET UMUR GÜNGÖR in partial fulfillment of the requirements
for the degree of Master of Science in Metallurgical and Materials Engineering
Department, Middle East Technical University by,
Prof. Dr. Gülbin Dural Ünver
Dean, Graduate School of Natural and Applied Sciences
Prof. Dr. Hakan Gür
Head of Department, Metallurgical and Materials Engineering
Prof. Dr. Ali Kalkanlı
Supervisor, Metallurgical and Materials Eng. Dept., METU
Examining Committee Members:
Prof. Dr. Bilgehan Ögel
Metallurgical and Materials Eng. Dept., METU
Prof.Dr. Ali Kalkanlı
Metallurgical and Materials Eng. Dept., METU
Prof. Dr. Rıza Gürbüz
Metallurgical and Materials Eng. Dept., METU
Prof.Dr. A. Tamer Özdemir
Metallurgical and Materials Eng. Dept., Gazi University
Asst. Prof. Dr. Mert Efe
Metallurgical and Materials Eng. Dept., METU
Date: 06.05.2015

iv
I hereby declare that all information in this document has been obtained and
presented in accordance with academic rules and ethical conduct. I also
declare that, as required by these rules and conduct, I have fully cited and
referenced all material and results that are not original to this work.
Name, Last name: AHMET UMUR GÜNGÖR
Signature:

v
ABSTRACT
DEVELOPMENT OF CAST AND HEAT TREATED 7075 ALLOY RIFLE
RECEIVER
Güngör, Ahmet Umur
M.S. Department of Metallurgical and Materials Engineering
Supervisor: Prof. Dr. Ali Kalkanlı
May 2015, 146 pages
Developing technology in the world makes products lighter and have higher
strength values. That’s why, aluminum and titanium alloys start to be used instead
of steel. It can be seen that 7075 aluminum alloy is one of the highest strength
amongst the aluminum alloys. This alloy has a close tensile strength value to some
steels, with help of the heat treatment applications and developing production
technologies. Generally, industrial usage of 7075 alloy is machining of 7075 alloy
extrusion slab into desired shape. However, it becomes costly and time wasting as
making complicated and hollow products. Therefore, near net shape methods like
thixoforming and squeeze casting are vital for these conditions.
This work aimed to replace production method of rifle receiver part which is
machined into a hollow structure from extruded T6 heat treated 7075 alloy slab
which cause heavy raw material lost with casted and T6 heat treated preform which
has close tensile properties and needs very little machining to turn into receiver part.
In order to achieve this purpose, squeeze casting, thixoforming, sand casting,
gravity die casting, SIMA and high pressure die casting experiments were
conducted.

vi
In order to investigate mechanical properties of samples, tensile and hardness tests
were performed. X-Ray Diffraction analysis (XRD) and Scanning Electron
Microscopy analysis (SEM) were conducted to determine the intermetallics inside
of samples after heat treatment. Moreover, average grain size of samples was
obtained by optical microscopy technique. Newtonian thermal analysis method was
used to compute solid fraction values with respect to temperature and time.
Target mechanical values were determined as mechanical properties of extruded
7075-T6 alloy which are 150 HB hardness, 505 MPa yield strength and 11%
elongation. Hardness target was reached after T6 heat treatment with squeeze
casting method as 150 HB, die casting with vacuum support method as 160 HB and
thixoforming method as 173 HB. Other methods could not reach the target hardness
and has hardness values between 100 HB and 130 HB. 505 MPa yield strength
target was achieved only by thixoforming method with 0.67 solid fraction as 526
MPa. Other close results were 429 MPa with squeeze casting method and 365 MPa
with SIMA method. Elongation target was reached by semi-solid injection molding
method as 11.5% but its other mechanical properties were poor. Elongation results
of other methods were found to be between 4% and 5%.
Keywords: 7075-T6, aluminum, thixoforming, squeeze casting.

vii
ÖZ
DÖKÜM VE ISIL ĠġLEMLĠ 7075 ALAġIMLI TÜFEK GÖVDESĠ
GELĠġTĠRĠLMESĠ
Güngör, Ahmet Umur
Yüksek Lisans, Metalurji ve Malzeme Mühendisliği Bölümü
Tez Yöneticisi: Prof. Dr. Ali Kalkanlı
Mayıs 2015, 146 sayfa
Dünyada geliĢen teknoloji ile beraber, üretilen ürünler artık daha hafif ve dayanıklı
olmaya baĢlamıĢtır. Bu sebeple alüminyum ve titanyum alaĢımları yavaĢ yavaĢ
çeliğin yerine kullanılmaya baĢlanmıĢtır. Alüminyum alaĢımları içinde ise dayanım
gücüyle 7075 alaĢımı dikkat çekmektedir. Bu alaĢım kullanılan üretim yöntemleri
ve ısıl iĢlemlerle birlikte bazı çeliklerin dayanım gücüne yaklaĢmıĢtır. Genellikle,
7075 alaĢımının endüstriyel kullanımı, 7075 ekstrüzyon kütüğünün talaĢ kaldırma
yöntemi ile istenilen haline getirilmesi Ģeklindedir. Fakat bu yöntem karmaĢık ve içi
boĢ ürünler yaparken zaman kaybına ve yüksek maliyete sebep olur. Bu sebeple, bu
gibi durumlar için tikso-Ģekillendirme ve sıkıĢtırma döküm gibi son hale yakın
biçimdeki üretim yöntemleri önem taĢımaktadır.
Bu çalıĢmanın amacı, ekstrüzyon 7075-T6 kütüğünden çok fazla hammadde kaybı
ile iĢlenen içi boĢ yapıya sahip tüfek gövde parçasının üretim yönteminin, son ürüne
yakın döküm yöntemi ile çok az iĢleme gerektiren, T6 ısıl iĢleme sahip bir ön Ģekil
değiĢtirilmesidir. Bu amaca ulaĢmak için, sıkıĢtırma döküm, kısmi katı
Ģekillendirme, kum döküm, kokil döküm, SIMA ve yüksek basınçlı döküm
yöntemleri denenmiĢtir.

viii
Numunelerin mekanik özelliklerini araĢtırmak için çekme testi ve sertlik testi
uygulanmıĢtır. Isıl iĢlem sonrasında, numune yapısındaki metallerarası bileĢiklerin
belirlenmesi için x ıĢını kırınım analizi (XRD) ve taramalı elektron mikroskobu
analizleri (SEM) yapılmıĢtır. Ayrıca, ortalama tane boyutları ise optik mikroskopi
yöntemi ile belirlenmiĢtir. Newtonian termal analiz yöntemi ise sıcaklığa ve zamana
bağlı katı fraksiyon değerlerini hesaplamakta kullanılmıĢtır.
Hedef mekanik değerler, ektrüzyon 7075-T6 alaĢımının mekanik değerleri olarak
belirlenmiĢtir. Bu değerler, 150 HB sertlik, 505 MPa akma dayancı ve %11
uzamadır. T6 ısıl iĢlemi sonrasında sertlik hedefine, 150 HB olarak sıkıĢtırma
döküm yönteminde, 160 HB olarak vakum destekli kokil döküm yönteminde ve 173
HB olarak tikso-Ģekillendirme yönteminde ulaĢılmıĢtır. Diğer yöntemler hedef
sertlik değerine ulaĢamayıp 100 HB ile 130 HB arasında değerlere sahiptirler. 505
MPa olan akma dayancı hedefine 526MPa olarak sadece 0.67 katı oranına sahip
tikso-Ģekillendirme yönteminde ulaĢılmıĢtır. Diğer yakın sonuçlar ise 429 MPa ile
sıkıĢtırma döküm yöntemi ve 365 MPa ile SIMA yöntemidir. Yüzde uzama
hedefine ise yarı-katı enjeksiyon döküm yönteminde ulaĢıldı fakat bu numunenin
diğer mekanik özellikleri düĢüktü. Diğer yöntemlerin yüzde uzama değerleri ise %4
ile %5 arasında bulunmuĢtur.
Anahtar kelimeler: 7075-T6, alüminyum, kısmi katı Ģekillendirme, sıkıĢtırma
döküm.

ix
To My Dear Family,

x
ACKNOWLEDGEMENTS
This thesis would not have been submitted without the help and contribution of
several individuals who provided their valuable supports.
Firstly, I would like to express my utmost gratitude to my supervisor dear Prof. Dr.
Ali KALKANLI for his guidance, support and tolerance.
I would like to thank to the technical staff of the Department of Metallurgical and
Materials Engineering, METU and especially Salih TÜRE, Cemal YANARDAĞ,
Önder ġAHĠN and Serkan YILMAZ for their contributions to this study.
This study was supported by SARSILMAZ SĠLAH SAN. A.ġ. I would like to thank
them for their belief in me and this study especially Mahmut Naci ĠNCĠ, Nuri
KIZILTAN and Öner ÖZYILMAZ. Also, many thanks to Furkan KELEġTĠMUR
for his friendship and hospitality in Düzce.
I would like to present my sincere thanks to my friends who make this study time
tolerable, Onur SAKA, Mehmet DĠNCER, Gülten KILIÇ, Seçkin ÇARDAKLI,
Tayfun DURMAZ and my other friends from department and also my roommates
for their invaluable helps, supports throughout the entire study.
I also would like to thank to my support, life energy and my fiancée Özlem SEVER
for her presence, tolerance, love and understanding. Life is much more beautiful
and tolerable with you.
Last but not least, I cannot thank enough to my dear parents, Ferhat GÜNGÖR and
Nesrin GÜNGÖR whose encouragement, support and presence provide all the
success that I have.
xi
TABLE OF CONTENTS
ABSTRACT ............................................................................................................... v
ÖZ............................................................................................................................. vii
ACKNOWLEDGEMENTS ....................................................................................... x
TABLE OF CONTENTS .......................................................................................... xi
LIST OF FIGURES ................................................................................................. xiv
LIST OF TABLES ................................................................................................... xx
CHAPTERS
1. INTRODUCTION ..................................................................................... 1
2. LITERATURE REVIEW .......................................................................... 3
2.1. 7xxx Series Aluminum Alloy .......................................................... 3
2.1.1. 7075 Aluminum Alloy ............................................................. 4
2.1.2. 7085 Aluminum Alloy ............................................................. 5
2.2. Heat Treatment ................................................................................ 7
2.2.1. Precipitation Heat Treatment ................................................. 10
2.3. Thermal Analysis .......................................................................... 15
2.3.1. Solid Fraction Calculation ...................................................... 18
2.4. Production Methods ...................................................................... 19
2.4.1. Semi-Solid Metal Casting ...................................................... 19
2.4.2. Squeeze Casting ..................................................................... 31
2.4.3. Gravity Die Casting ................................................................ 37
2.4.4. Vacuum Assisted Gravity Die Casting .................................. 38

xii
2.4.5. Sand Casting ........................................................................... 38
2.4.6. Grain Refinement in Aluminum Alloys ................................. 40
3. EXPERIMENTAL PROCEDURE ...................................................... 43
3.1. Squeeze Casting ............................................................................ 43
3.2. Vacuum Assisted Gravity Die Casting .......................................... 45
3.3. Gravity Die Casting ....................................................................... 48
3.4. Sand Casting .................................................................................. 48
3.5. Vertical Semi Solid Metal Casting ................................................ 50
3.6. Vertical Squeeze Casting .............................................................. 52
3.7. Semi-Solid Metal Casting ............................................................. 53
3.8..Strain Induced Melt Activation (SIMA) Process for……..
……………...Thixocasting .................................................................................. 55
3.9. Thermal Analysis and Solid Fraction Calculations ....................... 57
3.10. Characterization .......................................................................... 62
3.10.1. Mechanical Testing .............................................................. 62
3.10.2. Metallography ...................................................................... 63
3.10.3. Optical Microscopy .............................................................. 64
3.10.4. Scanning Electron Microscopy (SEM) ................................ 65
3.10.5. X-Ray Diffraction (XRD) .................................................... 66
3.10.6. Optical Emission Spectrometer Analysis ............................. 66
4. RESULTS AND DISCUSSION .......................................................... 67
4.1. Squeeze Casting Experiment ......................................................... 67
4.2. Gravity Die Casting Experiment ................................................... 70
4.3. Vacuum Assisted Gravity Die Casting Experiment ...................... 71
4.4. Sand Casting Experiment with/without Al5TiB Additive ............. 73

xiii
4.5. X-Ray Diffraction (XRD) Results of Casting Experiments .......... 78
4.6. Thermal Analysis and Solid Fraction Calculations ....................... 82
4.6.1. Extrusion Billet of 7075 Aluminum Alloy at 0.25oC/s……
………………...Cooling Rate .......................................................................... 83
4.6.2. Modified 7075-1 Aluminum Alloy at 0.04oC/s Cooling…...
…………………Rate....................................................................................... 85
4.6.3. Modified 7075-1 Aluminum Alloy 0.25oC/s Cooling Rate ... 87
4.6.4. Modified 7075-2 Aluminum Alloy 0.38oC/s Cooling Rate ... 89
4.7. Semi-Solid Casting with Vertical Pressure Die Casting ............... 92
4.8. Pressure Die Casting ..................................................................... 96
4.9. Semi-Solid Metal Casting ............................................................. 97
4.10. Strain Induced Melt Activation (SIMA) ................................... 100
5. CONCLUSIONS ................................................................................ 105
6. SUGGESTED FUTURE WORKS..................................................... 107
REFERENCES ....................................................................................................... 109
APPENDICES
A. TENSILE TEST ANALYSIS ........................................................... 115
B. GRAIN SIZE ANALYSIS ................................................................ 131
C. MATHLAB ALGORITHM .............................................................. 141

xiv
LIST OF FIGURES
FIGURES:
Figure 1. Al- Mg-Zn Ternary Phase Diagram (Liquidus projection is on the left and
solidus projection is on the right.). ............................................................................. 4
Figure 2. Time-temperature-property curves at 95% of maximum tensile stress for
various alloys. ........................................................................................................... 13
Figure 3. Effects of temperature on the natural aging. ............................................. 14
Figure 4. Yield-strength curves for alloy 7075. ....................................................... 14
Figure 5. Zero curve (baseline) differences between Newtonian method and Fourier
method of an A356 Al alloy (Al-7%Si). .................................................................. 18
Figure 6. Comparison of Newtonian and Fourier methods on solid fraction for A356
alloy with cooling rate of 0.55 °C/s.......................................................................... 19
Figure 7. Cooling curves comparison of thixocasting, rheocasting and conventional
casting processes. Microstructure comparison of thixocasting, rheocasting and
conventional casting processes. ................................................................................ 21
Figure 8. Schematic illustration of the thixo and rheo casting methods. ................. 23
Figure 9. Schematic of SIMA (a) and RAP (b) processes. ...................................... 25
Figure 10. Schematic illustration of the NRC rheocasting process (UBE). ............. 27
Figure 11. Schematic illustration of the cooling slope casting process. .................. 28
Figure 12. Schematic illustration of the advanced semisolid casting technology
rheocasting process developed by Honda. ............................................................... 29
Figure 13. Schematic illustration of the semisolid rheocasting (SSR) process. ....... 30
Figure 14. Schematic illustration of direct squeeze die casting. .............................. 33
Figure 15. Schematic illustration of indirect squeeze casting. ................................. 34
Figure 16. Vertical squeeze casting machine used in experiments. ......................... 44

xv
Figure 17. Squeeze cast 7075 alloy discs. First, second and third from left to right.
.................................................................................................................................. 44
Figure 18. Squeeze cast 7085 alloy discs. ................................................................ 45
Figure 19. Muffle furnace used for heat treatment in experiments. ......................... 45
Figure 20. Vacuum assisted gravity die casting experiment setup. 1. Sprue, 2.
Horizontal copper die mold, 3. Vacuum hose-die mold connecter part, 4. Vacuum
hose........................................................................................................................... 47
Figure 21. Polished and heat treated vacuum assisted gravity die cast sample. ...... 47
Figure 22. Sample that was used for testing in gravity die casting experiment. ...... 48
Figure 23. 7075 aluminum alloy casting after shake out of sand. ............................ 49
Figure 24. Die mold and working principle of vertical squeeze casting press that is
used during semi solid experiments in the Foundry laboratory at METU. .............. 50
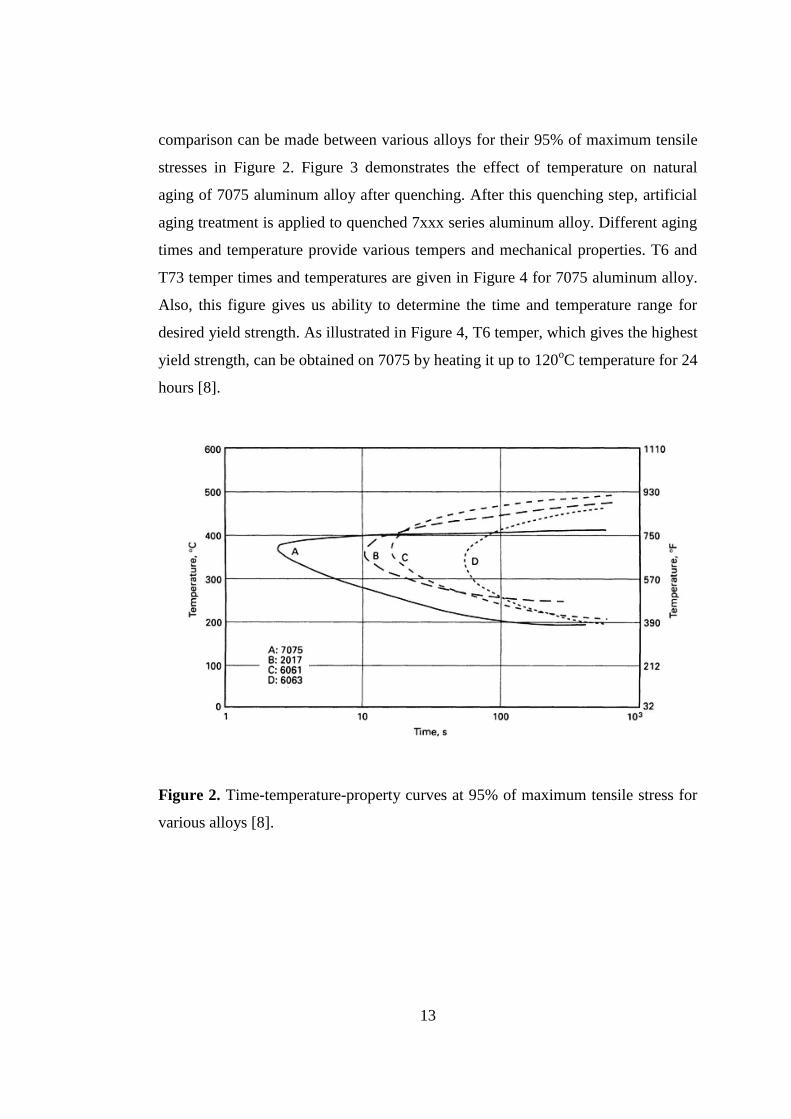
Figure 25. A prepared sample of extruded 7075 alloy. ............................................ 51
Figure 26. Produced disks after T6 heat treatment................................................... 51
Figure 27. Burst drawing of the mold that produces hollow shaped parts. .............. 52
Figure 28. Produced hollow shaped parts after T6 heat treatment. .......................... 53
Figure 29. The high pressure die casting (HPDC) machine used in semi-solid metal
casting....................................................................................................................... 54
Figure 30. The die that can produce tensile and bending test specimens. ................ 54
Figure 31. Cylindrical shaped alloy billets produced (left: ultrasonic stirring, right:
mechanical stirring). ................................................................................................. 56
Figure 32. Cooling curve of 7075 alloy with 0.04oC/s cooling rate with respect to
time. .......................................................................................................................... 58
Figure 33. First derivative of 7075 alloy cooling curve with 0.04oC/s cooling rate
with respect to time. ................................................................................................. 59
Figure 34. Polynomial fits in several degrees for zero curve drawing. .................... 59
Figure 35. The area between the first derivative and the zero curve is represented as
colored. ..................................................................................................................... 60
Figure 36. After integration of the area between the first derivative and the zero
curve, solid fraction with respect to temperature graph can be obtained. ................ 60

xvi
Figure 37. Data acquisition setup of the thermal analysis and solid fraction
calculations experiment and the graphite crucible that was used in experiments (1.
Thermocouple, 2. Graphite Crucible, 3. Thermal Blanket, 4. Molten alloy). .......... 61
Figure 38. Mares tensile test machine setup. ........................................................... 62
Figure 39. Instron 5582 Tensile test machine. ......................................................... 63
Figure 40. Metacut-M 250 Cut-Off Machine. .......................................................... 64
Figure 41. SOIF XJP - 6A Optical Microscope. ...................................................... 65
Figure 42. Foundry Master UV Vacuum CCD optical emission spectrometer. ...... 66
Figure 43. Microstructure of squeeze casting experiment specimen having 37
micron average grain size (100x). ............................................................................ 69
Figure 44. SEM image of squeeze casting experiment specimen (100x). ............... 69
Figure 45. Microstructure of gravity die casting experiment specimen with 41
micron average grain size (100x). ............................................................................ 70
Figure 46. SEM image of gravity die casting experiment specimen (100x). ........... 71
Figure 47. Microstructure of vacuum assisted gravity die casting experiment
specimen having 38 micron average grain size (100x). ........................................... 72
Figure 48. SEM image of vacuum assisted gravity die casting experiment specimen
(100x). ...................................................................................................................... 72
Figure 49. Microstructure of sand cast specimen having 98 micron average grain
size (100x). ............................................................................................................... 74
Figure 50. SEM image of sand cast specimen (100x). ............................................. 74
Figure 51. Microstructure of sand cast alloy with Al5TiB addition, specimen having
74 micron average grain size (100x). ....................................................................... 76
Figure 52. Microstructure of sand cast with Al5TiB addition, specimen SEM
analysis (100x). ........................................................................................................ 76
Figure 53. XRD results of casting for Al with indicated planes. ............................. 79
Figure 54. XRD results of casting for Al0.403Zn0.597 with indicated planes. ............. 79
Figure 55. XRD results of casting for MgZn2 with indicated planes. ...................... 80
Figure 56. XRD results of casting for Al2CuMg with indicated planes. .................. 80
Figure 57. XRD results of casting for Mg32(Al, Zn)49 with indicated planes. ......... 81
Figure 58. XRD results of casting for Fe3Si with indicated planes. ......................... 81

xvii
Figure 59. XRD results of casting for FeV with indicated planes. .......................... 82
Figure 60. Temperature vs. time graph of Extrusion billet of 7075 aluminum alloy
at 0.25oC/s cooling rate. ........................................................................................... 83
Figure 61. First derivative 𝒅𝑻
𝒅𝒕 𝒄𝒄
vs. time graph of Extrusion billet of 7075
aluminum alloy at 0.25oC/s cooling rate. ................................................................. 84
Figure 62. Solid fraction vs. temperature and time graph of Extrusion billet of 7075
aluminum alloy at 0.25oC/s cooling rate. ................................................................. 84
Figure 63. Temperature vs. time graph of modified 7075-1 aluminum alloy with
0.04oC/s cooling rate. ............................................................................................... 85
Figure 64. First derivative 𝒅𝑻
𝒅𝒕 𝒄𝒄
vs. time graph of modified 7075-1 aluminum
alloy with 0.04oC/s cooling rate ............................................................................... 86
Figure 65. Solid fraction (%) vs. temperature graph of modified 7075-1 aluminum
alloy with 0.04oC/s cooling rate. .............................................................................. 86
Figure 66. Temperature vs. time graph of modified 7075-1 aluminum alloy with
0.25oC/s cooling rate. ............................................................................................... 87
Figure 67. First derivative 𝒅𝑻
𝒅𝒕 𝒄𝒄
vs. time graph of modified 7075-1 aluminum
alloy with 0.25oC/s cooling rate. .............................................................................. 88
Figure 68. Solid fraction (%) vs. temperature graph of modified 7075-1 aluminum
alloy with 0.25oC/s cooling rate ............................................................................... 88
Figure 69. Temperature vs. time graph of modified 7075-2 aluminum alloy with
0.38oC/s cooling rate. ............................................................................................... 89
Figure 70. First derivative 𝒅𝑻
𝒅𝒕 𝒄𝒄
vs. time graph of modified 7075-2 aluminum
alloy with 0.38oC/s cooling rate. .............................................................................. 90
Figure 71. Solid fraction vs. temperature graph of modified 7075-2 aluminum alloy
with 0.38oC/s cooling rate. ....................................................................................... 90
Figure 72. SEM picture of semi-solid casting specimen 1 at 580oC. ....................... 94
Figure 73. SEM picture of semi-solid casting specimen 2 at 595oC. ....................... 94
Figure 74. SEM picture of semi-solid casting specimen 3 at 605oC with 100x
magnification. ........................................................................................................... 95

xviii
Figure 75. SEM picture of semi-solid casting specimen 3 at 605oC with 500x
magnification. ........................................................................................................... 95
Figure 76. Pore density vs. solid fraction graph of modified 7075-2 alloy produced
by semi solid metal casting. ..................................................................................... 99
Figure 77. UTS vs. solid fraction graph of modified 7075-2 alloy produced by semi
solid metal casting. ................................................................................................... 99
Figure 78. Microstructure image of ultrasonic stirred specimen (100x) ................ 101
Figure 79. Microstructure image of mechanical stirred specimen (100x). ............ 102
Figure 80. SEM image of mechanical stirred specimen (100x). ............................ 102
Figure 81. SEM image of mechanical stirred specimen (100x). ............................ 103
Figure 82. SEM image of mechanical stirred specimen (750x). ............................ 103
Figure 83. Designed suggested vertical die. ........................................................... 107
Figure A.1. Tensile test results of squeeze casting experiment. ............................ 115
Figure A.2. Tensile test results of mechanical stirred SIMA sample. .................... 116
Figure A.3. Tensile test results of ultrasonic stirred SIMA sample. ...................... 116
Figure A.4. Tensile test results of semi-solid forming with vertical pressure die
casting samples (Specimen 2: 1st test sample, specimen 3: 2
nd test sample, specimen
4: 3rd
test sample and specimen 1 is a failed sample.). ........................................... 117
Figure A.5. Tensile test result of sand casting specimen. ...................................... 118
Figure A.6. Tensile test result of sand casting with Al5TiB additive specimen. ... 119
Figure A.7. Tensile test result of vacuum assisted gravity die casting experiment
specimen. ................................................................................................................ 120
Figure A.8. Tensile test results of gravity die casting experiment specimen. ........ 121
Figure A.9. Tensile test results of semi-solid injection molding experiment 1st of
extr. 7075 specimen. ............................................................................................... 122
Figure A.10. Tensile test results of semi-solid injection molding experiment 2nd
of
extr. 7075 specimen. ............................................................................................... 123
Figure A.11. Tensile test results of semi-solid injection molding experiment 6th
of
mod. 7075 specimen. .............................................................................................. 124
Figure A.12. Tensile test results of semi-solid injection molding experiment 1st of
mod. 7075 specimen. .............................................................................................. 125

xix
Figure A.13. Tensile test results of semi-solid injection molding experiment 2nd of
mod. 7075 specimen. .............................................................................................. 126
Figure A.14. Tensile test results of semi-solid injection molding experiment 3rd of
mod. 7075 specimen. .............................................................................................. 127
Figure A.15. Tensile test results of semi-solid injection molding experiment 4th of
mod. 7075 specimen. .............................................................................................. 128
Figure A.16. Tensile test results of semi-solid injection molding experiment 5th of
mod. 7075 specimen. .............................................................................................. 129
Figure B.1. Grain size analysis of squeeze casting sample. ................................... 131
Figure B.2. Grain size analysis of vacuum assisted die casting sample................. 132
Figure B.3. Grain size analysis of gravity die casting sample. .............................. 134
Figure B.4. Grain size analysis of sand casting sample. ........................................ 135
Figure B.5. Grain size analysis of sand casting with Al5TiB additive sample. ..... 136
Figure B.6. Grain size analysis of mechanical stirred SIMA sample. ................... 138
Figure B.7. Grain size analysis of ultrasonic stirred SIMA sample. ...................... 139

xx
LIST OF TABLES
TABLES
Table 1. Chemical Composition of 7075 aluminum alloy. ........................................ 5
Table 2. Mechanical properties of 7075 aluminum alloy with respect to various heat
treatments. .................................................................................................................. 5
Table 3. Chemical composition of 7085 aluminum alloy. ......................................... 6
Table 4. Mechanical properties of 7085 aluminum alloy with respect to various heat
treatments. .................................................................................................................. 6
Table 5. Soaking Time for Solution Heat Treatment of All Wrought Products. ..... 15
Table 6. Feasibility table of thixocasting, rheocasting and conventional casting
processes. (4. Excellent, 3. Good, 2. Somewhat Poor, 1. Poor) ............................... 22
Table 7. The chemical compositions of extruded and modified 7075 alloys
produced. .................................................................................................................. 55
Table 8. Experimental parameters of ultrasonic and mechanical stirring. ............... 57
Table 9. Hardness values of 2nd squeeze cast sample. ............................................ 68
Table 10. Hardness values of gravity die cast samples. ........................................... 71
Table 11. Hardness values of vacuum assisted gravity die casting experiment. ...... 73
Table 12. Hardness values of sand casting without Al5TiB additive experiment. ... 75
Table 13. Hardness values of sand casting with Al5TiB addition. ........................... 77
Table 14. Hardness and average grain size comparison of all casting experiments
performed in this study. ............................................................................................ 77
Table 15. Literature comparison of chemical compositions of the alloys used at
thermal analysis experiments. .................................................................................. 91
Table 16. Literature comparison of thermal data obtained during thermal analysis
experiments. ............................................................................................................. 92
Table 17. The process data of semi-solid casting with vertical squeeze casting. .... 93

xxi
Table 18. Comparison between values of reduction rates, hardness values and
second phase densities. ............................................................................................. 93
Table 19. Comparison of chemical compositions of alloys produced during pressure
die casting experiments. ........................................................................................... 96
Table 20. Hardness values of pressure die cast samples. ......................................... 97
Table 21. Ultimate tensile strength, elongation at break, pouring temperature and
solid fraction values. ................................................................................................ 98
Table 22. Tensile test results of SIMA experiment. ............................................... 101


1
CHAPTER 1
INTRODUCTION
Aluminum cannot be found in nature as a metal due to its high chemical affinity for
oxygen. That’s why, it can be found in oxide forms with various purity degrees.
Aluminum is the second most abundant metallic element in crust of earth with 8%
weight. Furthermore, aluminum has various mechanical and chemical properties.
Such as; low density (2.7 g/cm3) with respect to other popular metals (Steel: 7.83
g/cm3 and copper: 8.93 g/cm
3), high age-hardening potential, corrosion resistance,
weldability and fabrication [1, 2, 3].
Aluminum usage at industrial applications is increasing day by day. Aluminum gets
attention because of its low density values and adequate mechanical properties for
many industrial applications. 7075 is one of the aluminum alloys that have relatively
higher mechanical properties than other aluminum alloys. Extruded 7075-T6 gives
higher mechanical properties for 7075 aluminum alloy than other alternative
production methods like casting or forging. In production of some complicated parts,
extruded 7075-T6 is machined into final shape. If the complicated parts have a hollow
shape or need too much machining, this production costs higher prices. Furthermore,
it is lost of time and lost of raw materials. That’s why, several production methods are
tried over years in order to get same mechanical properties with extruded 7075-T6
aluminum alloy. However, since 7075 aluminum alloy is designed for wrought
processes, desired mechanical properties cannot be achieved with other production
methods [1, 2, 3].

2
Receiver part of some rifles is made from extruded 7075-T6 aluminum alloy for its
durability and lightweight. During its manufacture process, machining and other
methods are used. After manufacturing process is completed, it can be seen that
nearly 75% of raw material is lost due to the receiver’s hollow shape.
Receiver part is the main part of the rifle. It is the part that holds trigger mechanism,
stock and barrel. Most rifle receivers have a hollow shape for inserting trigger
mechanism. It contains an ejection port which is practically a window for ejecting
empty shells on the right side of it. Also, there are rifle types that have an ejection
port on the left side for left handed people [4].
Considering the information given, this study is aimed to minimize the loss of raw
material during machining. To achieve this goal, mechanical properties of 7075
aluminum alloy with several production methods are investigated. Some of these
methods are; thixoforming, pressure die casting, sand casting and permanent mold
casting.
3
CHAPTER 2
LITERATURE REVIEW
2.1. 7xxx Series Aluminum Alloy
7xxx series aluminum alloys are known as having zinc as their main alloying
element. Magnesium and copper can also be found in these alloys as other main
alloying elements. This alloying group provides high strength to this light-weight
alloy. 7xxx series are also heat-treatable by solution treatment and aging. Aging
process can be done for various cycles. For example, T6 is done for achieving the
maximum strength and T73 is for high stress corrosion resistance. For both
instances, alloy must go through solution treatment which dissolves intermetallics
or segregated phases into solid solution completely [1].
7xxx series aluminum alloys have dissimilar liquidus and solidus temperatures
considering their chemical composition differences. That’s why, ternary and binary
phase diagrams are used to acquire liquidus and solidus temperatures for required
alloy. Al – Mg - Zn ternary phase diagram can be taken as advantage of determining
liquidus and solidus temperatures. Liquidus projection of Al-Mg-Zn ternary phase
diagram and solidus projection of Al-Mg-Zn ternary phase diagram is shown on
Figure 1 [1].

4
Figure 1. Al- Mg-Zn Ternary Phase Diagram (Liquidus projection is on the left and
solidus projection is on the right.) [1].
2.1.1. 7075 Aluminum Alloy
This alloy is a member of 7xxx series aluminum alloy family. It was developed by
Sumitomo in 1936 for using in Japanese Fighter Planes. As ISO designation, it can
be called as Al Zn5.5MgCu and A97075 for UNS designation. It has 5.1% – 6.1%
zinc, 2.1% - 2.9% magnesium, 1.2% - 2.0% copper as main alloying elements.
Chemical composition of 7075 aluminum alloy is given on Table 1. It has relatively
higher UTS values with respect to other aluminum alloys. 7075 aluminum alloy
may have 570MPa UTS values and 505MPa yield strength after T6 heat treatment
[5] Different heat treatments provide various mechanical and chemical properties to
7075 aluminum alloy. Mechanical properties of 7075 aluminum alloy with respect
to various heat treatments are given in Table 2 [5].

5
Table 1. Chemical Composition of 7075 aluminum alloy [5].
Si Fe Cu Mn Mg Cr Zn Ti
Unspecified
other
elements
Al
minimum
each total
0.40
max
0.50
max
1.2-
2.0
0.30
max
2.1-
2.9
0.18-
0.28
5.1-
6.1
0.20
max
0.05
max
0.15
max Bal.
Table 2. Mechanical properties of 7075 aluminum alloy with respect to various heat
treatments [5].
Temper UTS (MPa) YS (MPa) EL (%) HB
7075-O 230 105 17 60
7075-T6, T651 570 505 11 150
7075-T73,
T7351 503 434 13 -
Liquidus temperature and solidus temperature can be determined for 7075
aluminum alloy as 635oC and 477
oC, respectively by using Al-Mg-Zn ternary phase
diagram (Figure 1). This is also verified by literature [5].
2.1.2. 7085 Aluminum Alloy
This alloy is also a member of 7xxx series aluminum alloy family. 7085 Aluminum
Alloy was developed by Alcoa in 2002. This alloy is developed for the aerospace
industry and other markets due to the demand of an aluminum alloy with improved
thick section properties. It has 7.0% – 8.0% zinc, 1.2% - 1.8% magnesium, 1.3% -

6
2.0% copper as main alloying elements. Chemical composition of 7085 aluminum
alloy is given in Table 3. It has similar mechanical properties with 7075 aluminum
alloy except for little differences. However, it has improved fatigue and fracture
toughness properties. This alloy is designated and commercialized as plate, sheet
and extrusion with various heat treatments. Mechanical properties of 7085
aluminum alloy with respect to various heat treatments are given in Table 4 [6, 7].
Table 3. Chemical composition of 7085 aluminum alloy [6].
Si Fe Cu Mn Mg Cr Zn Zr Ti
Unspecified
other elements
Al
mini
mum each total
0.06
max
0.08
max
1.3-
2.0
0.04
max
1.2-
1.8
0.04
max
7.0-
8.0
0.08-
0.15
0.06
max
0.05
max
0.15
max Bal.
Table 4. Mechanical properties of 7085 aluminum alloy with respect to various heat
treatments [7].
Temper Product Thickness(mm) UTS(MPa) YS(MPa) EL(%)
7085-
T711
Plate
12.5-40.0 550 510 10
7085-
T721 12.5-40.0 470 415 10
7085-
T7451 75-100 505 470 10
Liquidus temperature and solidus temperature is given for 7085 aluminum alloy as
635oC and 552
oC, respectively [7]. It is also proved with the help of Al-Mg-Zn
ternary phase diagram (Figure 1).

7
2.2. Heat Treatment
Heat treating is an operation to a metal product with heating and cooling the
material so that, its mechanical properties, residual stress state and metallurgical
structure can be modified and improved. Heat treatment operations are various and
these operations are very broad in the sense of material treatment. However,
aluminum heat treatment operations are often limited to hardening and increasing
strength for precipate hardenable wrought and cast alloys. These types of aluminum
alloys are called as heat-treatable alloys. Other type of aluminum alloys are called
as non-heat treatable alloys due to their inability to advance in mechanical
properties with heating and cooling. Non-heat treatable aluminum alloys make little
difference when subjected to “heat treatment”. These alloys can enhance their
mechanical properties with other methods like cold working [1, 8].
Temper designation is a system that is used for heat-treatable aluminum alloys. It is
used for wrought and cast products. This system is used for determine the sequence
of the treatment which can be mechanical treatment, thermal treatment or both at
the same time. This temper designation system allows us to have information about
the heat treatment parameters such as time, temperature and quenching rate that is
applied on alloy. Some basic temper designations are as follows [2, 8];
F, as-fabricated: It defines the alloy have not been heat treated.
O, annealed: It defines the wrought product is annealed to obtain lowest
strength or the cast product is annealed to increase ductility.
W, solution heat treated: It defines the alloy is unstable and naturally ages
after solution treatment.
H, strain hardened: It defines the wrought product has been strain hardened
with or without additional thermal treatment.
T, heat treated to produce stable tempers other than O: It defines the alloy
that has been thermally treated to obtain stability with or without strain
hardening [2, 8].
8
Strain hardened products system:
H1, strain-hardened only: This defines that the product has been strain
hardened without thermal treatment to obtain desired strength. The
following digit indicates rate of strain hardening.
H2, strain-hardened and partially annealed: This defines that the product has
been strain hardened more than enough then annealed for decreasing
strength to a desired value. The following digit indicates the remaining
strain hardening.
H3, strain-hardened and stabilized: This defines that the product has been
strain hardened then mechanical properties of alloy has been stabilized with
low temperature thermal treatment. This designation is applied to alloys that
soften with time at room temperature. The following digit indicates
remaining strain hardening [8].
T temper designation is used for heat treated alloys to produce stable tempers other
than W, F and O. T temper designation is followed by a digit that describes the
sequence of treatments. The T temper designations are:
T1, cooled from an elevated-temperature shaping process and naturally aged
to substantially stable condition: This defines that the product is not cold
worked after high temperature shaping process like casting and extrusion.
T2, cooled from an elevated-temperature shaping process, cold worked, and
naturally aged to a substantially stable condition: This designation defines
that product is cold worked than naturally aged at room temperature.
T3, solution heat treated, cold worked, and naturally aged to a substantially
stable condition: This defines the product is solution heat treated then cold
worked and naturally aged at room temperature.
T4, solution heat treated and naturally aged to a substantially stable
condition: This defines that the product is applied solution heat treatment
then naturally aged at room temperature.

9
T5, cooled from an elevated-temperature shaping process and artificially
aged: This defines that the product is not cold worked after an elevated
temperature shaping process that mechanical properties are improved by
precipitation heat treatment.
T6, solution heat treated and artificially aged: This defines that the product
is applied solution heat treatment quenched and artificially aged.
T7, solution heat treated and over-aged or stabilized: This defines the
wrought product has been over aged to obtain properties like resistance to
stress corrosion crack.
T8, solution heat treated, cold worked, and artificially aged: This defines
that the product is solution heat treated then cold worked to obtain improved
strength. After that, this product is artificially aged.
T9, solution heat treated, artificially aged, and cold worked: This explains
that product is cold worked after precipitation heat treatment.
T10, cooled from an elevated-temperature shaping process, cold worked,
and artificially aged: This pertains that the product is cold worked after a
process like casting and extrusion. Then, product is artificially aged [1, 2, 8].
These temper designations are basic temper designations. On the other hand, some
other designations are made to fulfill the need for specific heat treatments for other
than just strengthening like stress relieving. These temper designations are briefly;
Tx51, stretched for stress relieving.
Tx52, compressed for stress relieving.
Tx54, stretched and compressed for stress relieving.
T62, solution heat treated and artificially aged from the O or the F temper
[1, 5, 8].

10
2.2.1. Precipitation Heat Treatment
Alloying is a need for strengthening aluminum, since it has very low mechanical
properties. Most of the aluminum alloys are created due to developing an alloy with
desired mechanical properties. While doing this, most of the inventers considered
alloys with particles which impede dislocation motion dispersed in ductile
aluminum matrix. If the dispersion is finer, the alloy is stronger [1, 2, 8].
This kind of dispersion can be obtained by selecting an alloy which is single phase
at high temperatures but, cooling it will precipitate another phase in the matrix. If
hardening is occurred in this precipitation, it is called precipitation hardening or age
hardening [2, 8].
The major precipitate hardening aluminum alloys are:
Al-Cu systems are strengthening from CuAl2.
Al-Cu-Mg systems (precipitation is intensified by magnesium).
Al-Mg-Si systems are strengthening from Mg2Si.
Al-Zn-Mg systems are strengthening from MgZn2.
Al-Zn-Mg-Cu systems [8].
Precipitation strengthening of a super-saturated solid solution needs formation of
finely dispersed precipitates by natural aging or artificial aging. The aging must
take place below a metastable miscibility gap called the Guinier-Preston (GP)
zones. The super saturation of vacancies let zone formation faster than equilibrium
diffusion coefficients due to diffusion [8].
Firstly, solute atoms form clusters near vacancies. Coherent precipitates forms after
adequate atoms diffused into these vacancies. Solute clusters are surrounded by a
strain field due to the mismatch of the solute atoms clusters to the aluminum matrix.
Semi-coherent precipitates are formed after an amount of solute atoms diffusion to

11
the clusters that the matrix can no longer hold. Finally, equilibrium precipitates are
formed after semi-coherent precipitates get larger to enough size and the matrix can
no longer accommodate the crystallographic mismatch. This is the explanation of
precipitation in the most common heat treatable aluminum alloys [2].
2.2.1.1. Al-Zn-Mg-Cu Alloys
As precipitation sequences, there are four sequences in 7xxx series aluminum
alloys. The sequences can be seen below [2]:
1. αsss to S
2. αsss to T’ to T
3. αsss to VRC to GPZ to η’ to η
4. αsss to η
First precipitation sequence indicates the formation of S phase which is Al2CuMg.
This phase is precipitated from supersaturated solid solution directly. This phase is
a course inter-metallic which is insoluble in 7xxx alloys at 465oC [2].
Second sequence shows the T phase formation. T’ phase is an intermediate phase
that occurs in the decomposition of the supersaturated solid solution. Latter, T’
phase transforms into the equilibrium T phase which can be called as Mg32(Al,
Zn)49. Also, T phase is incoherent with the aluminum matrix and generally, T phase
only precipitates above 200oC [2].
Third sequence consists of vacancy rich cluster formation, Guinier-Preston Zones
formation, η’ formation and then η formation with respectively. η’ phase is formed
prior to η formation which is MgZn2. Furthermore, GP zones are in sphere form and
MgZn2 is in plate form for this series [9].

12
Final sequence indicates formation of η directly from supersaturated solid solution
[1, 2, 8].
GP zones precipitation and semi-coherent η’ phase makes 7XXX alloys stronger.
Furthermore, η’ precipitates can be formed from existing GP zones which is a
unique precipitation behavior of Al-Zn-Mg alloys. Also, deformation does not
affect precipitation behavior of this alloy when applied before aging. GP zones can
be seen at higher temperatures. Due to copper existence in GP zones, 7XXX alloys
have improved stability when compared to Al-Zn-Mg alloys. However, copper do
not affect the basic precipitation mechanism on these alloys [10].
This precipitation hardening provides 7xxx series aluminum alloys increase in
hardness and improved mechanical properties. Table 2 shows the effects of heat
treatment on mechanical properties of 7075 aluminum alloy.
Solution heat treatment is a must for precipitation hardening for 7xxx series
aluminum alloys. To obtain a good solution treatment, alloy must be heated over
465oC for dissociation of Al2CuMg phase and other phases into solid solution. Also,
usage of 480oC for solution heat treatment is recommended by ASTM [11]. Alloy
should be soaked into this temperature for an enough time for complete formation
of super saturated solid solution. On Table 5, solution treatment times for various
thicknesses are given. After achieving super saturated solid solution, alloy must be
quenched with adequate cooling rate. This quenching procedure is the vital part of
having meta-stable super saturated solid solution at room temperature. Otherwise,
heat treatment does not provide expected mechanical properties to the alloy. Since
precipitates will be formed and super saturated solid solution cannot be obtained.
Quenching rate is mentioned as 300oC/s which is a relatively higher than most of
other aluminum alloys [8]. Quenched 7xxx series aluminum alloys like 7075 starts
aging at room temperature spontaneously. That’s why, precipitation heat treatment
should be applied to 7xxx series aluminum alloys in less than an hour on room
temperature and less than 3 hours for low temperatures after quenching [1, 2, 8]. A
13
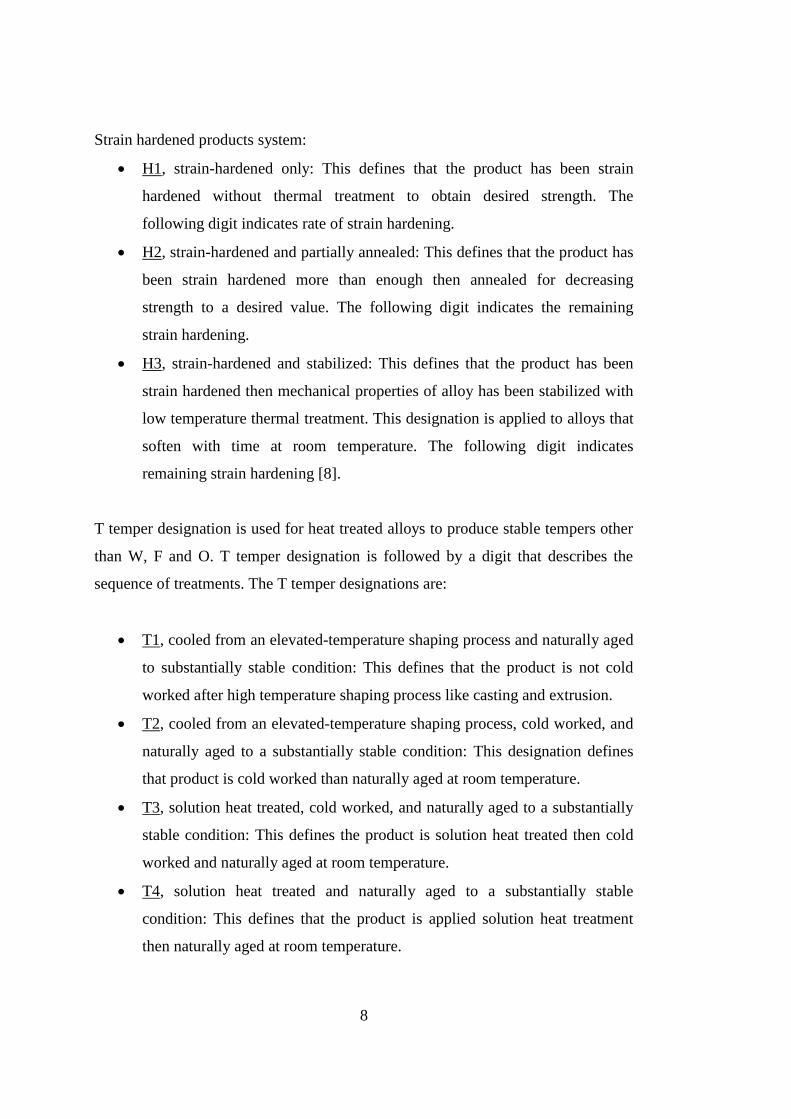
comparison can be made between various alloys for their 95% of maximum tensile
stresses in Figure 2. Figure 3 demonstrates the effect of temperature on natural
aging of 7075 aluminum alloy after quenching. After this quenching step, artificial
aging treatment is applied to quenched 7xxx series aluminum alloy. Different aging
times and temperature provide various tempers and mechanical properties. T6 and
T73 temper times and temperatures are given in Figure 4 for 7075 aluminum alloy.
Also, this figure gives us ability to determine the time and temperature range for
desired yield strength. As illustrated in Figure 4, T6 temper, which gives the highest
yield strength, can be obtained on 7075 by heating it up to 120oC temperature for 24
hours [8].
Figure 2. Time-temperature-property curves at 95% of maximum tensile stress for
various alloys [8].

14
Figure 3. Effects of temperature on the natural aging [8].
Figure 4. Yield-strength curves for alloy 7075 [8].

15
Table 5. Soaking Time for Solution Heat Treatment of All Wrought Products [2].
2.3. Thermal Analysis
Thermal analysis has broad usage in steel and foundry industries. It is used to
control the quality of products that is made in those industries. Cooling curves are
used in constructing early phase diagrams. On the other hand, relatively new
methods, like differential thermal analysis and thermodynamic calculations,
removed the undercooling effect in many phase diagrams. For example, liquidus
temperatures were 20°C lower by thermal analysis than by differential scanning
calorimetry (DSC) [12].
DSC identifies melting points and latent heat more accurate than cooling curve
analysis for metals and alloys. DSC basically determines the heat amount that is
absorbed or evolved by heating, cooling or keeping at a temperature from a
material. However, DSC can only analyze very small samples which are mostly

16
recommended up to 10mg. That’s why, it is not suitable to use in foundry shops [12,
13].
A suitable candidate is cooling curve analysis (CCA) which is simple and feasible
for commercial applications. This method is a consistent method which was used in
past for generating phase diagrams. Although, CCA can be done in several ways,
computer aided cooling curve analysis (CA CCA) has widespread usage for
metallurgical purposes. This technique enables us to obtain total latent heat and
fraction solid for multi-component alloys from the cooling curve [12].
In this method, determination of zero curve (or baseline) is vital. Zero curve is the
first derivative of the cooling curve with assumption of no phase transformation
during solidification within the temperature range. As simple, it is the extension of
the single phase region’s first derivative [12].
There are two common methods for cooling curve analysis. First one is Newtonian
method which creates zero curve with assumption of there is no thermal gradient
and need a single thermocouple. Second one is Fourier method that creates zero
curve as function of temperature and need two thermocouples [14].
Zero curve can be obtained by a curve fitting tool with a relevant software in
Newtonian method. For this purpose, phase transformation zones must be excluded
from the first derivative of cooling curve for drawing a polynomial line from one
single-phase region to other single-phase region which starts at solidus and ends at
liquidus points.
Newtonian method requires a thermocouple placed at the geometrical center of the
cooling material. This method assumes there is no thermal gradient. Also, if Biot
number (Bi) is less than 0.1 for a metal-mold system, this assumption is valid. D.
Adrian describes the Biot number as “the Biot number is a dimensionless group that
compares the relative transport resistances, external and internal.”

17
𝐵𝑖 =ℎ𝑡
𝑘
Where h is heat transfer coefficient, t is thickness and k is thermal conductivity.
“It arises when formulating and non-dimensionalizing the boundary conditions for
the typical conservation of species/energy equation for heat/mass transfer
problems” [15]. If the Biot number is smaller than 0.1, it means that heat
conduction is faster in cooling metal than the metal-mold interface. As a
consequence, temperature gradients may be neglected [14].
Fourier method requires two thermocouples that one of them on the geometrical
center of the sample and the other one is near the metal-mold interface. Zero curve
is generated by analyzing the data from two thermocouples and including them in
Fourier equations that calculates the zero curve. Zero curve is a function of
temperature in Fourier method [14].
Different zero curves can be obtained from Fourier and Newtonian methods.
However, Fourier method is expected to provide more reliable result since, it uses
actual temperature field. Figure 5 shows the difference between the zero curve of
Newtonian method and zero curve of Fourier method for A356 Al alloy [12].

18
Figure 5. Zero curve (baseline) differences between Newtonian method and Fourier
method of an A356 Al alloy (Al-7%Si) [16].
2.3.1. Solid Fraction Calculation
Solid fraction is an essential information for processes that operates at semi-solid
temperatures like thixoforming. Solid fraction can be calculated from integration of
the area which is between first derivative of cooling curve and zero curve
(baseline). Newtonian method can be used to calculate the solid fraction easily, due
to unnecessity of thermal properties during calculation. Comparison of Newtonian
and Fourier methods on solid fraction values can be seen in Figure 6 which shows
that there are some differences especially between the Al-Si eutectic temperature
and liquidus temperature. Other parts of the figure have little difference which can
be neglected [12].

19
Figure 6. Comparison of Newtonian and Fourier methods on solid fraction for
A356 alloy with cooling rate of 0.55 °C/s [16].
2.4. Production Methods
2.4.1. Semi-Solid Metal Casting
Massachusetts Institute of Technology is the one that first discover the semi-solid
processing in 1971 [17]. After this important discovery, rheocasting and
thixocasting process routes are introduced [18]. Nowadays, these processes and
other processes related with semi-solid processing are known as Semi-solid metal
(SSM) casting. There are three basic requirements for SSM casting which are:
A grain structure with nondentritic or spherical,
Solid-liquid region,
Suitable solid fraction.

20
The SSM processing developed around obtaining a globular structure as alloy in
semi-solid form. There are three main process routes which are:
Thixocasting: This process consists of three stages. First one is to
preparation of a solid feedstock with globular structure. Latter one is the
heating the solid feedstock and then shaping [17]. This process can be seen
schematically in Figure 7 and Figure 8.
Rheocasting: Liquid metal is cooled under controlled conditions to obtain
globular structure and shaping take place immediately in this process [17].
Figure 7 and Figure 8 illustrate rheoforming method schematically.
Thixomolding: Magnesium alloy flakes are sheared and heated before
injection to a mold with a plastic injection molding machine in this process
[17].

21
Figure 7. Cooling curves comparison of thixocasting, rheocasting and conventional
casting processes. Microstructure comparison of thixocasting, rheocasting and
conventional casting processes [19].

22
Table 6. Feasibility table of thixocasting, rheocasting and conventional casting
processes [19]. (4. Excellent, 3. Good, 2. Somewhat Poor, 1. Poor)
Properties Rheocasting Thixocasting Squeeze
Casting
High
Pressure
Die Casting
Low
Pressure
Die Casting
Shrinkage porosity 4 4 3 2 3-2
Blow Hole 3 3 3 1 3
Segregation 3 3 2 3 3
Microstructure Globular Globular Dendritic Petal Shape Dendritic
Mechanical
Properties 3-4 3-4 3 1 2-3
Wrought Alloy
Application 4 3 2 1 2
Hot Tear 4 4 2 1 3
Metal Fludity 3 2-3 4 4 3
Casting Cycle Time 3 3 2 3 1
Die Life 4 4 2 3 3
Product Cost 3 1 2 4 4

23
Figure 8. Schematic illustration of the thixo and rheo casting methods [20].
2.4.1.1. Thixocasting
There are three stages of thixocasting. These stages are preparation of feedstock,
heating the feedstock and shaping. All of these stages have different method
variations. Moreover, these stages should be done properly in order to get desired
results. The benefits of the thixocasting route are that having control over the

24
feedstock quality, chemical composition, and gas content which provide high
quality control [20].
2.4.1.1.1. Feedstock Preparation
There are many techniques to be used for feedstock preparation. However, four of
them are getting attention due to their stability and feasibility. These four methods
are; mechanical stirring, magnetohydrodynamic stirring, thermomechanical
processing and grain refinement [20].
Mechanical stirring basically consist of stirring of molten metal as it is cooling
down. Early methods were based on batch production, but later on continuous
process is discovered. However, continuous process could not be commercialized
due to problems like contamination and oxidation [20].
Magnetohydrodynamic stirring continuous casting process is almost same as
conventional direct chill continuous casting processes. However, in this method
molten metal is stirred by a rotating electromagnetic field as liquid metal solidifies.
That’s why dendrite formation is avoided by effecting nucleation and solidification
processes. Vertical, circumferential or both stirring methods are used to produce
vertical or horizontal feedstocks [20].
Thermomechanical processing is a solid state method which relies on initiating
recrystallization by strain inducing. There are two main methods for this process;
strain induced melt activation (SIMA) and recrystallization and partial remelting
(RAP). The SIMA consists of extrusion of material above the recrystallization
temperature before cold working [21]. In the RAP process, material is extruded
below the recrystallization temperature to obtain the critical strain [22]. Schematic
of SIMA process and RAP process are given in Figure 9.

25
Figure 9. Schematic of SIMA (a) and RAP (b) processes [20].
Grain refinement method controls nucleation process thus, globular microstructure
can be obtained. Chemical grain refiners or other techniques like cooling slope can
be used for this method. These techniques limit dentritic formation by creating large
amount of nuclei.
Other methods for feedstock preparation are:
Passive stirring,
Spray casting (Osprey process),
Liquidus casting,
Ultrasonic treatment,
Powder compaction,
Single slug production [20].
2.4.1.1.2. Feedstock Reheating
Feedstock reheating is an important step for thixoforming because, this step have
direct effect on the properties of final product. However, there are many parameters
to be achieved. These parameters are; heating the feedstock to the desired
temperature quickly, to obtain homogenous temperature distribution, minimal grain

26
growth and repeatability of the process. That’s why, radiation/convection heating
and induction heating is evolved for this purpose [23].
Radiation/convection heating was used in industrial heating of billets for semisolid
forming in the mass production of automotive components. The advantages of this
technology were the low capital costs and easy process control. However, this
technology was not used commonly due to the limiting parameters as slow heating
cycle [23].
Induction heating is a more preferred technique than radiation/convection heating.
The reason of this, induction heating provides higher heating rates in process.
Unfortunately, some problems like overheating of skin and corners of the billet can
be observed [23, 24]. Luckily, most of these problems can be overcome by different
coil designs and heating strategies. Proper process controls can make induction
heating providing high heating rates with a high degree of control over billet
temperatures and properties [23, 25].
2.4.1.2. Rheocasting
Rheocasting become prominent in mid-1990s due to the high cost of the
thixocasting route. Since mid-1990s many developments are achieved in this
process. Main focus was on the producing globular structure SSM slurries from
liquid metal directly. It was seen that achieving this purpose was through the control
of nucleation and grain growth process. Adequate nucleation was needed as
controlling the grain growth in order to avoid dendritic formation for obtaining
globular structure [26]. Developed processes can be sum up under three categories:
Nucleation,
Nucleation and active contact stirring/shearing,
Nucleation and active noncontact stirring.

27
2.4.1.2.1. Nucleation Based
There are many processes which are developed based on nucleation mechanism.
However, two popular ones are New Rheocasting (NRC) and Cooling Slope process
(CSP) [20].
New Rheocasting (NRC):
This process is composed of pouring the superheated liquid metal into a holder,
which causes formation of copious amount of nuclei. Then, these nuclei grow into
globular microstructure by slow cooling. After this step, a temperature adjustment is
made by induction heating and shaping take place. A schematic illustration of the
new rheocasting process can be seen in Figure 10 [20].
Figure 10. Schematic illustration of the NRC rheocasting process (UBE) [20].
Cooling Slope Casting (CSP):
CSP process can be explained by following steps. Firstly, slightly superheated
slurry is poured onto a cooling slope with inclination. This cooling slope helps large
amount of nuclei formation. Afterwards, cooling slope cause liquid metal to cool
down to the semi-solid range. Then, this semi-solid metal flow into an insulated
container where slow cooling occurs to desired SSM temperature [27, 28]. Prepared
slurry can be used in either forming processes or solidify to use for thixoprocessing.
Figure 11 illustrates cooling slope process [20].

28
Figure 11. Schematic illustration of the cooling slope casting process [20].
Other nucleation based casting processes can be sorted as:
Direct Thermal,
Subliquidus Casting (SLC),
Continuous Rheoconversion Process (CRP),
Self-Inoculation Method (SIM),
In-Ladle Direct Thermal Control,
Rheocontainer Process (RCP),
Cup-Cast Method (CCM),
Serpentine Pouring Channel (SCP),
Inverted Cone-Shaped Channel Process,
Controlled Nucleation Process
The Damper Cooling Tube Method [20].

29
2.4.1.2.2. Nucleation and active contact stirring/shearing
Advanced Semisolid Casting Technology, Honda:
This process contains stages as mechanical stirring of molten aluminum alloy and
the transferring of the semi-solid slurry to a conventional high pressure die casting
(HPDC) machine for component production [29, 30]. Figure 12 is the schematic
illustration of the advanced semisolid casting technology rheocasting process
developed by Honda [20].
Figure 12. Schematic illustration of the advanced semisolid casting technology
rheocasting process developed by Honda [20].
Semisolid Rheocasting (SSR) Process:
SSR process, also known as mechanical stirring melt conditioning, was first
developed at the MIT. This process takes place as a cold rotating rod is put into a
molten metal which is slightly over liquidus temperature. The cold rotating rod
stays in the molten metal until molten metal cool down below the liquidus
temperature. Furthermore, this allows nucleation and applies the necessary shear

30
forces to produce the SSM microstructure [31, 32]. After removal of the rod, the
slurry is allowed to cool to the desired temperature. As the slurry reaches to the
desired temperature, it is transferred into a HPDC machine and injected into the die.
Figure 13 demonstrates how the SSR process happens with a schematic illustration
and temperature time graph of steps [20].
Figure 13. Schematic illustration of the semisolid rheocasting (SSR) process [20].
Other nucleation and active contact stirring/shearing based processes are given
below:
Low Superheat Pouring with a Shear Field (LSPSF) Process,
The Swirled Enthalpy Equilibration Device,
Rheomolding:
o Rheodiecasting Process,

31
o Taper barrel,
o Rotating Barrel Rheomolding Machine Process,
o Forced convection rheomolding process.
Rheometal Process,
Gas-Induced Semisolid Metal Process,
Melt Spreading and Mixing Technique (MSMT) [20].
2.4.1.2.3. Nucleation and active noncontact stirring casting
The Hitachi Process:
The process covers pouring a molten metal into a vertical injection shot sleeve then,
stirring electromagnetically and cooling it as it is in the shot sleeve. After desired
conditions are obtained semi-solid metal is injected to the die [33].
Other processes are given below shortly:
Advanced Rheocasting Process a.k.a Hong-Nano Casting Method,
In-Mold Rheocasting Process,
Novel Hot Chamber Rheodiecasting Process,
Multielectromagnetic Stirring Continuous Preparation Process,
The Council for Scientific and Industrial Research Rheocasting System [20].
2.4.2. Squeeze Casting
Squeeze casting (SC) was first patented by Hollinggrak in 1819 [34]. Then,
Chernov improved the idea by applying steam pressure to the molten metal in 1878
[35]. However, commercialization took place after 1960 for the production of
aluminum automotive parts. Also, other alloys, steel and cast iron have been used
[36]. Furthermore, the most distinguished application for SC was achieved by
Toyota with production of alloy wheels in 1979. Recently, squeeze casting
technique is used for metal matrix composites and magnesium alloy production
[37].

32
SC is a combined process of permanent mold casting and die forging. In this
method, specific amount of molten metal is poured into a die mold, which is
preheated and lubricated, and applied pressure until solidification is completed. Fine
microstructure can be obtained by increased cooling rate due to applied pressure
before, during and after solidification. This applied pressure generates metal-die
walls contact and increased heat flow [20].
High pressure during process also causes macro and micro shrinkage porosity
prevention or elimination. Moreover, porosities, which are formed due to dissolved
gases, are limited by applied pressure [20].
SC products are resulted with fine grained, weldable, heat treatable and denser.
These properties tend to excellent mechanical properties and surface quality. SC can
produce more complex part with reduced labor and material cost than forging [20].
However, mechanical properties of SC are lower than forging because, plastic
deformation does not create hardening unlike forging. Also, applied pressure is
between 50MPa and 300MPa which is lower than forging [38, 39].
Relatively low ram velocity, which is about 0.5 m/s, enables low turbulence during
transferring liquid metal into the mold. Because of this low turbulence, air
entrapment and porosity formation possibilities are avoided. Furthermore, growing
dendrites are broke down and shrinkages are covered by ram pressure during
solidification [40].
SC dies have thick gates in order to avoid premature solidification. Also, thick gates
help to maintain low flow speed. Accuracy of dimension for SC is: 0.25mm in
100mm to 0.6mm in 500mm [41].
SC applications cover aluminum casting for automotive parts, brass and bronze for
bushing and gears, steel for missile parts and pinion gears and ductile iron for
mortar shells [39, 42].

33
2.4.2.1. Squeeze Casting Methods and Parameters
There are two SC methods which are direct squeeze casting and indirect squeeze
casting. The differences and principles of these SC methods are given in the
following paragraphs [20].
Direct squeeze casting method which is called as liquid metal forging as well has
similarity with forging process. In this method, specific amount of molten metal is
poured into the lower half die mold, which is preheated and lubricated, and upper
half die mold closes on the lower half die mold [43, 44]. Closed upper half die mold
drives molten metal into the cavity with applying pressure during solidification
which forms casting shape [20].
There is no need for runners, gating systems and risers for this system which is a
great advantage. That’s why, almost no scrap metal is produced and output is very
high [36, 41, 43]. On the other hand, scrap rate can be high, if the specific volume
of the molten metal is surpassed. Furthermore, direct SC can produce porosity free
casting but, oxides and inclusions can be seen due to the lack of runners [41, 43].
To sum up, direct SC have many advantages and disadvantages however, it is
mainly used for production of relatively simple geometries [20].
Figure 14. Schematic illustration of direct squeeze die casting [20].

34
Indirect squeeze casting method is generally a vertical indirect squeeze casting
process. This method is a mixture of high pressure die-casting (HPDC) and low-
pressure die-casting (LPDC) methods. Molten metal is poured in the shot sleeve
which is slightly tilted. Then, shot sleeve moves to a vertical position to push the
molten metal in the die cavity [45]. Die cavity is above the shot sleeve which makes
this process a counter-gravity process. Shot sleeve keep applying pressure until
solidification is completed. Applied pressure is kept constant before, during and
after solidification. As comparison is made with a direct SC machine, in direct SC
machine is a more complex and expensive machine [20].
The flow speed is kept low to evade turbulence which keeps the flow front flat and
help ventilation of air entrapped. In some cases, metallic mesh filters can be used in
gate for inclusion reduction in the product [41].
The cost of the product is higher than direct SC due to the scrap rate. On the other
hand, specific volume of molten metal is not used in indirect SC unlike direct SC.
To conclude, indirect SC method has higher commercial use than direct SC,
although it is more complex and expensive [20].
Figure 15. Schematic illustration of indirect squeeze casting [20].

35
Numerous process parameters are effective on both direct squeeze casting and
indirect squeeze casting. These parameters can be ordered as follows: [36, 37, 39].
First parameter is the quality of alloy and alloys itself. Melting temperature
and thermal conductivity of alloy is very important in terms of die life and
selection of die temperature. Hence, Al and Mg alloys which have low
melting temperature should be preferred in squeeze casting operations.
Furthermore, metal cleanliness affect inclusion rate in the product.
Since amount of the molten metal is vital in direct SC, systems that prevent
excess amount of molten metal transfer into the mold should be used.
Overflows and compensating hydraulic pistons can be used
Die temperature and punch temperatures should be observed, in order to
have control over heat transfer rate and solidification. Range between 200oC
and 300oC is recommended for Al and Mg alloys. Higher temperatures can
cause surface defects and metallization while low temperatures can cause
premature solidification and cold laps. Also, graphite based lubricants can
be applied to the mold.
The time between pouring the molten metal in the die and start of applied
pressure onto the molten metal is called as time delay. Time delay is an
important parameter for reducing shrinkage porosities. However, there are
many opinions on this subject. Mostly, 6s is used as time delay but it is up to
1 min for large components [46]. As some researches [47, 48] claim that
optimum time is the midway between solidus and liquidus, some researchers
[37, 49] claim that alloy should be mainly liquid as pressure starts to be
applied.
Die coating and lubrication agents vary with respect to die material and
casting alloy. For instance, water based colloidal graphite can be used for
non-ferrous castings. Furthermore, coatings can be used for SC die molds.
However, thickness of coatings and lubricants should not exceed 50 mm in
order to prevent coating stripping and damaging the casting.

36
Other two important parameters are duration and magnitude of applied
pressure. Because, solidification temperature thus, microstructure of product
is greatly related with pressure. An explanation can be made by using
Clausius–Clapeyron equation.
∆𝑇
∆𝑃=
𝑇𝑚 ∙ ∆𝑉
∆𝐻𝑓
In this equation, Tm is equilibrium melting temperature, ΔV is specific
volume differences of liquid and solid, ΔHf is the latent heat of fusion, ΔT is
temperature difference and ΔP is pressure difference. Tm and ΔHf are
negative due to shrinkage and released heat by the molten metal during
solidification. Consequently, ΔT/ΔP is positive. This also means increasing
applied pressure is resulted with higher solidification temperature [20].
2.4.2.2. Process Advantages, Disadvantages, and Defects
Applied pressure and slow filling provide a shrinkage and gas porosity free product
for squeeze casting. As a consequence, SC products are heat-treatable and weldable.
Furthermore, near net shape castings with high surface finish can be obtained by SC
method. High pressure application provides decreased grain size and dendrite arms
which improve mechanical properties of the product. The reason for this is
increased molten metal-die heat transfer rate [20].
Ferrous and non-ferrous castings can be done without any cast composition or
wrought composition differentiation is made by SC. Moreover, from 10 g to 5 kg
casting can be produced easily. Automated operations are suitable since, scraps can
be recycled in SC [20].

37
On the other hand, there are also some disadvantages of SC. Macrosegregation can
be observed with high temperature gradients. Macrosegregation causes non-uniform
microstructure and mechanical properties. Furthermore, eutectic can be pushed to
the surface which cause surface defect, if some high segregation elements exist in
the alloy [20].
Frankly, foundry defect can be observed like porosity, inclusions, cold shuts etc.
when process parameters are not taken into account [20].
2.4.3. Gravity Die Casting
Gravity die casting which is also called as permanent mold casting, is casting
method. Two or more metals molds are used repeatedly to produce same shape.
After metal molds are assembled or placed in order to perform a casting, molten
metal is poured into the molds with the help of gravity. This process can be called
as semi-permenant mold casting when sand or plaster cores are used [50].
Gravity die casting is more preferable for high volume productions. Moreover, it
should be considered that product should have uniform thickness and need
uncomplicated coring. On the other hand, complex casting can be achieved with
high production amount that will compensate mold costs [50].
More uniform casting with lower dimensional tolerances are performed by gravity
die casting as it is compared with sand casting. Furthermore, good surface finish
and higher mechanical properties are obtained [50].

38
Unfortunately, there are some limitations for gravity die casting. These limitations
are [50]:
Gravity die casting limits the number of alloys that can casted.
Low amount production is not feasible due to high tooling cost.
Certain shapes are not suitable for this technique due to some problems like
parting line, undercuts and removal of dies.
Coatings are necessary in order to increase die life.
2.4.4. Vacuum Assisted Gravity Die Casting
This method is a combination of gravity die casting and vacuum. Although there is
not much information on this method in literature, it is known that vacuum is used
for reducing gas porosities and blisters [20]. Also, it can be said that vacuum helps
the molten metal filling the mold, since vacuum apparatus is at the end of the
vertical die.
2.4.5. Sand Casting
Sand casting is a very ancient casting process. A destructible sand mold is made for
a specific product and molten metal is poured into this mold for sand casting
process. However, sand casting is still used due to the design possibilities that are
shape and size [50].
Silica and zircon are the most used sands in aluminum casting although, zirconia,
olivine and chromite are used in sand casting processes. Silica sands that are used in
foundries mostly consist of quartz (SiO2). On the other hand, some ferrous
impurities can be found in this sand like Fe3O4 or FeO-TiO2. The reason of silica
sand usage in foundries is its low cost and availability. Unfortunately, volume
changes in silica during heating can cause some defects in the casting. For example,
at 573oC there is α to β transformation which cause 1.6% volume expansion and

39
above 867oC, β to tridymite transformation occurs which shrink volume by 0.3%
[50].
Quality of the mold is related with the size, shape and distribution of sand grains.
Shape of grains affects the sand surface area. Permeability of the sand is related
with the size distribution. Size, shape and distribution directly affect the binder
amount that must be used in the mold. Since, binder amount must increase as sand
surface increase in order to have required mechanical properties. Round grains need
less binder amount due to their low surface to volume ratio and they are favorable
in core making. However, angular grains need more aggregates due to their surface
to volume ratio [50].
2.4.5.1. Green Sand Molding
The sand molds that can be transformed to clay-bonded sand by water addition is
called as green sand. Bentonites and fireclays are the most common clays that is
used for aluminum casting [50].
Bentonites are a kind of a montmorillonite that is expanding with water addition
and shrink with drying. There are two kinds of bentonites that one of them replaces
its Na atoms with aluminum atoms and the other one replaces its Ca atoms with
aluminum atoms. Bentonites provide plasticity to the sand. This plasticity helps
compensating the volume change effects in silica. Fireclays are compromise of
kaolinite. Fireclays are refractory and have low plasticity [50].
Sand mold gases form as the molten metal is poured into the sand mold. These
gases are result of binder decomposition. At this point of casting, permeability of
the sand mold becomes important. If the permeability is not sufficient these gases
can cause casting defects by disrupting metal flow or damaging mold walls. On the
other hand, these gases avoid metal penetration to the sand mold. That’s why, a
balance must be obtained in the sand mold. Furthermore, as molten metal is poured

40
into the cavity, sand grains are subjected to heat of molten metal. This leads
expansion on neighbor sand grains. In order to maintain cavity shape, these
neighbor sand grains should not be dense [50].
2.4.6. Grain Refinement in Aluminum Alloys
Grain refinement is a method for having fine (smaller) grains in alloys. Proper
usage of grain refinement methods provide a fine grained structure in all aluminum
alloys. Most common methods for grain refinement are master alloys of titanium or
master alloys of titanium boron addition in aluminum alloys. Al-Ti based additives
usually have 3-10% Ti while Al-Ti-B based additives have 0.2-1% B. Grain refiners
should be added in operative quantities to give optimum results. There are forms of
grain refiners for specific usage. Rod form wrought refiners are used for continuous
casting systems. Also, it can be found in short lengths for foundry use. Same grain
refinement composition can be found as waffle form. Salts that are usually in
compacted form can be found to form TiAl3 or TiB2 [50].
2.4.6.1. Grain Refinement Mechanisms
Actually there are no commonly accepted mechanism theory exist. There are some
theories but, none of them persuade all researchers. TiAl3 affects nucleation of
aluminum crystals. This is because crystallographic lattice spacing similarities
between TiAl3 and aluminum. Nucleation might take place on TiAl3 substrates.
These substrates can be either undissolved or precipitate at higher Ti concentrations
by peritectic reaction. On the other hand, at lower Ti concentrations than 0.15%
which is the Al-Ti peritectic point, grain refinement can be attained. That’s why,
theories like co-nucleation of the aluminide by TiB2 or carbides and inherent effects
on the peritectic reactions are assumed to be effective. Also, it is claimed that
complex borides of Al-Ti-B affects grain nucleation. Normally, Ti addition to
casting results with finer grain size. Furthermore, TiB2 existence in the alloy
provides extended grain refinement effectiveness. Also, it is seen in the tests that

41
just additive of aluminum boride and titanium boride without excess Ti addition
provide significant grain refinement. However, it is accepted that optimum results
are achieved with usage of excess Ti balanced with TiB2. Effect of boride on grain
refinement is observed both casting and wrought alloys. However, boride usage in
large amounts cause agglomeration and affect casting quality badly as inclusions.
Furthermore, it is recommended that after boride usage, furnaces should be cleaned
due to inclusion possibility [50].
The aim of the grain refinement is to provide fine, uniform and equiaxed grain
structure to the casting. This is the reason why selection of grain refiner is
important. Proper grain refiner selection is mostly related with the experience of the
foundry. Most of the foundries select grain refiners in order to fulfill the
requirements of the product. Even though this is a case work, 5Ti-1B and 5Ti-0.6B
types of grain refiners are recommended for optimum results in most cases. Also
these grain refiners with 0.01-0.03%Ti additive are characterized by their
cleanliness and uniform distribution of aluminide and boride phases [50].
There are various test methods for grain refinement effectiveness. However, most of
them are based on comparison of samples. Foundries usually sand cast an alloy with
and without a grain refiner into the similar molds. Then, grain size comparison is
made by metallographic methods like etching and polishing. Moreover, NDT
techniques like thermoanalytical and electrical conductivity methods are developing
for grain structure prediction [50].

42

43
CHAPTER 3
EXPERIMENTAL PROCEDURE
3.1. Squeeze Casting
A vertical squeeze casting machine, which can be seen in Figure 16, was used in
this experiment. Molten 7075 and 7085 aluminum alloys were poured into the pre-
heated die mold separately. Molten aluminum alloys were solidified under 175MPa
pressure in the mold. 3 samples were prepared by this method for 7075 alloy. Figure
17 shows the samples of this experiment. Dimensions of those samples are; 90 mm
diameter, 12 mm, 17mm and 23mm height, respectively. Four samples were
prepared for 7085 alloy which can be seen in Figure 18. Later on, hardness test was
conducted on these as cast samples. Finally, these samples were subjected to T6
heat treatment. Solution treatment was done at 540 oC for 6 hours in a muffle
furnace (Figure 19) then samples were quenched in water. Artificial aging treatment
was conducted at 160oC for 6 hours in muffle furnace for 7075 alloy according to
Table 5. However, 7085 alloy sample was solution treated at 485 oC for 90 minutes
and quenched to avoid blisters based on Table 5. Artificial aging was performed at
120oC for 24 hours.

44
Figure 16. Vertical squeeze casting machine used in experiments.
Figure 17. Squeeze cast 7075 alloy discs. First, second and third from left to right.

45
Figure 18. Squeeze cast 7085 alloy discs.
Figure 19. Muffle furnace used for heat treatment in experiments.
3.2. Vacuum Assisted Gravity Die Casting
A controlled vacuum was applied during melt delivery to increase filling speed and
cooling rate. The reason of using vacuum application is to fill the die mold as
quickly as possible before molten 7075 alloy solidification. The setup for this
experiment consist of a copper die mold, an apparatus to connect die mold with

46
vacuum hose, vacuum pump and a sprue made out of green sand. Setup can be seen
in Figure 20.
After assembly of the setup, 7075 aluminum alloy was melted in an induction
furnace. After melting of aluminum alloy, copper die mold was heated up to 250oC
by a torch. Vacuum pump was activated before casting. Since, high vacuum would
cause defects in casting, low vacuum was applied. A vacuum machine that has three
vacuum levels was used on the lowest level. After these steps, molten 7075
aluminum alloy was poured into sprue at about 700oC and was filled the horizontal
copper die mold under controlled vacuum condition.
As cast specimen was cut in 7 mm x 60 mm x 70 mm dimensions for heat treatment
as shown in Figure 21. ASTM heat treatment standard was based in order to
determine heat treatment temperatures and durations. T6 heat treatment was
performed for this sample. Since, sample thickness is 7 mm, solution treatment was
done at 480oC for 70 minutes in muffle furnace following a water quench was done.
Artificial aging treatment was done at 120oC for 24 hours in convection furnace.

47
Figure 20. Vacuum assisted gravity die casting experiment setup. 1. Sprue, 2.
Horizontal copper die mold, 3. Vacuum hose-die mold connecter part, 4. Vacuum
hose.
Figure 21. Polished and heat treated vacuum assisted gravity die cast sample.
Melt Pouring
Casting Direction
Vacuum
Direction

48
3.3. Gravity Die Casting
A vertical permanent copper die mold was used to produce 7075 alloy slab. 7075
aluminum alloy was melted by induction furnace. Vertical copper die mold was
preheated up to 250oC by a torch. Molten 7075 alloy was poured into the preheated
vertical copper die mold at 850oC. Casting was done through gravitational force. A
part of cast sample was cut for testing. This sample had dimensions as 7 mm x 60
mm x 20 mm as shown in Figure 22.
ASTM heat treatment standard was based in order to determine heat treatment
temperatures and durations similar to vacuum assisted gravity die casting
experiment. T6 heat treatment was conducted on sample. Since, sample thickness is
7 mm, solution treatment was done at 480oC for 70 minutes in muffle furnace
following a water quench was done. Artificial aging treatment was done at 120oC
for 24 hours in convection furnace.
Figure 22. Sample that was used for testing in gravity die casting experiment.
3.4. Sand Casting
Rifle receiver dimensions were measured and used for this experiment. Since, our
aim is to produce a near net shape preform. Resin coated sand and green sand mold
were prepared in accordance with the measured dimensions of rifle receiver. Resin
coated sand core was prepared by heating at 200oC for 1 hour in convection

49
furnace. This core corresponds to the hollow part of rifle receiver. Green sand mold
was prepared to cover other parts of rifle receiver. For this purpose a wood pattern
of rifle receiver was prepared. After preparation of sand mold, 7075 aluminum alloy
was melted in an induction furnace. Then, molten 7075 alloy was poured into mold
at 750oC which gives adequate time to molten alloy to fill the cavity completely.
Sand cast samples can be seen in Figure 23.
Casting was exposed to heat treatment after removal of runner. T6 heat treatment
was performed on the casting. Solution treatment was completed at 480oC for 2
hours in muffle furnace. This duration is out of ASTM standardization but, this
duration was considered appropriate for solutionizing. 120oC was used for artificial
aging treatment with duration of 24 hours in convection furnace.
Figure 23. 7075 aluminum alloy casting after shake out of sand.
Al5TiB was used as grain refiner to decrease grain size of sand casting. Before
melting in induction furnace, 7075 aluminum alloy that was melted was weighted. It

50
had 1612 gr weight and 3 gr of Al5TiB was added to charge which corresponds to
0.18%. After alloy preparation, molten alloy was poured into a mold at 750oC
which was the same pouring temperature of sand casting.
3.5. Vertical Semi Solid Metal Casting
The aim of this experiment is to observe formability of 7075 at different
temperatures and at different solid fractions. In this experiment, a vertical press with
a die mold that have 90 mm diameter was used as in Figure 24. 3 parts are cut from
extruded 7075-T6 billet (40 cm x 7.5 cm x 2 cm). 40 cm is length, 2 cm is thickness
and 7.5 cm is width of the billet. Prepared specimens have dimensions as 7.5 cm x 5
cm x 2 cm (Figure 25). Then, specimens were put in the muffle furnace for heating
up to desired temperatures. Three different temperatures were used for this
experiment; 580oC, 595
oC and 605
oC. Before pressing, die mold of the vertical
press was preheated with a torch to 250oC. Preheated specimens were placed in the
pre-heated die cavity with the 90 mm diameter for subsequent pressing. Specimens
were pressed at 150 MPa pressure in the die cavity. Three semi-solid formed disks
were produced during experiments.
Figure 24. Die mold and working principle of vertical squeeze casting press that is
used during semi solid experiments in the Foundry laboratory at METU.
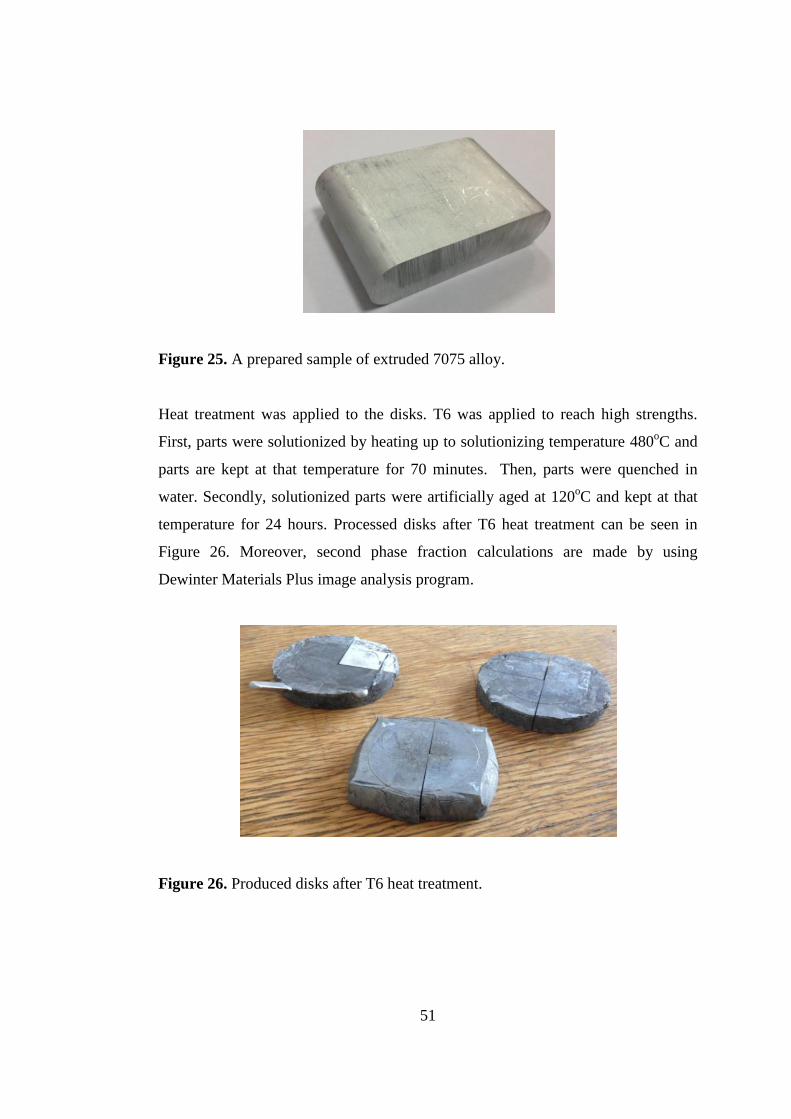
51
Figure 25. A prepared sample of extruded 7075 alloy.
Heat treatment was applied to the disks. T6 was applied to reach high strengths.
First, parts were solutionized by heating up to solutionizing temperature 480oC and
parts are kept at that temperature for 70 minutes. Then, parts were quenched in
water. Secondly, solutionized parts were artificially aged at 120oC and kept at that
temperature for 24 hours. Processed disks after T6 heat treatment can be seen in
Figure 26. Moreover, second phase fraction calculations are made by using
Dewinter Materials Plus image analysis program.
Figure 26. Produced disks after T6 heat treatment.

52
3.6. Vertical Squeeze Casting
In this experiment, aim was to observe mold filling properties of the 7075 alloy in a
hollow shaped mold. The same vertical squeeze casting press with a die was used
for this experiment. However, a special die was used in this experiment. This mold
produces rectangular shaped parts having cavity that have dimension as 31cm x
5cm x 3.5cm and a hollow part as in Figure 27. Extruded 7075-T6 billet was melted
in an induction furnace. Then, molten 7075 aluminum alloy, at 650oC temperature
was poured into the preheated rectangular die that has temperature less than 250oC.
100 tones force was applied to the molten alloy in the die. By using this method two
rectangular prism shape preforms were produced which are in Figure 28. After
producing these preforms, T6 heat treatment was applied to these samples similar to
casting samples.
Figure 27. Burst drawing of the mold that produces hollow shaped parts.

53
Figure 28. Produced hollow shaped parts after T6 heat treatment.
3.7. Semi-Solid Metal Casting
The aim of this experiment is to observe effects of a particular solid fraction during
high pressure die casting of 7075 alloy at an injection molding process. A HPDC
machine was used for this experiment (Figure 29). A special die that can produce
tensile test specimen and bending test specimen was used (Figure 30). 7075 alloy
was processed with HPDC. By the time, die was heated up to 200oC. Before
pouring the molten alloy, alloy in the crucible was stirred with a rod containing a
thermocouple to read the temperature of the alloy to reach desired temperature. As
alloy temperature decreases below the liquidus temperature, alloy was poured into
shot sleeve and pressed. A sample was pressed at 630oC which is lower than the
liquidus temperature of 7075. Liquidus temperature for 7075 is determined as
635oC by ASM. However, this temperature depends on chemical composition of the
alloy. Even the smallest variation in the composition can change liquidus
temperature. Same procedure was repeated with a modified 7075 alloy. The
chemical composition can be seen from Table 7. For the modified 7075 alloy, five
different temperatures were used as processing temperature. These temperatures
were; 602oC, 613
oC, 616
oC, 620
oC and 624
oC.
The porosities were calculated by weighting the specimens. Porosity calculation of
3rd
specimen is done by Dewinter Material Plus image analysis program. Porosity of
other specimens assumed related to their weight with respect to 3rd
specimen.

54
Figure 29. The high pressure die casting (HPDC) machine used in semi-solid metal
casting.
Figure 30. The die that can produce tensile and bending test specimens.
Three point bending test
specimen cavity.
Gating
Tensile test
specimen cavity

55
Table 7. The chemical compositions of extruded and modified 7075 alloys
produced.
Zn
(wt. %)
Mg
(wt. %)
Cu
(wt. %)
Mn
(wt. %)
Ti
(wt. %)
Al
(wt. %)
Extruded
7075-T6 6.04 2.06 1.20 0.10 0.04 Bal.
Modified
7075 6.96 4.68 2.63 0.05 0.04 Bal.
3.8. Strain Induced Melt Activation (SIMA) Process for Thixocasting
This experiment was aimed to observe effects of ultrasonic stirring and mechanical
stirring on mechanical properties and grain size. Ultrasonic stirring method and
mechanical stirring methods were used in this experiment.
First, 7075 aluminum alloy was prepared in an induction furnace for casting. In
mechanical stirring method, an air cooled copper mold was used and molten 7075
alloy was poured into this mold at 700 oC. Molten alloy was stirred by graphite rod
until solidification was completed. Then, solidified 7075 alloy which had
cylindrical shape was removed from the copper mold at about 200 o
C in order to
perform forging. This cylindrical shaped 7075 alloy was placed vertically under the
punch. 20 tons of force was applied to the alloy for about 1 minute, which caused
33 % increment in cross section area. After forging process, disc shaped sample was
cut from forging sample for further processes. For recrystallization, this disc shaped
sample was kept in muffle furnace at 200 o
C for 100 minutes. Then, this
recrystallized sample was heated up to 590 o
C for semi-solid pressing. T6 heat
treatment was applied to the specimen after semi-solid pressing operation.
In ultrasonic stirring method, an air cooled copper mold which was placed into
ultrasonication bath was used and molten 7075 alloy was poured into this mold at

56
700 oC. Stirring was provided by ultrasound from ultrasonication bath. The same
procedure was followed for next steps. However, semi-solid casting temperature of
this sample was 610 o
C. Cylindrical shaped alloy billets can be seen in Figure 31.
Moreover, experimental parameters of ultrasonic stirring and mechanical stirring
were tabulated at Table 8.
Figure 31. Cylindrical shaped alloy billets produced (left: ultrasonic stirring, right:
mechanical stirring).

57
Table 8. Experimental parameters of ultrasonic and mechanical stirring.
Ultrasonic Stirring Mechanical Stirring
Casting Temperature
(oC)
700 700
Forging Temperature
(oC)
~ 200 ~ 200
Cross Section Area
Increase (%) 33 33
Recrystallization
Temperature (oC)
200 200
Pressing Temperature
(oC)
610 590
Heat Treatment T6 T6
3.9. Thermal Analysis and Solid Fraction Calculations
Different cooling rates were used to obtain solid fraction curves. Calculation of
solid fraction can be done by many methods. However, it was determined that using
Newtonian thermal analysis method is suitable for this. In Newtonian thermal
analysis, a cooling curve should be obtained from a solidifying alloy as illustrated in
Figure 32. Then, first derivative of the cooling curve is obtained which should give
phase transformation temperatures of the solidifying aluminum alloy by using a
special computer program as shown in Figure 33. A zero curve or baseline should
be drawn onto the first derivative of the cooling curve. This zero curve can be
drawn by using polynomial curve fitting. However, the part of the first derivative
which phase transformation occurs must be excluded during curve fitting. Since,
zero curve is assumed that there is no phase transformation through phase
transformation temperatures. After that point, the best fitting polynomial degree
should be chosen as zero curve as seen in Figure 34. In this case and for most cases
3rd
degree polynomial fit would be appropriate. In the next stage, the area between
the zero curve and the first derivative should be integrated from liquidus
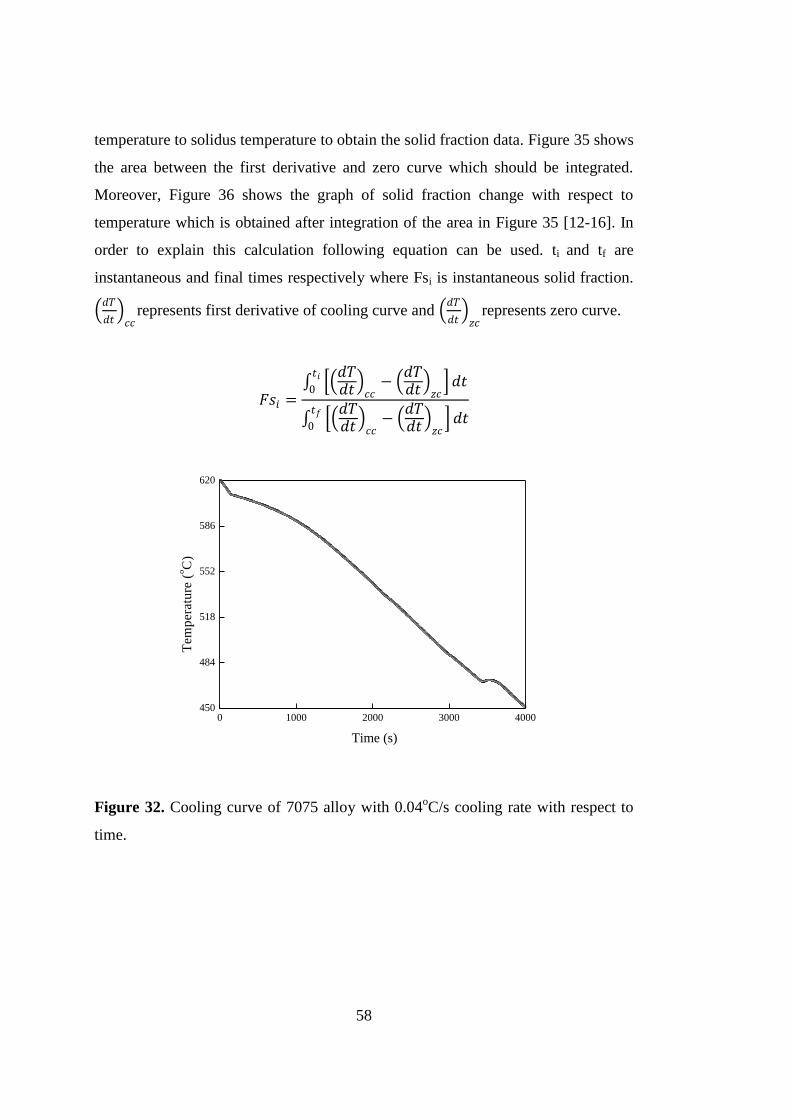
58
temperature to solidus temperature to obtain the solid fraction data. Figure 35 shows
the area between the first derivative and zero curve which should be integrated.
Moreover, Figure 36 shows the graph of solid fraction change with respect to
temperature which is obtained after integration of the area in Figure 35 [12-16]. In
order to explain this calculation following equation can be used. ti and tf are
instantaneous and final times respectively where Fsi is instantaneous solid fraction.
𝑑𝑇
𝑑𝑡 𝑐𝑐
represents first derivative of cooling curve and 𝑑𝑇
𝑑𝑡 𝑧𝑐
represents zero curve.
𝐹𝑠𝑖 =
𝑑𝑇𝑑𝑡
𝑐𝑐
− 𝑑𝑇𝑑𝑡
𝑧𝑐
𝑑𝑡𝑡𝑖0
𝑑𝑇𝑑𝑡
𝑐𝑐
− 𝑑𝑇𝑑𝑡
𝑧𝑐
𝑑𝑡𝑡𝑓0
0 1000 2000 3000 4000450
484
518
552
586
620
Time (s)
Tem
pera
ture
(oC
)
Figure 32. Cooling curve of 7075 alloy with 0.04oC/s cooling rate with respect to
time.

59
0 1000 2000 3000 4000-0.10
-0.05
0.00
0.05
Fir
st D
eri
vati
ve o
f C
oo
lin
g C
urv
e
Time (s)
Figure 33. First derivative of 7075 alloy cooling curve with 0.04oC/s cooling rate
with respect to time.
0 1000 2000 3000 4000-0.10
-0.05
0.00
0.05 3rd Degree Polynomial Fit
5th Degree Polynomial Fit
4th Degree Polynomial Fit
2nd Degree Polynomial Fit
1st Degree Polynomial Fit
Fir
st D
eri
vati
ve o
f C
oo
lin
g C
urv
e
Time (s)
Figure 34. Polynomial fits in several degrees for zero curve drawing.

60
0 1000 2000 3000 4000-0.10
-0.05
0.00
0.05
4th Degree Polynomial Fit
Fir
st D
eri
vati
ve o
f C
oo
lin
g C
urv
e
Time (s)
Figure 35. The area between the first derivative and the zero curve is represented as
colored.
612 591 570 549 528 507 486 4660
25
50
75
100
So
lid
Fra
cti
on
(%
)
Temperature (oC)
0 600 1200 1800 2400 3000 3600
Time (s)
Figure 36. After integration of the area between the first derivative and the zero
curve, solid fraction with respect to temperature graph can be obtained.

61
For thermal analysis experiment, a K-type thermocouple and data acquisition setup
were used. This system can be seen in Figure 37. For faster cooling rate, molten
alloy was placed in a graphite pot which was covered with thermal blankets from
sides to avoid heat loss from sides. For slower cooling rate, graphite crucible with
solid alloy in it, was placed inside the muffle furnace. Then, muffle furnace was
heated above the melting temperature of alloy to melt the alloy. After melting, K-
type thermocouple was placed in the graphite crucible and furnace was turned off to
let alloy cool slowly.
Figure 37. Data acquisition setup of the thermal analysis and solid fraction
calculations experiment and the graphite crucible that was used in experiments (1.
Thermocouple, 2. Graphite Crucible, 3. Thermal Blanket, 4. Molten alloy).
During cooling of the molten alloy, data was collected via K-type thermocouple.
This collected temperature vs. time data, was processed by MATLAB program to
obtain first derivative vs. time graph and zero curve. Finally, solid fraction vs.
temperature graph was obtained.
Data Acquisition
Device
Monitor
PC
2 3
1
4

62
3.10. Characterization
3.10.1. Mechanical Testing
3.10.1.1. Tensile Test
Tensile tests were done at two different tensile test machines. Mares tensile test
machine used for large specimens is capable of completing tests up to 50 tons of
hydraulic forces. Figure 38 represents Mares tensile test machine setup.
Figure 38. Mares tensile test machine setup [51].
The second tensile test machine that was used in experiments was 100 KN Instron
5582 tensile test machine for relatively smaller specimens. Instron 5582 tensile test
machine is given in Figure 39.
1mm/min elongation rate was used in both machines for all test samples. Moreover,
all the tensile test specimens were prepared according to the ASTM B 557M – 10
which is “Standard test methods for tension testing wrought and cast aluminum and
magnesium alloy products” [52].

63
Figure 39. Instron 5582 Tensile test machine [53].
3.10.1.2. Hardness Test
Universal Emco M4U-025 hardness testing machine was used in all hardness tests.
The hardness tests were done in accordance with ASTM E10 – 01 which is
“Standard Test Method for Brinell Hardness of Metallic Materials” [54]. During
hardness tests, a tungsten carbide ball that has 2.5 mm diameter was indented on the
surface with 187.5 kg load.
3.10.2. Metallography
SEM and optical microscopy were used in this study. The samples were cut to
proper sizes for the microscopy. Metacut-M 250 Cut-Off Machine was used for
cutting operations as shown in Figure 40.

64
Figure 40. Metacut-M 250 Cut-Off Machine [51].
After cutting, grinding was applied to specimens. Several abrasive grinding paper
numbers were used according to the surface roughness with increasing order for
grinding. Polishing was applied after grinding. 3 µm diamond solution was used for
first step polishing. Latter step, 1 µm Al2O3 solution was the choice for polishing.
Samples were etched after proper polishing. Keller’s reagent was used as etchant
for revealing grains of samples. Keller’s reagent consists of 2 mL HF (48%), 5 mL
HNO3, 3 mL HCl, and 190 mL H2O. Samples were etched in Keller’s reagent until
proper contrast and microstructural details were obtained.
3.10.3. Optical Microscopy
SOIF XJP - 6A Optical Microscope was used for all 100x optical microscopy
images with the help of DeWinter Material Plus 4.1 Image Analysis Software. SOIF
XJP - 6A Optical Microscope is an inverted microscope which helps obtaining

65
images from misshapen bottomed specimens. SOIF XJP - 6A Optical Microscope is
given in Figure 41.
Figure 41. SOIF XJP - 6A Optical Microscope [51].
DeWinter Material Plus 4.1 Image Analysis Software was used for obtaining
images and grain size analysis.
3.10.4. Scanning Electron Microscopy (SEM)
JEOL JSM-6400 Electron Microscope and NOVA NANO SEM 430 were used for
SEM images. JEOL JSM-6400 Electron Microscope is equipped with secondary
and backscattered electron detectors. Moreover, NOVA NANO SEM 430 is also
capable of EDX analysis.

66
3.10.5. X-Ray Diffraction (XRD)
Rigaku D/Max 2200/PC X-Ray diffractometer was used for XRD analysis. Cu-Kα
radiation was used for diffraciton at 40kV. Samples were scanned from 10⁰ to 100⁰
2θ angles with a of 2˚/min scanning speed.
3.10.6. Optical Emission Spectrometer Analysis
Foundry Master UV Vacuum CCD optical emission spectrometer was used for
chemical analysis. Foundry Master UV Vacuum CCD optical emission
spectrometer is given in Figure 42.
Figure 42. Foundry Master UV Vacuum CCD optical emission spectrometer.
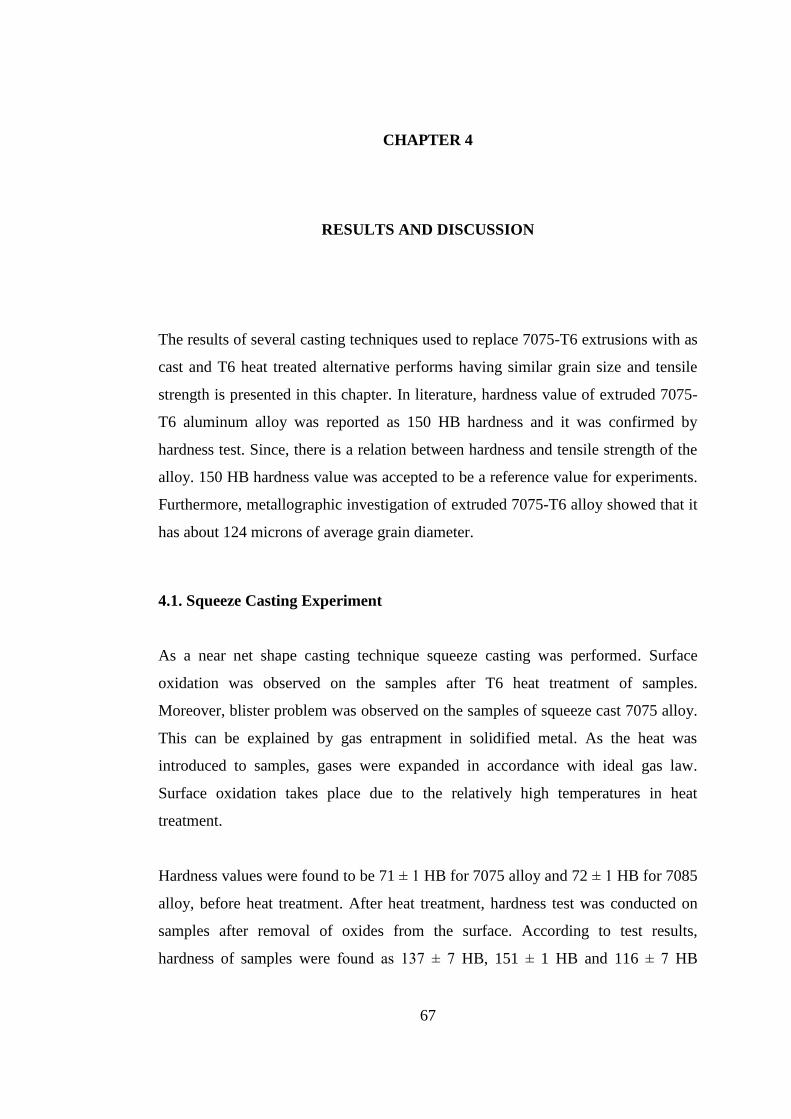
67
CHAPTER 4
RESULTS AND DISCUSSION
The results of several casting techniques used to replace 7075-T6 extrusions with as
cast and T6 heat treated alternative performs having similar grain size and tensile
strength is presented in this chapter. In literature, hardness value of extruded 7075-
T6 aluminum alloy was reported as 150 HB hardness and it was confirmed by
hardness test. Since, there is a relation between hardness and tensile strength of the
alloy. 150 HB hardness value was accepted to be a reference value for experiments.
Furthermore, metallographic investigation of extruded 7075-T6 alloy showed that it
has about 124 microns of average grain diameter.
4.1. Squeeze Casting Experiment
As a near net shape casting technique squeeze casting was performed. Surface
oxidation was observed on the samples after T6 heat treatment of samples.
Moreover, blister problem was observed on the samples of squeeze cast 7075 alloy.
This can be explained by gas entrapment in solidified metal. As the heat was
introduced to samples, gases were expanded in accordance with ideal gas law.
Surface oxidation takes place due to the relatively high temperatures in heat
treatment.
Hardness values were found to be 71 ± 1 HB for 7075 alloy and 72 ± 1 HB for 7085
alloy, before heat treatment. After heat treatment, hardness test was conducted on
samples after removal of oxides from the surface. According to test results,
hardness of samples were found as 137 ± 7 HB, 151 ± 1 HB and 116 ± 7 HB

68
respectively for 7075 alloy. Hardness values of 2nd
sample are given in Table 9. On
contrary, 167 ± 4 HB hardness was found for 7085 alloy. Target value for hardness
150 HB was reached at 2nd
sample of 7075 and sample of 7085. As it was written in
experimental procedure part, hardness values of all 7075 alloy samples were almost
the same as 71 HB. However, there are scattering of hardness values of samples
after heat treatment. Variation of the hardness values in 1st and 3
rd samples of 7075
were due to temperature contours within the furnace. Hardness values of 1st sample
of 7075 fluctuate between 128 HB and 147 HB. Moreover, hardness values of 3rd
sample of 7075 fluctuate between 103 HB and 123 HB.
Grain size measurement was performed and by optical microscope examination 38
microns average grain diameter was found during metallographic investigation of
2nd
sample of 7075. Optical microscope image of squeeze cast specimen can be seen
in Figure 43. Also, SEM image of this sample can be seen in Figure 44. It can be
seen that this average grain diameter is lower than extruded 7075-T6 alloy.
Moreover, tensile tests were resulted as 441 MPa tensile strength and 410 MPa
yield strength values with 1.5% EL.
Kim et. al. claims that 470 MPa tensile strength can be obtained in squeeze casting
of 7075 alloy with pressures as 25 MPa, 50 MPa and 75 MPa. Also, 152 HB
hardness values are claimed to be found in their research [55]. If a comparison is
made, it can be seen that 2nd
sample has 151 HB hardness values and 441 MPa
tensile strength which are almost close to the related research.
Table 9. Hardness values of 2nd squeeze cast sample.
Test No 1 2 3 4 Average and STD
Hardness
Brinell(HB) 151 151 150 151 151 ± 1

69
Figure 43. Microstructure of squeeze casting experiment specimen having 37
micron average grain size (100x).
Figure 44. SEM image of squeeze casting experiment specimen (100x).
150 µm

70
4.2. Gravity Die Casting Experiment
Hardness test was conducted after T6 heat treatment on gravity die cast specimens.
It was found to be 131 ± 3 HB as average hardness value. Table 10 shows average
hardness values. This hardness value is lower than our target hardness 150 HB.
Moreover, metallographic investigation was conducted to measure grain size of the
specimens as shown in Figure 45. SEM image for further comparison is given in
Figure 46. Average grain size was measured as 41 microns. Furthermore, tensile
strength was obtained as 191 MPa with 3.8% EL which can be seen in Figure A. 8.
Figure 45. Microstructure of gravity die casting experiment specimen with 41
micron average grain size (100x).
150 µm

71
Figure 46. SEM image of gravity die casting experiment specimen (100x).
Table 10. Hardness values of gravity die cast samples.
Test No 1 2 3 4 5 6 Average and STD
Hardness
Brinell(HB) 128 131 134 126 131 135 131 ± 3
4.3. Vacuum Assisted Gravity Die Casting Experiment
Heat treated specimen was found to be average 160 ± 8 HB hardness, can be seen in
Table 11 with its standard deviation value. They are higher than hardness of
extruded 7075-T6 specimens. Furthermore, metallographic investigation revealed
that specimen has 38 microns average grain diameter. Optical microstructure shows
microstructure of vacuum assisted gravity die cast specimen can be seen in Figure
47. SEM image of this microstructure can be seen in Figure 48.

72
Figure 47. Microstructure of vacuum assisted gravity die casting experiment
specimen having 38 micron average grain size (100x).
Figure 48. SEM image of vacuum assisted gravity die casting experiment specimen
(100x).
150 µm

73
Blister and surface oxidation after T6 heat treatment were not observed in this
sample. It is thought that blister problem is overcome by vacuum application.
Surface oxidation problem is vanished after using lower heat treatment
temperatures. On the other hand, cold shuts were observed due to higher
solidification rate. Thus, die mold was not filled properly. Therefore, tensile
specimens could not be prepared for this casting trial.
Table 11. Hardness values of vacuum assisted gravity die casting experiment.
Test No 1 2 3 4 5 6 Average and STD
Hardness
Brinell(HB) 159 146 168 159 157 171 160 ± 8
4.4. Sand Casting Experiment with/without Al5TiB Additive
Sand casting experiment was performed to produce 7075 preform castings without
additive of grain refiner. It was obtained that it has 100 ± 9 HB hardness after T6
heat treatment. Even though, it had relatively low hardness values, no casting defect
was observed on surface except for some surface pores by macro-investigation.
Later, metallographic investigation was conducted on this sample. Examination
revealed 98 microns average grain diameter. Figure 49 shows microstructure of
sand casting specimen obtained by optical microscopy. Figure 50 shows SEM
image of this sample.

74
Figure 49. Microstructure of sand cast specimen having 98 micron average grain
size (100x).
Figure 50. SEM image of sand cast specimen (100x).
150 µm

75
Table 12. Hardness values of sand casting without Al5TiB additive experiment.
Test No 1 2 3 4 5 6 7 Average and STD
Hardness
Brinell(HB) 101 116 97 97 112 86 97 100 ± 9
Sand casting was carried with Al5TiB master alloy as grain refiner (TiB2) to molten
alloy. Grain refiner additive was about 0.18% by weight. T6 heat treatment was
applied on these specimens. After heat treatment, hardness test was conducted on
the specimen. 106 ± 19 HB hardness was the result of the hardness test. Although
this hardness is lower than the target value, it is slightly higher than the hardness of
normal sand casting (without grain refiner additive). No casting defect was
observed except for some surface pores. Metallographic investigation revealed that
specimen of sand casting with grain refiner has 74 microns average grain diameter
as shown in Figure 51. SEM image of the specimen can be seen in Figure 52. If a
comparison can be done between sand casting with grain refiner and normal sand
casting, it can be seen that Al5TiB increased hardness by 6% and forms finer grains
as 24.5%.
Tensile test were performed on these specimens and following results were
obtained. Tensile strength of sand cast alloy with Al5TiB addition was 131 MPa
and tensile strength of sand cast specimen was 88 MPa. Yield strength values of
specimens could not be obtained due to premature failure.

76
Figure 51. Microstructure of sand cast alloy with Al5TiB addition, specimen
having 74 micron average grain size (100x).
Figure 52. Microstructure of sand cast with Al5TiB addition, specimen SEM
analysis (100x).
150 µm

77
Table 13. Hardness values of sand casting with Al5TiB addition.
Test No 1 2 3 4 5 6 7 8 Average and STD
Hardness
Brinell(HB) 85 90 110 138 126 115 80 106 106 ± 19
Furthermore, a comparison can be made between the hardness and average grain
size results of these casting experiments in Table 14. It can be concluded that target
hardness value was reached by squeeze casting and vacuum assisted gravity die
casting methods. Furthermore, squeeze casting and vacuum assisted gravity die
casting methods were resulted with fine grains. That’s why, it can be said that
squeeze casting and vacuum assisted gravity die casting methods are better than
other method. However, squeeze casting can be chosen as the best technique due to
tensile test results.
Table 14. Hardness and average grain size comparison of all casting experiments
performed in this study.
No Experiment Average
Hardness (HB)
Average Grain
Size (microns)
1 Extruded 7075-T6 150 124
2 Squeeze Casting 150 ± 1 37
3 Vacuum assisted
gravity die casting 160 ± 8 38
4 Gravity die casting 131 ± 3 41
5 Sand casting 100 ± 9 98
6 Sand casting with
Al5TiB additive 106 ± 19 74

78
4.5. X-Ray Diffraction (XRD) Results of Casting Experiments
XRD results were obtained to reveal the intermetallics inside the castings after T6
heat treatment. In Figure 53, it can be seen that there are 5 peaks in each casting
results. These peaks are at 38o, 45
o, 64
o, 78
o and 82
o which correspond to 2θ values.
These peaks were defined as overlap peaks after a brief investigation. That’s why,
they have larger intensities than expected. Aluminum peaks were indexed according
to ICDD card number of 4-0787. Planes of aluminum were found to be (111) at 38o,
(200) at 44o, (220) at 65
o, (311) at 78
o and (222) at 82
o as in Figure 53. Figure 54
shows Al0.403Zn0.597 peaks which has 52-0856 ICDD card number. In this figure,
planes were found to be (001) at 38o, (110) at 45
o, (121) at 65
o, (012) at 78
o and
(200) at 83o. After T6 heat treatment, intermetallics like MgZn2, Al2CuMg and
Mg32(Al, Zn)49 were specially searched in the diffraction chart. These intermetallics
are known to be contributing increase in strengthening mechanism in 7075 alloy.
MgZn2 results can be seen in Figure 55. Its planes are (103) at 38o, (202) at 45
o,
(302) at 65o, (206) at 78
o and (107) at 82
o. ICDD card number of MgZn2 is 34-0457.
Al2CuMg results are given in Figure 56. Its ICDD card number is 28-0014 and its
planes are (131) at 38o, (132) at 44
o, (062) at 65
o, (154) at 78
o and (064) at 82
o.
Another expected intermetallic is Mg32(Al, Zn)49. Planes of this intermetallic were
determined as (661) at 39o, (550) at 45
o, (770) at 65
o and (1060) at 78
o as shown in
Figure 57. ICDD card number of Mg32(Al, Zn)49 is 19-0029.
However, there are also some undesired intermetallics for 7075 alloy that reduce
strength of the alloy. Iron containing intermetallics are amongst them. After brief
investigation, Fe3Si and FeV intermetallics were found through XRD examination.
Fe3Si results can be seen in Figure 58. (110) at 45o, (200) at 65
o and (211) at 83
o
planes are found as shown in Figure 58. ICDD card number of Fe3Si which is
known as Suessite is 35-0519. Other iron based intermetalic was FeV. Its planes
were shown as (110) at 45o, (200) at 65
o and (211) at 81
o in Figure 59. ICDD card
number of FeV is 18-0664.

79
20 40 60 80 100
0
10000
20000
30000
-Al
(22
2)
-Al
(31
1)
-Al
(22
0)
-Al
(20
0)
-Al
(11
1)
Sand Casting (Al5TiB)
Sand Casting
Vacuum Die Casting
Gravity Die Casting
Squeeze Casting
Inte
nsi
ty
2theta
Figure 53. XRD results of casting for Al with indicated planes.
20 40 60 80 100
0
10000
20000
30000
-Al 0
.40
3Z
n0
.59
7 (
20
0)
-Al 0
.40
3Z
n0
.59
7 (
11
0)
-Al 0
.40
3Z
n0
.59
7 (
01
2)
-Al 0
.40
3Z
n0
.59
7 (
12
1)
-Al 0
.40
3Z
n0
.59
7 (
00
1)
Sand Casting (Al5TiB)
Sand Casting
Vacuum Die Casting
Gravity Die Casting
Squeeze Casting
Inte
nsi
ty
2theta
Figure 54. XRD results of casting for Al0.403Zn0.597 with indicated planes.

80
20 40 60 80 100
0
10000
20000
30000
-Mg
Zn
2 (
10
7)
-Mg
Zn
2 (
20
6)
-Mg
Zn
2 (
30
2)
-Mg
Zn
2 (
20
2)
-Mg
Zn
2 (
10
3)
Sand Casting (Al5TiB)
Sand Casting
Vacuum Die Casting
Gravity Die Casting
Squeeze Casting
Inte
nsi
ty
2theta
Figure 55. XRD results of casting for MgZn2 with indicated planes.
20 40 60 80 100
0
10000
20000
30000
-Al 2
Cu
Mg
(0
64
)
-Al 2
Cu
Mg
(1
54
)
-Al 2
Cu
Mg
(0
62
)
-Al 2
Cu
Mg
(1
32
)
-Al 2
Cu
Mg
(1
31
)
Sand Casting (Al5TiB)
Sand Casting
Vacuum Die Casting
Gravity Die Casting
Squeeze Casting
Inte
nsi
ty
2theta
Figure 56. XRD results of casting for Al2CuMg with indicated planes.

81
20 40 60 80 100
0
10000
20000
30000
-Mg 32
(Al,
Zn) 49 (6
11)
-Mg 32
(Al,
Zn) 49 (1
060)
-Mg 32
(Al,
Zn) 49 (7
70)
-Mg 32
(Al,
Zn) 49 (5
50)
Sand Casting (Al5TiB)
Sand Casting
Vacuum Die Casting
Gravity Die Casting
Squeeze Casting
Inte
nsi
ty
2theta
Figure 57. XRD results of casting for Mg32(Al, Zn)49 with indicated planes.
20 40 60 80 100
0
10000
20000
30000
-Fe 3
Si(
21
1)
-Fe 3
Si(
20
0)
-Fe 3
Si(
11
0)
Sand Casting (Al5TiB)
Sand Casting
Vacuum Die Casting
Gravity Die Casting
Squeeze Casting
Inte
nsi
ty
2theta
Figure 58. XRD results of casting for Fe3Si with indicated planes.

82
20 40 60 80 100
0
10000
20000
30000
-FeV
(21
1)
-FeV
(20
0)
-FeV
(11
0)
Sand Casting (Al5TiB)
Sand Casting
Vacuum Die Casting
Gravity Die Casting
Squeeze Casting
Inte
nsi
ty
2theta
Figure 59. XRD results of casting for FeV with indicated planes.
4.6. Thermal Analysis and Solid Fraction Calculations
Thermal analysis and solid fraction calculation experiment is applied to remelted
extruded billet of 7075 aluminum alloy at 0.25oC/s cooling rate and modified 7075
aluminum alloys at different cooling rates; 0.04oC/s, 0.25
oC/s and 0.38
oC/s. These
cooling rates are obtained during experiments. According to the experimental data
following graphs were obtained. The reason for experimenting modified 7075 alloy
is to modify semi solid castability properties of 7075 alloy. Modifications in the
chemical composition of the alloy were performed based on the study of Atkinson
[56].

83
4.6.1. Extrusion Billet of 7075 Aluminum Alloy at 0.25oC/s Cooling Rate
Variation of temperature against time for 7075 aluminum alloy at 0.25oC/s cooling
rate can be seen in Figure 60. Figure 61 and Figure 62 demonstrate first derivative
and solid fraction of solidifying 7075 aluminum alloy at 0.25oC/s cooling rate with
respect to time.
0 500 1000 1500 2000
400
600
800
Tem
pera
ture
(oC
)
Time (s)
Figure 60. Temperature vs. time graph of Extrusion billet of 7075 aluminum alloy
at 0.25oC/s cooling rate.

84
0 500 1000 1500 2000
-0.6
-0.3
0.0
Fir
st D
eri
vati
ve o
f C
oo
lin
g C
urv
e
Time (s)
Figure 61. First derivative 𝒅𝑻
𝒅𝒕 𝒄𝒄
vs. time graph of Extrusion billet of 7075
aluminum alloy at 0.25oC/s cooling rate.
632 600 568 536 504 4720.00
0.25
0.50
0.75
1.00
So
lid
Fra
cti
on
Temperature (oC)
0 200 400 600 800 1000
Time (s)
Figure 62. Solid fraction vs. temperature and time graph of Extrusion billet of 7075
aluminum alloy at 0.25oC/s cooling rate.

85
4.6.2. Modified 7075-1 Aluminum Alloy at 0.04oC/s Cooling Rate
Cooling curve for modified 7075-1 aluminum alloy at 0.04oC/s cooling rate can be
seen in Figure 63. Figure 64 and Figure 65 demonstrate first derivative and solid
fraction of solidifying modified 7075-1 aluminum alloy at 0.04oC/s cooling rate
with respect to time.
0 1000 2000 3000 4000450
484
518
552
586
620
Time (s)
Tem
pera
ture
(oC
)
Figure 63. Temperature vs. time graph of modified 7075-1 aluminum alloy with
0.04oC/s cooling rate.

86
Figure 64. First derivative 𝒅𝑻
𝒅𝒕 𝒄𝒄
vs. time graph of modified 7075-1 aluminum
alloy with 0.04oC/s cooling rate
612 591 570 549 528 507 486 4660
25
50
75
100
So
lid
Fra
cti
on
(%
)
Temperature (oC)
0 600 1200 1800 2400 3000 3600
Time (s)
Figure 65. Solid fraction (%) vs. temperature graph of modified 7075-1 aluminum
alloy with 0.04oC/s cooling rate.
0 1000 2000 3000 4000-0.10
-0.05
0.00
0.05
Fir
st D
eri
vati
ve o
f C
oo
lin
g C
urv
e
Time (s)
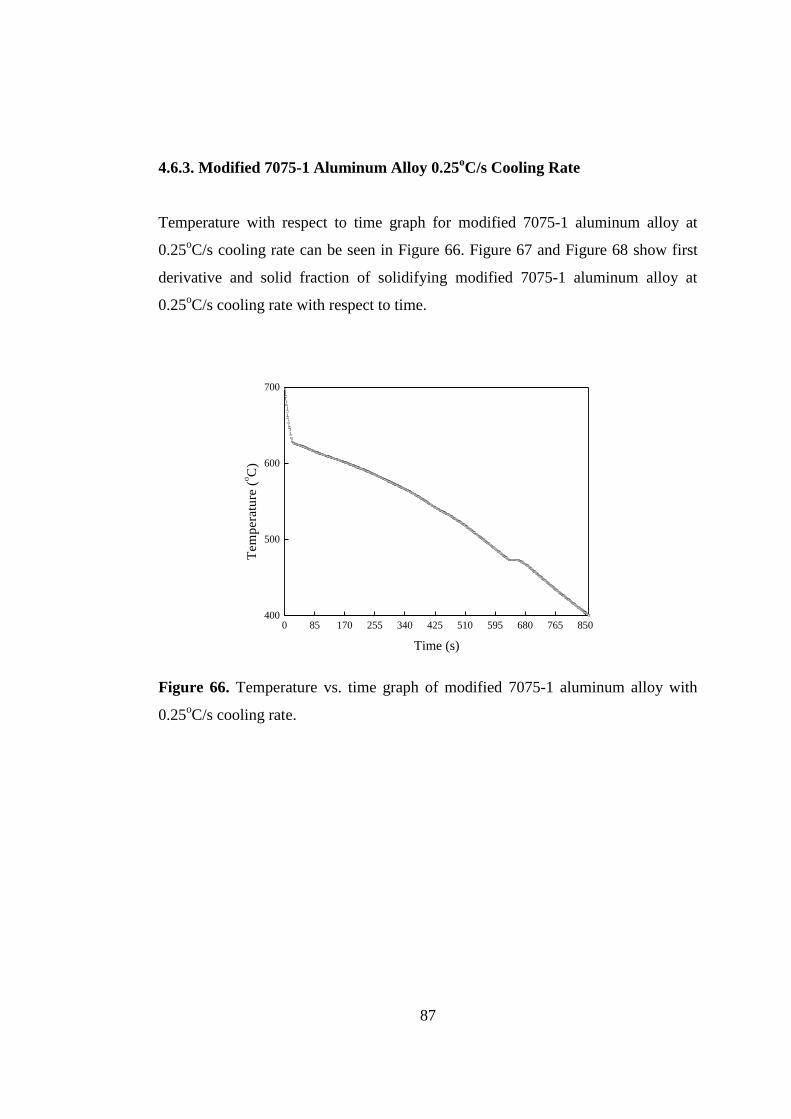
87
4.6.3. Modified 7075-1 Aluminum Alloy 0.25oC/s Cooling Rate
Temperature with respect to time graph for modified 7075-1 aluminum alloy at
0.25oC/s cooling rate can be seen in Figure 66. Figure 67 and Figure 68 show first
derivative and solid fraction of solidifying modified 7075-1 aluminum alloy at
0.25oC/s cooling rate with respect to time.
0 85 170 255 340 425 510 595 680 765 850400
500
600
700
Tem
pera
ture
(oC
)
Time (s)
Figure 66. Temperature vs. time graph of modified 7075-1 aluminum alloy with
0.25oC/s cooling rate.

88
0 100 200 300 400 500 600 700
-0.8
-0.6
-0.4
-0.2
0.0
0.2
Fir
st D
eri
vati
ve o
f C
oo
lin
g C
urv
e
Time (s)
Figure 67. First derivative 𝒅𝑻
𝒅𝒕 𝒄𝒄
vs. time graph of modified 7075-1 aluminum
alloy with 0.25oC/s cooling rate.
628 610 592 574 556 538 520 502 484 4660
20
40
60
80
100
So
lid
Fra
cti
on
(%
)
Temperature (oC)
0 100 200 300 400 500 600
Time (s)
Figure 68. Solid fraction (%) vs. temperature graph of modified 7075-1 aluminum
alloy with 0.25oC/s cooling rate
89
4.6.4. Modified 7075-2 Aluminum Alloy 0.38oC/s Cooling Rate
Cooling curve for modified 7075-2 aluminum alloy at 0.38oC/s cooling rate can be
seen in Figure 69. Figure 70 and Figure 71 illustrate first derivative and solid
fraction of solidifying modified 7075-2 aluminum alloy at 0.38oC/s cooling rate
with respect to time.
0 100 200 300 400 500 600 700 800
366
412
458
504
550
596
642
688
Tem
pera
ture
(oC
)
Time (s)
Figure 69. Temperature vs. time graph of modified 7075-2 aluminum alloy with
0.38oC/s cooling rate.

90
0 100 200 300 400 500 600 700 800
-0.8
-0.4
0.0
Fir
st D
eri
vati
ve o
f C
oo
lin
g C
urv
e
Time (s)
Figure 70. First derivative 𝒅𝑻
𝒅𝒕 𝒄𝒄
vs. time graph of modified 7075-2 aluminum
alloy with 0.38oC/s cooling rate.
621 571 521 4710.00
0.25
0.50
0.75
1.00
So
lid
Fra
cti
on
(%
)
Temperature (oC)
0 100 200 300 400 500
Time (s)
Figure 71. Solid fraction vs. temperature graph of modified 7075-2 aluminum alloy
with 0.38oC/s cooling rate.

91
Table 15 shows chemical composition differences between literature and this work.
Table 16 also shows critical temperatures of these works. As comparing same
cooling rates of different alloy, it can be concluded that liquidus temperature
decreases with increasing amount of Mg addition. It can be clearly seen that Zn and
Cu addition to the alloy can only have a decrease in liquidus temperature when
modified 7075-1 and modified 7075-2 alloys are compared. When these values are
compared with the literature data, they show some differences due to variation in
chemical compositions. Even though Ahmad shows that solidus and eutectic
temperatures are increasing with increasing cooling rate [56], in this experiment this
trend cannot be observed. This may be due to variation of surrounding temperature.
Since, variation of temperature during the environment can also affect cooling rates
and solid fraction [58].
Table 15. Literature comparison of chemical compositions of the alloys used at
thermal analysis experiments.
Source Zn
(wt. %)
Mg
(wt. %)
Cu
(wt. %)
Mn
(wt. %)
Fe
(wt. %)
Si
(wt. %)
Ti
(wt. %)
Al
(wt. %)
Modified
7075-1 5.97 4.85 1.55 0.06 0.43 0.34 0.04 86.4
Modified
7075-2 6.96 4.68 2.63 0.05 0.23 0.21 0.04 84.9
Bäckerud[59] - 2.49 1.36 - 0.28 0.11 - Bal.
Ahmad[57] 6.04 2.38 2.02 0.12 0.24 0.14 0.09 88.5
ASM[5] 5.1-
6.1
2.1-
2.9
1.2-
2.0 <0.3 <0.5 <0.4 <0.2
87.1-
91.4

92
Table 16. Literature comparison of thermal data obtained during thermal analysis
experiments.
Source Cooling
Rate(oC/s)
Liquidus
Temperature(oC)
Eutectic
Temperature(oC)
Solidus
Temperature(oC)
7075 0.25 631.2 478.1 473.8
Modified
7075-1 0.04 623.1 476.2 471.1
Modified
7075-1 0.25 628.2 473.2 466.5
Modified
7075-2 0.38 621.5 485.3 472.8
Ahmad[57] 0.03 639.9 470.2 467.6
Ahmad[57] 0.21 638.0 474.7 470.2
Ahmad[57] 0.41 638.2 477.2 472.8
Bäckerud[59] 0.30 630.0 469.0 469.0
Bäckerud[59] 0.70 630.0 470.0 470.0
ASM[5] 635.0 477.0
When 7075 and modified 7075-1 are compared with the same cooling rate, it can be
seen that liquidus temperature is almost the same. However, solidus and eutectic
temperatures are different.
4.7. Semi-Solid Casting with Vertical Pressure Die Casting
Processing of 7075 alloy was performed by semi-solid forming with vertical
squeeze casting press, there are three samples that are produced and T6 heat
treatment. First sample was processed at 580oC. This temperature corresponds to
0.8 solid fraction according to Figure 62. The thickness of the first sample is
reduced from 20 mm to 13.9 mm. The first sample also has hardness value as 180 ±
5 HB. Second sample is pressed at 595oC which corresponds to 0.67 solid fraction.
Thickness of the second sample was reduced from 20mm to 11.1 mm. This sample
has hardness value which is 173 ± 5 HB. Third sample was pressed at 605oC that
matches with 0.62 solid fraction value. Third sample has 158 ± 9 HB hardness value
and also 10.8 mm thickness.

93
Table 17. The process data of semi-solid casting with vertical squeeze casting.
Part
No.
Experimental
Temperature
(oC)
Solid
Fraction
Thickness
(mm)
Hardness
(HB)
UTS
(MPa)
Yield
Strength
(MPa)
Elongation
(%)
1 580 0.80 13.9 180 ± 5 246.6 212.5 2.6
2 595 0.67 11.1 173 ± 5 583.0 526.0 4.6
3 605 0.62 10.8 158 ± 9 302.0 292.0 0.9
It is seen from Table 17 that as solid fraction increases, formability (thickness
reduction) decreases. However, formability does not change after a certain point of
solid fraction. It can be observed that hardness values are decreasing with decrease
in solid fraction. This can be explained by second phase densities of specimens.
Furthermore, UTS and elongation values can be seen as 2nd
part has the highest
UTS and elongation values. However, 1st and 3
rd parts’ tensile tests are resulted in a
premature break due to cracks on the holding part of tensile specimens. On the other
hand, when 0.67 solid fraction has reached the target value of 505 MPa yield
strength and 150 HB hardness value were obtained. Table 18 illustrates a
comparison between values of reduction rates and hardness values and second
phase fractions. Figure 72, Figure 73, Figure 74 and Figure 75 are the SEM
photographs of parts. Precipitate size and distribution can be seen in these figures.
Table 18. Comparison between values of reduction rates, hardness values and
second phase densities.
Part No. Reduction Rate
(%) Hardness (HB)
Second Phase
Fraction (%)
1 30.5 180 ± 5 2.096
2 44.5 173 ± 5 1.534
3 46 158 ± 9 1.058

94
Figure 72. SEM picture of semi-solid casting specimen 1 at 580oC.
Figure 73. SEM picture of semi-solid casting specimen 2 at 595oC.

95
Figure 74. SEM picture of semi-solid casting specimen 3 at 605oC with 100x
magnification.
Figure 75. SEM picture of semi-solid casting specimen 3 at 605oC with 500x
magnification.

96
4.8. Pressure Die Casting
Pressure die casting experiment was done at just above liquidus temperature of
7075 which is about 630oC and then molten alloy was poured into the relatively
cold die which was below 250oC. It takes about 10-15 seconds to close the die and
squeeze the alloy. It is experienced that, 10 to 15 seconds cooling make great
differences to alloys temperature. If it is considered as cooling in an isolated
graphite pot, it would make its temperature just below liquidus. However, since
there are more surface area to cool the molten alloy, cooling rate will be higher.
From experience of modified 7075-2 with a cooling rate of 0.38oC/s, it can be
predicted that 1 or 2oC cooling occurs during processing which gives 4-8% solid
phase. This small amount of solid causes some problems like hot tear [60] or liquid
segregation [61] since it is assumed as thixoforming. 2 specimens are made by this
method. One of them is made from 7075 extrusion billet and the other one is made
from scrap 7075. Chemical composition differences between the two specimens are
given at Table 19. During macroscopic inspection of the specimens, it is seen that
problems like surface cracks, shrinkage and bad surface quality are observed.
However, blister was not observed after T6 heat treatment to the specimens. Since,
it not possible to make a tensile specimen due to the cracks, hardness values of
specimens were investigated.
Table 19. Comparison of chemical compositions of alloys produced during pressure
die casting experiments.
Specimen Zn
(wt. %)
Mg
(wt. %)
Cu
(wt. %)
Fe
(wt. %)
Si
(wt. %)
Al
(wt. %)
Extr. 7075 6.04 2.06 1.20 0.15 0.09 90.1
Scrap
7075 5.27 2.56 1.84 0.18 0.24 89.4

97
Table 20. Hardness values of pressure die cast samples.
Specimen Hardness (HB)
Extr. 7075 156 ± 11
Scrap 7075 175 ± 5
As can be seen from Table 20 hardness values are between 156 and 175 HB. This
hardness difference is believed due to the chemical composition differences and
heat distribution in the furnace during heat treatment. Because hardness values of
extruded 7075 show hardness value distribution from 144 HB to 173 HB.
Furthermore, T6 heat treatment may cause more precipitation, yielding MgZn2
intermetallic phase precipitate yielding higher hardness values [62].
4.9. Semi-Solid Metal Casting
In semi-solid metal casting experiment, 6 specimens from modified 7075-2 alloy
and two specimens of 7075 alloy were produced. Specimens were pressed at 620oC,
616 o
C, 602 o
C, 624 o
C, 613 o
C and at fully liquid state as modified 7075-2 alloy.
Also, two specimens of 7075 alloy are pressed at 630oC. These temperatures
correspond to 0.01, 0.265, 0.535, 0 and 0.351 solid fractions for modified 7075-2
and 0.04 to 0.075 solid fraction range for extruded 7075 alloy respectively. Then,
T6 heat treatment was applied to these at 480oC for 17 hours to solutionize and
121oC for 34 hours for artificial aging for modified 7075-2 alloy [162]. The same
T6 procedure (times and temperatures) were used for extruded 7075. After heat
treatment, it was observed that large amount of oxidation occurred on the specimens
(diameters of tensile specimens are enlarged from 19mm to approximately 20mm).
Even though there are large oxidation on the surface, tensile test could be made.
Ultimate tensile strength, elongation at break, pouring temperature and solid
fraction values are given in Table 21.

98
Table 21. Ultimate tensile strength, elongation at break, pouring temperature and
solid fraction values.
Specimen
Pouring
Temperature
(oC)
Solid
Fraction UTS (MPa)
Elongation at
Break (%)
1st of mod.
7075-2 620 0.010 145 6.56
2nd
of mod.
7075-2 616 0.265 115 7.69
3rd
of mod.
7075-2 602 0.535 196 11.45
4th
of mod.
7075-2 624 0 162 8.87
5th
of mod.
7075-2 613 0.351 165 6.42
6th
of mod.
7075-2 Above liquidus 0 207 5.91
1st of extr. 7075 630 0.040-0.075 268 4.16
2nd
of extr. 7075 630 0.040-0.075 185 4.71
After tensile test, it was observed that porosities exist in the specimens that cause
premature breaks. Moreover, 4th
specimen of modified 7075-2 alloy has a cavity in
the middle of structure. Furthermore, atomization during high pressure die casting
lets air entrapment porosities and cause blister problem after T6 heat treatment.

99
0.0 0.1 0.2 0.3 0.4 0.5 0.60
5
10
15
20
25
30
Polynomial Fit of Pore Density
Po
re D
en
sity
(%
)
Solid Fraction
Figure 76. Pore density vs. solid fraction graph of modified 7075-2 alloy produced
by semi solid metal casting.
0.0 0.1 0.2 0.3 0.4 0.5 0.6100
200
UTS
Best line of UTS
UT
S (
MP
a)
Solid Fraction
Figure 77. UTS vs. solid fraction graph of modified 7075-2 alloy produced by semi
solid metal casting.

100
It can be clearly seen from Figure 76 that, pore density of specimens decrease with
increasing solid fraction. This can be explained by micro liquid shrinkages
decreases as liquid amount decrease. Furthermore, Figure 77 shows that if low solid
fraction values are not included, higher solid fraction gives higher UTS values.
Since, solid fraction increase causes less porous microstructure.
4.10. Strain Induced Melt Activation (SIMA)
Ultrasonic stirring and mechanical stirring methods were used in this experiment.
Appearance of the pressed sample of mechanically stirred alloy was relatively
smoother than ultrasonic stirred specimen. However, there were little cracks on the
surface which can be seen by naked eyes. Hardness results of mechanical stirred
sample were found as 156 ± 6 HB. This hardness result shows that T6 heat
treatment was successfully applied. There were 2 tensile specimens machined from
disc shaped sample of mechanical stirring method. These samples were tested and
results are given in Table 22. According to tensile test results, it can be interpreted
that even though target tensile strength could not be reached, mechanical stirring
method provided satisfactory results. However, it can be seen that elongation result
is fairly lower than target elongation value.
It was observed that ultrasonic stirring caused molten alloy to cool faster due to
vibration in the mold which gave more homogenized temperature distribution
through the air cooled copper mold and led a higher cooling rate [63, 64].
Appearance of ultrasonic stirred specimen was poor with respect to mechanical
stirred specimen. There were deep crack on the surface. It is believed that higher
liquid fraction caused this cracks during pressing. However, 2 tensile test specimens
were removed from ultrasonic stirred disc shaped sample. One of the test
specimens had a large crack that cannot be tested. Other tensile test specimen was
tested but, it failed prematurely due to a small crack which could not be noticed.

101
However, tensile test results can be seen in Table 22. Hardness test was conducted
on specimens and it resulted as 151 ± 12 HB. This hardness test result is coherent
with target hardness value. Moreover, high standard derivation value is a result of
cracked structure of disc shaped specimen.
Table 22. Tensile test results of SIMA experiment.
Ultrasonic Stirring Mechanical Stirring
UTS (MPa) 211 397 ± 32
YS (MPa) - 343 ± 31
EL% 1.6 3 ± 0.3
Grain size analysis performed on specimens of both methods. Ultrasonic stirred
specimen yielded 70 µm average grain size. On the other side, mechanical stirred
specimen had average grain size as 78 µm. It can be concluded that ultrasonic
stirring provide 10% finer grains than mechanically stirring. Figure 78 and Figure
79 shows microstructure images which were obtained by optical microscopy with
100x magnification. Furthermore, SEM images of samples can be seen in Figure 80,
Figure 81 and Figure 82.
Figure 78. Microstructure image of ultrasonic stirred specimen (100x)
150 µm

102
Figure 79. Microstructure image of mechanical stirred specimen (100x).
Figure 80. SEM image of mechanical stirred specimen (100x).
150 µm

103
Figure 81. SEM image of mechanical stirred specimen (100x).
Figure 82. SEM image of mechanical stirred specimen (750x).

104

105
CHAPTER 5
CONCLUSIONS
To replace extruded, T6 heat treated and machined 7075 rifle receiver body with as
cast and T6 heat treated perform that requires less machining before to be used as
rifle mechanism body receiver, several casting methods and heat treatments were
experimentally practiced to achieve a near net shape product without blistering
problem after T6 heat treatment in this work. Main focus is on to achieve high
hardness and tensile properties of cast and heat treated alloy. Pore densities and
average grain size of specimens were obtained to assess their direct effect on tensile
properties. Solid fractions were calculated via Newtonian thermal analysis method
for semi-solid casting. Moreover, the effect of grain refinement and vacuum
application were observed during experiments. After these experiments, following
statements were concluded:
1. Vacuum assisted permanent die casting improves hardness values of the
specimen while slightly decreasing average grain size to 38 µm. Vacuum
helps decreasing pore density which cause increase in hardness. Vacuum
also helps the molten alloy to solidify faster by decreasing average grain
size. Moreover, no blister was observed after T6 heat treatment.
2. Al5TiB usage as grain refiner results with finer grain and slightly higher
hardness. It was observed that 0.18% additive of Al5TiB to molten alloy
resulted 24.5% finer grains in sand casting. Furthermore, hardness increased
by 6%.
3. Mg addition to the alloy decreases the liquidus temperature by 8-10 oC. As
comparison is made between same cooling rate and different chemical
composition, it can be seen that good correlations could be obtained with

106
work of Ahmad. Hence, Zn amounts of modified 7075-1 and Ahmad are
identical, it can be seen that Mg is the only distinctive element.
4. Blistering was observed after heat treatment of high pressure die casting and
squeeze casting samples which can decrease tensile properties of samples
even though squeeze casting provides lower grain size.
5. Optimum solid fraction was found to be 0.67 in semi-solid casting for 7075
aluminum alloy. Processing temperature 595oC corresponds to 0.67 solid
fraction according to the Newtonian thermal analysis results. 583 MPa UTS,
526 MPa yield strength, 4.6% elongation and 173.4 HB were obtained at
this solid fraction which is close to extruded 7075-T6 alloy.
6. Increasing solid fraction, UTS values are also increasing and pore density
were found to be decreasing. Semi-solid casting samples showed that UTS
values are improved with increase in solid fraction causing decrease in pore
density.
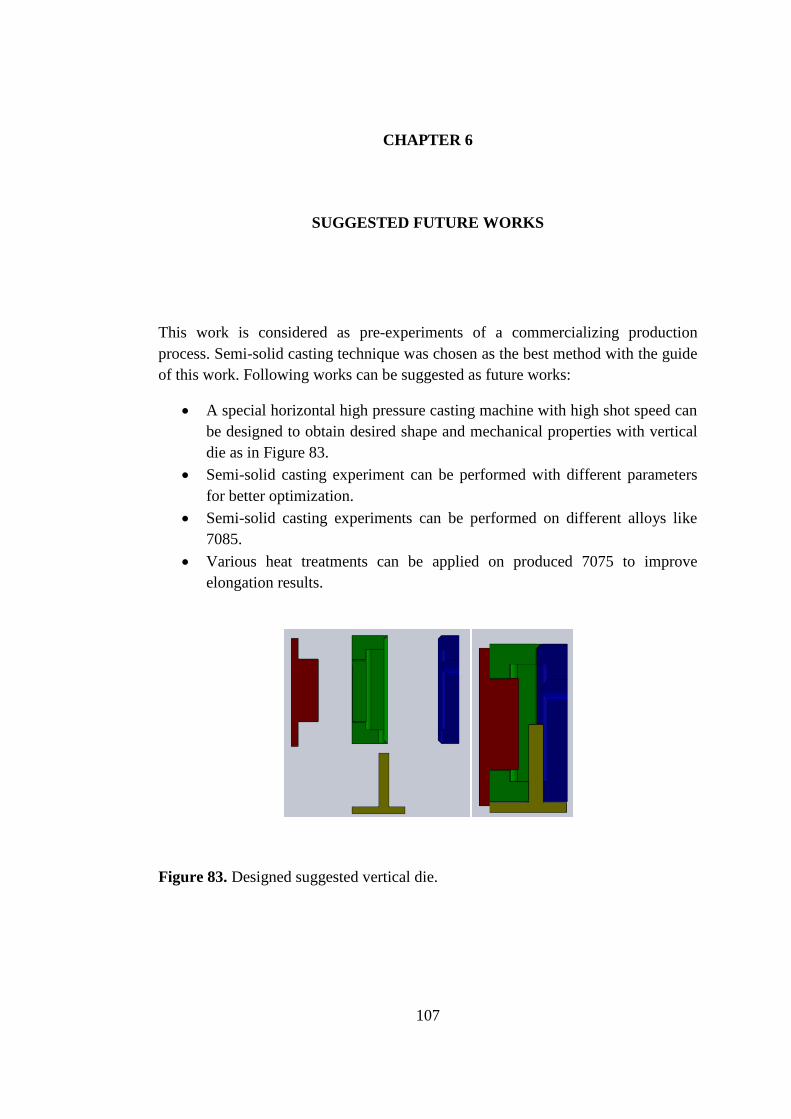
107
CHAPTER 6
SUGGESTED FUTURE WORKS
This work is considered as pre-experiments of a commercializing production
process. Semi-solid casting technique was chosen as the best method with the guide
of this work. Following works can be suggested as future works:
A special horizontal high pressure casting machine with high shot speed can
be designed to obtain desired shape and mechanical properties with vertical
die as in Figure 83.
Semi-solid casting experiment can be performed with different parameters
for better optimization.
Semi-solid casting experiments can be performed on different alloys like
7085.
Various heat treatments can be applied on produced 7075 to improve
elongation results.
Figure 83. Designed suggested vertical die.

108

109
REFERENCES
1. Davis, J. R. and Associates, Aluminum and Aluminum Alloys Handbook.
Prepared under the direction of the ASM International Handbook Commitee, 1993,
Materials Park, OH.: ASM International.
2. Totten, G., & MacKenzie, D. (2003). Handbook of Aluminum: Physical
Metallurgy and Processes. (Vol. 1). Marcel Dekker.
3. M.F. Ashby, Materials Selection in Mechanical Design, 3rd Edition, 2005,
Elsevier Butterworth-Heinemann.
4. Walker, R. (2013). Cartridges and Firearm Identifications. 1st ed. Boca Raton:
CRC Press.
5. ASM Handbook, Volume 02 - Properties and Selection: Nonferrous Alloys and
Special-Purpose Materials. (1990). S.l.: ASM International.
6. Aluminum Association. (2006). International alloy designations and chemical
composition limits for wrought aluminum and wrought aluminum alloys. The
Aluminum Association, Arlington, Virginia. Revised 2009.
7. Mueller L., Suffredini L., Bush D. (2006) Alcoa Green Letter Volume I: Alcoa
7085 Die Forgings. Cleveland, OHIO.
8. Handbook, A. S. M. (1991). Heat treating, vol. 4. ASM International, Materials
Park, OH, 860.
9. Verhoeven, J. (1975). Fundamentals of physical metallurgy. New York: Wiley.
10. Totten, G. E., Xie, L., & Funatani, K. (2003). Handbook of mechanical alloy
design (Vol. 164). CRC Press.
11. ASTM B918/B918M-09, “Standard Practice for Heat Treatment of Wrought
Aluminum Alloys”, ASTM International, West Conshohocken, PA, www.astm.org.
12. Emadi, D., Whiting, L. V., Nafisi, S., & Ghomashchi, R. (2005). Applications
of thermal analysis in quality control of solidification processes. Journal of thermal
analysis and calorimetry, 81(1), 235-242.

110
13. Phase Transitions and Differential Scanning Calorimetry. (n.d.). Retrieved
December 13, 2014, from http://www.dartmouth.edu/~pchem/75/pdfs/DSC.pdf.
Last accessed on May 01, 2015.
14. Çetin, A. (2008) Assessment and modelling of particle clustering in cast
aluminum matrix composites, Middle East Technical University, Ankara, Turkey.
15. David Adrian, course materials for 10.37 Chemical and Biological Reaction
Engineering, Spring 2007. MIT OpenCourseWare (http://ocw.mit.edu),
Massachusetts Institute of Technology. Downloaded on [14 December 2014].
16. Emadi, D., & Whiting, L. V. (2002). Determination of solidification
characteristics of Al-Si alloys by thermal analysis. Transactions of the American
Foundry Society, Vol. 110: Part 1, 285-296.
17. Fan, Z. Semisolid Metal Processing. Int. Mater. Rev. 2002, 47 (2), 49–85.
18. Flemings, M. C. Semi-solid Forming: The Process and the Path Forward.
Metall. Sci. Technol. 2000, 18 (2), 3–4.
19. Ube Industries Ltd, Thixoforming Technical Information Bulletin: Japan.
20. Hashmi, S. (2014). Comprehensive Materials Processing. Vol 5. Newnes.
http://dx.doi.org/10.1016/B978-0-08-096532-1.00516-1. Last accessed on May 01,
2015.
21. Zhou, Y., Lu, J., Saluja, N. S., Riviere, V. A. (2000). Process for Producing Fine
Grained Metal Compositions Using Continuous Extrusion for Semi-solid Forming
of Shaped Articles. US Patent 6,120,625.
22. Kirkwood, D. H., Sellars, C. M., Boyed, L. G. E. (1992). Thixotropic Materials,
US Patent 5,133.811.
23. Hirt, G., Kopp, R. (2009). Thixoforming: Semi-solid Metal Processing; Wiley-
VCH Verlag GmbH & Co. KGaA: Weinheim.
24. Rassili, A., Geuzaine, C., Legros, W., Bobadilla, M., Cucatto, A., Robelet, M.,
Abdelfattah, S., Dohmann, J., Haornradt, C. H. (2000). Simulation of Adequate
Inductive Heating Parameters and Magneto-thermal Coupling Involved in the SSM
Processing of Steels. In Proceedings of the 6th International Conference on Semi-
solid Processing of Alloys and Composites, Turin, Italy, pp 559–564.
25. ASM Handbook (2008). ASM International: Ohio, USA, Vol. 15, pp 761–782.

111
26. Flemings, M. C., Martinez, R. A. (2006). Principles of Microstructure
Formation in Semi-solid Metal Processing. In Proceedings of the 9th International
Conference on Semi-solid Processing of Alloys and Composites, Busan, Korea; pp
1–8.
27. Haga, T., Suzuki, S. (2001). Casting of Aluminium Alloy Ingots for
Thixoforming Using a Cooling Slope. J. Mater. Process. Technol. 118, 169–172.
28. Haga, T. (2001). Semi-solid Roll Casting of Aluminium Alloy Strip by Melt
Drag Twin Roll Caster. J. Mater. Process. Technol. 111, 64–68.
29. Sakamoto, K., Hamazoe, N., Ohwada, K., Suzuki, A. (2004). Method and
Apparatus for Manufacturing Semi-solidified Metal. European Patent EP 1050353,
issued November 24, 2004.
30. Kuroki, K., Suenaga, T., Tanikawa, H., Masaki, T., Suzuki, A., Umemoto, T.,
Yamazaki, M. (2004). Establishment of a Manufacturing Technology for the High
Strength Aluminum Cylinder Block in Diesel Engines Applying a Rheocasting
Process. In Proceedings of the 8th International Conference on Semi Solid
Processing of Alloys and Composites, Limassol, Cyprus.
31. Yurko, J. A., Martinez, R. A., Flemings, M. C. (2002). Development of the
Semi-solid Rheocasting (SSR) Process. In Proceedings of the 7th International
Conference on Semi-solid Processing of Alloys and Composites, Tsukuba, Japan.
pp 659–664.
32. Martinez, R. A., Flemings, M. C. (2005). Evolution of Particle Morphology in
Semi-solid Processing. Metall. Mater. Trans. A, 36 (8), 2205–2210.
33. Kaneuchi, T., Shibata, R., Ozawa, M. (2002). Development of New Semi-solid
Metal Casting Process for Automotive Suspension Parts. In Proceedings of the 7th
International Conference on Semi-solid Processing of Alloys and Composites,
Tsukuba, Japan; September; pp 145–150.
34. Hollinggrak, J. Casting Metals. UK Patent n. 4371, 1819.
35. Chernov, D. K. Reports of the Imperial Russian Metallurgical Society, 1878.
36. Ghomashchi, M. R., Vikhrov, A. (2000). Squeeze Casting: An Overview. J.
Mater. Process. Technol. 101, 1–9.

112
37. Hu, H. (1998). Squeeze Casting of Magnesium Alloys and Their Composites. J.
Mater. Sci., 33 (6), 1579–1589.
38. Czerwinski, F. (2008). Magnesium Injection Molding; Springer, November 4,
pp 56–57.
39. Stefanescu, D. M. (1998). Casting.; 9th ed. In: ASM Handbook , Vol. 15; ASM
International, 323–326.
40. Clyne, T. W., Withers, P. J. (1995). An Introduction to Metal Matrix
Composites; Cambridge University Press, pp 321–325.
41. Kaufmann, H., Uggowitze, P. J. (2007). Metallurgy and Processing of High
Integrity Light Metal Pressure Castings; Fachverlag Schiele & Schoen GmbH, pp
49–62.
42. Kaufman, J.G., Rooy, E.L., (2004) Aluminum Alloy Castings: Properties,
Processes, and Applications, 29.
43. Friedrich, H. E., Mordike, B. L. (2006). Magnesium Technology: Metallurgy,
Design Data, Applications; Springer, 259–261.
44. Kainer, K. U. (2003). Magnesium Alloys and Technologies; Wiley-VCH, pp
58–66.
45. Campbell, J. (2011). Complete Casting Handbook: Metal Casting Processes,
Techniques and Design; Butterworth-Heinemann, pp 991–995.
46. Chakrabarti, A. K. (2005). Casting Technology and Cast Alloys; Prentice-Hall
of India Pvt. Ltd, pp 124–126.
47. Rajagopal, S. (1981). Squeeze Casting: A Review and Update. J. Appl.
Metalwork, ASM, 1 (4), 3–14.
48. Franklin, J. R., Das, A. A. (1984). Squeeze Casting – A Review of the Status.
Br. Foundrymen, 77, 150–160.
49. Fujii, N., Okada, S., Morimoto, S., Fujii, M. (1984). Mass Effect of Al-8%Si
Alloy in Squeeze Casting. J. Jpn. Inst. Light Met. 34, 446–453.
50. Handbook, A. S. M. (2008). Volume 15 Casting. Materials Park: ASM
International.

113
51. Alat, E (2012) Analysis Of Magnesium Addition, Hydrogen Porosity And T6
Heat Treatment Effects On Mechanical And Microstructural Properties Of Pressure
Die Cast 7075 Aluminum Alloy, Middle East Technical University, Ankara, Turkey.
52. ASTM B557M - 10 Standard Test Methods for Tension Testing Wrought and
Cast Aluminum- and Magnesium-Alloy Products.
53. OKCU, I. Y. (2011) Effect Of Process Parameters On Mechanical Properties
Of High Pressure Die Cast Magnesium Az91 Components, Middle East Technical
University, Ankara, Turkey.
54. ASTM E 10 - 01 Standard Test Method for Brinell Hardness of Metallic
Materials.
55. Kim, S. W., Kim, D. Y., Kim, W. G., & Woo, K. D. (2001). The study on
characteristics of heat treatment of the direct squeeze cast 7075 wrought Al
alloy. Materials Science and Engineering: A, 304, 721-726.
56. H. Atkinson, (2003). “Alloy Development for Thixoforming” Final Report for
GR/M89096/01: 2003.
57. A.H.Ahmad, S.Naher, and D.Brabazon. (2013). "Thermal Profiles and Fraction
Solid of Aluminium 7075 at Different Cooling Rate Conditions." Key Engineering
Materials 554: 582-595.
58. J. W. Gibbs and P.F. Mendez, (2008). “Solid Fraction Measurement Using
Equation Based Cooling Curve Analysis”, Scripta Materialia 58 (2008) 699–702.
59. L. Backerud, G. Chai, J. Tamminen, (1991). Solidification Characteristics of
Aluminum Alloys. Volume 2: Foundry Alloys. University of Stockholm.
60. D. Liu, H.V. Atkinson, P. Kapranos, W. Jirattiticharoean, H. Jones, (2003).
Mater. Sci. Eng. A361, 213.
61. S. Chayong, H.V. Atkinson, P. Kapranos, (2005). “Thixoforming 7075
aluminium alloys” Materials Science and Engineering A 390, 3–12.
62. A.D. Isadare, B. Aremo, M. O. Adeoye, O. J. Olawale, M. D. Shittu., (2013).
“Effect of Heat Treatment on Some Mechanical Properties of 7075 Aluminium
Alloy”, Materials Research; 16(1): 190-194.
63. Abu-Dheir N., Khraisheh M., Saito K., Male A. (2005), Mater. Sci. Engg. A,
vol A393w, pp 109-117.

114
64. Abu-Dheir N (2004), Solidification of aluminum alloys, TMS, pp 361-368

115
APPENDIX A
TENSILE TEST ANALYSIS
Figure 841. Tensile test results of squeeze casting experiment.
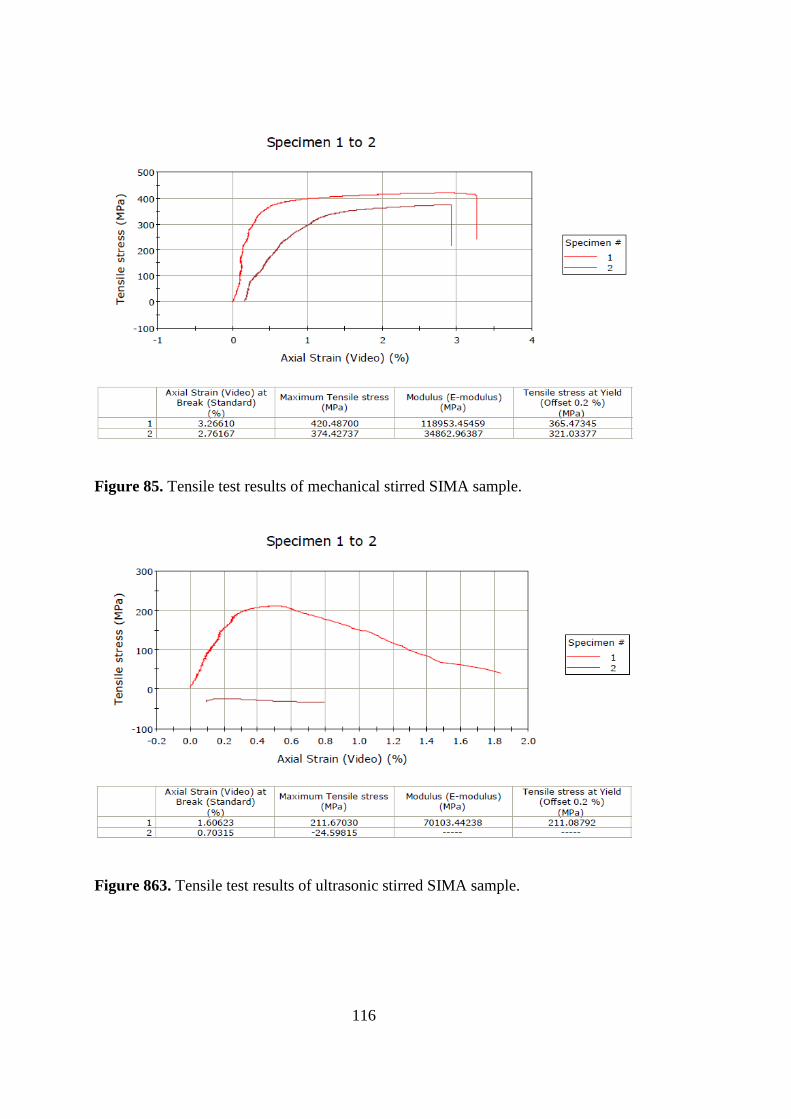
116
Figure 85. Tensile test results of mechanical stirred SIMA sample.
Figure 863. Tensile test results of ultrasonic stirred SIMA sample.

117
Figure 87. Tensile test results of semi-solid forming with vertical pressure die
casting samples (Specimen 2: 1st test sample, specimen 3: 2
nd test sample, specimen
4: 3rd
test sample and specimen 1 is a failed sample.).

118
Figure 88. Tensile test result of sand casting specimen.

119
Figure 89. Tensile test result of sand casting with Al5TiB additive specimen.

120
Figure 90. Tensile test result of vacuum assisted gravity die casting experiment
specimen.

121
Figure 91. Tensile test results of gravity die casting experiment specimen.

122
Figure 92. Tensile test results of semi-solid injection molding experiment 1st of
extr. 7075 specimen.

123
Figure 9310. Tensile test results of semi-solid injection molding experiment 2nd
of
extr. 7075 specimen.

124
Figure 94. Tensile test results of semi-solid injection molding experiment 6th
of
mod. 7075 specimen.

125
Figure 9512. Tensile test results of semi-solid injection molding experiment 1st of
mod. 7075 specimen.

126
Figure 96. Tensile test results of semi-solid injection molding experiment 2nd of
mod. 7075 specimen.

127
Figure 97. Tensile test results of semi-solid injection molding experiment 3rd of
mod. 7075 specimen.

128
Figure 9815. Tensile test results of semi-solid injection molding experiment 4th of
mod. 7075 specimen.

129
Figure 99. Tensile test results of semi-solid injection molding experiment 5th of
mod. 7075 specimen.

130
131
APPENDIX B
GRAIN SIZE ANALYSIS
Field Avrg. Intercept No Avrg. Dia.(mm)
Avrg Grain
Area(mm) Avrg Grain No
GF 1 1034.598214Micron 30.950000Micron 6.5MicronSqr 1220.000000Micron
GF 2 3873.883929Micron 52.100000Micron 5.0MicronSqr 3440.000000Micron
GF 3 639.508929Micron 21.900000Micron 7.5MicronSqr 608.500000Micron
GF 4 190.848214Micron 13.000000Micron 9.0MicronSqr 215.000000Micron
GF 5 3073.660714Micron 52.100000Micron 5.0MicronSqr 3440.000000Micron
GF 6 4643.973214Micron 61.950000Micron 4.5MicronSqr 4865.000000Micron
GF 7 2986.607143Micron 52.100000Micron 5.0MicronSqr 3440.000000Micron
Figure 100. Grain size analysis of squeeze casting sample.

132
GF 8 1811.383929Micron 36.800000Micron 6.0MicronSqr 1725.000000Micron
GF 9 3405.133929Micron 52.100000Micron 5.0MicronSqr 3440.000000Micron
GF 10 1811.383929Micron 36.800000Micron 6.0MicronSqr 1725.000000Micron
GF 11 3287.946429Micron 52.100000Micron 5.0MicronSqr 3440.000000Micron
GF 12 1118.303571Micron 30.950000Micron 6.5MicronSqr 1220.000000Micron
GF 13 190.848214Micron 13.000000Micron 9.0MicronSqr 215.000000Micron
GF 14 1359.375000Micron 30.950000Micron 6.5MicronSqr 1220.000000Micron
GF 15 833.705357Micron 26.850000Micron 7.0MicronSqr 861.500000Micron
Figure B.1. (Continued)
Field Avrg. Intercept No Avrg. Dia.(mm)
Avrg Grain
Area(mm) Avrg Grain No
GF 2 2681.91964 Micron 43.800000Micron 5.5MicronSqr 2435.000000Micron
GF 3 1617.187500Micron 36.800000Micron 6.0MicronSqr 1725.000000Micron
Figure 101. Grain size analysis of vacuum assisted die casting sample.

133
GF 4 3254.464286Micron 52.100000Micron 5.0MicronSqr 3440.000000Micron
GF 5 1419.642857Micron 30.950000Micron 6.5MicronSqr 1220.000000Micron
GF 6 1643.973214Micron 36.800000Micron 6.0MicronSqr 1725.000000Micron
GF 7 2189.732143Micron 43.800000Micron 5.5MicronSqr 2435.000000Micron
GF 8 3016.741071Micron 52.100000Micron 5.0MicronSqr 3440.000000Micron
GF 9 2434.151786Micron 43.800000Micron 5.5MicronSqr 2435.000000Micron
GF 10 4175.223214Micron 61.950000Micron 4.5MicronSqr 4865.000000Micron
GF 11 683.035714Micron 21.900000Micron 7.5MicronSqr 608.500000Micron
GF 12 231.026786Micron 13.000000Micron 9.0MicronSqr 215.000000Micron
GF 13 492.187500Micron 18.400000Micron 8.0MicronSqr 430.000000Micron
GF 14 1935.267857Micron 36.800000Micron 6.0MicronSqr 1725.000000Micron
GF 15 1727.678571Micron 36.800000Micron 6.0MicronSqr 1725.000000Micron
GF 16 2333.705357Micron 43.800000Micron 5.5MicronSqr 2435.000000Micron
Figure B.2. (Continued).

134
Field Avrg. Intercept No Avrg. Dia.(mm)
Avrg Grain
Area(mm) Avrg Grain No
GF 1 4834.821429Micron 61.950000Micron 4.5MicronSqr 4865.000000Micron
GF 2 6518.973214Micron 73.650000Micron 4.0MicronSqr 6880.000000Micron
GF 3 662.946429Micron 21.900000Micron 7.5MicronSqr 608.500000Micron
GF 4 2186.383929Micron 43.800000Micron 5.5MicronSqr 2435.000000Micron
GF 5 1185.267857Micron 30.950000Micron 6.5MicronSqr 1220.000000Micron
GF 6 2973.214286Micron 52.100000Micron 5.0MicronSqr 3440.000000Micron
GF 7 438.616071Micron 18.400000Micron 8.0MicronSqr 430.000000Micron
GF 8 2250.000000Micron 43.800000Micron 5.5MicronSqr 2435.000000Micron
GF 9 1309.151786Micron 30.950000Micron 6.5MicronSqr 1220.000000Micron
GF 10 984.375000Micron 26.850000Micron 7.0MicronSqr 861.500000Micron
GF 11 2768.973214Micron 43.800000Micron 5.5MicronSqr 2435.000000Micron
GF 12 1181.919643Micron 30.950000Micron 6.5MicronSqr 1220.000000Micron
GF 13 518.973214Micron 21.900000Micron 7.5MicronSqr 608.500000Micron
GF 14 475.446429Micron 18.400000Micron 8.0MicronSqr 430.000000Micron
GF 15 2651.785714Micron 43.800000Micron 5.5MicronSqr 2435.000000Micron
GF 16 924.107143Micron 26.850000Micron 7.0MicronSqr 861.500000Micron
GF 17 2404.017857Micron 43.800000Micron 5.5MicronSqr 2435.000000Micron
GF 18 6087.053571Micron 73.650000Micron 4.0MicronSqr 6880.000000Micron
GF 19 4486.607143Micron 61.950000Micron 4.5MicronSqr 4865.000000Micron
GF 20 4978.794643Micron 61.950000Micron 4.5MicronSqr 4865.000000Micron
Figure 102. Grain size analysis of gravity die casting sample.

135
Field Avrg. Intercept No Avrg. Dia.(mm)
Avrg Grain
Area(mm) Avrg Grain No
GF 1 14842.633929Micron 104.100000Micron 3.0MicronSqr 13750.000000Micron
GF 2 11608.258929Micron 104.100000Micron 3.0MicronSqr 13750.000000Micron
GF 3 8055.803571Micron 73.650000Micron 4.0MicronSqr 6880.000000Micron
GF 4 15914.062500Micron 104.100000Micron 3.0MicronSqr 13750.000000Micron
GF 5 683.035714Micron 21.900000Micron 7.5MicronSqr 608.500000Micron
GF 6 30030.133929Micron 147.250000Micron 2.0MicronSqr 27550.000000Micron
GF 7 8902.901786Micron 87.550000Micron 3.5MicronSqr 9730.000000Micron
GF 8 659.598214Micron 21.900000Micron 7.5MicronSqr 608.500000Micron
GF 9 27110.491071Micron 147.250000Micron 2.0MicronSqr 27550.000000Micron
GF 10 7088.169643Micron 73.650000Micron 4.0MicronSqr 6880.000000Micron
GF 11 14621.651786Micron 104.100000Micron 3.0MicronSqr 13750.000000Micron
GF 12 11162.946429Micron 87.550000Micron 3.5MicronSqr 9730.000000Micron
GF 13 5601.562500Micron 61.950000Micron 4.5MicronSqr 4865.000000Micron
GF 14 27689.732143Micron 147.250000Micron 2.0MicronSqr 27550.000000Micron
GF 15 30991.071429Micron 147.250000Micron 2.0MicronSqr 27550.000000Micron
Figure 103. Grain size analysis of sand casting sample.

136
GF 16 6020.089286Micron 73.650000Micron 4.0MicronSqr 6880.000000Micron
GF 17 20045.758929Micron 123.800000Micron 2.5MicronSqr 19450.000000Micron
GF 18 20708.705357Micron 123.800000Micron 2.5MicronSqr 19450.000000Micron
GF 19 17531.250000Micron 123.800000Micron 2.5MicronSqr 19450.000000Micron
GF 20 10295.758929Micron 87.550000Micron 3.5MicronSqr 9730.000000Micron
Figure B.4. (Continued).
Field Avrg. Intercept No Avrg. Dia.(mm)
Avrg Grain
Area(mm) Avrg Grain No
GF 1 10463.169643Micron 87.550000Micron 3.5MicronSqr 9730.000000Micron
GF 2 7955.357143Micron 73.650000Micron 4.0MicronSqr 6880.000000Micron
GF 3 6883.928571Micron 73.650000Micron 4.0MicronSqr 6880.000000Micron
GF 4 1664.062500Micron 36.800000Micron 6.0MicronSqr 1725.000000Micron
GF 5 6331.473214Micron 73.650000Micron 4.0MicronSqr 6880.000000Micron
GF 6 518.973214Micron 21.900000Micron 7.5MicronSqr 608.500000Micron
Figure 104. Grain size analysis of sand casting with Al5TiB additive sample.

137
GF 7 5357.142857Micron 61.950000Micron 4.5MicronSqr 4865.000000Micron
GF 8 9164.062500Micron 87.550000Micron 3.5MicronSqr 9730.000000Micron
GF 9 3324.776786Micron 52.100000Micron 5.0MicronSqr 3440.000000Micron
GF 10 3254.464286Micron 52.100000Micron 5.0MicronSqr 3440.000000Micron
GF 11 5116.071429Micron 61.950000Micron 4.5MicronSqr 4865.000000Micron
GF 12 21529.017857Micron 123.800000Micron 2.5MicronSqr 19450.000000Micron
GF 13 10376.116071Micron 87.550000Micron 3.5MicronSqr 9730.000000Micron
GF 14 10767.857143Micron 87.550000Micron 3.5MicronSqr 9730.000000Micron
GF 15 11169.642857Micron 87.550000Micron 3.5MicronSqr 9730.000000Micron
GF 16 7808.035714Micron 73.650000Micron 4.0MicronSqr 6880.000000Micron
GF 17 1024.553571Micron 30.950000Micron 6.5MicronSqr 1220.000000Micron
GF 18 16677.455357Micron 123.800000Micron 2.5MicronSqr 19450.000000Micron
GF 19 4895.089286Micron 61.950000Micron 4.5MicronSqr 4865.000000Micron
GF 20 19312.500000Micron 123.800000Micron 2.5MicronSqr 19450.000000Micron
GF 21 2514.508929Micron 43.800000Micron 5.5MicronSqr 2435.000000Micron
GF 22 15803.571429Micron 104.100000Micron 3.0MicronSqr 13750.000000Micron
Figure B.5. (Continued).

138
Field
Avrg, Intercept
No Avrg, Dia,(mm)
Avrg Grain
Area(mm) Avrg Grain No
GF 1 5574.78 61.95 4.50 4865.00
GF 2 8691.96 87.55 3.50 9730.00
GF 3 8162.95 87.55 3.50 9730.00
GF 6 5812.50 73.65 4.00 6880.00
GF 7 5809.15 73.65 4.00 6880.00
GF 8 7386.16 73.65 4.00 6880.00
GF 9 6522.32 73.65 4.00 6880.00
GF 10 4898.44 61.95 4.50 4865.00
GF 11 542.41 21.90 7.50 608.50
GF 12 5822.54 73.65 4.00 6880.00
GF 13 8179.69 87.55 3.50 9730.00
GF 14 4546.88 61.95 4.50 4865.00
GF 15 5949.78 73.65 4.00 6880.00
GF 16 17531.25 123.80 2.50 19450.00
Figure 105. Grain size analysis of mechanical stirred SIMA sample.
139
Field
Avrg, Intercept
No Avrg, Dia,(mm)
Avrg Grain
Area(mm) Avrg Grain No
GF 1 11092.6 87.55 3.5 9730
GF 2 9277.9 87.55 3.5 9730
GF 3 11939.7 104.1 3 13750
GF 4 6231 73.65 4 6880
GF 5 10195.3 87.55 3.5 9730
GF 6 9890.6 87.55 3.5 9730
GF 7 2089.2 43.8 5.5 2435
GF 8 5005.5 61.95 4.5 4865
GF 9 3154 52.1 5 3440
GF 10 1366 30.95 6.5 1220
GF 11 8350.4 87.55 3.5 9730
GF 12 2377.2 43.8 5.5 2435
GF 13 2725.4 43.8 5.5 2435
GF 14 2789 43.8 5.5 2435
GF 15 5393.9 61.95 4.5 4865
Figure 106. Grain size analysis of ultrasonic stirred SIMA sample.

140
GF 16 4272.3 61.95 4.5 4865
GF 17 847 26.85 7 861.5
GF 18 7349.3 73.65 4 6880
GF 19 17641.7 123.8 2.5 19450
GF 20 16808 123.8 2.5 19450
GF 21 887.2 26.85 7 861.5
GF 22 3234.3 52.1 5 3440
GF 23 1376.1 30.95 6.5 1220
GF 24 20842.6 123.8 2.5 19450
GF 25 13841.5 104.1 3 13750
Figure B.7. (Continued).

141
APPENDIX C
MATHLAB ALGORITHM
“New variable” from workspace
Insert cooling curve data into this variable file (T vs. t), let’s name it “A”
Start → Toolboxes → Curve Fitting → Curve Fitting Tool
Data;
Data Sets;
Y Data → Choose “A”
X Data → Choose none
Create Data Set
Smooth;
Original Data Set: “A”
Method: Moving Average
Span: Odd number greater than 0 and less than or
equal to the length of X. (It can be preferred as 5 or
11.)
Create smoothed data set
Close
Fitting;
New Fit → Choose “Data Set” as A(smooth)
Type of fit : Smoothing Spline
Apply
Close
Analysis;
Fit to analyze : Fit 1 (A)
142
Analyze at Xi = 1:1:?
Evaluate fix at Xi
Prediction and confidence bounds : None
1st derivative at Xi
Apply
Save to workspace
Close
In workspace, double click your “analysisresults1”, open “dydx” file and
copy data
Click new variable and paste data here. Rename the file as “dTdt”
Start → Toolboxes → Curve Fitting → Curve Fitting Tool
Data;
Data Sets;
Y Data → Choose “dTdt”
X Data → Choose “none”
Create Data Set
Smooth;
Original Data Set: “dTdt”
Method: Moving Average
Span: Odd number greater than 0 and less than or
equal to the length of X. (It can be preferred as 5 or
11.)
Create smoothed data set
Close
Exclude;
Exclusion Rule Name: Z
Select Data Set: dTdt(smooth)
Exclude graphically: Exclude data between liquidus and
solidus points by selecting
or

143
Exclude sections: Exclude data between liquidus and solidus
points by entering time data on X.
Create exclusion rule
Close
Fitting;
New Fit
Data Set: dTdt(smooth)
Exclusion Rule: Z
Type of fit : Polynomial → Cubic Polynomial
Apply
Close
Analysis;
Fit to analyze : Fit 1 (A)
Analyze at Xi = 1:1:?
Evaluate fix at Xi
Prediction and confidence bounds : None
Apply
Save to workspace
Close
In workspace, double click your “analysisresults2”, open “yfit” file and copy
data
Click new variable and paste data here. Rename the file as “baseline”
Start → Toolboxes → Curve Fitting → Curve Fitting Tool
Data;
Data Sets;
Y Data → Choose “baseline”
X Data → Choose “none”
Create Data Set
Smooth;
Original Data Set: “baseline”

144
Method: Moving Average
Span: Odd number greater than 0 and less than or
equal to the length of X. (It can be preferred as 5 or
11.)
Create smoothed data set
Close
Fitting;
New Fit
Data Set: baseline(smooth)
Type of fit : Smoothing Spline
Apply
Close
Analysis;
Fit to analyze : Fit 1 (baseline)
Analyze at Xi = 1:1:?
Evaluate fix at Xi
Prediction and confidence bounds : None
Integrate to Xi
Start from min (Xi)
Apply
Save to workspace
Close
Start → Toolboxes → Curve Fitting → Curve Fitting Tool
Data;
Data Sets;
Y Data → Choose “dTdt”
X Data → Choose “none”
Create Data Set
Smooth;
Original Data Set: “dTdt”

145
Method: Moving Average
Span: Odd number greater than 0 and less than or
equal to the length of X. (It can be preferred as 5 or
11.)
Create smoothed data set
Close
Fitting;
New Fit
Data Set: dTdt(smooth)
Type of fit : Smoothing Spline
Apply
Close
Analysis;
Fit to analyze : Fit 1 (dTdt)
Analyze at Xi = 1:1:?
Evaluate fix at Xi
Prediction and confidence bounds : None
Integrate to Xi
Start from min (Xi)
Apply
Save to workspace
Close
In workspace, double click your “analysisresults3”, open “integral” file and
copy data to an excel sheet. This is your baseline integral data.
In workspace, double click your “analysisresults4”, open “integral” file and
copy data to an excel sheet. This is your dT/dt integral data.
Subtract baseline integral data from dT/dt integral data. Take data between
solidus and liquidus. Then add each data to the next one at the end row you
have to have sum of all data. In the last stage, divide each data with the sum
of all data. Therefore, solid fraction vs. time graph could be obtained. The

146
time can be replaced with the corresponding temperature value for having a
solid fraction vs. temperature graph.