Embed Size (px)
Citation preview
DEVELOPMENT OF AN AUTOMATED TEST DATA GENERATION AND
EXECUTION STRATEGY USING COMBINATORIAL APPROACH
By
MOHAMMAD FADEL JAMIL KLAIB
Thesis submitted in fulfilment of the
requirements for the degree of
Doctor of Philosophy
June 2009

ii
ACKNOWLEDGEMENTS
The work described in this thesis was undertaken under the main supervision of Dr.
Kamal Zuhairi Zamli, to whom I am grateful for his support, his interest during all
levels of my PhD study, and for his insightful and critical comments in writing the
published papers and the following thesis. To say the least, without Dr.Kamal’s
encouragement and enthusiasm, I will probably would not have gone this far. Also,
even though Dr.Kamal is very busy, he took an enormous task of revising my thesis
word by word. His efforts are greatly appreciated and will never be forgotten. Thanks
again Dr.Kamal.
I also wish to thank my co-supervisor Dr. Nor Ashidi Mat Isa, who gave me his ever
devotion and all valuable information which I really require to finish my thesis.
I am also thankful to all my friends in Malaysia, who gave their support and help
through many helpful and enjoyable discussions. In particular, I am thankful to all
academic staffs in the School of Electrical and Electronic Engineering, USM, and all
those persons who have encouraged me to complete my study. Thanks!
I will never forget to be thankful to whom my love will never end, to my father and
my mother, to my brothers and sisters, uncles and aunts, they all gave me their
lasting encouragement in my studies, so that I could be successful in my life. Dad
and mom, thank you for the prayers – this thesis is for both of you.
Finally, I would like to thank my loving wife (Haneen). To my daughter (Felesteen),
even with her disturbing cry, she enters the joy to my heart and keeps me going;
thanks for being patient all along. I am sorry to have sometimes neglected all of you
to pursue my dream.

iii
The work reported here would have not been possible without the e-science fund
grant entitled “Development of a Fault Injection Tool to Ensure Dependability of
Commercial-off-the-shelf Components (COTs) for Embedded System Applications”,
and fellowship support from Universiti Sains Malaysia.
iv
Table of Contents
Acknowledgment …………………………...………………………………….. ii
Table of Contents ………………………………………………………………. iv
List of Tables …………………………………………………………………… vii
List of Figures ………………………………………………………...………... ix
Abstrak ………………………………………………………………...……….. xi
Abstract ………………………………………………………………...………. xiii
CHAPTER 1 - INTRODUCTION 1
1.1 Overview of Software Testing…………………………………………….. 2
1.2 Problem Statements ………………………….…………………...………. 3
1.3 Thesis Aim and Objectives ……………………………………………….. 7
1.4 Thesis Outline …………………………………………………………….. 8
CHAPTER 2 – LITERATURE REVIEW 10
2.1 Overview ………………………………………………………………….. 10
2.2 Classification and Issues on T-Way Strategies …………………………… 19
2.3 Analysis of T-Way Testing Strategies …………...……………………….. 23
2.3.1 Algebraic strategies …….………………..…………………………. 23
2.3.1.1 Orthogonal Arrays (OA) ………………...……………………. 23
2.3.1.2 Covering Arrays (CA) …………………..……………………. 26
2.3.1.3 Mixed Level Covering Arrays (MCA)…..……………………. 28
2.3.2 Computational Strategies ………………………...…………………. 29
2.3.2.1 TConfig ……………………………………...………………... 30
2.3.2.2 AllPairs ………………………………..……………………… 31
2.3.2.3 Combinatorial Test Services (CTS) ………...………………… 32
v
2.3.2.4 Automatic Efficient Test Generator (AETG) …...……………. 33
2.3.2.5 mAETG ……………………………………………………….. 34
2.3.2.6 Test Case Generator (TCG) …………………...……………… 35
2.3.2.7 mTCG …………………………………………..…………….. 37
2.3.2.8 Genetic Algorithms (GA) ……………………..……………… 38
2.3.2.9 Ant Colony Algorithm (ACA) ………………...……………… 39
2.3.2.10 In Parameter Order (IPO) ……………………..…………….. 42
2.3.2.11 IPOG ………………………………………...………………. 43
2.3.2.12 Jenny ………………………………………...………………. 44
2.3.2.13 Test Vector Generator (TVG) ……………...………………... 45
2.3.2.14 Intelligent Test Case Handler (ITCH) ………..……………... 47
2.4 Discussion …………………………………………….…………………... 48
2.5 Summary ……………………………………………….…………………. 51
CHAPTER 3 - GTWAY DESCRIPTION AND IMPLEMENTATION 52
3.1 Design Consideration ……………………………………………………... 52
3.2 Description of GTWay Strategy ………………………………………….. 53
3.2.1 The Parser Algorithm in GTWay …………………...……………. 56
3.2.2 The T-Way Pair Generation Algorithm ……...…………………… 57
3.2.3 The Backtracking Algorithm in GTWay ………...……………….. 60
3.2.4 Execution Algorithm in GTWay …………………………………. 64
3.3 GTWay as a Pairwise Strategy (G2Way) ……………...…………………. 65
3.4 Implementation Summary for GTWay ………………...…………………. 69
3.5 Summary ………………………………………………..………………… 72
CHAPTER 4 - EVALUATION OF GTWAY STRATEGY 74
4.1 Applicability and Effectiveness of the GTWay Strategy for T-Way Test Planning and Execution ……………………….…………………….. 74
4.2 Comparison GTWay with Other Strategies ……………...……………….. 80
vi
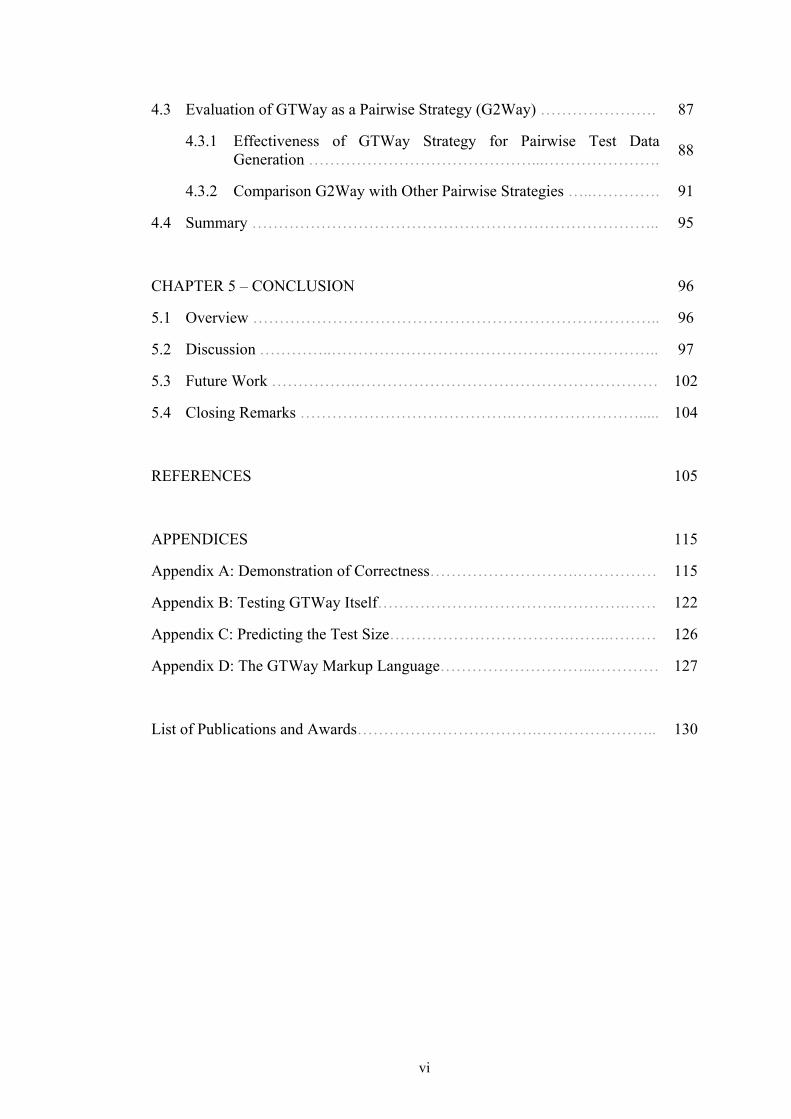
4.3 Evaluation of GTWay as a Pairwise Strategy (G2Way) …………………. 87
4.3.1 Effectiveness of GTWay Strategy for Pairwise Test Data Generation ……………………………………...…………………. 88
4.3.2 Comparison G2Way with Other Pairwise Strategies …..…………. 91
4.4 Summary ………………………………………………………………….. 95
CHAPTER 5 – CONCLUSION 96
5.1 Overview ………………………………………………………………….. 96
5.2 Discussion …………..…………………………………………………….. 97
5.3 Future Work …………….………………………………………………… 102
5.4 Closing Remarks ………………………………….……………………..... 104
REFERENCES 105
APPENDICES 115
Appendix A: Demonstration of Correctness……………………….…………… 115
Appendix B: Testing GTWay Itself…………………………….………….…… 122
Appendix C: Predicting the Test Size…………………………….……..……… 126
Appendix D: The GTWay Markup Language………………………...………… 127
List of Publications and Awards…………………………….………………….. 130
vii
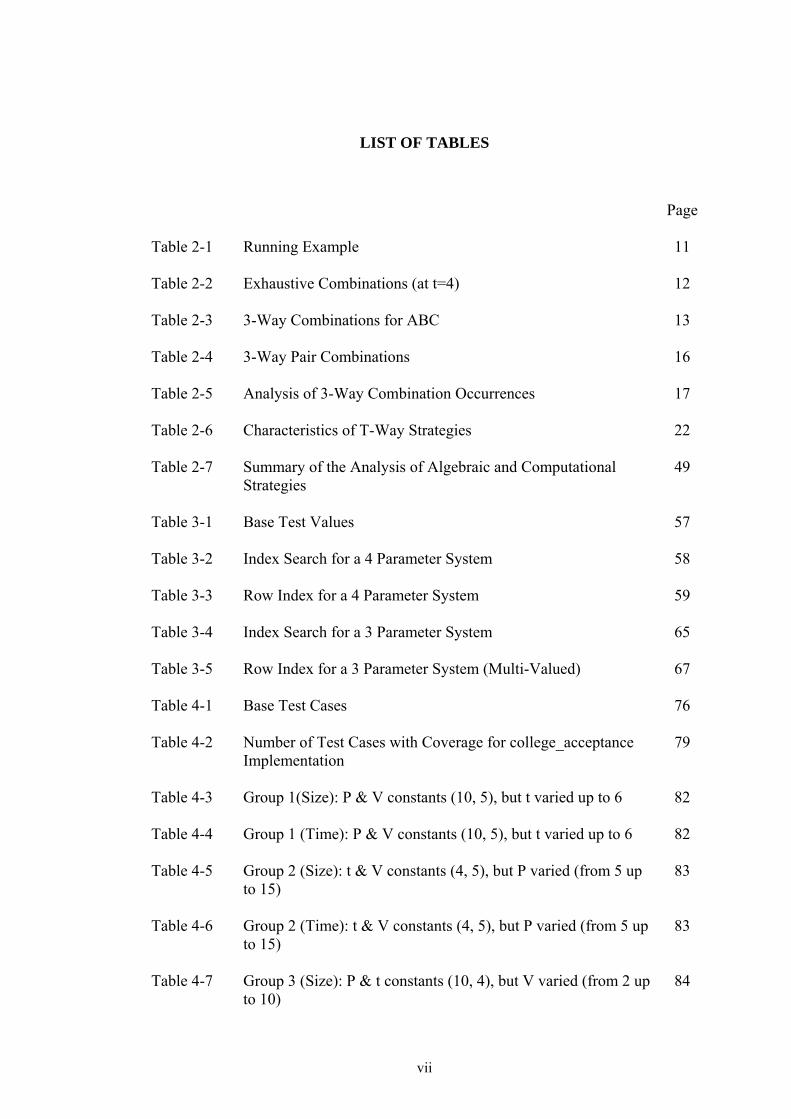
LIST OF TABLES
Page
Table 2-1 Running Example
11
Table 2-2 Exhaustive Combinations (at t=4)
12
Table 2-3 3-Way Combinations for ABC
13
Table 2-4 3-Way Pair Combinations
16
Table 2-5 Analysis of 3-Way Combination Occurrences
17
Table 2-6 Characteristics of T-Way Strategies
22
Table 2-7 Summary of the Analysis of Algebraic and Computational Strategies
49
Table 3-1 Base Test Values
57
Table 3-2 Index Search for a 4 Parameter System
58
Table 3-3 Row Index for a 4 Parameter System
59
Table 3-4 Index Search for a 3 Parameter System
65
Table 3-5 Row Index for a 3 Parameter System (Multi-Valued)
67
Table 4-1 Base Test Cases
76
Table 4-2 Number of Test Cases with Coverage for college_acceptance Implementation
79
Table 4-3 Group 1(Size): P & V constants (10, 5), but t varied up to 6
82
Table 4-4 Group 1 (Time): P & V constants (10, 5), but t varied up to 6
82
Table 4-5 Group 2 (Size): t & V constants (4, 5), but P varied (from 5 up to 15)
83
Table 4-6 Group 2 (Time): t & V constants (4, 5), but P varied (from 5 up to 15)
83
Table 4-7 Group 3 (Size): P & t constants (10, 4), but V varied (from 2 up to 10)
84
viii
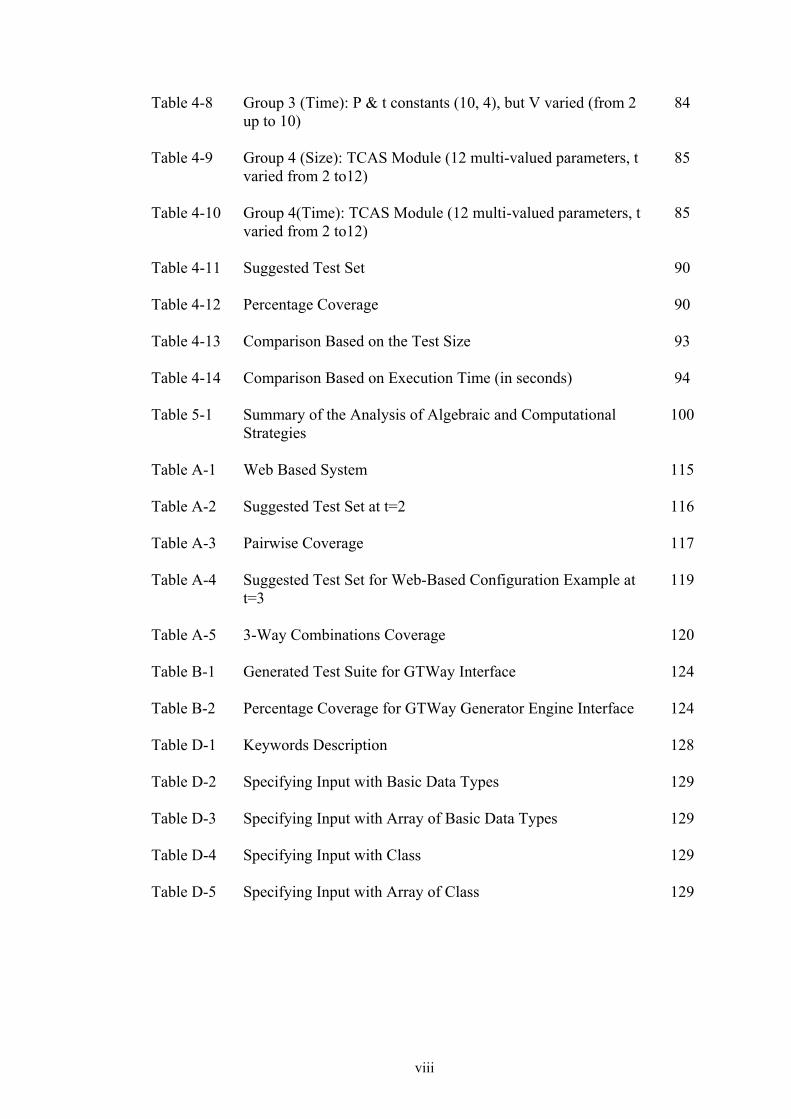
Table 4-8 Group 3 (Time): P & t constants (10, 4), but V varied (from 2 up to 10)
84
Table 4-9 Group 4 (Size): TCAS Module (12 multi-valued parameters, t varied from 2 to12)
85
Table 4-10 Group 4(Time): TCAS Module (12 multi-valued parameters, t varied from 2 to12)
85
Table 4-11 Suggested Test Set
90
Table 4-12 Percentage Coverage
90
Table 4-13 Comparison Based on the Test Size
93
Table 4-14 Comparison Based on Execution Time (in seconds)
94
Table 5-1 Summary of the Analysis of Algebraic and Computational Strategies
100
Table A-1 Web Based System
115
Table A-2 Suggested Test Set at t=2
116
Table A-3 Pairwise Coverage
117
Table A-4 Suggested Test Set for Web-Based Configuration Example at t=3
119
Table A-5 3-Way Combinations Coverage
120
Table B-1 Generated Test Suite for GTWay Interface
124
Table B-2 Percentage Coverage for GTWay Generator Engine Interface
124
Table D-1 Keywords Description
128
Table D-2 Specifying Input with Basic Data Types
129
Table D-3 Specifying Input with Array of Basic Data Types
129
Table D-4 Specifying Input with Class
129
Table D-5 Specifying Input with Array of Class
129
ix
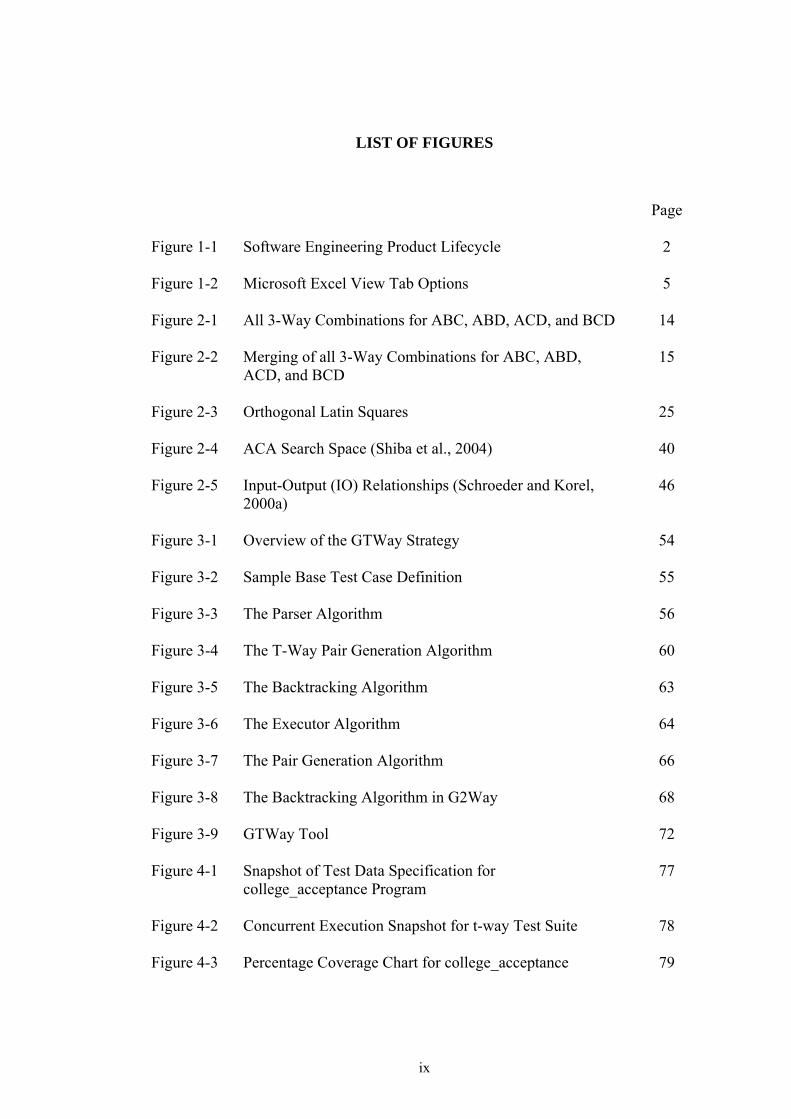
LIST OF FIGURES
Page
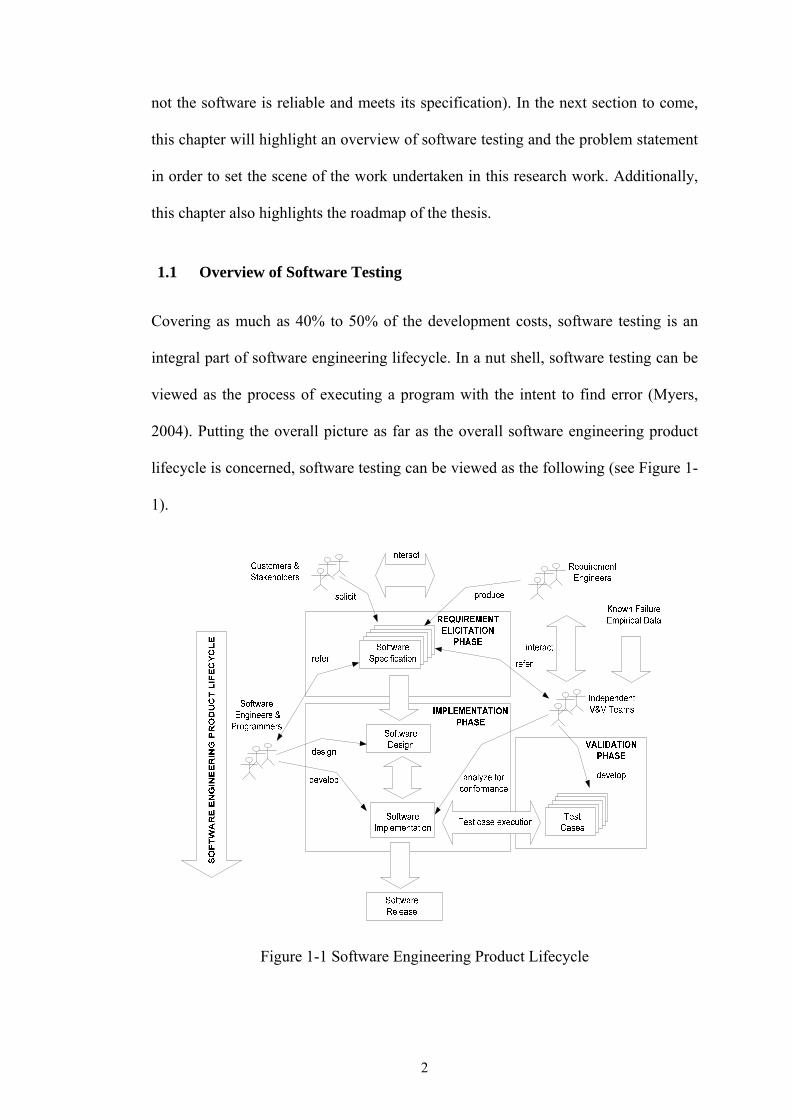
Figure 1-1 Software Engineering Product Lifecycle
2
Figure 1-2 Microsoft Excel View Tab Options
5
Figure 2-1 All 3-Way Combinations for ABC, ABD, ACD, and BCD
14
Figure 2-2 Merging of all 3-Way Combinations for ABC, ABD, ACD, and BCD
15
Figure 2-3 Orthogonal Latin Squares
25
Figure 2-4 ACA Search Space (Shiba et al., 2004)
40
Figure 2-5 Input-Output (IO) Relationships (Schroeder and Korel, 2000a)
46
Figure 3-1 Overview of the GTWay Strategy
54
Figure 3-2 Sample Base Test Case Definition
55
Figure 3-3 The Parser Algorithm
56
Figure 3-4 The T-Way Pair Generation Algorithm
60
Figure 3-5 The Backtracking Algorithm
63
Figure 3-6 The Executor Algorithm
64
Figure 3-7 The Pair Generation Algorithm
66
Figure 3-8 The Backtracking Algorithm in G2Way
68
Figure 3-9 GTWay Tool
72
Figure 4-1 Snapshot of Test Data Specification for college_acceptance Program
77
Figure 4-2 Concurrent Execution Snapshot for t-way Test Suite
78
Figure 4-3 Percentage Coverage Chart for college_acceptance
79
x
Figure 4-4 FileChooserDemo Interface
88
Figure B-1 GTWay Generator Engine Interface
123
Figure B-2 Percentage Coverage Chart for GTWay Generator Engine Interface
125
Figure D-1 Sample Keywords Definition in a Fault File
127
xi
PEMBANGUNAN PENJANAAN DATA UJIAN DAN STRATEGI PELARIAN AUTOMATIK MENGGUNAKAN PENDEKATAN BERGABUNGAN
ABSTRAK
Untuk memastikan tahap piawaian jaminan kualiti dan keboleharapan sesuatu
perisian, pengujian hendaklah dijalankan untuk setiap konfigurasi. Tetapi, masalah
letupan konfigurasi tidak memungkinkan pertimbangan keseluruhan terhadap semua
nilai data ujian. Kekangan sumber, masalah kos, dan masa untuk dipasarkan yang
ketat adalah merupakan antara faktor yang menghalang terhadap pertimbangan
keseluruhan itu. Penyelidikan terdahulu menyimpulkan bahawa strategi persampelan
berdasarkan interaksi t-cara antara parameter adalah sangat efektif. Berdasarkan
kesimpulan ini, terdapat banyak strategi t-cara yang sedia ada telah dihasilkan.
Bidang penyelidikan ini mengalami pertumbuhan yang pesat sejak 10 tahun yang
lalu dalam membantu proses perancangan ujian, terutamanya dalam mengurangkan
data ujian yang perlu digunakan secara sistematik berdasarkan sesuatu interaksi t-
cara yang terpilih. Walaupun terdapat banyak kemajuan, integrasi dan automasi
strategi daripada proses perancangan dan pengujian amat tidak dititik beratkan.
Dalam praktis sekarang, data ujian yang disampel perlu diekstrak secara manual dan
ditukarkan dalam format tertentu sebelum ia boleh dilaksanakan (sama ada oleh
penguji sendiri, atau alatan perisian daripada pihak ketiga). Masalah integrasi dan
automasi ini amat menyusahkan kerja jurutera pengujian terutamanya apabila modul
yang perlu diuji adalah bersaiz besar.
Selain daripada isu berkaitan integrasi dan automasi, perancangan untuk persampelan
dan pembinaan data ujian yang paling minima daripada keseluruhan data ujian adalah
juga masalah lengkap NP. Oleh yang demikian, tidak mungkin akan ada strategi bagi
xii
menghasilkan data ujian yang optimal untuk setiap kes data ujian. Bagi menyahut
cabaran yang digariskan di atas, tesis ini membincangkan rekabentuk, implementasi,
dan penilaian, strategi GTWay untuk menerbitkan data ujian t-cara yang optimum.
Tidak seperti strategi yang lain, GTWay dapat membantu proses perancangan dan
larian data ujian secara automatik (serentak) yang diintegrasikan sebagai sebahagian
daripada implementasinya. Keputusan empirikal membuktikan GTWay, dalam banyak
keadaan, mengatasi strategi sedia ada dalam aspek penghasilan data ujian yang
minima. Julat masa penghasilan ujian data juga adalah berpatutan seiring dengan
perancangan dan larian ujian yang diintegrasikan.
xiii
DEVELOPMENT OF AN AUTOMATED TEST DATA GENERATION AND EXECUTION STRATEGY USING COMBINATORIAL APPROACH
ABSTRACT
To ensure acceptable level of quality and reliability of a typical software product, it
is desirable to test every possible combination of input data under various
configurations. Due to combinatorial explosion problem, considering all exhaustive
testing is practically impossible. Resource constraints, costing factors as well as strict
time-to-market deadlines are amongst the main factors that inhibit such
consideration. Earlier work suggests that sampling strategy (i.e. based on t-way
parameter interaction) can be effective. As a result, many helpful t-way sampling
strategies have been developed in the literature.
Much useful advancement has been achieved in the last 10 years particularly to
facilitate the test planning process, that is, in terms of systematically minimizing the
test data to be considered for testing (i.e. based on some t-way parameter
interactions). Despite such a significant progress, the integration and automation of
the strategies from the planning process to execution appears to be lacking. In the
current practice, the sampled test data need to be manually extracted and converted
to some acceptable format before they can be executed (e.g. by a human tester, a
code driver or a third party execution tool). This lack of integration and automation
between test planning and execution can potentially burden the test engineers
especially if the software module to be tested is significantly large.
Apart from integration and automation issues, strategizing to sample and construct
minimum test set from the exhaustive test space is also a NP complete problem (i.e.
nondeterministic polynomial). As such, it is often unlikely that efficient strategy
exists that can always generate optimal test set. Motivated by such challenges, this
xiv
paper discusses the design, implementation, and validation of an efficient strategy,
called GTWay. GTWay, unlike other strategies, supports both t-way test generation
and automated (concurrent) execution integrated within the strategy itself. Empirical
evidences demonstrate that GTWay, for some cases, outperforms other strategies in
terms of the number of generated test data. The test generation time is also within
reasonable value considering the fact that some overhead is required to permit the
integration between test generation and execution.
1
CHAPTER 1
INTRODUCTION
Computing technology has gone a long way since the first Babbage computer.
Today, many chores that were once manual have been taken over by computers.
Factories use computers to control manufacturing equipments. Electronics
manufacturing use computers to test everything from microelectronics to circuit card
assemblies.
Software is one of the major components that drive the functionality and automation
of computers. Here, software can be viewed as a collection of written program,
functions, and procedures that enable the user to accomplish the task at hand. From
washing machine controllers, mobile phone applications to sophisticated airplane
control systems, software is becoming an indispensable part of our lives.
Imagine the world without software. For instance, our household washing machine
may still be bulky as the controls may be composed of all mechanical switches.
Similarly, our hand phone without software may have too limited capabilities to be
useful. As these two examples illustrate, software (whenever possible) are becoming
increasingly popular replacement for its hardware counter parts.
Our growing dependency on software can be attributed to a number of factors.
Unlike hardware, software does not wear out. Thus, the use of software can help to
control maintenance costs. Additionally, software is also malleable and can be easily
customized as the need arises.
Nevertheless, the fact that software is malleable and can be easily customized can
also be a burden. Here, testing is often sought for to ensure quality (i.e. whether or
2
not the software is reliable and meets its specification). In the next section to come,
this chapter will highlight an overview of software testing and the problem statement
in order to set the scene of the work undertaken in this research work. Additionally,
this chapter also highlights the roadmap of the thesis.
1.1 Overview of Software Testing
Covering as much as 40% to 50% of the development costs, software testing is an
integral part of software engineering lifecycle. In a nut shell, software testing can be
viewed as the process of executing a program with the intent to find error (Myers,
2004). Putting the overall picture as far as the overall software engineering product
lifecycle is concerned, software testing can be viewed as the following (see Figure 1-
1).
Figure 1-1 Software Engineering Product Lifecycle
3
Referring to Figure 1-1, software engineering product lifecycle starts with the
requirement elicitation phase. Here, the customers and stakeholders interact with the
requirement engineers to produce the software specifications. Based on the
specifications, software engineers and programmers collaborate to produce software
design and implementations. This activity occurs in the implementation phase.
Software testing falls under the validation phase which may occur in parallel with the
requirement elicitation phase and implementation phase. The independent
verification and validation (V&V) team needs to consult the requirement engineers
for software specification. Based on the software specification, the V&V team
produces the test cases to be executed against the software implementation. If the
execution results satisfy the requirement specification, then the software is ready to
be released, otherwise, some additional work need to be done to the design and
implementation until conformance is achieved.
As seen above, the purpose of testing is not to prove anything, rather to reduce the
perceived risk of not working to an acceptable value. The key challenges in software
testing are not only dependent on the actual execution of the test cases but also the
production of quality test cases.
1.2 Problem Statements
Covering as much as 40 to 50 percent of the development costs and resources
(Beizer, 1990, Kaner et al., 1999, Pan, 1999), testing can be considered as one of the
most important activities in product development for both software and hardware
(Bryce et al., 2005, Tsui and Karam, 2007). In order to ensure accepted quality and
reliability, many combinations of possible input parameters, hardware/software
4
environments, and system conditions are tested and verified against for conformance
based on system’s specification (Cohen et al., 2007a, Cohen et al., 2007b).
Lack of testing can lead to disastrous consequences including loss of data, fortunes,
and even lives. For instance, consider the accident that occurred during the European
Space Agency’s launching of Ariane 5 in 1996. Investigation by independent
researchers from Massachusetts Institute of Technology reveals that the disaster is
caused by the mismatch of the hardware and software component faults (Lions,
1996). The component erroneously puts a 64 bit floating point number in to a 16 bit
space, causing overflow error. This overflow error affected the rocket’s alignment
function, and hence, causing the rocket to veer off course and eventually exploded a
mere 37 seconds after lift off.
Despite its importance, exhaustive testing is impossible due to the fact that the
number of test cases can be exorbitantly large (Chaudhuri and Zhu, 1992, Copeland,
2004, Roper, 2002) even for simple software and hardware products. Consider a
hardware product with 20 on/off switches. To test all possible combination would
require 220 = 1,048,576 test cases. If the time required for one test case is 5 minutes,
then it would take nearly 10 years for a complete test.
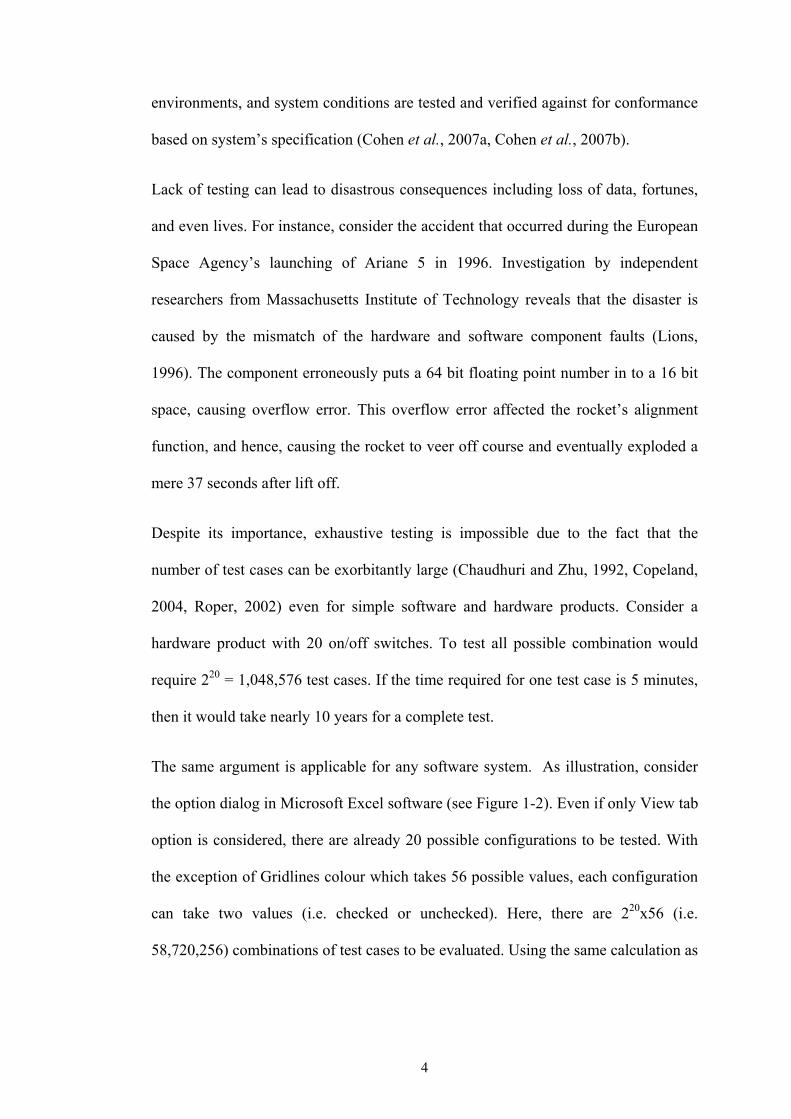
The same argument is applicable for any software system. As illustration, consider
the option dialog in Microsoft Excel software (see Figure 1-2). Even if only View tab
option is considered, there are already 20 possible configurations to be tested. With
the exception of Gridlines colour which takes 56 possible values, each configuration
can take two values (i.e. checked or unchecked). Here, there are 220x56 (i.e.
58,720,256) combinations of test cases to be evaluated. Using the same calculation as
5
the previous example, it would require nearly 559 years for a complete test of the
View tab option.
Figure 1-2 Microsoft Excel View Tab Options
The above mentioned examples highlighted the common combinatorial explosion
problem in software testing. Given limited time and resources, the research questions
are:
• What are the smaller optimum sets of (sampled) test data to be considered for
testing?
• How can one decide (i.e. the strategy) on which combination of data values to
choose over large combinatorial data sets?
• Will the test coverage be significantly affected by using lesser combinatorial data
sets?
6
Combinatorial explosion problem (Cohen et al., 1997, Cohen et al., 2006b, Colbourn
et al., 2004, Tai and Lei, 2002) poses one of the biggest challenges in modern
computer science due to the fact that it often kills traditional approaches to analysis,
verification, monitoring and control. A number of techniques have been explored in
the past to address the combinatorial explosion problem. Undoubtedly, parallel
testing (e.g. (ITL/NIST, 2008, Younis et al., 2009)) can be employed to reduce the
time required for performing the tests. Nevertheless, as software and hardware are
getting more complex than ever, parallel testing approach becomes immensely
expensive due to the need for faster and higher capability processors along state-of-
the-art computer hardware. Apart from parallel testing, systematic random testing
could also be another option (Antony, 2003, Duran and Ntafos, 1984, Schroeder et
al., 2004, Tseng et al., 2001). However, systematic random testing (e.g. (Ammann
and Offutt, 1994)) tends to dwell on unfair distribution of test cases.
Earlier work (e.g. (Bryce and Colbourn, 2006, Dalal et al., 1999, Kuhn and Okum,
2006, Kuhn and Reilly, 2002, Kuhn et al., 2004, Yan and Zhang, 2008)) suggests
that from empirical observation, the number of input variables involved in software
and hardware failures is relatively small (i.e. in the order of 3 to 6), in some classes
of system. If t or fewer variables are known to interact and cause fault (Ellims et al.,
2008b), test data can be generated on some t-way combinations (i.e. resulting into a
smaller set of test data for consideration).
As will be seen in Chapter 2, a number of useful strategies have been reported to
facilitate the test planning process, that is, in terms of systematically minimizing the
test data to be considered for testing (i.e. based on some t-way parameter
interactions). However, the integration and automation of the existing strategies from
the planning process to execution appears to be lacking. In the current practice, the t-
7
way sampled test data need to be manually extracted and converted to some
acceptable format before they can be executed (e.g. by a human tester (Binder, 2000,
Dustin et al., 1999, Fewster and Graham, 1999), a code driver or a third party
execution tool (Li and Wu, 2004)). This lack of integration and automation between
test planning and execution can potentially burden the test engineers especially if the
software module to be tested is significantly large.
In addition to integration and automation issues, strategizing to sample and construct
minimum test set from the exhaustive test space is also a NP complete problem
(Shiba et al., 2004, Tai and Lei, 2002). As such, it is often unlikely that efficient
strategy exists that can always generate optimal test set. Motivated by such
challenges, this research work is devoted to investigate an optimum strategy, called
GTWay, for systematic t-way test data generation (and reduction). Unlike earlier
work, GTWay supports both the test planning process and the automated
(concurrent) execution integrated within the strategy itself. In short, using t-way
strategy is useful to systematically detect faults in a particular software system is the
main hypothesis on this thesis.
1.3 Thesis Aim and Objectives
The main aim of this research is to develop and evaluate a general t-way test data
generation and execution strategy, called GTWay, for software configuration testing.
The main objectives of the work undertaken were:
i. To develop and implement the GTWay strategy as a prototype
implementation tool.
8
ii. To investigate automatic execution, when actual values are used, as part of
the GTWay strategy.
iii. To investigate and compare the performance of GTWay strategy in terms of
test size as well as execution time against existing works.
1.4 Thesis Outline
The remainder of this thesis is organised into five chapters as follows.
Chapter 2 presents an overview as well as highlights the main characteristics of t-
way strategies. Using the characteristics, a survey of existing t-way strategies is
provided including that of a special case for t-way strategies, the pairwise testing.
Towards the end of Chapter 2, an analysis of existing work is presented which
provides the requirements and justification for the development of GTWay.
Chapter 3 discusses and justifies the detailed algorithms and implementation for
GTWay based on the requirements from Chapter 2. Here, issues related to the
enabling automated execution are also explained. Additionally, the prototype
implementation is also discussed in order to highlight its usage.
In Chapter 4, a detailed account for evaluating GTWay is presented. Here, the
correctness of GTWay strategy will be evaluated. Apart from the correctness
evaluation, a comparative study on the effectiveness of pairwise testing versus t-way
testing will be highlighted using suitable case studies. Additionally, GTWay will
also be compared against existing strategies in terms of the number of generated test
data as well as execution time both as a pairwise strategy and as a general t-way
strategy.

9
The conclusion of this work is given in Chapter 5, where the achievements,
contributions and problems are summarised. Additionally, the main research
hypothesis is revisited and the usefulness of GTWay is debated. Conclusions are
drawn from the experience gained from this work and the significance of findings
along with considerations for future work.
10
CHAPTER 2
LITERATURE REVIEW
The previous chapter has established the needs for software testing (i.e. for
evaluating conformance and ensuring reliability), and highlighted the possible
catastrophic aftermaths due software failure (i.e. including fortune and data losses as
well as human fatality). In doing so, the previous chapter has also advocated the fact
that testing for all combination of parameters, although desirable, is infeasible due to
lack of resources as well as strict time-to-market constraints. Thus, systematic
strategies are required to reduce the number of test cases by selecting a subset of
these combinations for sampling, executing and analyzing.
In this chapter, these systematic strategies will be elaborated based on the t-way
interaction of variables. Specifically, this chapter begins by giving an overview of
the concept and terminology that will be used throughout this thesis. Next, the main
characteristics of the combinatorial strategies will be identified in order to facilitate
their survey and analysis. This survey and analysis is then used to provide
justification for the development of GTWay, the strategy that is the basis of this
thesis. Finally, this chapter closes by providing a short summary.
2.1 Overview
As discussed earlier, the main focus of the work described in this thesis is on the
development of systematic test data minimization strategy based on (t-way)
parameter interaction testing (or termed t-way testing). Here, the parameter
interaction can be specified using a variable (t) indicating how strong the interaction
is.
11
In order to illustrate how the variable t works, and hence demonstrate test data
reduction, consider the following running example.
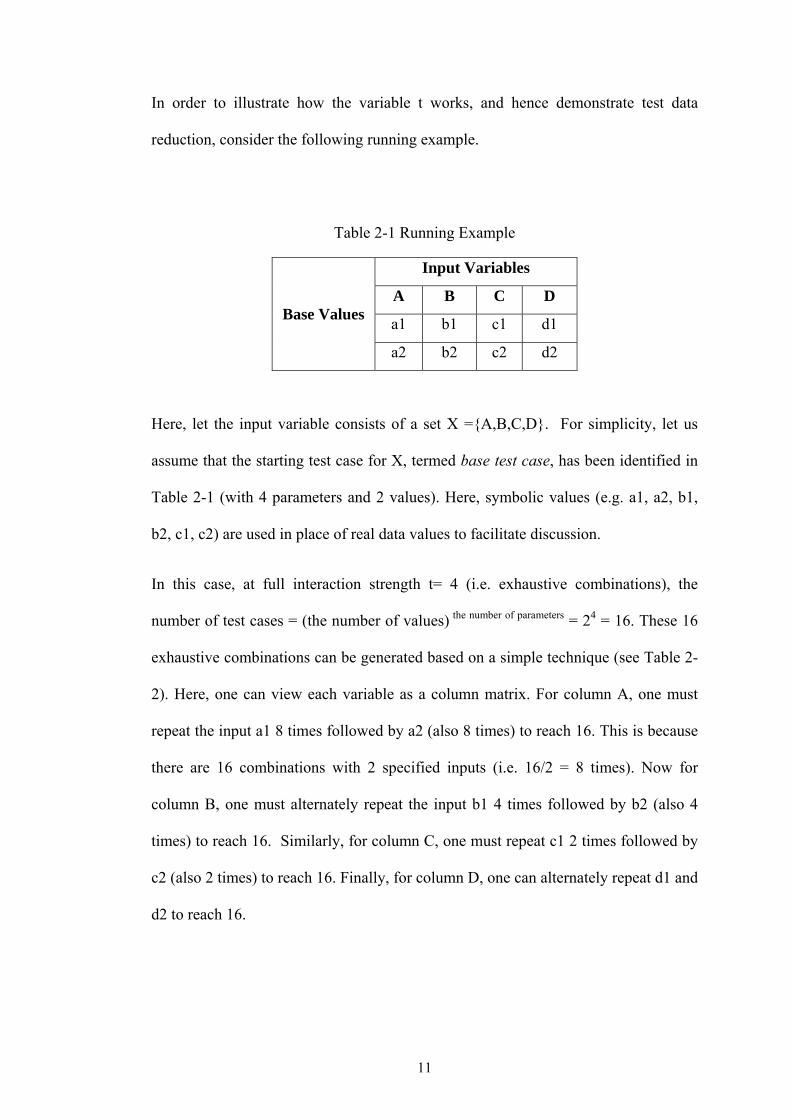
Table 2-1 Running Example
Input Variables
A B C D
a1 b1 c1 d1 Base Values
a2 b2 c2 d2
Here, let the input variable consists of a set X ={A,B,C,D}. For simplicity, let us
assume that the starting test case for X, termed base test case, has been identified in
Table 2-1 (with 4 parameters and 2 values). Here, symbolic values (e.g. a1, a2, b1,
b2, c1, c2) are used in place of real data values to facilitate discussion.
In this case, at full interaction strength t= 4 (i.e. exhaustive combinations), the
number of test cases = (the number of values) the number of parameters = 24 = 16. These 16
exhaustive combinations can be generated based on a simple technique (see Table 2-
2). Here, one can view each variable as a column matrix. For column A, one must
repeat the input a1 8 times followed by a2 (also 8 times) to reach 16. This is because
there are 16 combinations with 2 specified inputs (i.e. 16/2 = 8 times). Now for
column B, one must alternately repeat the input b1 4 times followed by b2 (also 4
times) to reach 16. Similarly, for column C, one must repeat c1 2 times followed by
c2 (also 2 times) to reach 16. Finally, for column D, one can alternately repeat d1 and
d2 to reach 16.
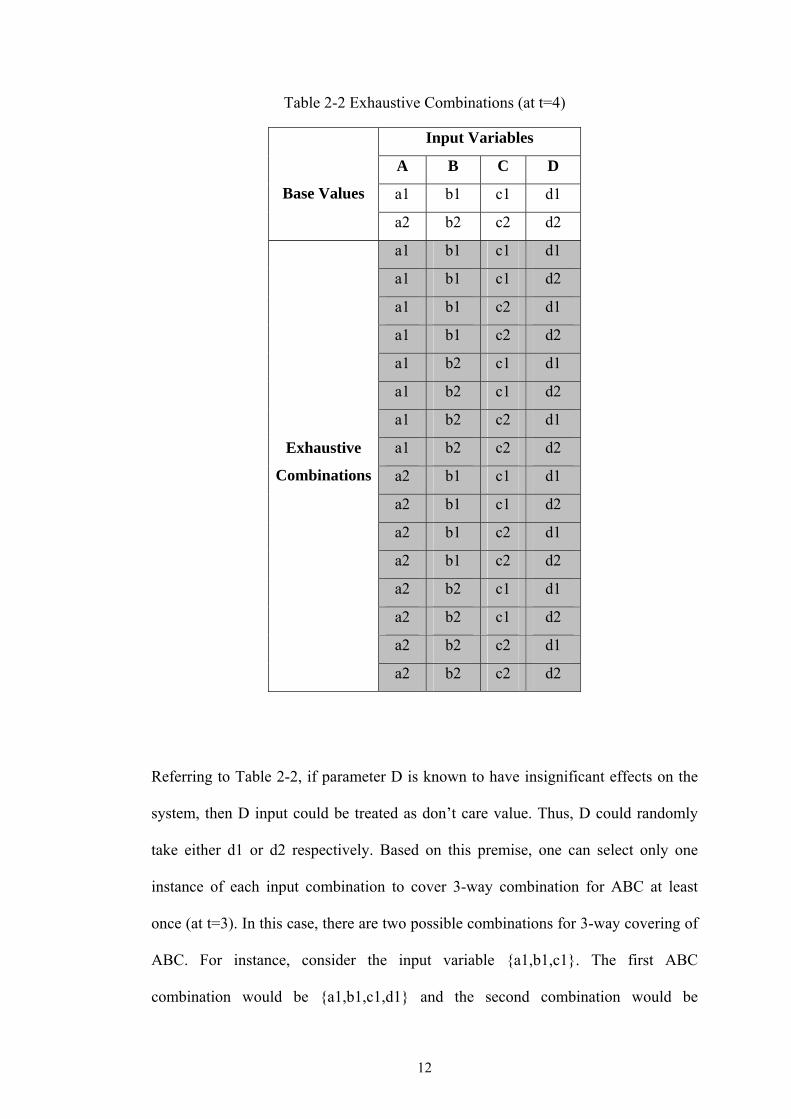
12
Table 2-2 Exhaustive Combinations (at t=4)
Input Variables
A B C D
a1 b1 c1 d1
Base Values
a2 b2 c2 d2
a1 b1 c1 d1
a1 b1 c1 d2
a1 b1 c2 d1
a1 b1 c2 d2
a1 b2 c1 d1
a1 b2 c1 d2
a1 b2 c2 d1
a1 b2 c2 d2
a2 b1 c1 d1
a2 b1 c1 d2
a2 b1 c2 d1
a2 b1 c2 d2
a2 b2 c1 d1
a2 b2 c1 d2
a2 b2 c2 d1
Exhaustive
Combinations
a2 b2 c2 d2
Referring to Table 2-2, if parameter D is known to have insignificant effects on the
system, then D input could be treated as don’t care value. Thus, D could randomly
take either d1 or d2 respectively. Based on this premise, one can select only one
instance of each input combination to cover 3-way combination for ABC at least
once (at t=3). In this case, there are two possible combinations for 3-way covering of
ABC. For instance, consider the input variable {a1,b1,c1}. The first ABC
combination would be {a1,b1,c1,d1} and the second combination would be
13
{a1,b1,c1, d2}. In order to cover for t-way combination for ABC, one can randomly
select any one of the aforementioned combinations.
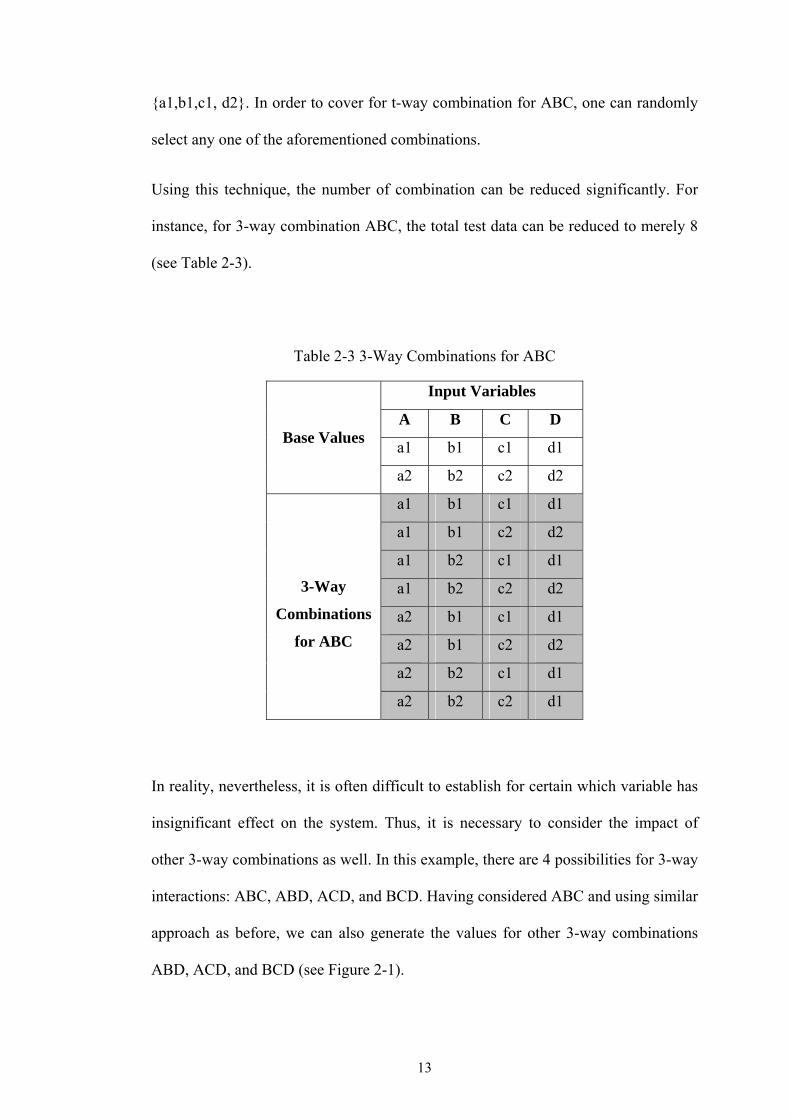
Using this technique, the number of combination can be reduced significantly. For
instance, for 3-way combination ABC, the total test data can be reduced to merely 8
(see Table 2-3).
Table 2-3 3-Way Combinations for ABC
Input Variables
A B C D
a1 b1 c1 d1 Base Values
a2 b2 c2 d2
a1 b1 c1 d1
a1 b1 c2 d2
a1 b2 c1 d1
a1 b2 c2 d2
a2 b1 c1 d1
a2 b1 c2 d2
a2 b2 c1 d1
3-Way
Combinations
for ABC
a2 b2 c2 d1
In reality, nevertheless, it is often difficult to establish for certain which variable has
insignificant effect on the system. Thus, it is necessary to consider the impact of
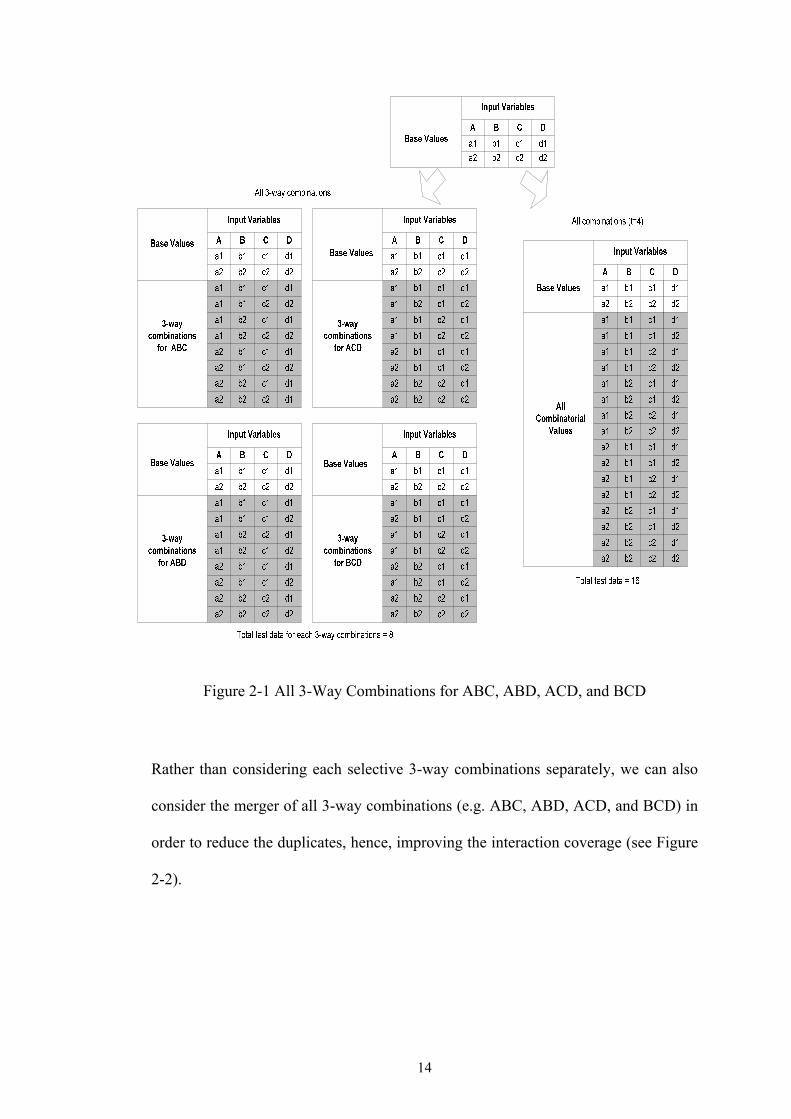
other 3-way combinations as well. In this example, there are 4 possibilities for 3-way
interactions: ABC, ABD, ACD, and BCD. Having considered ABC and using similar
approach as before, we can also generate the values for other 3-way combinations
ABD, ACD, and BCD (see Figure 2-1).
14
Figure 2-1 All 3-Way Combinations for ABC, ABD, ACD, and BCD
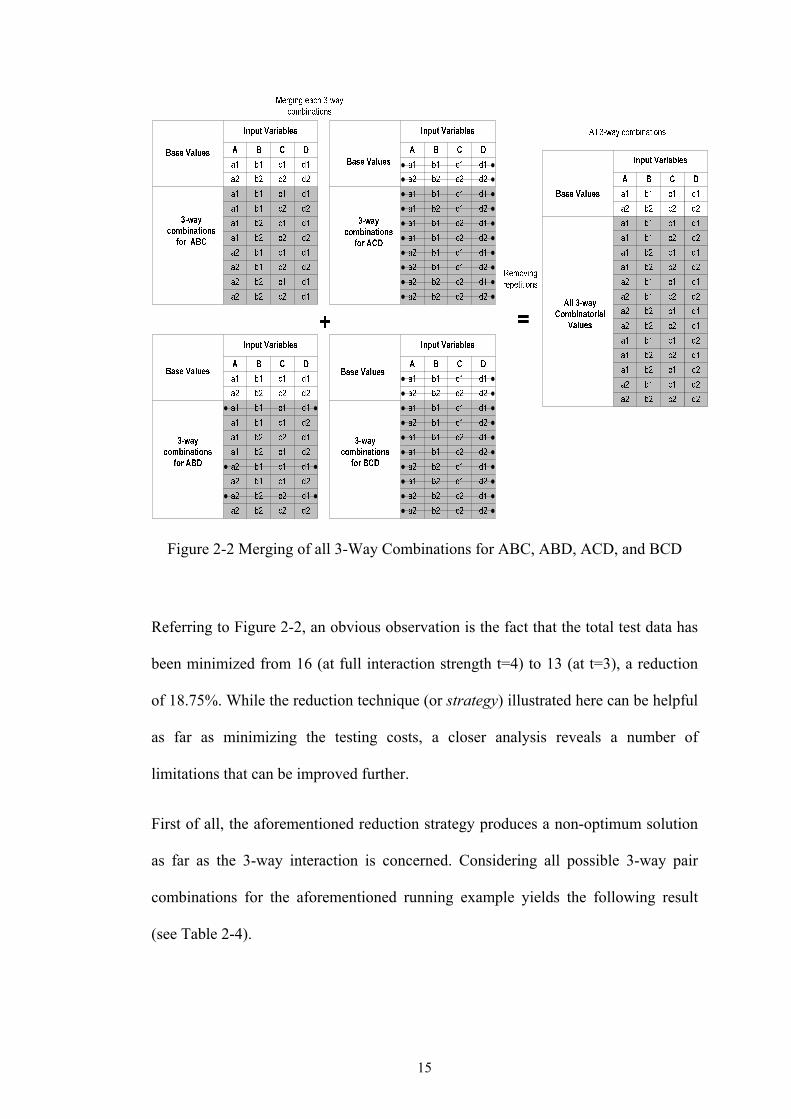
Rather than considering each selective 3-way combinations separately, we can also
consider the merger of all 3-way combinations (e.g. ABC, ABD, ACD, and BCD) in
order to reduce the duplicates, hence, improving the interaction coverage (see Figure
2-2).
15
Figure 2-2 Merging of all 3-Way Combinations for ABC, ABD, ACD, and BCD
Referring to Figure 2-2, an obvious observation is the fact that the total test data has
been minimized from 16 (at full interaction strength t=4) to 13 (at t=3), a reduction
of 18.75%. While the reduction technique (or strategy) illustrated here can be helpful
as far as minimizing the testing costs, a closer analysis reveals a number of
limitations that can be improved further.
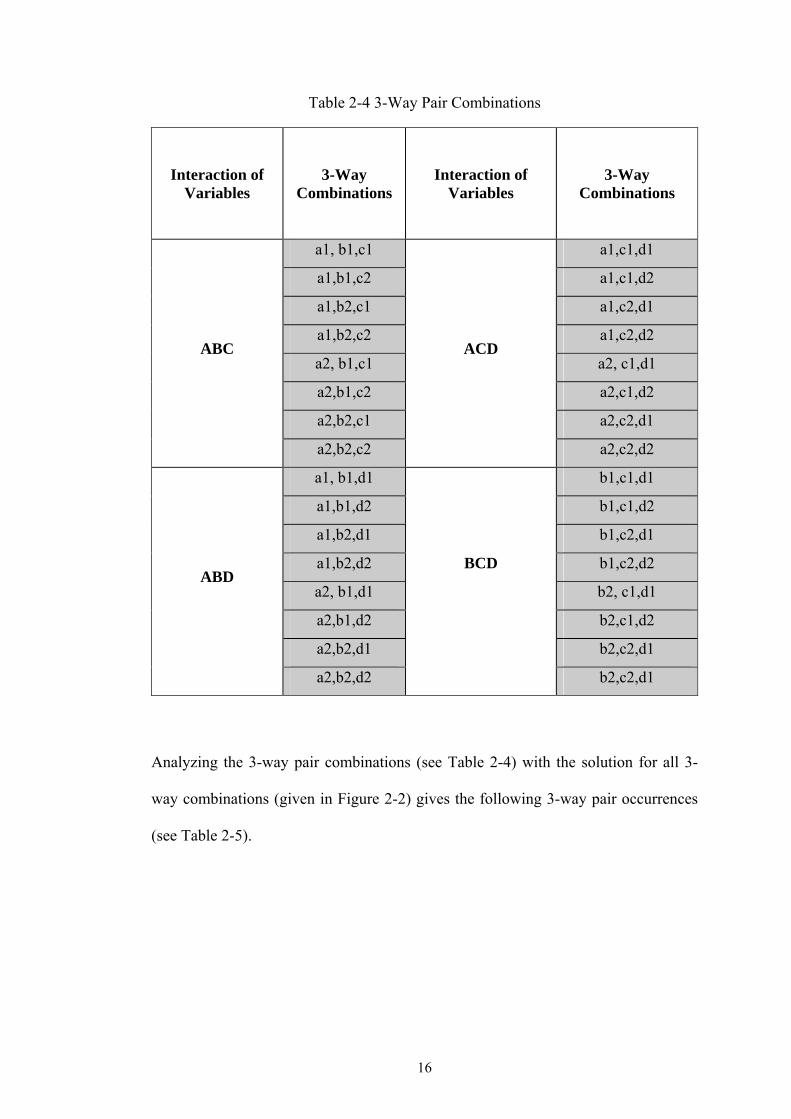
First of all, the aforementioned reduction strategy produces a non-optimum solution
as far as the 3-way interaction is concerned. Considering all possible 3-way pair
combinations for the aforementioned running example yields the following result
(see Table 2-4).
16
Table 2-4 3-Way Pair Combinations
Interaction of Variables
3-Way Combinations
Interaction of Variables
3-Way Combinations
a1, b1,c1 a1,c1,d1
a1,b1,c2 a1,c1,d2
a1,b2,c1 a1,c2,d1
a1,b2,c2 a1,c2,d2
a2, b1,c1 a2, c1,d1
a2,b1,c2 a2,c1,d2
a2,b2,c1 a2,c2,d1
ABC
a2,b2,c2
ACD
a2,c2,d2
a1, b1,d1 b1,c1,d1
a1,b1,d2 b1,c1,d2
a1,b2,d1 b1,c2,d1
a1,b2,d2 b1,c2,d2
a2, b1,d1 b2, c1,d1
a2,b1,d2 b2,c1,d2
a2,b2,d1 b2,c2,d1
ABD
a2,b2,d2
BCD
b2,c2,d1
Analyzing the 3-way pair combinations (see Table 2-4) with the solution for all 3-
way combinations (given in Figure 2-2) gives the following 3-way pair occurrences
(see Table 2-5).
17
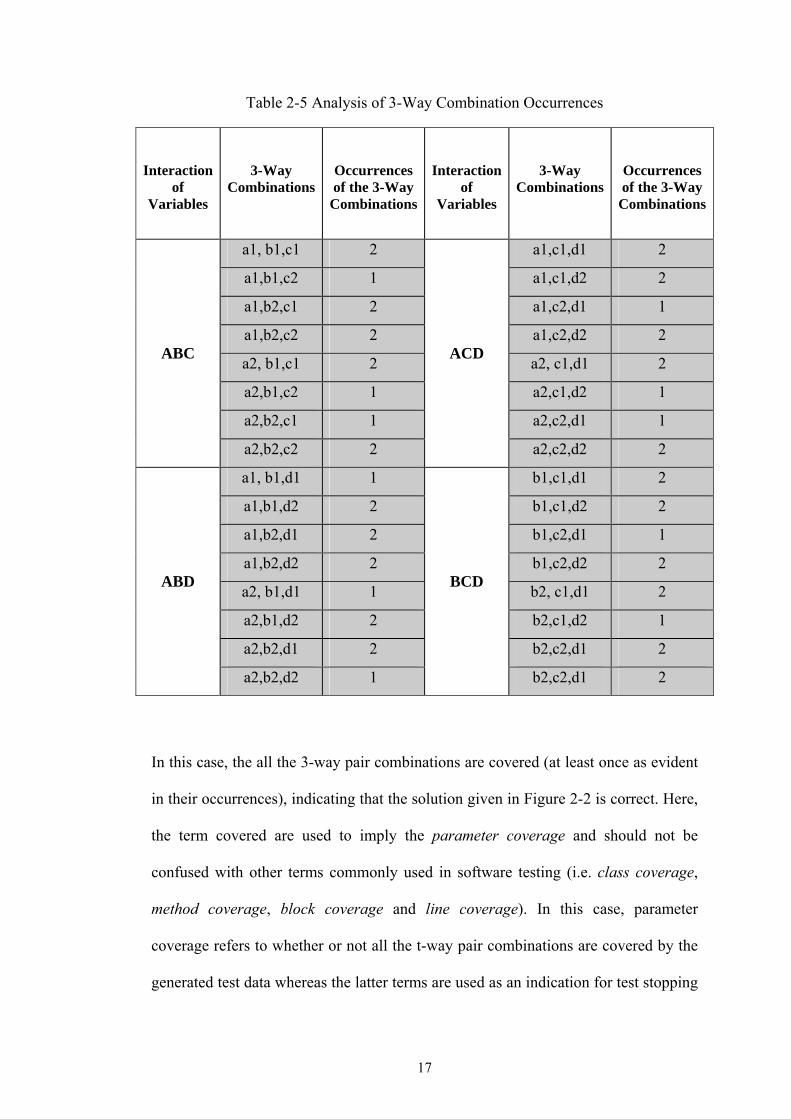
Table 2-5 Analysis of 3-Way Combination Occurrences
Interaction of
Variables
3-Way Combinations
Occurrences of the 3-Way
Combinations
Interaction of
Variables
3-Way Combinations
Occurrences of the 3-Way
Combinations
a1, b1,c1 2 a1,c1,d1 2
a1,b1,c2 1 a1,c1,d2 2
a1,b2,c1 2 a1,c2,d1 1
a1,b2,c2 2 a1,c2,d2 2
a2, b1,c1 2 a2, c1,d1 2
a2,b1,c2 1 a2,c1,d2 1
a2,b2,c1 1 a2,c2,d1 1
ABC
a2,b2,c2 2
ACD
a2,c2,d2 2
a1, b1,d1 1 b1,c1,d1 2
a1,b1,d2 2 b1,c1,d2 2
a1,b2,d1 2 b1,c2,d1 1
a1,b2,d2 2 b1,c2,d2 2
a2, b1,d1 1 b2, c1,d1 2
a2,b1,d2 2 b2,c1,d2 1
a2,b2,d1 2 b2,c2,d1 2
ABD
a2,b2,d2 1
BCD
b2,c2,d1 2
In this case, the all the 3-way pair combinations are covered (at least once as evident
in their occurrences), indicating that the solution given in Figure 2-2 is correct. Here,
the term covered are used to imply the parameter coverage and should not be
confused with other terms commonly used in software testing (i.e. class coverage,
method coverage, block coverage and line coverage). In this case, parameter
coverage refers to whether or not all the t-way pair combinations are covered by the
generated test data whereas the latter terms are used as an indication for test stopping
18
criteria. More on these issues will be highlighted in Chapter 4 when the case studies
are demonstrated.
Going back to the discussion parameter coverage, it is desirable to have occurrences
of each 3-way pair combinations of at most once (i.e. some of the 3-way pair
combinations in Table 2-5 are covered more than once). In this manner, the given 3-
way pair combinations are guaranteed to be the most optimum, hence, resulting into
fewer combination (i.e. more test reduction). As highlighted earlier in Chapter 1, one
of the key challenges of this research to get the most optimum results in every case
regardless of the values of t.
Although not highlighted here, there could be infinitely many possibilities of
parameter inputs to consider as far as the selection of t is concerned. For example,
there could be a case where some of the parameters take non-uniform values. In this
manner, there is often no exact optimum solution, a typical strategy needs to be
intelligent enough to be select amongst the best optimum solution. For this reason,
the research for an efficient strategy for getting an optimum solution is considered
NP complete.
The second limitation of the aforementioned strategy is the fact that it is based on
exhaustive selection. If the number of parameters and its values are large,
considering exhaustive combination can be a painstakingly long process. In fact, in
some cases, it may be an impossible endeavour.
Apart from the above, a number of general issues as far as t-way testing is concerned
can be elaborated here. If t is relaxed, more and more reduction can be possible.
Here, the range of acceptable t values is between 2 and the maximum number of
defined parameters (i.e. exhaustive case). To obtain the most minimum reductions
19
possible, there are significant efforts to focus only on t=2 (or termed pairwise
testing) as a special case for t-way testing. Thus, in order to give a complete
overview on t-way testing, pairwise testing will also be considered in detail later in
this chapter.
Finally, as demonstrated by the aforementioned running example, the overall t-way
testing strategy can be adopted to rely solely on black box consideration, that is, no
information of the source code is required for minimization. However, if the source
code is available, this testing strategy can usefully be tailored enabling both black
and white box supports (i.e. grey box). In this manner, more quality test input values
can be considered as the base test data.
Having given an overview of the issues relating to t-way testing, the next section
highlights the classification and main characteristics of the existing t-way strategies
in order to facilitate their survey and analysis.
2.2 Classification and Issues on T-Way Strategies
There have already been a number of attempts to classify the existing t-way
strategies. Cohen et al. has classified the combinatorial strategies into two main
groups (Cohen, 2004):
• Algebraic strategies – strategies that exploit mathematical methods to build
deterministic and optimal test suites.
• Computational strategies – strategies that utilize computerized/iterative methods
that generate (deterministic and non-deterministic) test suites.
20
Building and expanding the classification by Cohen, Grindal et al. has identified
three main categories of combinatorial strategies (Grindal et al., 2005) based on the
randomness of the implemented solution:
• Non-deterministic – non-deterministic strategies share the property that for every
execution, there is always a randomly generated combination suite to cover all
the required t-way pairs.
• Deterministic – deterministic combination strategies share the property that they
produce the same test suite for every execution.
• Compound – two or more combination strategies are used together.
In their work, Grindal et al. also classifies the deterministic t-way strategies into
three sub-categories based on how the test suites are created (Grindal et al., 2003,
Grindal et al., 2005):
• Instant – Here, the strategy produces the complete test suite directly in a single
run.
• Iterative – In this case, the strategy generates one test case at a time and adds it to
the test suite.
• Parameter-based – The strategy starts by creating a test suite for a subset of the
parameters in the input parameter model. Then, one parameter at a time is added
and the test cases in the test suite are modified to cover the new parameter. Here,
completely new test cases may also need to be added in the end to ensure
parameter coverage.

21
Here, unlike Cohen et al’s work, which are based on high level and external view of
the t-way strategy, Grindal et al. capture the internal building of the existing t-way
strategies (i.e. in terms of how the test suites the strategies works). In this respect,
Grindal’s work appears to be more focused than that of Cohen.
Building and complementing from both Cohen et al and Grindal et al, this thesis
presents an alternative and complementary characterization of the existing t-way
strategies. Unlike Cohen et al and Grindal et al, our characterization solely takes the
output test suite of each strategies into consideration (i.e. in terms of how random the
test suite is), either as deterministic or non-deterministic. At a glance our
characterization look similar to Grindal et al, however, a close look reveals some
differences. Unlike Grindal et al, our characterization does not deal with the internal
building of the strategies (i.e. how the strategies are implemented as well as how they
work) as we focus solely on the output (and not the strategy and its processes). In this
manner, our characterization in itself, unlike Grindal et al, is atomic and does not
require further elaboration.
Additionally, our characterization also incorporates the parameter strength, t, into the
classification in order to clearly discern amongst the capabilities of each of the t-way
strategy is concerned (i.e. whether or not a particular strategy of interest is pairwise
or a general t-way in nature and how strong the support for t is). Here, we have
chosen to divide values of t. As will be seen later in Chapter 4, our experience and
the experience of others (Kuhn et al., 2008a, Kuhn et al., 2008b, Lei et al., 2007b,
Lei et al., 2007c) indicate that at t=6, as the rule of thumb, the effectiveness of the
generated test suite is as good as exhaustive combinations.
22
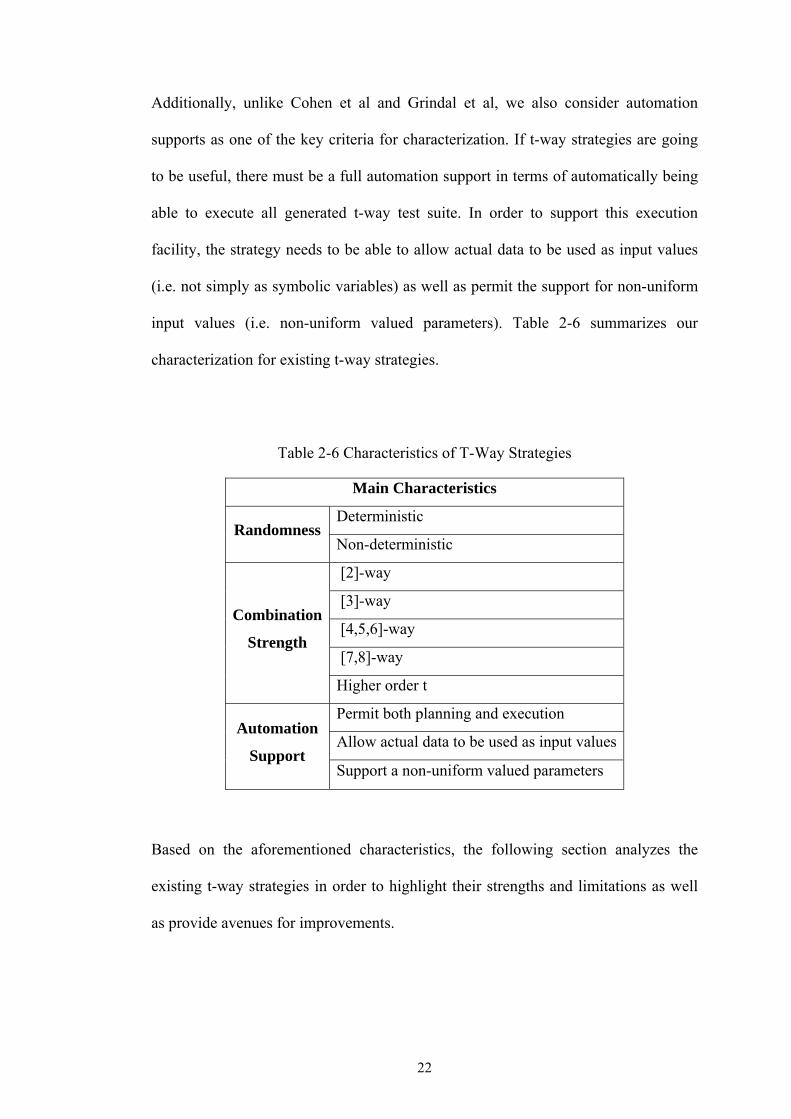
Additionally, unlike Cohen et al and Grindal et al, we also consider automation
supports as one of the key criteria for characterization. If t-way strategies are going
to be useful, there must be a full automation support in terms of automatically being
able to execute all generated t-way test suite. In order to support this execution
facility, the strategy needs to be able to allow actual data to be used as input values
(i.e. not simply as symbolic variables) as well as permit the support for non-uniform
input values (i.e. non-uniform valued parameters). Table 2-6 summarizes our
characterization for existing t-way strategies.
Table 2-6 Characteristics of T-Way Strategies
Based on the aforementioned characteristics, the following section analyzes the
existing t-way strategies in order to highlight their strengths and limitations as well
as provide avenues for improvements.
Main Characteristics
Deterministic Randomness
Non-deterministic
[2]-way
[3]-way
[4,5,6]-way
[7,8]-way
Combination
Strength
Higher order t
Permit both planning and execution
Allow actual data to be used as input values Automation
Support Support a non-uniform valued parameters
23
2.3 Analysis of T-Way Testing Strategies
This section provides detailed analysis of t-way strategies based on the
characteristics given in Table 2-6. In particular, the discussion will first classify each
strategy based on their dominance approach: the algebraic strategies and the
computational strategies (Cohen, 2004). For each of these strategies, the discussion
will present:
1. A brief description, with a discussion on how t-way testing can be
supported;
2. Analysis of the strategy issues related to the randomness, combination
strength, and automation support;
3. A general observation.
2.3.1 Algebraic strategies
In general, algebraic strategies often yield minimum test suites under some specific
conditions. Because algebraic strategies are known to exploit some mathematical
properties of the inputs in order to permit the generation of test data, their
applications are often limited to pairwise testing (i.e. t=2). The common pairwise
strategies based on algebraic strategies are (Cohen, 2004): Orthogonal Arrays (OA),
Covering Arrays (CA), and Mixed Level Covering Arrays (MCA). Each of these
strategies is described and analyzed in the following subsections.
2.3.1.1 Orthogonal Arrays (OA)
Orthogonal Arrays are based on algebraic and the mathematical concepts (Bush,
1952, Chaudhuri and Zhu, 1997, Kuhfeld, Phadke, 1989, Sherwood, 2002, Sherwood
24
et al., 2005, Yan and Zhang, 2008). Orthogonal Arrays generate test suites from
Latin squares, predominantly in compiler design (Mandl, 1985). Latin squares have
many forms of definitions as presented by different researchers (Anderson, 1997,
Cohen, 2004, Hedayat et al., 1999). Here, Cohen definitions for Latin square,
mutually orthogonal Latin squares (MOLS), and Orthogonal Arrays (OA) are used:
Definition 2.1: “ A Latin Square of order s is an s × s array with entries from a set S
of cardinality s with the condition that for all i in S, i appears exactly once in each
row and each column of the array. Two Latin Squares are orthogonal if, when
superimposed on each other, the ordered pairs created in each cell cover all s2
combinations of symbols” (Cohen, 2004).
Definition 2.2: “A set of Mutually Orthogonal Latin Squares or MOLS has the
property that the squares in the set are pairwise orthogonal. A MOLS(s,w) is a set of
w Latin squares of order s in which any pair are orthogonal” (Cohen, 2004).
Definition 2.3: “An orthogonal array OAλ (N; t, k, v) is an N × k array on v symbols
such that every N × t sub-array contains all ordered subsets of size t from v symbols
exactly λ times” (Cohen, 2004).
Where N represents the number of generated test cases, K represents the number of
parameters, V represents the number of values, t represents degree of interaction, and
λ is the index of the array that equal tV
N
, for software testing λ should equal 1.


![Model-based Approach for Automated Test Case Generation ...msdl.cs.mcgill.ca/conferences/amost/files/A-MOST_2015_submission_4.pdf · towards testing [11]; automated test case generation](https://img.pdfslide.us/doc/110x75/5e7053dd5f83bd7461353fe7/model-based-approach-for-automated-test-case-generation-msdlcs-towards-testing.jpg)