Embed Size (px)
Citation preview

Automated Coverage Calculation and Test Case
Generation
By
George Campbell Morrison
Thesis presented in partial fulfilment
of the requirements for the degree
master of science in engineering
at stellenbosch university
Supervisors: Dr C. P. Inggs
Department of Mathematical Sciences: Computer Science
Mr A. Barnard
Department of Electrical & Electronic Engineering
March 2012

Declaration
By submitting this thesis electronically, I declare that the entirety of the work contained therein
is my own, original work, that I am the sole author thereof (save to the extent explicitly oth-
erwise stated), that reproduction and publication thereof by Stellenbosch University will not
infringe any third party rights and that I have not previously in its entirety or in part submitted
it for obtaining any qualification.
March 2012
Copyright c© 2012 Stellenbosch University
All rights reserved
ii
Stellenbosch University http://scholar.sun.ac.za

Abstract
This research combines symbolic execution, a formal method of static analysis, with various
test adequacy criteria, to explore the effectiveness of using symbolic execution for calculating
code coverage on a program’s existing JUnit test suites. Code coverage is measured with a
number of test adequacy criteria, including statement coverage, branch coverage, condition
coverage, method coverage, class coverage, and loop coverage. The results of the code coverage
calculation is then used to automatically generate JUnit test cases for areas of a program that
are not sufficiently covered. The level of redundancy of each test case is also calculated during
coverage calculation, thereby identifying fully redundant, and partially redundant, test cases.
The combination of symbolic execution and code coverage calculation is extended to perform
coverage calculation during a manual execution of a program, allowing testers to measure the
effectiveness of manual testing.
This is implemented as an Eclipse plug-in, named ATCO, which attempts to take advantage
of the Eclipse workspace and extensible user interface environment to improve usability of the
tool by minimizing the user interaction required to use the tool.
The code coverage calculation process uses constraint solving to determine method pa-
rameter values to reach specific areas in the program. Constraint solving is an expensive
computation, so the tool was parallellised using Java’s Concurrency package, to reduce the
overall execution time of the tool.
iii
Stellenbosch University http://scholar.sun.ac.za

Opsomming
Hierdie navorsing kombineer simboliese uitvoering, ’n formele metode van statiese analise, met
verskeie toets genoegsaamheid kriteria, om die effektiwiteit van die gebruik van simboliese
uitvoer te ondersoek vir die berekening van kode dekking op ’n program se bestaande JUnit
toets stelle. Kode dekking word gemeet deur verskeie toets genoegsaamheid kriteria, insluited
stelling dekking, tak dekking, kondisie dekking, metode dekking, klas dekking, en lus dekking.
Die resultate van die kode dekking berekeninge word dan gebruik om outomaties JUnit toets
voorbeelde te genereer vir areas van ’n program wat nie doeltreffend ondersoek word nie. Die
vlak van oortolligheid van elke toets voorbeeld word ook bereken gedurende die dekkings-
berekening, en daardeur word volledig oortollige, en gedeeltelik oortollige, toets voorbeelde
identifiseer. Die kombinasie van simboliese uitvoer en kode dekking berekening is uitgebrei
deur die uitvoer van dekking berekeninge van ’n gebruiker-beheerde uitvoer, om sodoende kode
dekking van ’n gebruiker-beheerde uitvoer van ’n program te meet. Dit laat toetsers toe om
die effektiwiteit van hulle beheerde uitvoer te meet.
Bogenoemde word geımplimenteer as ’n Eclipse aanvoegsel, genaamd ATCO, wat poog om
voordeel te trek vanuit die Eclipse werkspasie, en die uitbreibare gebruiker oordrag omgewing,
om die bruikbaarheid van ATCO te verbeter, deur die vermindering van die gebruiker interaksie
wat benodig word om ATCO te gebruik.
Die kode dekking berekeningsproses gebruik beperking oplossing om metode invoer waardes
te bereken, om spesifieke areas in die program te bereik. Beperking oplossing is ’n duur bereken-
ing, so ATCO is geparalleliseer, met behulp van Java se Concurrency pakket, om die algehele
uitvoer tyd van die program te verminder.
iv
Stellenbosch University http://scholar.sun.ac.za

Acknowledgements
I would like to thank my supervisor, Dr Cornelia Inggs, who has gone out of her way to help me
complete this thesis. Her guidance, expertise, and willingness to help, even at uncomfortable
times, has truly been invaluable to me during this time. I would also like to thank Mr Arno
Barnard, my co-supervisor at the Faculty of Engineering, whose involvement allowed me to do
the M.Sc.Eng degree.
I would also like to express my sincerest gratitude to my girlfriend, family, and friends, who
have been very understanding, motivating, and supportive, while I was working on this thesis.
Working full-time, while doing this thesis part-time, has been an incredible challenge for me,
and I would not have succeeded without their support.
Lastly, I would like to thank my superiors at S1 Corporation, who have been very accom-
modating to my studies, while I was trying to finish this thesis after hours.
v
Stellenbosch University http://scholar.sun.ac.za

Contents
1 Introduction 1
1.1 Motivation . . . . . . . . . . . . . . . . . . . . . . . . . . . . . . . . . . . . . . 1
1.2 Background . . . . . . . . . . . . . . . . . . . . . . . . . . . . . . . . . . . . . . 2
1.2.1 Symbolic Execution . . . . . . . . . . . . . . . . . . . . . . . . . . . . . 2
1.2.2 Code Coverage . . . . . . . . . . . . . . . . . . . . . . . . . . . . . . . . 4
1.2.3 JUnit Test Generation . . . . . . . . . . . . . . . . . . . . . . . . . . . . 6
1.3 Literature Synopsis . . . . . . . . . . . . . . . . . . . . . . . . . . . . . . . . . . 6
1.4 Objectives . . . . . . . . . . . . . . . . . . . . . . . . . . . . . . . . . . . . . . . 7
1.5 Contributions . . . . . . . . . . . . . . . . . . . . . . . . . . . . . . . . . . . . . 7
1.6 Outline . . . . . . . . . . . . . . . . . . . . . . . . . . . . . . . . . . . . . . . . 8
2 Theoretical Background 11
2.1 Introduction to Program Verification and Program Analysis . . . . . . . . . . . 11
2.2 Program Verification . . . . . . . . . . . . . . . . . . . . . . . . . . . . . . . . . 12
2.2.1 Model Checking . . . . . . . . . . . . . . . . . . . . . . . . . . . . . . . 12
2.2.2 Theorem Proving . . . . . . . . . . . . . . . . . . . . . . . . . . . . . . . 13
2.2.3 Program Verification Tools to Prove the Absence of Bugs . . . . . . . . 14
2.2.4 Program Verification Tools to Find Bugs . . . . . . . . . . . . . . . . . 14
2.2.5 Conclusion . . . . . . . . . . . . . . . . . . . . . . . . . . . . . . . . . . 14
2.3 Program Analysis . . . . . . . . . . . . . . . . . . . . . . . . . . . . . . . . . . . 15
2.3.1 Program Analysis Tools to Prove the Absence of Bugs . . . . . . . . . . 17
2.3.2 Program Analysis Tools to Find Bugs . . . . . . . . . . . . . . . . . . . 17
2.3.3 Conclusion . . . . . . . . . . . . . . . . . . . . . . . . . . . . . . . . . . 17
vi
Stellenbosch University http://scholar.sun.ac.za

2.4 Symbolic Execution . . . . . . . . . . . . . . . . . . . . . . . . . . . . . . . . . 18
2.4.1 Concept . . . . . . . . . . . . . . . . . . . . . . . . . . . . . . . . . . . . 18
2.4.2 Path Condition . . . . . . . . . . . . . . . . . . . . . . . . . . . . . . . . 20
2.4.3 Symbolic Execution Tree . . . . . . . . . . . . . . . . . . . . . . . . . . 21
2.4.4 Issues . . . . . . . . . . . . . . . . . . . . . . . . . . . . . . . . . . . . . 22
2.4.5 Advantages . . . . . . . . . . . . . . . . . . . . . . . . . . . . . . . . . . 24
2.4.6 Extending Symbolic Execution . . . . . . . . . . . . . . . . . . . . . . . 26
2.4.7 Symbolic Execution in Practice . . . . . . . . . . . . . . . . . . . . . . . 27
2.5 Dynamic Analysis . . . . . . . . . . . . . . . . . . . . . . . . . . . . . . . . . . 28
2.5.1 Focused Testing using Program Analysis . . . . . . . . . . . . . . . . . . 29
2.6 Introduction to Test Adequacy and Coverage . . . . . . . . . . . . . . . . . . . 30
2.7 Test Adequacy Criteria . . . . . . . . . . . . . . . . . . . . . . . . . . . . . . . 31
2.7.1 Introduction . . . . . . . . . . . . . . . . . . . . . . . . . . . . . . . . . 31
2.7.2 Categories of Test Data Adequacy Criteria . . . . . . . . . . . . . . . . 32
2.7.3 Focus of this Thesis . . . . . . . . . . . . . . . . . . . . . . . . . . . . . 34
2.8 Code Coverage . . . . . . . . . . . . . . . . . . . . . . . . . . . . . . . . . . . . 34
2.8.1 Specification-based Coverage . . . . . . . . . . . . . . . . . . . . . . . . 34
2.8.2 Program-based Coverage . . . . . . . . . . . . . . . . . . . . . . . . . . 35
2.8.3 Measuring Coverage . . . . . . . . . . . . . . . . . . . . . . . . . . . . . 39
2.8.4 Coverage Tools . . . . . . . . . . . . . . . . . . . . . . . . . . . . . . . . 39
2.9 Conclusion . . . . . . . . . . . . . . . . . . . . . . . . . . . . . . . . . . . . . . 40
3 Design and Implementation 41
3.1 Overview . . . . . . . . . . . . . . . . . . . . . . . . . . . . . . . . . . . . . . . 41
3.2 Information Gathering Phase . . . . . . . . . . . . . . . . . . . . . . . . . . . . 42
3.2.1 Artemis’ Symbolic Execution Engine . . . . . . . . . . . . . . . . . . . . 42
3.2.2 Symbolic Execution Tree . . . . . . . . . . . . . . . . . . . . . . . . . . 45
3.3 Information Analysis Phase . . . . . . . . . . . . . . . . . . . . . . . . . . . . . 53
3.3.1 Execution Tracing . . . . . . . . . . . . . . . . . . . . . . . . . . . . . . 53
3.3.2 Test Environment . . . . . . . . . . . . . . . . . . . . . . . . . . . . . . 55
3.3.3 Calculating Coverage . . . . . . . . . . . . . . . . . . . . . . . . . . . . . 55
3.3.4 Test Redundancy Detection . . . . . . . . . . . . . . . . . . . . . . . . . 63
vii
Stellenbosch University http://scholar.sun.ac.za

3.3.5 Optimisation . . . . . . . . . . . . . . . . . . . . . . . . . . . . . . . . . 64
3.3.6 Execution Tracing of Manual Testing . . . . . . . . . . . . . . . . . . . . 65
3.4 Result Analysis Phase . . . . . . . . . . . . . . . . . . . . . . . . . . . . . . . . 65
3.4.1 Artemis’ Test Generation Engine . . . . . . . . . . . . . . . . . . . . . . 66
3.4.2 Test Generation in ATCO . . . . . . . . . . . . . . . . . . . . . . . . . . 66
3.5 Eclipse Plug-in . . . . . . . . . . . . . . . . . . . . . . . . . . . . . . . . . . . . 66
3.5.1 Resource Management Plug-in . . . . . . . . . . . . . . . . . . . . . . . 67
3.5.2 Workbench Plug-in . . . . . . . . . . . . . . . . . . . . . . . . . . . . . . 67
3.5.3 Jobs . . . . . . . . . . . . . . . . . . . . . . . . . . . . . . . . . . . . . . 73
4 Evaluation 75
4.1 Test Setup . . . . . . . . . . . . . . . . . . . . . . . . . . . . . . . . . . . . . . . 76
4.1.1 Single-core GUI Environment . . . . . . . . . . . . . . . . . . . . . . . . 76
4.1.2 Multi-core Command-Line Environment . . . . . . . . . . . . . . . . . . 76
4.2 Other Tools . . . . . . . . . . . . . . . . . . . . . . . . . . . . . . . . . . . . . . 76
4.3 Correctness of Coverage Calculation . . . . . . . . . . . . . . . . . . . . . . . . 77
4.3.1 Custom Applications . . . . . . . . . . . . . . . . . . . . . . . . . . . . . 77
4.3.2 Small Real-World Applications . . . . . . . . . . . . . . . . . . . . . . . 81
4.3.3 Large Real-World Application . . . . . . . . . . . . . . . . . . . . . . . . 84
4.4 Performance of Coverage Calculation . . . . . . . . . . . . . . . . . . . . . . . . 86
4.4.1 Custom Applications . . . . . . . . . . . . . . . . . . . . . . . . . . . . . 87
4.4.2 Large Real-World Applications . . . . . . . . . . . . . . . . . . . . . . . 88
4.5 Effectiveness of Generated Test Cases . . . . . . . . . . . . . . . . . . . . . . . 89
5 Conclusion 91
5.1 Future Work . . . . . . . . . . . . . . . . . . . . . . . . . . . . . . . . . . . . . 93
Bibliography 95
viii
Stellenbosch University http://scholar.sun.ac.za
List of Tables
4.1 ATCO Correctness Evaluation: Custom Applications . . . . . . . . . . . . . . . 79
4.2 ATCO Correctness Evaluation: Custom Applications with EMMA . . . . . . . 80
4.3 ATCO Correctness Evaluation: Small Applications . . . . . . . . . . . . . . . . 82
4.4 ATCO Correctness Evaluation: Small Applications with EMMA . . . . . . . . 83
4.5 ATCO Correctness Evaluation: Large Application . . . . . . . . . . . . . . . . 85
4.6 ATCO Correctness Evaluation: Large Application with EMMA . . . . . . . . . 86
4.7 ATCO Performance Evaluation: Custom Application . . . . . . . . . . . . . . . 87
4.8 ATCO Performance Evaluation: Large Application . . . . . . . . . . . . . . . . 88
4.9 ATCO Effectiveness of Generated Test Cases Evaluation . . . . . . . . . . . . . 90
ix
Stellenbosch University http://scholar.sun.ac.za

List of Figures
2.1 A symbolic representation of expressions . . . . . . . . . . . . . . . . . . . . . . 19
2.2 A code and graph example of path conditions . . . . . . . . . . . . . . . . . . . 21
2.3 A SET code example . . . . . . . . . . . . . . . . . . . . . . . . . . . . . . . . . 22
2.4 A SET graph . . . . . . . . . . . . . . . . . . . . . . . . . . . . . . . . . . . . . 23
2.5 A code example to illustrate symbolic loops . . . . . . . . . . . . . . . . . . . . 24
2.6 A symbolic loop as a SET . . . . . . . . . . . . . . . . . . . . . . . . . . . . . . 25
2.7 A code example of infeasible statements . . . . . . . . . . . . . . . . . . . . . . 36
2.8 Line coverage . . . . . . . . . . . . . . . . . . . . . . . . . . . . . . . . . . . . . 36
3.1 An interprocedural infeasible path identification example . . . . . . . . . . . . . 45
3.2 A Java switch statement example . . . . . . . . . . . . . . . . . . . . . . . . . 46
3.3 A SET of a Java switch statement . . . . . . . . . . . . . . . . . . . . . . . . 47
3.4 A simple code example to illustrate interprocedural analysis . . . . . . . . . . . 48
3.5 A SET that illustrates branching during interprocedural analysis . . . . . . . . 49
3.6 A SET of a symbolic loop with grouped statements . . . . . . . . . . . . . . . 50
3.7 Breakpoint configuration . . . . . . . . . . . . . . . . . . . . . . . . . . . . . . . 56
3.8 Breakpoint configuration SET . . . . . . . . . . . . . . . . . . . . . . . . . . . 57
3.9 Breakpoint configuration with multiple states . . . . . . . . . . . . . . . . . . . 59
3.10 Breakpoint configuration SET with multiple states . . . . . . . . . . . . . . . . 60
3.11 A SET with coverage counters . . . . . . . . . . . . . . . . . . . . . . . . . . . 61
3.12 Interesting case with symbolic loops . . . . . . . . . . . . . . . . . . . . . . . . 62
3.13 Main preferences page . . . . . . . . . . . . . . . . . . . . . . . . . . . . . . . . 68
3.14 Symbolic execution preferences page . . . . . . . . . . . . . . . . . . . . . . . . 69
3.15 Coverage preferences page . . . . . . . . . . . . . . . . . . . . . . . . . . . . . . 70
x
Stellenbosch University http://scholar.sun.ac.za

3.16 Manual execution preferences page . . . . . . . . . . . . . . . . . . . . . . . . . 70
3.17 The standard Window drop down menu in Eclipse houses the preferences page. 70
3.18 File coverage view . . . . . . . . . . . . . . . . . . . . . . . . . . . . . . . . . . 71
3.19 Detailed file coverage view . . . . . . . . . . . . . . . . . . . . . . . . . . . . . . 72
3.20 JUnit statistics view . . . . . . . . . . . . . . . . . . . . . . . . . . . . . . . . . 72
3.21 Detailed JUnit statistics view . . . . . . . . . . . . . . . . . . . . . . . . . . . . 72
3.22 ATCO action button . . . . . . . . . . . . . . . . . . . . . . . . . . . . . . . . . 73
3.23 Progress par . . . . . . . . . . . . . . . . . . . . . . . . . . . . . . . . . . . . . . 74
xi
Stellenbosch University http://scholar.sun.ac.za

Chapter 1
Introduction
1.1 Motivation
Software testing is a vital part of software development. However, it is a laborious task that
typically accounts for half of the software development cycle [45]. This has encouraged the de-
velopment of various test automation frameworks and tools, to alleviate the effort of performing
software testing. One such framework is the JUnit testing framework [29].
The JUnit testing framework allows software developers to create test cases, which consist
of class instantiations, and method invocations, with specific parameters, which can be executed
by the framework to automatically test the program. A set of these test cases is called a test
suite, and a test suite that aims to test the current functionality of a program is called a
regression test suite. Having a thorough and efficient regression test suite assists in detecting
newly introduced program faults quickly. However, to create and maintain such a regression
test suite is an intensive, time-consuming task.
A number of tools attempt to address this problem by providing mechanisms to automati-
cally generate test cases. These mechanisms range from generating random inputs for methods
(JCrasher [13]), to using symbolic execution [33] to create a symbolic representation of a pro-
gram’s execution (Symstra [45]), to many more. However, simply generating (often large sets
of) test cases is not sufficient to acquire a thorough and efficient regression test suite.
A regression test suite is considered to be thorough if it executes an adequate percentage
of the entire program. For example, a test suite may be considered adequate if 80% of all
statements are covered. However, a thorough regression test suite does not necessarily imply
1
Stellenbosch University http://scholar.sun.ac.za

CHAPTER 1. INTRODUCTION 2
that it is an efficient test suite.
An efficient regression test suite achieves adequate levels of coverage with the minimum
number of test cases. The more test cases contained in a test suite, the longer it will typically
take to execute the suite. Regression test suites may often contain redundant test cases, i.e.,
test cases that do not test any area of the program that has not previously been covered by
another test case in the suite. These redundant test cases increase the time, and resources,
required to execute a regression test suite, without necessarily contributing to the effectiveness
of the suite.
There are tools such as Agitar [1, 45, 46], JTest [27, 45, 46], and Symstra [45], that aim to
generate thorough regression test suites. This is achieved by analysing the program, typically
through a static analysis methodology [27, 45], and then generating test cases to cover as much
of the program as possible. Tools, like Symstra, apply redundancy detection checks to ensure
that as few redundant tests are created as possible. However, these tools create a separate
regression test suite, not considering the content of an already existing regression test suite.
The purpose of this thesis is to explore the practical applicability of using the static anal-
ysis formal method called symbolic execution, to extend the current regression test suite by
generating additional test cases, and adding them to the suite. The aim is for the resulting
regression test suite to be as thorough and efficient as possible.
1.2 Background
This section will provide an overview of what is meant by symbolic execution [33], code coverage
[47], and automated JUnit test case generation.
1.2.1 Symbolic Execution
The notion of symbolic execution follows naturally from normal execution. The code is in-
spected line-by-line, much like an interpreter would execute machine code. However, instead
of actually executing the code, the execution of the program is simulated by inspecting the
code and maintaining a representation of the static state of the program. This representation
of the static state is called the symbolic state. The symbolic execution of a program must be
structured in such a way that the symbolic state is equivalent to the static state of the program,
Stellenbosch University http://scholar.sun.ac.za

CHAPTER 1. INTRODUCTION 3
during normal execution.
When a procedure is symbolically executed, execution proceeds normally until any data,
external to the procedure, is accessed. Data external to the procedure are data entities, like
parameter variables of the procedure, global variables in the program, Input/Output operations,
and others. Whenever an external data entity is accessed, that entity is regarded as a symbolic
value. These symbolic values are used to represent some unknown, yet fixed value. Values that
are not external to the procedure are known as concrete values, and include local variables with
non-symbolic values assigned to them, or constants.
There are two situations where the symbolic state will manipulate data differently from
normal execution. These two situations are evident during the computation of expressions and
during conditional branching.
Computation of Expressions
Since the symbolic values are unknown, any expressions containing symbolic values cannot be
solved. Instead, these expressions are represented in terms of the symbolic values within them.
Conditional Branching
Conditional branching in a program occurs at every branching statement, such as an if state-
ment, where only one of the paths is followed given the conditions in the if. During symbolic
execution, concrete conditions, i.e., conditions composed of only concrete values, are handled
normally, since the result of the condition can be calculated and the correct execution path can
be followed.
Since symbolic values are unknown, if statements with one or more symbolic conditions,
cannot be resolved during symbolic execution. Therefore, these conditional statements are
referred to as unresolved conditional statements. Whenever an unresolved conditional statement
is encountered, it has to be assumed that the condition can be both true and false. This
occurs, because it has to be assumed that a symbolic value can represent any value within the
domain of its type, i.e., if the symbolic value SV is of type int, it can assume any value in the
domain −231 <= SV <= 231 − 1. Since the condition has to be assumed as both true and
false, both execution paths need to be followed. When both paths are followed, it means that
the execution forks into two parallel executions of the current procedure, where the execution
Stellenbosch University http://scholar.sun.ac.za
CHAPTER 1. INTRODUCTION 4
of each path proceeds as normal, except for the assumed outcome of the unresolved conditional
statement.
The assumptions are stored with their values in the symbolic state as a path condition,
because assumptions made by one unresolved conditional statement may assist in resolving
subsequent unresolved statement executions.
Path Condition
The path condition (PC ) is an accumulator of conditions on symbolic values which determines
a unique control path through the program. Each path has its own PC and no two PC s are
ever identical.
At the beginning of a program, the PC is set to true. When a conditional branching
statement is encountered, its condition (represented by b(C)) is examined. If b(C) contains no
symbolic values, i.e., only concrete values, then b(C) can be solved using the concrete values.
The correct path can then be followed with no modification to the PC. However, if b(C) is
an unresolved condition, the execution has to be forked into two parallel executions. The two
forked executions will each receive a copy of the PC, at that point, and the assumed result of
b(C) is added to the PC :
PC1∧
b(C)
PC2∧¬b(C)
Execution of each path continues in parallel, where the path represented by PC1 assumes
b(C) = true and the path represented by PC2 assumes ¬b(C) = true.
1.2.2 Code Coverage
Code coverage, a field of study under test adequacy [47], is the measurement of a coverage
criterion. A coverage criterion is a testing requirement, which specifies that some element of
a program should be covered. To cover an element of a program means to execute or analyse
that element during testing. The coverage criteria considered in this thesis may be categorised
as control-flow criteria.
Control-flow criteria is specified over the coverage of the control-flow graph of a program.
The control-flow graph is a graphic interpretation of the execution of a program, where the
nodes represent code blocks, branches occur at conditional statements, and the edges represent
Stellenbosch University http://scholar.sun.ac.za

CHAPTER 1. INTRODUCTION 5
the conditions required to hold for that path to be followed. Every execution of a program
corresponds to a path in the control-flow graph, known as the execution path, from the begin
node to the end node. The begin node represents the entry point of the program, and the end
node represents the point of program termination.
The four common coverage criteria specified over the control-flow graph are:
• Statement coverage: Statement coverage is a very basic testing requirement which speci-
fies that every statement in the code should be executed at least once.
• Branch coverage: Branch coverage specifies that each possible branch of every branching
statement should be executed at least once.
• Method coverage: Method coverage is the testing requirement that every method in a
program should be executed at least once.
• Class coverage: This testing requirement specifies that every class in a program should
be executed at least once, i.e., any one of its methods should be executed at least once.
An additional, uncommon, coverage criterion considered in this thesis is loop coverage. This
testing requirement specifies that every loop in a program should be iterated at least twice.
The purpose of loop coverage is to detect bugs that present themselves when a loop is iterated
more than once [30]. By this definition, loops, designed to iterate only once or never at all, will
never satisfy the loop coverage criterion.
Measuring Code Coverage
There are various approaches to measure the criteria. Atlassian, the creators of Clover [9, 46],
identified three approaches to measure code coverage of Java programs:
1. Source code instrumentation is an approach where instrumentation statements, such as
annotations or method calls to the coverage calculation tool, are added to the source
code. The code is then compiled to produce an instrumented assembly.
2. Intermediate code instrumentation is an approach where the compiled class files are in-
strumented by adding new byte codes, and a new instrumented class is generated.
Stellenbosch University http://scholar.sun.ac.za

CHAPTER 1. INTRODUCTION 6
3. Run-time information collection is an approach that collects information from the run-
time environment, as the code executes, to determine coverage information.
As the program under test is executed, coverage is measured according to one, or a combination,
of these measuring approaches.
This thesis uses run-time information collection, in the form of execution tracing, to measure
code coverage. Execution tracing involves closely monitoring the Java Virtual Machine (JVM )
that executes a program, through the use of the Java Platform Debugger Architecture (JPDA)
[4].
1.2.3 JUnit Test Generation
The symbolic state, constructed during symbolic execution, contains sufficient information,
such as local variable values and path conditions on symbolic values, to generate a test case
that will reach that specific symbolic state during normal execution. It is, therefore, possible
to generate test cases to execute specific branches of a program, with the help of the symbolic
states that represent those specific branches. These test cases are generated as JUnit test cases,
which can be compiled by the Java compiler, and executed with the JUnit testing framework.
1.3 Literature Synopsis
James King [33] sought to find a middle-ground between program verification and program
testing in 1976. This middle-ground was symbolic execution. It presented a way to symbolically
represent the behaviour of a program. Symbolic execution has since been used in a variety of
studies, to investigate how the formal method can assist in the analysis and testing of programs.
The research most relevant to this thesis, and the symbolic execution engine used in this
thesis, is that of Tomb et al. [39]. Tomb et al. studied the use of symbolic execution to detect
unhandled run-time exceptions. They analysed a program’s byte code to detect any possible
exceptions that may occur during the execution of a program. If this exception is not properly
handled, e.g., with the help of try-catch blocks in Java, a JUnit test case is generated to
confirm whether the possible exception is, in fact, handled or not.
Many studies regarding symbolic execution aim to use it to generate JUnit test cases to
achieve high levels of code coverage [45]. The studies have shown that symbolic execution can
Stellenbosch University http://scholar.sun.ac.za

CHAPTER 1. INTRODUCTION 7
be used to generate such test cases from an analysis of the code; the code is analysed, and a
separate, independent test suite is created. However, none of the studies found considered an
already existing JUnit regression test suite.
Code coverage calculation tools are wide-spread, and measure a variety of code coverage
criteria. Those that are available in the industry are typically focused on measuring common
coverage criteria, such as statement (line) coverage, branch coverage, method coverage, and
class coverage [46]. The less common coverage criteria are typically omitted due to the increased
complexity and difficulty to measure them.
1.4 Objectives
The goal of this thesis is to explore the practical applicability of using the static analysis formal
method known as symbolic execution, to calculate code coverage of an existing regression test
suite, and then to extend the test suite by generating additional test cases, such that the
resulting regression test suite is as thorough and efficient as possible.
The main objectives of this thesis are as follows:
• Use symbolic execution to measure code coverage of an existing regression test suite for
various common coverage criteria. These common criteria include statement coverage,
branch coverage, class coverage, and method coverage.
• Use the results from symbolic execution and coverage calculation to generate JUnit test
cases for all areas not covered by the current regression test suite. Evaluate the effective-
ness of the resulting regression test suite.
• Design the solution to benefit from a multi-processor environment, and evaluate the
benefits of this concurrent design.
• Integrate the solution into an Eclipse plug-in to improve its usability.
1.5 Contributions
To achieve the objectives of this thesis, ATCO (Automated Test Coverage Calculation and
GeneratiOn) was developed, and the following contributions were made:
Stellenbosch University http://scholar.sun.ac.za

CHAPTER 1. INTRODUCTION 8
• Symbolic execution can be used to measure code coverage of the common coverage criteria
when primitive data types are used. A level of inaccuracy is introduced with more com-
plex data types and branching conditions, however, since the path conditions containing
complex data types cannot currently be solved.
• Combining symbolic execution with coverage calculation allows JUnit test cases to be
generated automatically for areas of a program not tested with the current regression
test suite.
• ATCO is designed to utilise the additional processors of a multi-core platform. This
allows sections of ATCO to execute concurrently, thereby reducing the time required to
perform its tasks by up to 54%.
• ATCO is implemented as an Eclipse plug-in, utilising the graphical user interface (GUI )
extensions, provided by Eclipse. This greatly improves the usability of ATCO.
Along with the main objectives, the following additional contributions were made during
this thesis:
• Using symbolic execution to measure code coverage of a less common coverage criterion,
such as loop coverage.
• Extending ATCO to perform test redundancy detection, i.e., monitoring whether the
tests in the existing regression test suite cover unique areas of the code, or whether they
only cover areas covered by other tests.
• Using execution tracing to calculate coverage for the manual execution of a program,
which can give program testers the ability to verify the thoroughness of their manual
testing.
1.6 Outline
The rest of this thesis is structured as follows.
Chapter 2: Theoretical Background provides an overview of the theory of testing and
test adequacy. This chapter is separated into two parts.
Stellenbosch University http://scholar.sun.ac.za

CHAPTER 1. INTRODUCTION 9
First, the chapter presents two methodologies of testing, the one is proving the absence
of bugs, and the other is finding bugs. The chapter also presents two approaches to these
methodologies, namely program verification and program analysis. These approaches, and how
they are used with regard to testing, are compared. This broad overview provides the necessary
context for an in-depth description of symbolic execution, and how it can be used for testing.
Second, the chapter presents an overview of test adequacy. It describes the use of testing
requirements in the measurement of test adequacy, followed by a classification of various test
adequacy criteria categories. The chapter then discusses code coverage, a field of study under
test adequacy, and particularly focuses on program-based coverage, where the coverage criteria
are described. Available methods of measuring coverage are also presented, followed by a
discussion on some of the coverage calculation tools, and their preferred methods of measuring
coverage.
Chapter 3: Design and Implementation contains an in-depth description of the design
and implementation ATCO, the Eclipse plug-in that is implemented for this thesis. This
description includes how symbolic execution is used, how that information is presented in
preparation of coverage calculation, how coverage is measured, and how the resulting data
is used to automatically generate JUnit test cases. Additionally, a description of Eclipse’s
extensible plug-in framework, and the design of the Graphical User Interface (GUI ) for ATCO,
as it is integrated into the Eclipse environment, is discussed.
The chapter also discusses the benefits, and some interesting occurrences, of using symbolic
execution to measure coverage, as well as the benefits of using execution tracing to drive
the coverage calculation. Various possibilities of extending the functionality of ATCO are
presented. These extensions are: measuring uncommon coverage criteria, test redundancy
detection, and method invocation recording.
The concurrent design of ATCO, the design considerations that impact the concurrent
measurement of coverage, and additional optimisation considerations are also discussed.
Chapter 4: Evaluation presents and analyses the various experiments that are used to
evaluate ATCO.
The experiments are separated into three sets. First, the experiments are aimed at verifying
the correctness of ATCO, through manual inspection as well as a comparison with another
Stellenbosch University http://scholar.sun.ac.za

CHAPTER 1. INTRODUCTION 10
coverage calculation tool. Second, the experiments focus on evaluating the performance benefits
of the concurrent design of ATCO. Third, the experiments measure the effectiveness of the
resulting regression test suite. Each set of experiments begins with a discussion on the goals
of that set of experiments. This is followed by a description of the programs that are used for
those experiments. And each set of experiments is concluded with an analysis of the results
achieved by that set.
Chapter 5: Conclusion concludes this thesis by summarising the findings in using symbolic
execution to measure code coverage, and then automatically generate JUnit test cases. It also
presents potential avenues for future work.
Stellenbosch University http://scholar.sun.ac.za

Chapter 2
Theoretical Background
2.1 Introduction to Program Verification and Program Analy-
sis
Developing large-scale, complex systems has become common practice in software development.
Unfortunately, an increase in scale and complexity often also increases the likelihood of subtle
errors being introduced into the system. When a program does not function according to its
intended design and purpose it may result in an undesirable user experience, financial losses may
be incurred and, in some cases, human lives may even be lost [8]. Testing, as will be discussed
in this chapter, has, therefore, become an important part of the software development cycle.
Testing aims to prevent, or at least minimise, the damage caused by erroneous systems
through one of two methodologies. The first methodology is proving the absence of bugs. In
order to prove the absence of a bug, it needs be proven that the bug can never occur on any
of the execution paths of the system. The second methodology is finding bugs, e.g., finding
code that has been implemented incorrectly due to, e.g., an insufficient understanding of the
programming language, or as a result of insufficient error checking for irregular inputs.
In this chapter, program verification and program analysis and how these methods may
be used to test a system to either find bugs, or to prove the absence of bugs will be briefly
discussed. Some of the techniques in these testing methodologies that are applicable to this
thesis, will also be discussed.
11
Stellenbosch University http://scholar.sun.ac.za

CHAPTER 2. THEORETICAL BACKGROUND 12
2.2 Program Verification
Program verification is a formal method. Formal methods are mathematically-based languages,
techniques, and tools for specifying and verifying complex software systems. To verify a pro-
gram, the system and the properties to be verified are expressed in some formalism and the
verification techniques are, subsequently, used to analyse the system to determine whether the
desired properties have been retained in the program.
Two well-established verification techniques are model checking and theorem proving (Clarke
et al. [8]).
2.2.1 Model Checking
Model checking is a technique for verifying finite state concurrent systems. This technique was
initially used for hardware verification, but later much research went into also using model
checking to analyse the specifications of software systems [8].
The model checking process consists of three tasks:
Modelling: To verify the design of a system, it needs to be converted to a model that can
be read by a model-checking tool. A model is generally constructed using a modelling
language, e.g., the Promela modelling language used for the model checker, SPIN. Alter-
natively, the implementation may be verified by using a model-checking tool that supports
the programming language in which the system has been written. Depending on the size
of the state space and the limitations on time and memory, abstractions may be required,
to exclude irrelevant details.
Specification: The correctness properties that should be satisfied during program execution,
need to be specified. Temporal logic is commonly used to specify the correctness proper-
ties, since it is able to determine how the behaviour of the system evolves over time.
Verification: The model checker automatically verifies whether the system satisfies the spec-
ified properties, by traversing the state space and determining whether the properties
have been retained in the model. If the verification process fails to terminate due to the
size of the model, the model needs to be adjusted, e.g., by adding additional abstrac-
tions, and the verification process needs to be restarted. In the event that the verification
Stellenbosch University http://scholar.sun.ac.za

CHAPTER 2. THEORETICAL BACKGROUND 13
process terminates normally and an error has been encountered, the error trace needs
to be examined manually. This error trace, known as a counterexample, may be used to
determine where the error occurred. Errors may indicate one of two possibilities:
1. An error in the design of the system, i.e., one or more properties are not satisfied in
the design. Examining the error trace can assist in locating the problem area in the
design, allowing it to be repaired.
2. Human error in either the modelling of the design, or the specification of the prop-
erties. Errors that occur as a result of human error are often called false negatives,
denoting an error that occurs in the model that will not occur in the design. Exam-
ining the error trace can assist in identifying the problem.
The most significant drawback of model checking is the state-explosion problem [7]. The
state-explosion problem is defined by the rapid increase in the size of the state space as system
complexity increases, i.e., the state space grows exponentially with each program variable,
concurrent component, and communication channel in each process running on the concurrent
system. Since resource requirements and verification time are directly proportional to the size
of the state space, the availability of these resources limits the size and complexity of the
systems that may be verified.
2.2.2 Theorem Proving
In model checking, a system is modelled as program states at specific intervals and the proper-
ties to be checked are specified using a formalism such as temporal logic. In theorem proving,
however, a program is modelled as a set of mathematical definitions in some formal logic and
the properties to be checked are then derived as theorems that follow from these definitions [3].
Because the program is modelled as a set of mathematical definitions, theorem proving can
verify programs with infinite state spaces, as well as handle complex data types and recursion,
effectively. This makes theorem proving well suited for “data-intensive” systems with complex
data structures [35].
Even though theorem provers have some distinct advantages over model checking, they do
have significant disadvantages, as well. First, the generated proofs can be large and difficult to
understand. As a result, the generated proofs require a great deal of user expertise and effort
Stellenbosch University http://scholar.sun.ac.za

CHAPTER 2. THEORETICAL BACKGROUND 14
to use. Second, theorem provers cannot be fully automated, thereby, again, indicating the need
for user expertise [35].
2.2.3 Program Verification Tools to Prove the Absence of Bugs
To prove the absence of a bug, with respect to the specified properties, the model checker has
to exhaustively investigate all execution paths to prove that no execution path violates the
specified properties.
Model checking is a strong and successful formal method for verifying a system. However,
original model checkers required the specification of system design in a modelling language,
which required expert knowledge.
Corbett et al. [11] attempted to solve the problem of converting a system to be model
checked to a modelling language, by creating Bandera. Instead of requiring expert knowledge
to create models from existing systems, this tool, Bandera, accepts Java source code and
converts it into a modelling language that is accepted by model-checking applications. To
minimise the model size, developers have to manually add data abstraction information.
2.2.4 Program Verification Tools to Find Bugs
Some model checkers have been adapted to handle programming languages. The model checker,
SPIN, has been adapted to handle embedded C or C++ in verification models [22].
Visser et al. [43] took another path and created Java Pathfinder (JPF ), a custom-designed
model checker. JPF is a model checker designed specifically for testing multi-threaded, interac-
tive Java programs. It works from the compiled version of Java source code, known as byte code,
which is executed within the Java Virtual Machine (JVM ) run-time environment. The model
is constructed by using a custom JVM (JVMJPF ) that analyses the byte code and interprets
the behaviour of the different threading components of the program, thereby constructing the
state space. JVMJPF guides the execution of the program while JPF analyses the resulting
state space to find race conditions and deadlocks that are common in multi-threaded programs.
2.2.5 Conclusion
Program verification may either be used to prove that specific correctness properties are satisfied
within all existing execution paths of a system, or it may be used to find behavioural bugs in
Stellenbosch University http://scholar.sun.ac.za

CHAPTER 2. THEORETICAL BACKGROUND 15
a system.
It is important to note that even if a model checker could perform an exhaustive verification,
i.e., check that all execution paths satisfy all the specified properties, it still does not guarantee
the correctness of the system. Verification techniques check only for the specified properties. If
there were an error in the system that would have violated any particular property, which had
never been specified and, therefore, never been checked, that particular error would remain
undetected. Verification techniques also have a scalability issue, due to the state explosion
problem. However, program verification increases our understanding of a system by revealing
inconsistencies, ambiguities, and any incomplete sections of a system that might otherwise have
been undetected [8].
2.3 Program Analysis
Another approach to testing is program analysis. Program analysis, often referred to as static
analysis, offers static compile-time techniques for predicting safe approximations of program
data or program behaviour that arise dynamically at run-time, during the execution of a
program on a computer. According to Nielson et al. [34], program analysis may be divided into
a number of techniques, with this thesis focusing on the following three techniques:
1. Data-flow Analysis graphically represents data changes in a program, where the nodes
represent possible states of the data and the edges represent state changes.
2. Constraint-based Analysis is used to approximate control-flow data. Control-flow
analysis determines information about execution behaviour, i.e., determining which state-
ments lead to which other statements. However, in functional and object-oriented lan-
guages, this information is not, necessarily, available immediately. Constraint-based anal-
ysis allows for the control-flow analysis of these languages, by representing data as sets
of constraints.
3. Abstract Interpretation: Whereas data-flow analysis represents changes in the state
of data, abstract interpretation represents the state of data at a specific point in the
program by using collecting semantics to accurately trace the possible values of data at
that point. Galois connections [34] are then used to group these collecting semantics for
Stellenbosch University http://scholar.sun.ac.za

CHAPTER 2. THEORETICAL BACKGROUND 16
each field of data, thus, obtaining a smaller domain that represents the behaviour of the
data of the program more accurately.
There are various sub-techniques that further define these techniques [34]. For the purposes
of this thesis, particular attention is paid to two of these sub-techniques that form part of
data-flow analysis. These sub-techniques are intraprocedural and interprocedural analysis. The
defining difference between these two techniques is the manner in which they handle methods
in a program.
Intraprocedural Analysis analyses each method of a program as an independent block of
code. Any function or procedure call, encountered during intraprocedural analysis is
skipped, thereby ignoring the effect that such calls might have on the data. By skipping
these calls, the approximations of data values are not as accurate, but require significantly
less memory compared to interprocedural analysis, since each method is handled as a
closed system.
Interprocedural Analysis takes function and procedure calls into account. All the function
and procedure calls encountered are followed, thereby taking into account the effect they
have on the data. This approach allows for a more accurate analysis of the program
than intraprocedural analysis, but demands more resources and gives rise to a number of
complications. These complications arise as a result of the need for ensuring that calls and
returns match one another, when dealing with parameter mechanisms (and the aliasing
that may result from call-by-reference method parameters), and when allowing procedures
as parameters. Resource requirements can be reduced by defining a call depth, k. The
purpose of k is to limit the depth that the analysis will follow from the top-level method.
Thus with k = 1, all procedure calls within the analysed method will be called, but calls
within those procedures will not be called. The higher the value of k, the deeper the
analysis will follow the call graph, but the more memory will be required when applying
this technique.
King [32] created a formal method of static analysis, called symbolic execution, which relies
on constraint-based analysis, as well as intraprocedural and interprocedural analysis, mentioned
above. This is the analysis technique this thesis is based on, and it will, therefore, be discussed
in detail later in this chapter.
Stellenbosch University http://scholar.sun.ac.za

CHAPTER 2. THEORETICAL BACKGROUND 17
2.3.1 Program Analysis Tools to Prove the Absence of Bugs
Analysis tools that focus on proving the absence of bugs are path-insensitive, i.e., the analysis
is not guided by execution paths and conditional branches. ASTREE [12] is an abstract
interpretation-based program analyser that focuses on proving the absence of run-time bugs
in C. It uses data-flow analysis to verify that all data in the program is used within the rules
defined by the programming language, e.g., ensuring the short variable type is used only
within the constraints of its domain, or that array indexing occurs within the defined bounds.
ASTREE uses multiple abstract domains to analyse different aspects of the program, as well as
to allow the analysis processes of these domains to closely interact with each other to achieve
mutual reduction over all domains.
Another example of an analysis tool is ESC/Java [19], a tool that uses annotations to
indicate design decisions of routines. These annotations are inspected during intraprocedural
analysis and any violations found against these design decisions are reported. ESC/Java uses
a theorem-prover to reason about program semantics and is, therefore, able to check for syn-
chronisation errors of concurrent programs. The annotations need to be added manually, so a
substantial period of time is required for development preparation.
2.3.2 Program Analysis Tools to Find Bugs
Analysis tools focusing on finding bugs are typically path-sensitive, i.e., the analysis is guided
by execution paths and/or conditional branches. An example of such an analysis tool, is the
static analyser FindBugs, created by Hovemeyer et al. [23]. This analysis tool is built on
the assumption that most bugs that reside in programs are blatant errors that are easy to find
during code inspection. FindBugs uses class structure, data-flow, and control-flow information,
as well as an instruction state machine to analyse each class and search for patterns that
typically cause errors during execution. It uses simple, broad techniques to uncover common,
and likely, bugs. FindBugs also requires little or no development preparation for its application.
2.3.3 Conclusion
We discussed static analysis and how it may be used to both analyse and verify a program
through code-inspection methods, using information extracted from the code by means of
data-flow and control-flow information, or by using information supplied by the user, by means
Stellenbosch University http://scholar.sun.ac.za

CHAPTER 2. THEORETICAL BACKGROUND 18
of annotations. However, static analysers are unsound, i.e., they return false positives. If a tool
returns a false positive, it means that the tool has indicated that a section of code contains an
error, but, that under execution, it is not an actual error. Since the user has to go through all
identified errors and determine whether a bug actually exists, examining these false positives
are usually time-consuming.
2.4 Symbolic Execution
Symbolic execution is the formal method that forms the fundamental part of this thesis.
In 1975, James C. King [32] identified program testing and program proving as the two
extremes of program verification in terms of the number of times a program needs to be exe-
cuted. On the one extreme, to verify the correctness of a program through testing, the program
must be executed at least once for every possible unique input, which, typically, requires an
infinite number of program executions. On the other extreme, to verify the correctness of a
program through a correctness proof, the program requires no execution, but a tedious, and
often difficult, formal analysis. King proposed a middle-ground in the spectrum, between run-
ning individual tests and general correctness proofs. This proposed middle-ground is known
as symbolic execution [33], which is the analysis technique that forms the fundamental part of
the research in this thesis.
2.4.1 Concept
The notion of symbolic execution follows naturally from normal execution. The code is in-
spected line-by-line, much like an interpreter would execute machine code. However, instead
of actually executing the code, the execution of the program is simulated by inspecting the
code and maintaining a representation of the static state of the program. This representation
of the static state will, from here on, be called the symbolic state. The symbolic execution of
a program must be structured in such a way that the symbolic state is equivalent to the static
state of the program, during normal execution.
When a procedure is symbolically executed, execution proceeds as normal until any data,
external to the procedure, is accessed. Data external to the procedure are data entities, like
parameter variables of the procedure, global variables in the program, Input/Output operations,
Stellenbosch University http://scholar.sun.ac.za

CHAPTER 2. THEORETICAL BACKGROUND 19
and others. Whenever an external data entity is accessed, that entity is regarded as a symbolic
value. These symbolic values are used to represent some unknown, yet fixed value, as opposed
to, e.g., program variables, which are symbolic names that may assume numerous different
values during the execution of a program. Values that are not external to the procedure
are known as concrete values, and include local variables with non-symbolic values assigned
to them, or constants. From this description, it is clear that symbolic execution is, by its
definition, an intraprocedural analysis technique.
There are two situations where the symbolic state will manipulate data differently from
normal execution. These two situations are evident during the computation of expressions and
during conditional branching.
Computation of Expressions
Since the symbolic values are unknown, any expressions containing symbolic values cannot be
solved. Instead, these expressions are represented in terms of the symbolic values within them.
The example shown in Figure 2.1, p. 19 explains this representation clearly.
Expression Symbolic Representation
A = α A = α
B = β B = β
C = A+ 2×B C = α+ 2× βD = C −A D = α+ 2× β − α
= 2× β
Figure 2.1: This is an example of the symbolic representation of expressions. In this example,variable A is assigned the symbolic value α and variable B is assigned the symbolic value β.Variables C and D are assigned values through arithmetic expressions composed of variablesA, B and C, and the resulting representation of its assigned value is shown under the SymbolicRepresentation.
Conditional Branching
Conditional branching in a program occurs at every branching statement, such as an if state-
ment, where only one of the paths is followed given the conditions in the if. During symbolic
execution, concrete conditions, i.e., conditions composed of only concrete values, are handled
normally, since the result of the condition can be calculated and the correct execution path can
be followed.
Stellenbosch University http://scholar.sun.ac.za

CHAPTER 2. THEORETICAL BACKGROUND 20
Since symbolic values are unknown, if statements, with one or more symbolic conditions,
cannot be resolved during symbolic execution. Therefore, these conditional statements are
referred to as unresolved conditional statements. Whenever an unresolved conditional statement
is encountered, it has to be assumed that the condition can be both true and false. This
occurs, because it has to be assumed that a symbolic value can represent any value within the
domain of its type, i.e., if the symbolic value is of type int, it can assume any value in the
domain −231 <= SV <= 231 − 1. Since the condition has to be assumed as both true and
false, both execution paths need to be followed. When both paths are followed, it means that
the execution forks into two parallel executions of the current procedure, where the execution of
each path proceeds as normally, except for the assumed outcome of the unresolved conditional
statement.
The assumptions are stored with their values in the symbolic state as a path condition,
because assumptions made by one unresolved conditional statement may assist in resolving
subsequent unresolved statement executions.
2.4.2 Path Condition
The path condition (PC ) is an accumulator of conditions on symbolic values which determines
a unique control path through the program. Each path has its own PC and no two PC s are
ever identical.
At the beginning of a program, the PC is set to true. When a conditional branching
statement is encountered, its condition (represented by b(C)) is examined. If b(C) contains no
symbolic values, i.e., only concrete values, then b(C) can be solved using the concrete values.
The correct path can, then, be followed with no modification to the PC. However, if b(C) is
an unresolved condition, the execution has to be forked into two parallel executions. The two
forked executions will each receive a copy of the PC, at that point, and the assumed result of
b(C) is added to the PC :
PC1 ≡ PC∧
b(C)
PC2 ≡ PC∧¬b(C)
Execution of each path continues in parallel, where the path represented by PC1 assumes
b(C) = true and the path represented by PC2 assumes ¬b(C) = true. Figure 2.2, p. 21
provides an example taken from [31].
Stellenbosch University http://scholar.sun.ac.za

CHAPTER 2. THEORETICAL BACKGROUND 21
Figure 2.2: This figure contains a code and graph example of path conditions. The codesnippet on the left shows two variables, x and y. These variables have the symbolic values X
and Y, respectively, associated with them. The graph on the right shows how the PC changesduring symbolic execution. The number, associated with each edge, shows the line numberof the statement executed, while each node represents the state of the PC and the symbolicvariables.
2.4.3 Symbolic Execution Tree
As is the case with normal execution, where the static states may be used to produce an
execution tree that represents the different execution paths that the program may take, so
can symbolic states be used to produce a Symbolic Execution Tree (SET ) that characterises
the execution of a procedure. Each node in the SET represents the program state after the
program statement that has been executed, and the transition between nodes is a directed arc
connecting the two nodes. Each unresolved conditional statement that causes the symbolic
execution to be forked into two parallel execution paths, results in a fork in the SET.
Each SET node typically contains:
• a statement counter
• variable values stored as concrete values, if concrete, or as formulae over symbolic
values, if symbolic.
• a PC consisting of a set of constraints over symbolic values characterising conditions the
Stellenbosch University http://scholar.sun.ac.za

CHAPTER 2. THEORETICAL BACKGROUND 22
variable values would have to satisfy to reach the node.
The graph in Figure 2.2, p. 21 is an example of what a SET would look like for the code
snippet provided in the figure. Another example of a code snippet and its corresponding SET,
taken from [25], is shown in Figure 2.3, p. 22 and Figure 2.4, p. 23 respectively.
1: int min( int a, int b ) {
2: int min = a;
3: if ( b < min )
4: min = b;
5: if ( a < min )
6: min = a;
7: return min;
8: }
Figure 2.3: A simple method example, which is used to illustrate a SET. The method calcu-lates the minimum of two arguments.
2.4.4 Issues
Symbolic execution has issues that need to be addressed. First, it is possible for a path
condition (PC ) to be unsatisfiable, i.e., it may contain contradicting conditions [16]. The
example in Figure 2.2, p. 21 illustrates this situation. In the example, the assert(false);
statement indicates that, at that point, a contradiction would be present in the PC. The code
snippet switches the symbolic values of the variables, i.e., x becomes Y and y becomes X. The
first condition in the PC is that X > Y, while the second condition states that, to follow that
execution path, Y - X > 0, i.e., to follow that execution path (X > Y & Y - X > 0) must
be true, which is impossible. Although the code is semantically correct, the instruction at
line 6 will never be reached, due to the contradicting conditions of the variable x. Since
symbolic execution will attempt to fork the execution at line 5, a theorem-prover will need
to be instrumented to ensure that the PC s do not contain contradictions. All PC s with
contradictions indicate an execution path that will never be followed during normal execution
and, therefore, the execution path should not be expanded. Figure 2.4, p. 23 shows a SET
with two paths that contain contradictions. These two paths are the paths that end with
nodes labeled backtrack.
Stellenbosch University http://scholar.sun.ac.za

CHAPTER 2. THEORETICAL BACKGROUND 23
Figure 2.4: This is the SET graph of the method displayed in Figure 2.3, p. 22.
Second, the number of times a loop with symbolic conditions needs to be iterated is un-
known. Concrete loops, i.e., loops that contain only concrete conditions, are straightforward
during symbolic execution. A concrete loop is merely a block of code that will be executed
a concrete number of times. Thus, during symbolic execution, the code is symbolically exe-
cuted a concrete number of times. However, limiting the number of iterations of concrete loops
might be considered if the concrete number becomes large. Symbolic loops, i.e., loops that
contain symbolic conditions, need to be handled differently. The conditions contain symbolic
values, requiring that both the true and false paths be followed, at every iteration of the
loop. The true path of a loop results in another iteration, while the false path results in
the execution breaking out of the loop. In other words, after every iteration of the loop, the
loop is both exited and re-entered for another iteration. This can result in the loop iterating
through the entire domain of the counting variable’s type, depending on the start value and
whether counting is incremental or decremental. As the symbolic execution will attempt to
Stellenbosch University http://scholar.sun.ac.za
CHAPTER 2. THEORETICAL BACKGROUND 24
iterate through the entire domain of the counting variable’s type, a state explosion problem
may occur. The explosion problem becomes even more apparent when nested symbolic loops
are used, i.e., symbolic loops containing symbolic loops.
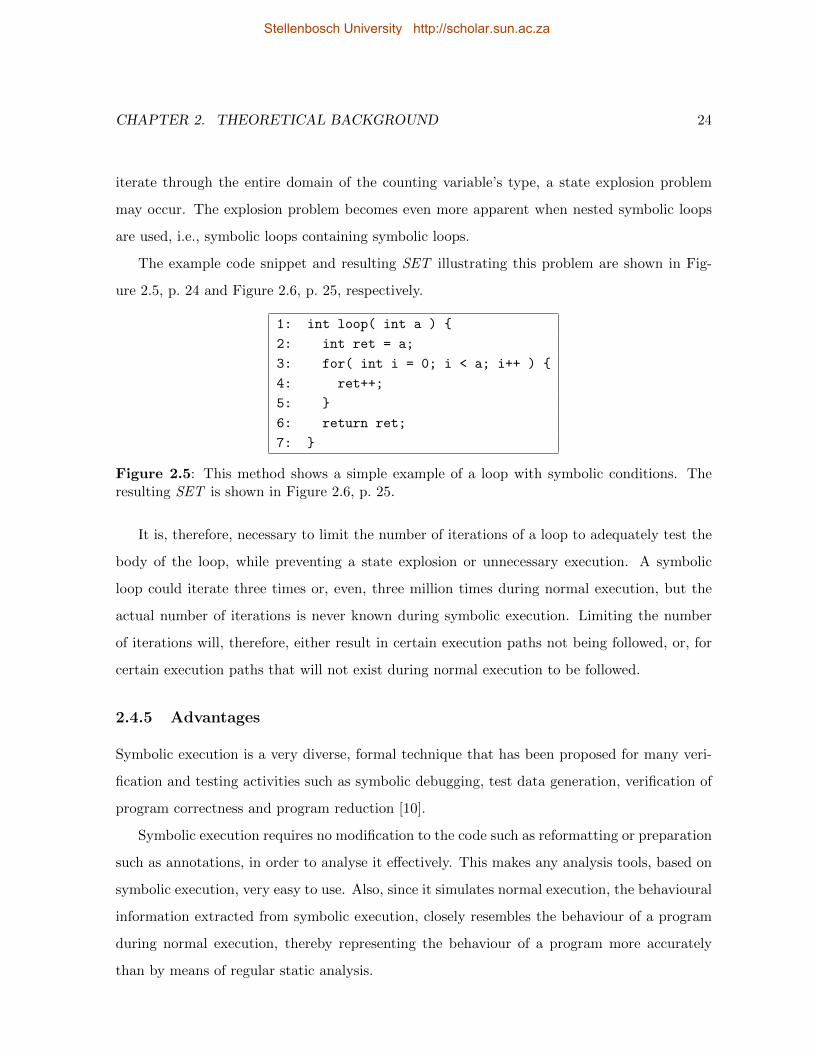
The example code snippet and resulting SET illustrating this problem are shown in Fig-
ure 2.5, p. 24 and Figure 2.6, p. 25, respectively.
1: int loop( int a ) {
2: int ret = a;
3: for( int i = 0; i < a; i++ ) {
4: ret++;
5: }
6: return ret;
7: }
Figure 2.5: This method shows a simple example of a loop with symbolic conditions. Theresulting SET is shown in Figure 2.6, p. 25.
It is, therefore, necessary to limit the number of iterations of a loop to adequately test the
body of the loop, while preventing a state explosion or unnecessary execution. A symbolic
loop could iterate three times or, even, three million times during normal execution, but the
actual number of iterations is never known during symbolic execution. Limiting the number
of iterations will, therefore, either result in certain execution paths not being followed, or, for
certain execution paths that will not exist during normal execution to be followed.
2.4.5 Advantages
Symbolic execution is a very diverse, formal technique that has been proposed for many veri-
fication and testing activities such as symbolic debugging, test data generation, verification of
program correctness and program reduction [10].
Symbolic execution requires no modification to the code such as reformatting or preparation
such as annotations, in order to analyse it effectively. This makes any analysis tools, based on
symbolic execution, very easy to use. Also, since it simulates normal execution, the behavioural
information extracted from symbolic execution, closely resembles the behaviour of a program
during normal execution, thereby representing the behaviour of a program more accurately
than by means of regular static analysis.
Stellenbosch University http://scholar.sun.ac.za

CHAPTER 2. THEORETICAL BACKGROUND 25
Figure 2.6: This is an example of a symbolic loop, represented as a SET. It is the result of thecode in Figure 2.5, p. 24 being symbolically executed. Each node represents a symbolic statewith variables and path conditions. Each edge indicates the Java statement that was executedto transition from the one node to the other.
Stellenbosch University http://scholar.sun.ac.za

CHAPTER 2. THEORETICAL BACKGROUND 26
2.4.6 Extending Symbolic Execution
Interprocedural Symbolic Execution
As mentioned earlier, symbolic execution is, by nature, intraprocedural, i.e., every procedure is
analysed as an individual entity with no link to any other procedure. Tomb et al. [39] researched
the notion of interprocedural symbolic execution. According to the findings of Tomb et al. the
level of interprocedural analysis has no noticeable effect on the discovery of errors, but it does
assist in more constrained PC s and, thus, more accurate representations of the constraints on
symbolic values.
Tomb et al. mention that object-oriented programs using accessor methods rarely access
instance fields directly. As a result, any value returned from a procedure call or an instance
field accessed by means of an accessor method, will result in the creation of a new symbolic
value. Tomb et al. hypothesise that setting the interprocedural analysis level to one, would
yield a significant immediate benefit, by making it possible to reason about field values. How-
ever, interprocedural symbolic execution may cause PC s to contain contradictions, thereby
indicating the existence of infeasible execution paths. This gives rise to the need for pruning
such infeasible paths from the SET.
Path Pruning
When a program is compiled, the code is not checked for contradictions in conditional branches.
It is, therefore, possible for infeasible paths to be present in the code. Symbolically executing
these paths would therefore be unnecessary, since they will never be executed during normal
execution of the program. Infeasible paths can therefore be reported, but not explored, which
reduces the resource requirements for analysing the program. During experimentation, Tomb
et al. [39] discovered that pruning infeasible paths pruned less than 10% of paths during in-
traprocedural analysis, while pruning 20% of paths during interprocedural analysis, and up to
50% of paths with larger examples [39]. Path pruning, therefore, becomes indispensable during
interprocedural analysis.
Infeasible path pruning also increases the execution time if a PC has no obvious contra-
dictions. An obvious contradiction is the situation where at least two conditions in a PC are
exact inverts of one another. These can easily be identified without using a decision procedure.
Stellenbosch University http://scholar.sun.ac.za

CHAPTER 2. THEORETICAL BACKGROUND 27
A non-obvious contradiction requires a decision procedure to identify the contradiction, which
is an expensive computation. As an example, consider symbolic integer variable A:
obvious contradiction: PC = A < 2 & A >= 2
non-obvious contradiction: PC = A < 2 & A > 4
2.4.7 Symbolic Execution in Practice
Symbolic execution has various practical uses with respect to the role it plays in analysis and
design tools. Some examples of its application will be discussed in this section.
Tomb et al. [39] use symbolic execution for testing and test case generation. They attempt
to detect unhandled run-time exceptions in Java byte code by deciding the satisfiability of
arbitrary formulae in first order logic. These detected exceptions are then recreated by solving
the PC to reach the state where the exception might occur. The solved values are then used
to generate test cases using the Java Reflection API in an attempt to verify the validity of the
error.
Siegel et al. [37] use symbolic execution to assist in the parallelisation of sequential pro-
grams, focusing, specifically, on parallel numerical programs. According to them, the process
of “parallelising” a sequential program is notoriously difficult and error-prone. In the first
instance, the main issues are that it is infeasible to test more than a tiny fraction of possible
inputs that a numerical program will encounter during execution. Therefore, it is impractical
to attempt to show that a program behaves correctly on all possible inputs. Second, in con-
current programs, unlike in sequential programs, the order in which events occur differs with
every execution, due to a number of factors, such as the load on the processors, and the latency
of the communication network. Symbolic execution is therefore used to represent the outputs
of the program as constraints on the inputs, i.e., the PC s of the outputs. These PC s of the
parallel and sequential versions of the program are then used together with a model checker,
like SPIN, to explore the possible states of the parallel and sequential programs. If the results
produced by the parallel program agree with the results produced by the sequential program,
then the two programs must be equivalent.
Dynamic invariant inference tools like Daikon [16] observe the behaviour of program prop-
erties during the execution of a test suite. These properties are a collection of object state
invariants, method pre-conditions, or method post-conditions, which are collectively known
Stellenbosch University http://scholar.sun.ac.za

CHAPTER 2. THEORETICAL BACKGROUND 28
as invariants. However, according to Csallner et al. [16], these dynamic invariant inference
tools are likely to generate either incorrect, or irrelevant, invariants. Therefore, they combine
symbolic execution with the process of dynamic invariant inference. The invariants are gen-
erated during the execution of a test suite and the source code is symbolically executed, as
well. The PC s generated through symbolic execution are then used, together with the invari-
ants generated through dynamic invariant inference, to determine which of the invariants are
relevant.
According to Coen-Porisini et al. [10], systems such as aircraft avionics systems, nuclear
power plant control systems, and patient monitoring systems, which are all safety-critical sys-
tems, need to be highly reliable, since failures in these systems may have catastrophic con-
sequences. However, while formal methods successfully enhance the quality of software, they
are often neglected in practice. Industrial software project verification usually relies on tech-
niques that perform code inspection or testing to find programming errors, but correctness is
seldom formally verified. Coen-Porisini et al. designed a Path Description Language (PDL)
which is used to express safety properties as predicates of execution paths. Symbolic execution
is used to construct operational models of the software on which the safety properties can be
assessed. Assessing the safety properties on the generated operational models can, therefore,
verify whether or not the specified safety property is retained in the safety-critical system.
2.5 Dynamic Analysis
The program analysis section showed that static analysers were unsound, since all errors that
were found, were reported without any validation on a running instance of a program. Dynamic
analysis follows more naturally on manual testing. Dynamic analysis is built on the concept
of, first, black-box testing, where the tester tests the entire application without any knowledge
of its implementation, and, second, static regression testing, where the developer maintains a
test suite that executes different pieces of overall functionality [13].
Where static analysers test programs through code inspection, dynamic analysers, also
known as run-time analysers, test programs by executing the programs. This is done by running
a series of tests against the program and seeing whether any errors occur during execution. The
problem with this, however, is that the time it takes to create and maintain these test suites
Stellenbosch University http://scholar.sun.ac.za

CHAPTER 2. THEORETICAL BACKGROUND 29
can be substantial, especially for applications near the end of the development cycle.
Csallner et al. created a tool called JCrasher [13] to assist in avoiding the above-mentioned
problem. JCrasher is a random test tool for Java classes. It automatically generates a random
number of tests that are type-correct, but contain random data inputs. These tests are run
against the program and any errors that occur during execution are reported. Random testing,
which is a form of blind testing [13], investigates the capability of a program to handle un-
expected scenarios, i.e., the robustness of the program. It requires minimal user input, easily
covers shallow boundary cases, like incorrect inputs on arithmetic functions, and effectively
checks whether pre-conditions of public methods are enforced. However, since the inputs are
all random, the overall effectiveness of testing is proportional to the number of tests generated
and executed.
It is important to note that when using dynamic analysis, the static state of a program
becomes relevant. Each test that is executed against a program can affect the static state of
the program, which, in turn, could affect the outcome of other tests. Precautions need to be
put in place to preserve the static state which would, in turn, ensure the integrity of each test.
2.5.1 Focused Testing using Program Analysis
Static analysers are effective at finding coding bugs in a program, but as mentioned earlier, they
are prone to producing large amounts of false positives, as well as producing reports that may
be difficult to understand. Dynamic analysers are sound, i.e., they contain no false positives:
a program cannot crash on an error that does not exist. Their reports are also much easier
to understand, typically containing counterexamples expressed as tests that can be run. The
problem is that the tests have to be created, either manually, or by using tools like JCrasher
[13], that generate random inputs. Some tools were, therefore, designed by combining the
concepts of static analysis and dynamic analysis.
Csallner et al. took their JCrasher tool and added a static analysis component to it by
combining it with ESC/Java [19], the annotation-based static analyser discussed earlier, and
called the tool Check ‘n’ Crash [14]. In Check ’n’ Crash, a program is tested by statically
analysing it using ESC/Java. This results in a list of counterexamples, detailing all code
fragments it considers to be possible errors. These counterexamples are then used by JCrasher
to generate tests that will cause the expected error to occur. These tests are run against the
Stellenbosch University http://scholar.sun.ac.za

CHAPTER 2. THEORETICAL BACKGROUND 30
program and all tests that have caused an error are, subsequently, reported, while all tests that
ran without causing an error, are discarded. This approach improves on JCrasher, by focusing
its test generation through counterexamples, while improving the soundness of ESC/Java by
confirming whether a counterexample is an error, before reporting it.
The problem with using ESC/Java, is that, in order to use it to its full potential, it still
requires annotations to be added to the code. To solve this problem, Csallner et al. added
another tool to Check ‘n’ Crash, called Daikon [18], and called the resulting tool DSD-Crasher
[15]. DSD-Crasher uses Daikon to monitor a program during execution and generalise the
observed behaviour of the variables to invariants. These invariants are then used to annotate
the code, where Check ‘n’ Crash can begin its testing. However, to monitor the program and
derive the invariants, Daikon needs tests to run through the entire functional domain of the
program.
Here, it becomes evident that by combining dynamic analysis with static analysis, one could
benefit from the automated nature of static analysers, while benefiting from the soundness of
dynamic analysers. However, an important question to be asked is: At which point is it safe to
say that a program has been sufficiently tested? In the following sections, the concept of test
adequacy will be explored.
2.6 Introduction to Test Adequacy and Coverage
In the previous section, various testing techniques were discussed that covered testing for the
purposes of error detection, as well as, proving the absence of possible errors. These testing
techniques do not consider the history of the program. Every testing cycle is regarded as a
separate entity. However, testers are often required to run regression tests. Regression testing
is a form of testing where the program under development is tested, during development, to
ensure that all areas that operate correctly, continue to do so, as new features are added. Testers
are assisted by regression testing in detecting the presence of bugs sooner and locating the bug
faster, since they know what has changed during the period between the previous regression
cycle and the current one. Testers, generally, create test cases to automate regression testing.
A test case is defined as an input with which the program being tested is executed during
testing. These test cases can be grouped together to form a test suite, or test set [47]. Test sets
Stellenbosch University http://scholar.sun.ac.za

CHAPTER 2. THEORETICAL BACKGROUND 31
are created to satisfy a test adequacy criterion, often also called a test data adequacy criterion.
A test adequacy criterion specifies a testing requirement that, when satisfied, implies that the
tested program is without errors.
Zhu et al. present a formal definition of test adequacy criteria and classify them [47]. An
explanation of these definitions and classifications is given in the next section, followed by a
section on code coverage.
2.7 Test Adequacy Criteria
2.7.1 Introduction
Test adequacy criteria have two notions associated with them. First, an adequacy criterion is
considered to be a stopping rule for itself, determining when the program has been sufficiently
tested so that the checking of the criterion may be halted. An adequacy criterion can be
formalised as a function C that takes a program p, a specification s, and a test set t and gives
a truth value true or false. Formally, let P be a set of programs, S be a set of specifications,
D be a set of inputs of the programs in P , T be a set of test sets, such that T = 2D, where 2X
denotes the set of subsets of X [47].
Definition 2.7.1.1 (Test Data Adequacy Criteria as Stopping Rules: [47]) A test data
adequacy criterion C is a function
C : P × S × T → {true, false}.
C(p, s, t) = true means that t is adequate for testing program p against specification s according
to the criterion C, otherwise t is inadequate.
Second, test data adequacy criteria provide measurements of test quality when a degree of
adequacy is associated with each test set, so that it is not simply classified as either sufficient
or insufficient. For example, the percentage of code coverage is often used as an adequacy
measurement. Thus, with an adequacy criterion C, formally defined as a function C from a
program p with a specification s and a test set t, the degree of adequacy r can be defined as
r = C(p, s, t) [47].
Stellenbosch University http://scholar.sun.ac.za
CHAPTER 2. THEORETICAL BACKGROUND 32
Definition 2.7.1.2 (Test Data Adequacy Criteria as Measurements: [47]) A test data
adequacy criterion is a function C,
C : P × S × T → [0, 1].
C(p, s, t) = 1 means that the adequacy of testing the program p with the test set t with respect
to the specification s is of degree r according to the criterion C. The greater the real number
r, the more adequate the testing.
These two notions of test data adequacy criteria are closely related to one another. If an
adequacy criterion states that every statement in a program must be executed at least once,
then the criterion C(p, s, t) will only be true if every statement is executed. However, if a test
set is considered adequate if only 80% of the statements are executed, then, with adequacy
measurement M , and degree of adequacy r, the stopping rule Mr would be so that a test set
is adequate if, and only if, the adequacy degree is greater than, or equal to, r, with r at 80%.
Mr(p, s, t) = true⇔M(p, s, t) ≥ r
An adequacy criterion is an essential part of any testing method. It plays two fundamental
roles. In the first instance, it specifies a particular software testing requirement, and, hence,
determines test cases to satisfy the requirement. Second, it determines the observations that
should be made during testing. For example, a criterion which specifies that each statement
should be executed, will require that each statement executed be observed, while a criterion in
which each execution path should be followed, will have no use for the observation of statements
executed, but will require that all executed paths be observed and recorded.
2.7.2 Categories of Test Data Adequacy Criteria
Zhu et al. [47], identified three categories for the classification of adequacy criteria: Clas-
sification by source of information, classification by prospective usage of the software, and
classification by the underlying testing approach.
Classification by source of information
The most common classification is by the source of the information used to specify testing
requirements. The adequacy criterion is, therefore,
Stellenbosch University http://scholar.sun.ac.za

CHAPTER 2. THEORETICAL BACKGROUND 33
• specification-based, which specifies the required testing in terms of the features defined
in the functional specifications or requirements of the program, e.g., the spellchecking
feature of a word processor. A test set is adequate if all the defined features have been
thoroughly tested;
• program-based, which specifies testing requirements in terms of the function of the pro-
gram under test, e.g., a source code compiler that needs to interpret all allowable syntax of
the programming language and convert it to an executable format. A test set is adequate
if the function of the program has been thoroughly tested; and
• combined specification-based and program-based criteria, which use the ideas of both
specification-based and program-based criteria.
It is important to remember that with specification-based, program-based, and the combined
criteria, the correctness of program outputs must be checked against the specification or re-
quirement.
Classification by prospective usage of the software
Some adequacy criteria may be more concerned with whether the test cases cover the data
that are most likely to be frequently used as input during the operation of the software. These
criteria are called
• interface-based criteria, which specify testing requirements only in terms of the type and
range of software input, without reference to any internal features of the specification or
the program.
Classification by the underlying testing approach
There are three basic approaches to software testing:
• structural testing, which specifies testing requirements in terms of the coverage of a par-
ticular set of elements in the structure of the program or specification;
• fault-based testing, which focuses on finding bugs in the software. An adequacy criterion
of this approach is some measurement of the fault detecting ability of the test set;
Stellenbosch University http://scholar.sun.ac.za

CHAPTER 2. THEORETICAL BACKGROUND 34
• error-based testing, which requires test cases to check the program for certain error-
prone points, according to our knowledge about how programs typically depart from
their specification.
2.7.3 Focus of this Thesis
As the title of this thesis suggests, the focus of this study lies in the calculation of code
coverage, which, according to the above-listed classifications of test adequacy criteria, falls
under structural testing.
2.8 Code Coverage
Code coverage consists of adequacy criteria specifying that certain elements of a program be
covered. To cover an element of a program means to execute or analyse that element during
testing.
Our discussion of coverage is divided into two subsections: specification-based and program-
based coverage [47].
2.8.1 Specification-based Coverage
Specification-based coverage, often referred to as functional coverage [36, 21, 40], has two
possible roles in testing. The first role is to provide information for test case selection when
building test sets, to maximise the test adequacy of the set [47]. Its second function is to
analyse the adequacy of the test suite when testing the functionality of the program against its
specification, similar to black-box testing. This is useful when the program has to conform to
some universal specification standard [36] like network protocols, or when verifying a hardware
design [20, 2]. However, because specification-based coverage is specification dependent, finding
an existing coverage tool to measure specification-based coverage of a program is difficult, since
most tools have the coverage models hard-coded into them [21]. To analyse specification-based
coverage, developers have to either try and modify existing tools to support their specification,
or create a new coverage tool to test their program specification. To improve on this, tools
such as Comet [21] were developed to separate the coverage model definitions from the tool.
This allows developers to define their own coverage models [20], without having to build an
Stellenbosch University http://scholar.sun.ac.za

CHAPTER 2. THEORETICAL BACKGROUND 35
entire new tool from scratch.
Since the formal method used in this thesis is symbolic execution, which is specification
independent, specification-based coverage is not used for the purposes of this thesis. The focus
of this study is, therefore, program-based coverage.
2.8.2 Program-based Coverage
Program-based coverage is split into two groups of criteria: data-flow criteria and control-flow
criteria [47].
Data-flow criteria
Data-flow criteria, as the name suggests, focus on the coverage of data-flow testing in a program.
Data-flow testing investigates the usage of data values in a program and how these values affect
the execution of the program. The checking of this criteria is similar to model checkers, where
model checking analyses program states that represent data values at specific points during
program execution. However, data-flow criteria falls outside the scope of this thesis, and
interested readers are referred to [47].
Control-flow criteria
Control-flow criteria focus on the coverage of the control-flow graph of a program. The control-
flow graph is a graphic interpretation of the execution of a program, where the nodes represent
code blocks, branches occur at conditional statements, and the edges represent the conditions
required to hold for that path to be followed.
Every execution of a program corresponds to a path in the control-flow graph, known as
the execution path, from the begin node to the end node. The begin node represents the entry
point of the program, and the end node represents the point of program termination.
The most common control-flow coverage criteria will be discussed in the following para-
graphs.
Statement Coverage Criterion A very basic testing requirement is that every statement
in the code has to be executed at least once. This testing requirement is known as the statement
coverage criterion.
Stellenbosch University http://scholar.sun.ac.za

CHAPTER 2. THEORETICAL BACKGROUND 36
Definition 2.8.2.1 (Statement Coverage Criterion: [47]) A set P of execution paths sat-
isfies the statement coverage criterion if and only if for all nodes n in the flow graph, there is
at least one path p in P such that node n is on the path p.
Even with adequate tests, it is possible to not achieve full statement coverage. This is due
to the possibility of infeasible statements, also referred to as dead code. Dead code is code
that cannot be executed during program execution, because conditions required for the code
to execute containing contradictions, e.g., as in the code snippet displayed in Figure 2.7, p. 36.
1: int conditionalIncrement( int x ) {
2: if( x < 2 && x > 3 ) {
3: x++;
4: }
5: return x;
6: }
Figure 2.7: This method is a simple example to illustrate infeasible statements. The parameterreceived is incremented only when the value is less than 2 and more than 3. These conditionsare contradicting, and, therefore, line 3 will never be executed. Line 3 is, therefore, dead code.
It is also important to note that there is a difference between statement coverage and
line coverage. A single source code line can contain more than one statement, e.g., a multi-
conditional if statement, or more complex Java statements. See Figure 2.8, p. 36 for an
example the difference between line coverage, and statement coverage [17].
1: int x; 1: int x = var > 0 ? -1 : 1;
2: if( var > 0 ) {
3: x = -1;
4: } else {
5: x = 1;
6: }
Figure 2.8: This shows the difference between statement coverage and line coverage. The leftside contains an example of a simple conditional assignment. The right side contains the sameconditional assignment compressed into a single line of code. Full line coverage on the rightdoes not imply full line coverage on the left, while full statement coverage on either side impliesfull statement coverage on both sides.
Statement coverage is a weak coverage criterion since some control-flow transfers may be
missed. This becomes apparent with control statements such as for loops, while loops, goto
Stellenbosch University http://scholar.sun.ac.za

CHAPTER 2. THEORETICAL BACKGROUND 37
statements, and similar examples, since any jump back to previously executed statements is
irrelevant in statement coverage.
Branch Coverage Criterion Where statement coverage requires statements to be checked,
branch coverage requires the checking of control transfers.
Definition 2.8.2.2 (Branch Coverage Criterion: [47]) A set P of execution paths satis-
fies the branch coverage criterion if, and only if, for all edges e in the flow graph, there is at
least one path p in P such that p contains the edge e.
Branch coverage is stronger than statement coverage, since full branch coverage also implies
full statement coverage. Therefore, a test set that satisfies the branch coverage criterion also
satisfies the statement coverage criterion. This relationship between adequacy criteria is called
the subsumes relation [47].
Having full branch coverage, however, does not necessarily mean that all possible execution
paths have been explored.
Path Coverage Criterion The path coverage criterion is the testing requirement that all
combinations of control transfers are checked.
Definition 2.8.2.3 (Path Coverage Criterion: [47]) A set P of execution paths satisfies
the path coverage criterion if, and only if, P contains all execution paths from the begin node
to the end node in the flow graph.
Path coverage is stronger than branch coverage, because the requirement is that all pos-
sible execution paths be explored. Path coverage subsumes branch coverage, and, therefore,
statement coverage as well. However, this criterion is too strong to be practically useful for
most programs, due to the possibility of an infinite number of different paths in a program
with loops [47]. This is the same issue encountered when using symbolic execution to analyse
a program with symbolic loops, as discussed under symbolic execution.
Multiple Condition Coverage The previously discussed coverage criteria are all based
on the control-flow graph, and do not take the actual program text into account. Condition
coverage, on the other hand, focuses on the conditions of control transfers in the program.
Stellenbosch University http://scholar.sun.ac.za

CHAPTER 2. THEORETICAL BACKGROUND 38
A test set that satisfies the condition coverage criterion contains test cases such that every
condition in the program is evaluated to true, and evaluated to false at least once. This
criterion is then extended to the multiple condition coverage criterion to allow for multiple
conditions available in most high-level programming languages.
Definition 2.8.2.4 (Multiple Condition Coverage Criterion: [47]) A test set T is said
to be adequate according to the multiple-condition-coverage criterion if, for every condition C,
which consists of atomic predicates (p1, p2, ..., pn), and all possible combinations (b1, b2, ..., bn)
of their truth values, there is at least one test case in T such that the value of pi equals bi,
i = 1, 2, ..., n.
Issues with Control-flow adequacy criteria
The issue of unreachable statements, or dead code, was mentioned on the previous page. This
issue occurs in all the discussed coverage criteria that measure adequacy from the control-flow
graph, i.e., statement coverage, branch coverage, and path coverage. This is because it is
impossible to recognise the existence of dead code from the graph, since it models execution
behaviour, not program text. Unreachable statements will not be modelled in the control-flow
graph, because they are not part of the execution behaviour of the program. Since condition
coverage is measured from the program text, it is possible to identify dead code. Later in
this study it will become evident how symbolic execution is used to improve on this issue by
assisting in the identification of dead code.
Another issue mentioned was that of loops, where, potentially, an infinite number of possible
paths may exist in a program with loops. Similar to the issue with symbolic loops in symbolic
execution, it is potentially impossible to obtain full path coverage due to the infinite number
of test cases that will be required to evaluate the infinite paths. Much research has gone into
finding ways to find suitable subsets of execution paths. Some of the examples include: selecting
paths that contain no redundant information, selecting paths of length less than or equal to
n (called the length-n path coverage criterion), and using loop counting (known as the loop
count-K criterion. Loop counting involves limiting the number of iterations a loop can follow
to a natural number K. The solution for handling symbolic loops during symbolic execution is
also a form of the loop count-K criterion.
Stellenbosch University http://scholar.sun.ac.za

CHAPTER 2. THEORETICAL BACKGROUND 39
Further Reading
The above discussions on test adequacy and coverage is limited to the scope of this thesis.
Interested readers are referred to Zhu et al. [47], as well as Kaner [30], who compiled a list of
as many as 110 different types of coverage criteria.
2.8.3 Measuring Coverage
There are various approaches to measure the criteria. Atlassian, the creators of Clover [9, 46],
identified three approaches to measure code coverage of Java programs:
1. Source code instrumentation is an approach where instrumentation statements, such as
annotations or method calls to the coverage calculation tool, are added to the source
code. The code is then compiled to produce an instrumented assembly.
2. Intermediate code instrumentation is an approach where the compiled class files are in-
strumented by adding new byte code, and a new instrumented class is generated.
3. Run-time information collection is an approach that collects information from the run-
time environment, as the code executes, to determine coverage information.
As the program under test is executed, coverage is measured according to one, or a combination,
of these measuring approaches.
2.8.4 Coverage Tools
There are a number of coverage tools available that are designed to measure one or more of the
coverage criteria. Among these tools are Clover [9, 46], JCover [26, 46], and EMMA [17, 46].
Clover uses source code instrumentation to instrument Java source code. This is done by
integrating Clover into the compilation process to add the instrumentation data to the code
before it is compiled. After compilation, the user needs to run the test suite manually to allow
for coverage to be measured. Clover measures the coverage by using the statement coverage
criterion (Definition 2.8.2.1, p. 36), and the branch coverage criterion (Definition 2.8.2.2, p. 37).
It also measures method coverage, which involves checking whether all methods in the source
code are executed during testing.
Stellenbosch University http://scholar.sun.ac.za

CHAPTER 2. THEORETICAL BACKGROUND 40
JCover can use either source code instrumentation, or intermediate code instrumentation,
depending on whether it is using source code, or compiled class files. Coverage is then measured
similarly to Clover, requiring a build and execution of the test suite. JCover also has a coverage
API which allows developers to control JCover, during run-time, through annotations in the
code. It focuses mainly on statement coverage, and branch coverage, while also supporting
method coverage, class coverage, file coverage, and package coverage. Class coverage involves
checking whether every class in the program has been executed, while file coverage checks all
non-Java resources such as properties files, XML, and others. Package coverage checks whether
all defined packages, i.e., all namespaces within a Java project, are executed during testing.
EMMA uses intermediate code instrumentation, instrumenting the byte code by either com-
piling the class files with EMMA, or by using the custom class loader of EMMA to instrument
the class files on-the-fly. Its main focus is basic block coverage, extending it to line coverage,
method coverage, and class coverage. Basic block coverage is the coverage measurement of
basic code blocks, these being blocks of code without any control statements. Thus, if the
first statement in a code block is executed, the last statement in the block will be executed,
regardless of variable values, conditional statements, and other elements in the program.
2.9 Conclusion
This chapter covered some of the theory and concepts behind testing and test adequacy. Some
of the focus points of this thesis were also identified. At this point, the reader should have
a basic understanding of the theory behind program analysis and testing, the formal method
known as symbolic execution, and the concept of test adequacy and some of the coverage
criteria that are available.
In the next chapter, the way in which symbolic execution is used to assist in testing and
coverage calculation, as well as how this implementation was integrated into an Eclipse plug-in,
will be discussed.
Stellenbosch University http://scholar.sun.ac.za

Chapter 3
Design and Implementation
3.1 Overview
The previous chapter discussed the theory behind the concepts and techniques that are used
in this thesis. This chapter will now discuss how these techniques were applied and combined
into an Eclipse plug-in named ATCO.
ATCO
ATCO is an acronym compiled from Automated Test Coverage Calculation and GeneratiOn.
The purpose of ATCO is to study the practical applicability of using symbolic execution to
calculate test case coverage, and then use the results from the coverage analysis to automatically
generate tests for areas that are not covered. The tool executes in three separate phases, where
each phase uses the results from the previous phase. The first phase is the information gathering
phase, which runs symbolic execution on the classes under test, and builds the data structures
needed in later phases. The second phase is the information analysis phase, where the data
structures are analysed while existing JUnit test cases are executed to calculate test coverage.
The coverage statistics are then added to the data structures in preparation for the last phase.
The last phase, the result analysis phase, analyses the coverage statistics and then automatically
generates test cases to cover the areas that are not yet covered by the existing test suite.
Some of the phases contain expensive computations, which will increase execution time as
the complexity and scale of the program under analysis grows. Therefore, Java’s Concurrency
Utilities [41] are utilised to allow these expensive computations to be executed concurrently.
41
Stellenbosch University http://scholar.sun.ac.za

CHAPTER 3. DESIGN AND IMPLEMENTATION 42
Later sections will discuss how this is achieved.
ATCO is built on top of another analysis tool, called Artemis.
Artemis
Artemis, currently being implemented for academic purposes at Stellenbosch University, is an
analysis tool that is designed to detect unhandled run-time exceptions from Java byte code.
It operates by symbolically executing a program, trying to detect possible unhandled run-
time exceptions. When a possible error is located, it runs constraint solving on the symbolic
state’s path condition to generate method inputs to reach the potentially erroneous state, and
generates a JUnit test with these inputs. The test is executed to determine whether it is a
real error or a spurious warning. All real errors are reported, while all spurious warnings are
ignored. After a possible error is handled by Artemis, analysis continues.
Artemis contains two components of interest for this thesis:
• Its symbolic execution engine, used in ATCO ’s information gathering phase. The engine
is slightly modified, as will be discussed later.
• Its test case generation engine, used in ATCO ’s result analysis phase.
Outline
This chapter discusses the three phases of ATCO ’s execution, as well as an overview of how it
was integrated into the Eclipse workspace as a plug-in.
3.2 Information Gathering Phase
The first phase in ATCO ’s execution involves analysing all the classes under analysis and
constructing the data structure that will be used in subsequent phases. The analysis of the
classes is achieved by using Artemis’ symbolic execution engine to symbolically execute each
class and then storing the symbolic states in a data structure.
3.2.1 Artemis’ Symbolic Execution Engine
The symbolic execution engine is built on top of Soot, a Java byte code optimisation framework
[42].
Stellenbosch University http://scholar.sun.ac.za

CHAPTER 3. DESIGN AND IMPLEMENTATION 43
Soot is used to convert the Java byte code to Jimple, a typed 3-address intermediate
representation, that is suitable for optimisation [42]. Soot converts classes, one method at
a time, using transforms. Each method is parsed and a SootMethod class of the method is
generated. This class is then passed to the applicable transform to convert the given method
into the required representation.
Soot allows for custom transforms to be added to its conversion process. This allows users
to either extend the Soot analysis process, or build new analyses on top of Soot. Artemis
builds a new analysis process on top of Soot by creating a SymbolicTransformer class, which
is plugged into Soot during its initialisation, and used during its execution.
When Soot calls the SymbolicTransformer class, the SootMethod received from Soot is al-
ready in Jimple form. This transformed method is then sent to Artemis for symbolic execution.
Artemis initialises a single symbolic state and sets up the symbolic execution environment. It
then sequentially runs through the method, one instruction at a time, and applies the action
of the instruction to the symbolic state. The symbolic state, therefore, maintains an accurate
symbolic representation of the program state after each instruction’s execution.
When a symbolic branch is reached, the symbolic state at that point is cloned and pushed
onto a stack, thereby preserving the state at that branch. This symbolic state, stored on the
stack, represents the symbolic branch before any of its paths are executed. The true path of
the branch is executed until its last statement. Thereafter, the symbolic state at the top of
the stack is removed. The false path of that symbolic branch is then executed until its last
statement. The symbolic state at the top of the stack is again removed, and its false path
is executed, and so on. It can be seen that symbolic branches are handled as a depth-first
traversal through a Binary Tree.
Since symbolic execution creates execution paths for both the true path and false path of
a branch, it is possible for the path conditions of some of these paths to contain contradictions.
Contradictions in the path conditions of symbolic states mean that those symbolic states are
unreachable. To prevent symbolic execution to be performed on these paths that contain
contradictions, Artemis performs path pruning whenever it reaches a branching statement. If
a path contains contradicting path conditions, that path is stopped, i.e. no longer symbolically
executed.
As discussed in Section 2.4.4, p. 22, a symbolic loop is a special case in symbolic execution.
Stellenbosch University http://scholar.sun.ac.za

CHAPTER 3. DESIGN AND IMPLEMENTATION 44
During symbolic execution, both the true and false paths of all if statements need to be
followed. This will result in an infinite loop when a loop has symbolic constraints. Artemis
handles this issue by maintaining a loop counter to limit the number of times a symbolic loop
may be executed. Therefore, the branching statement representing the loop will have its true
and false paths followed N times, with N being the value of the loop counter.
Interprocedural analysis
Artemis analyses each method interprocedurally, confined to a maximum call depth (CDM ).
Whenever a method call is encountered in a method, the current call depth (CDC) is examined.
If
CDC < CDM , invoke method, CDC = CDC + 1
CDC >= CDM , ignore method
Whenever a symbolic value of the current method is sent to, and modified in, an invoked
method, or is assigned a value returned from the invoked method, these changes would not be
reflected on that symbolic value during intraprocedural analysis. By taking into account the
effect invoked methods have on symbolic values, additional constraints might be added on these
symbolic values. The more constraints added on a symbolic value, the narrower the domain of
possible values it may have, becomes. The narrower the domain of a symbolic value, the easier
it becomes to identify infeasible paths. Figure 3.1, p. 45 illustrates this.
Modification
To use the symbolic states for coverage analysis, it is required to be aware of the symbolic
states at symbolic branches. When a symbolic branch is encountered, two options are available;
either run the relevant test cases testing that method, or build a data structure of all symbolic
branches, and then run the test cases. If the tests are run whenever a branch is encountered,
each test will have to be executed exponentially many times, as a method may have multiple
paths, and each path may have multiple branches. Storing the symbolic states in a data
structure will require that each test case is only executed once.
It was mentioned earlier that Artemis maintains a single symbolic state throughout the
symbolic execution of the method. When a symbolic branch is reached, the symbolic state is
cloned. However, the cloned copy of the symbolic state made at a branch is only used as a
Stellenbosch University http://scholar.sun.ac.za

CHAPTER 3. DESIGN AND IMPLEMENTATION 45
1: public void method1( int x ) {
2: x = method2();
3: if( x > 1 ) {
4: x = 5;
5: } else if( x < 0 ) {
6: x = 6;
7: } else {
8: x = 7;
9: }
10: }
11:
12: public int method2() {
13: return 1;
14: }
Figure 3.1: Interprocedural infeasible path identification is illustrated in the above codesnippet. If method 1 were to be symbolically executed intraprocedurally, the invocation ofmethod 2 would be ignored, and all three paths through method 1 would be considered possible.With interprocedural analysis, method 2 would be invoked, and it would be discovered thatonly the path at line 8 would be executable. The other two paths (line 4 and line 6) would beidentified as unreachable. Line 4 and line 6 are, therefore, both infeasible paths.
snapshot of the symbolic state at that point. To use symbolic states in ATCO, the symbolic
state for each statement in the program needs to be stored separately. Knowing the relationship
between the different symbolic states is also important, i.e., knowing which symbolic states form
which execution paths.
A symbolic execution tree (SET ), as discussed in Section 2.4.3, p. 21, is used to store the
symbolic states of a method. All SET s constructed during symbolic execution is grouped by
class, allowing ATCO to access each SET of each class during coverage calculation.
3.2.2 Symbolic Execution Tree
Structure
The SET is a Binary Tree, as each branching node may have, at most, two children, i.e.,
a true path and a false path leading from it. Each node in the SET contains the entire
symbolic state at that point in the method. The structure of the SET represents the flow of
execution through the method, a root node for the first statement of the method, a branch in
the tree for every corresponding branching statement in the method, and a leaf node for the
Stellenbosch University http://scholar.sun.ac.za

CHAPTER 3. DESIGN AND IMPLEMENTATION 46
last statement of every possible path in the method. The unique paths between the root and
leaf nodes indicate all the possible execution paths through the method, except when symbolic
loops are present.
When a method contains a symbolic loop, the unique paths between the root and leaf nodes
do not necessarily represent all possible execution paths through the method. This is because
loop iterations are limited during symbolic execution. In such a situation, the SET would only
contain a subset of the execution paths. The size of the subset depends on the limit set on loop
iterations.
Special constructs
Most of the control-flow statements in Java are represented as if statements in byte code, after
compilation. So a SET representation of a method may easily be derived. However, the switch
statement in Java is handled differently. The switch is represented as a special tableswitch
or lookupswitch construct, to allow the JVM to handle the switch statement more efficiently.
This results in a single statement that may now have more than two paths extending from it.
To enable ATCO to handle this special construct, an additional transformation is required to
represent this construct in the SET, as each node in the SET may have, at most, two children.
This additional transformation involves inserting blank nodes into the SET, which may serve
as branching points for the different branching cases of the switch statement. Figure 3.2, p. 46,
illustrates this solution with an example.
1: int checkValue(int x) {
2: int a = 0;
3: switch(x) {
4: case 1: a++; break;
5: case 2: a--; break;
6: case 3: a = x; break;
7: default: a = 0; break;
8: }
9: return a;
10: }
Figure 3.2: This figure displays a simple code example of a Java switch statement. Thevariable a is modified in a certain manner, depending on the value of x received as input pa-rameter. Figure 3.3, p. 47 displays the resulting SET, constructed from symbolically executingthis method.
Stellenbosch University http://scholar.sun.ac.za

CHAPTER 3. DESIGN AND IMPLEMENTATION 47
Figure 3.3: This is a SET of the switch statement in the code example, displayed in Fig-ure 3.2, p. 46. The nodes contain the line number to be executed, and the edges contain thestatement that was executed. The dotted nodes indicate the blank symbolic states, insertedinto the SET, which serve as the branching points for the different cases.
Stellenbosch University http://scholar.sun.ac.za

CHAPTER 3. DESIGN AND IMPLEMENTATION 48
Interprocedural analysis introduces a similar scenario to that of the switch statement. If
a method, invoked during interprocedural analysis, contains symbolic branches, and returns
a value to the method from which it was invoked, that invocation statement may have two,
or more, paths extending from it. To maintain an accurate representation of the method
under analysis, the SET needs to reflect these paths. This scenario is handled similarly to the
solution for handling the switch statement. Blank nodes are inserted into the SET to serve
as the branching points for the various paths that may be followed in the method that was
invoked. Figure 3.4, p. 48, illustrates this solution, with regards to interprocedural analysis,
with an example.
1: void printValue(int x) {
2: int y = checkValue(x);
3: System.out.println(y);
4: }
Figure 3.4: This figure displays a simple code example, used to illustrate the branching thatmay occur during interprocedural analysis. With the checkValue method example, displayedin Figure 3.2, p. 46, this example contains a method that invokes checkValue and prints theresulting value. The resulting SET is displayed in Figure 3.5, p. 49.
Why use a SET?
Because of the nature of symbolic execution, it becomes difficult to effectively and accurately
group statements into repeating code blocks. The best example for illustration is symbolic
loops. The same code block gets executed with each iteration of the loop. However, with sym-
bolic execution, the path condition, and, in fact, the symbolic state of the program, is different
for each iteration. Simply grouping statements into code blocks would therefore not yield an
accurate representation of the symbolic states achievable by that block. By storing these sym-
bolic states separately, the SET structure simplifies the process of storing and differentiating
between these types of code blocks. To indicate this, recall the symbolic loop example displayed
in Figure 2.6, p. 25. With a loop counter of three, i.e., the loop will be iterated three times,
Figure 3.6, p. 50, displays the resulting SET if the statements were grouped into repeating code
blocks. The size of the SET is smaller than before, but all the data regarding every iteration
of the loop is lost, apart from the last iteration.
During symbolic execution, constraint solving may be used to prune infeasible paths, also
Stellenbosch University http://scholar.sun.ac.za

CHAPTER 3. DESIGN AND IMPLEMENTATION 49
Figure 3.5: An example SET to illustrate the branching that may occur during interproce-dural analysis, with the code example displayed in Figure 3.4, p. 48. The checkValue methodreturns one of four values, namely 1, −1, 3, or 0, depending on the value of x received. Thenodes contain the line number to be executed, and the edges contain the statement that wasexecuted. The dotted nodes indicate the blank symbolic states, inserted into the SET, whichserve as the branching points for the different values that are returned by checkValue.
Stellenbosch University http://scholar.sun.ac.za

CHAPTER 3. DESIGN AND IMPLEMENTATION 50
Figure 3.6: This SET is the result of the code in Figure 2.5, p. 24, being symbolically executed,and stored in a SET when statements are grouped into repeating code blocks. All the dataregarding every iteration of the loop is lost, apart from the last iteration. The edges containthe statement that was executed.
called dead code or unreachable statements, from the analysis. Artemis uses a constraint solver,
called Choco [38], to solve path conditions for testing and path pruning. Constraint solving
involves determining whether there is a solution to a given set of constraints on variables,
as represented in a constraint model. Thus, infeasible paths may be identified by creating
a constraint model from the path condition of the symbolic state and attempting to solve
the model with Choco. When a path condition contains a contradiction on the constraints of
a symbolic value, that set of constraints, or rather the path condition, is unsatisfiable. An
unsatisfiable path condition indicates that its symbolic state cannot be reached, i.e., it is a
dead state. Therefore, the code represented by that symbolic state is dead code. Constraint
solving is used similarly during coverage analysis in ATCO. Constraint solving is an expensive
Stellenbosch University http://scholar.sun.ac.za

CHAPTER 3. DESIGN AND IMPLEMENTATION 51
computation, so minimising the number of times constraint solving is run may greatly reduce
the time required to perform coverage analysis. Storing the states in a SET minimises the
amount of constraint solving required to calculate coverage by limiting the computation to
only the first non-branching nodes after a branching node, as will be discussed in Section 3.3.
Types of coverage derivable from the SET
Section 3.3.3, p. 55, will discuss how ATCO measures branch coverage (as defined in Definition
2.8.2.2, p. 37), multi-conditional coverage (as defined in Definition 2.8.2.4, p. 38), and statement
coverage (as defined in Definition 2.8.2.1, p. 36). However, there are a multitude of other
coverage criteria that may be derived using the SET after branch coverage, multi-conditional
coverage, and statement coverage have been calculated, and indicated, on the SET. A list, taken
from [30], is displayed below. This list contains, but is not limited to, a number of coverage
criteria that are not directly implemented within ATCO, but are inadvertently measured in,
or can be derived from, the SET, together with the symbolic states within.
Line coverage: ATCO already uses line numbers in the statement coverage calculation pro-
cess. Line coverage can, therefore, easily be derived from statement coverage.
Path coverage: Each SET represents the execution paths that may be followed within the
method it represents. When no symbolic loops exist, the SET contains all execution
paths in the method. Therefore, with full branch coverage in a method, path coverage
for that method is subsumed by the branch coverage. However, when symbolic loops are
present, a loop counter is used. This limits the execution paths to the subset of paths
that have been symbolically executed before the counter limit was reached. Path coverage
on the method containing symbolic loops may, therefore, only be derived to the subset
of paths symbolically executed. Full path coverage, i.e., path coverage over the entire
program’s execution, however, cannot be derived with ATCO ’s current implementation
of the SET. Containing all execution paths in each method is not sufficient to derive full
path coverage. Every sequence in which each execution path in each method is executed
needs to be considered to measure full path coverage. Although it should, theoretically,
be possible to collect sufficient data to measure full path coverage, the number of possible
paths is still too large to make this criterion practical.
Stellenbosch University http://scholar.sun.ac.za

CHAPTER 3. DESIGN AND IMPLEMENTATION 52
Loop coverage: With the use of loop counting, set to n, each symbolic loop will be symboli-
cally executed n times. Loop coverage can therefore be measured by setting n > 1. ATCO
is able to measure loop coverage by counting the iterations of a loop during test execution.
Due to the design of ATCO, measuring loop coverage is not performed when redundancy
detection is disabled. This is because no further attempts are made to determine whether
a loop is hit, if it has already been hit at least once.
Assertion coverage: In the byte code, an assert statement is compiled to a branching state-
ment. To calculate assertion coverage, all assert branches need to be identified. Knowing
this, it is possible to calculate the number of assert branches that are covered. How-
ever, to identify whether a branch is an assert branch, the original Java source code
statements are required. ATCO contains sufficient data in the SET to calculate this cov-
erage criterion, however, due to third-party library constraints, the actual Java source
code statements are unavailable. Thus, measuring this coverage criterion is currently not
possible.
Method and Class coverage: The SET s represent methods which are grouped together and
categorised according to class. Method coverage can, therefore, easily be determined by
examining the coverage statistics of that method’s SET. If any node in the SET was hit
during testing, the method has been hit at least once. Class coverage requires that at
least one SET for that class was hit during testing.
Component, tool, subsystem, and other Kaner [30] mentions that measuring this cover-
age criterion is difficult, because programs often rely on off-the-shelf components to which
the source code is not always available. However, because coverage is measured from byte
code and not source code, it is possible to extend ATCO to measure coverage over all
components, open source or closed source. This is because all libraries are, at least, in
byte code format to allow them to be used.
Because of the structure and information stored within the SET, it is possible to extend
the coverage calculation within ATCO to measure most control-flow coverage criteria. The
symbolic states within the SET contain all the information required to measure many data-
flow coverage criteria as well, such as the variable definition-and-use criteria discussed in [47].
However, this does not fall within the scope of this thesis, and was, therefore, not investigated.
Stellenbosch University http://scholar.sun.ac.za

CHAPTER 3. DESIGN AND IMPLEMENTATION 53
3.3 Information Analysis Phase
After the information gathering phase, ATCO has access to the SET s of each method in each
class being analysed. This information may be used to calculate the coverage of the existing
JUnit test suite over these classes.
Section 2.8.3, p. 39, mentioned three approaches to measuring coverage. The chosen ap-
proach for this thesis is the run-time information collection approach. This is done with the
use of execution tracing. An execution tracer is attached to the test environment wherein a
JUnit test will be run. As mentioned earlier, this phase is executed concurrently, which requires
special consideration to be taken during the calculation process.
3.3.1 Execution Tracing
Execution tracing is achieved by utilising the Java Platform Debugger Architecture (JPDA)
[4]. The JPDA is a debugging architecture used for debugger development, providing the ser-
vices the Java Virtual Machine (JVM ) must provide for tools attempting to perform profiling,
debugging, monitoring, thread analysis, coverage analysis, and so on. The highest level layer
of JPDA is the Java Debug Interface (JDI ). The JDI provides explicit control over the JVM,
allows for inspection of the JVM ’s state at any point, event notification such as exceptions
being thrown, class loading, method calling, and more, as well as providing the use of break-
points, watchpoints, and so on. The events are among the services provided by the JDI that
was used to perform execution tracing.
Events are triggered at the occurrence of specific operations in the attached JVM. Three
events of particular interest for this coverage implementation are: the ClassPrepareEvent, the
MethodEntryEvent, and the BreakpointEvent.
Whenever a class is loaded in the JVM, the ClassPrepareEvent is triggered before the class
is executed. This event is triggered for all classes being loaded, from the core Java classes,
to custom libraries, to the class under analysis. This presents many avenues of operation for
tools using the JDI. However, for this coverage analysis implementation, only the class under
analysis is inspected. When this event occurs for the class under analysis, the class’s SET is
traversed to determine at which lines the breakpoints should be added.
Breakpoints are triggers that may be attached to locations in the source code that, when
Stellenbosch University http://scholar.sun.ac.za

CHAPTER 3. DESIGN AND IMPLEMENTATION 54
reached, will cause a BreakpointEvent before executing the code at that location. Breakpoints
will be used to indicate the presence of branches in the execution of methods.
A MethodEntryEvent is triggered when a method is to be invoked. This event allows an
analysis tool to investigate the data used in the method’s invocation. The method parame-
ters are among the data accessible within this event, which is important to ATCO ’s coverage
calculation process.
Why use Execution Tracing?
Execution tracing is not the only method that may be used to evaluate which states are
hit during test runs. Another method of calculating coverage is to parse the JUnit tests to
locate all method calls to the method under test, and run constraint solving over the input
parameters and the states in the SET. However, tests may potentially have complex setup
methods and require external libraries. Parsing the test and storing all the necessary data to
ensure the conditions of the test are an exact representation of its actual execution may be
difficult. This may require an expert knowledge of the JUnit test framework. Also, constraint
solving would have to be performed across all possible branches in the SET, to determine which
path is followed. This could greatly reduce performance as constraint solving is an expensive
computation and a method may theoretically contain infinitely many symbolic branches.
With execution tracing, the JUnit tests are executed, resulting in all the environmental
data required for coverage calculation to be available via the JDI without any additional
computations or knowledge of the JUnit test framework. The environmental data, such as
method invocation parameters, or which branch is currently being executed, may be used to
greatly reduce any unnecessary constraint solving, as will be seen in later sections.
Execution tracing also automatically extends the coverage calculation to be interprocedural.
A JUnit test will typically not directly call all methods in the class it is testing. It will, typically,
invoke a certain piece of functionality through a number of method calls. This will, in turn,
perform its purpose through other method calls, often private or protected methods, which
cannot be invoked directly from the JUnit test. Execution tracing will automatically handle
these methods the same as methods invoked directly from the test, which allows for coverage
to be calculated on non-public methods, without any additional processing.
Stellenbosch University http://scholar.sun.ac.za

CHAPTER 3. DESIGN AND IMPLEMENTATION 55
3.3.2 Test Environment
The test environment is a JVM, created through the JDI, in which the JUnit test will be
executed. When executing multiple tests, it is important to maintain the integrity of each test.
One test run may affect subsequent test runs, thereby compromising the integrity of all tests
executed within the same environment. Each test is, therefore, executed within its own test
environment. This ensures that the integrity of the test is maintained, while also providing an
easily identifiable unit of work to be executed concurrently.
3.3.3 Calculating Coverage
ATCO calculates branch coverage, multi-conditional coverage, and statement coverage as de-
fined in Definitions 2.8.2.2 (p. 37), 2.8.2.4 (p. 38), and 2.8.2.1 (p. 36), respectively.
Branch coverage is measured on a Jimple level. So, a branch covered in Jimple does not
necessarily translate to the conditional statement being completely covered in Java. This occurs
when the conditional statement in Java has multiple conditions. A multi-conditional branching
statement in Java is compiled to a series of subsequent single-conditional branching statements
in Jimple. The structure of the SET, together with the data stored within the symbolic states,
allows for all Jimple statements to be linked to their corresponding Java statements. This
allows multi-conditional coverage to be calculated by linking all compiled single-conditional
branching statements in Jimple to their corresponding multi-conditional branching statement
in Java. The SET also allows for statement coverage to be calculated on a Jimple level from
branch coverage. Therefore, with the help of the SET, branch coverage on a Jimple level can
be translated to statement coverage, branch coverage, and multi-conditional coverage in Java
source code.
Calculation during execution tracing
The test environment is set up by creating the JVM in which the test will be executed, and
passing the JVM the SET s of the class under test at the JDI level. The test execution is then
started.
Configuration of the JVM occurs on-the-fly during test execution, when a ClassPrepareEvent
is triggered for a class under analysis, i.e., when the class is about to be loaded during execution.
The configuration involves adding breakpoints to certain symbolic states in the class’s SET s,
Stellenbosch University http://scholar.sun.ac.za

CHAPTER 3. DESIGN AND IMPLEMENTATION 56
before the class is loaded. To add a breakpoint to a symbolic state means to add a breakpoint to
the Java source code line number, that the symbolic state represents. Breakpoints are added to
the first non-branching symbolic state following a branching symbolic state in the SET, along
both the branching symbolic state’s true and false paths. This is to cater for the possibility
that a branching symbolic state may be immediately followed by another branching symbolic
state. The reason for attaching breakpoints to these symbolic states, and not the branching
symbolic states themselves, is because breakpoints on branching symbolic states will require
two constraint solving operations to determine which path was taken. Having the breakpoints
on the first non-branching symbolic state will require no constraint solving, since the path
containing the breakpoint is followed during test execution.
Figure 3.7, p. 56 illustrates this configuration with an example.
1: int checkValue(int x) {
2: int a = 0;
3: if( x > 0 ) {
4: if( x % 2 == 0 ) {
5: a++;
6: } else {
7: a--;
8: }
9: }
10: return a;
11: }
Figure 3.7: This method is a simple example, used to illustrate the breakpoint configurationduring coverage calculation. The method returns 0 if x <= 0, returns 1 if x is positive andeven, and returns −1 if x is positive and odd. The resulting SET is shown in Figure 3.8, p. 57.The first non-branching symbolic states following branching symbolic states are indicated withdotted nodes.
After the breakpoint configuration, the class is loaded, and test execution continues until
a MethodEntryEvent is triggered. When the event is triggered, the parameters are stored
locally for the duration of that method’s execution. Data related to the parameters include the
parameter names, types, and values. Also, during this event, there is a check whether the SET
contains any branches. Please be reminded that branches in the SET only occur at branching
statements with symbolic conditions. If a method contains no symbolic branches, then that
method will have no breakpoints set. In such a case, all statements within the method being
Stellenbosch University http://scholar.sun.ac.za

CHAPTER 3. DESIGN AND IMPLEMENTATION 57
Figure 3.8: This SET is the result of the code in Figure 3.7, p. 56, being symbolically executed.The nodes contain the line number to be executed, and the edges contain the statement thatwas executed. The edge if1 indicates the if statement at line 3, while if2 indicates the if
statement at line 4. The values (true) and (false), associated with those if edges, indicatewhether the true or false paths were followed with that edge. The dotted nodes indicate thesymbolic states to which breakpoints will be added.
Stellenbosch University http://scholar.sun.ac.za
CHAPTER 3. DESIGN AND IMPLEMENTATION 58
invoked may immediately be marked as covered, as all statements will be executed. When a
symbolic state in the SET is marked as covered, a coverage counter, maintained within that
symbolic state, is incremented. This counter indicates the number of times the symbolic state
was hit during coverage calculation; a hit means the symbolic state was reached during test
execution.
Execution continues until a BreakpointEvent is triggered. As previously mentioned, break-
points are added to the first non-branching symbolic state following a branching symbolic state
in the SET. Therefore, when a BreakpointEvent is triggered, a symbolic branch was reached
and one of its branches is already followed. If the symbolic branch executed has no symbolic
branches preceding it, nested branching excluded, then the statement at the breakpoint will
have only one symbolic state representing it. The single symbolic state is, therefore, the sym-
bolic state hit during execution, and this symbolic state’s counter is then incremented, with
no constraint solving required. If the branch has symbolic branches preceding it, then the
statement at the breakpoint will have multiple symbolic states representing it. Each symbolic
state, representing the single statement, will have a unique path condition, depending on which
paths were followed in earlier branches. An example is displayed in Figure 3.9, p. 59. When a
statement has multiple symbolic states representing it, a copy of each symbolic state is made
to maintain the integrity of the original symbolic state. Each copy has the method parameters
added to the path condition. Each copy, with the method parameters added to the path con-
dition, is then run through the constraint solver to discover which of the symbolic states were
actually hit. The symbolic state with a satisfiable path condition is the symbolic state hit at
the breakpoint. An exception to this occurs when symbolic loops are involved, which will be
discussed later in this section, p. 62.
The JVM continues to run the test and service the triggered events until the test is complete.
Upon completion, the SET will have the updated coverage counter values of all the symbolic
states that had breakpoints set at their location. A 100% statement covered method will have
the coverage counter of every first non-branching symbolic state following a branching symbolic
state in its SET set to at least 1. For methods with no symbolic branches, i.e., no branching
statements in its SET, only the first symbolic state in the SET will have its coverage counter
updated.
Stellenbosch University http://scholar.sun.ac.za

CHAPTER 3. DESIGN AND IMPLEMENTATION 59
1: int checkValue(int x) {
2: int a = 0;
3: if( x > 0 ) {
4: a += 1;
5: }
6: if( x % 2 == 0 ) {
7: a += 2;
8: }
9: return a;
10: }
Figure 3.9: This method is a simple example used to illustrate the breakpoint configurationduring coverage calculation when a line of code is represented by multiple states. The methodreturns 0 if x <= 0, returns 1 if x is positive and odd, returns 2 if x is negative and even, andreturns 3 if x is positive and even. The resulting SET is shown in Figure 3.10, p. 60. The firstnon-branching states following branching states are indicated with dotted nodes.
Updating coverage counters in the SET
The coverage results, after test execution, show only which paths were followed at each branch
in the SET by way of the first non-branching state containing a coverage counter indicating
how many times it was hit. Since the SET is an execution tree with no paths leading to nodes
other than a specific node’s direct parent or children, these coverage results may be used to
accurately calculate which paths in the SET were followed during execution. This is achieved
by updating the coverage counter of all the states in the SET. The counters are updated by
traversing the SET depth-first, until the last covered state in an execution path is found, i.e.,
a state marked as hit, with its direct parent being a branching state, and no branching states
succeeding it. Figure 3.11, p. 61, indicates this by showing the selected states as dotted nodes.
The coverage counter for each state in that execution path is then updated as follows: With
the root state, Sr, the last covered state, Sm, the last state in the path of Sm, Sl, their coverage
counters Scr , Sc
m, and Scl , respectively, and i = r..(m − 1), all states along the path of Sm are
updated as:
Sci = Sc
i + Scm
Scm..l = Sc
m
This is illustrated in the example displayed in Figure 3.11, p. 61.
Stellenbosch University http://scholar.sun.ac.za

CHAPTER 3. DESIGN AND IMPLEMENTATION 60
Figure 3.10: This SET is the result of the code in Figure 3.9, p. 59, being symbolicallyexecuted. The nodes contain the line number to be executed, and the edges contain thestatement that was executed. The edge if1 indicates the if statement at line 3, while if2
indicates the if statement at line 6. The values (true) and (false), associated with thoseif edges, indicate whether the true or false paths were followed with that edge. The dottednodes indicate the states to which breakpoints will be added. Note that there are two symbolicstates with breakpoints representing lines 7 and 9 in the SET.
Stellenbosch University http://scholar.sun.ac.za

CHAPTER 3. DESIGN AND IMPLEMENTATION 61
Figure 3.11: This SET is the result of the code in Figure 3.7, p. 56, being symbolically exe-cuted, and a test then being executed. The nodes now contain the coverage counters (Counter)of the symbolic states after execution tracing has been completed, with the dotted nodes beingthe symbolic states where breakpoints were added. The solid edges, as before, contain thestatements that were executed, while the dotted edges illustrate how the coverage counters ofthe other states are updated. The edge if1 indicates the if statement at line 3, while if2
indicates the if statement at line 4. The values (true) and (false), associated with thoseif edges, indicate whether the true or false paths were followed with that edge.
Stellenbosch University http://scholar.sun.ac.za

CHAPTER 3. DESIGN AND IMPLEMENTATION 62
The end result
After execution tracing is complete and the coverage counters in the SET are updated, the
coverage counter of each statement and branch in the SET will have been updated. This
indicates how many times each symbolic state in the SET was hit during testing. Therefore,
the result is the branch coverage and statement coverage of the SET on a Jimple level. This
information is then used to map the coverage statistics in the SET to the Java level, which
will then indicate the branch coverage, multi-conditional coverage, and statement coverage of
the SET on a Java level.
Interesting case with symbolic loops
There is an interesting occurrence when dealing with symbolic loops. With a symbolic value
V , when a loop condition contains a symbolic condition, e.g., i < V , both the true and false
paths are followed for the number of iterations as indicated with the loop counter, e.g., n. Thus,
all the statements in the loop will have n states, e.g., S1..n, representing them. Figure 3.12,
p. 62, displays a code example for a symbolic loop, together with the path conditions of the
symbolic states representing the paths.
Code snippet Path conditions
for( int i = 0; i < V, i++ ) { S1 : 0 < V
System.out.println( "Looped" ); S2 : 0 < V, 1 < V
} Sn : 0 < V, 1 < V, ..., n− 1 < V
Figure 3.12: This table illustrates an interesting case with symbolic loops when calculatingcoverage using symbolic execution.
The first non-branching statement within the loop will have a breakpoint assigned to it.
When this breakpoint is reached with each iteration of the loop, constraint solving will be used
to determine which of the n states were hit. The input parameters will indicate that, e.g.,
V = v. If v > n, then states S1..n will be marked as hit, while Sn+1..v will not. This is because
the number of times the loop is traversed during normal testing is more than the number of
times it is traversed during symbolic execution. If v < n, then states S1..v will be marked as
hit, while Sv+1..n will not. If v = n, then all states will be marked as hit. This interesting case
will not result in states being marked as covered when they were not hit during testing, but it
will result in the number of times they were hit being incorrect.
Stellenbosch University http://scholar.sun.ac.za

CHAPTER 3. DESIGN AND IMPLEMENTATION 63
To resolve this inaccuracy, the following needs to be considered. During the execution of a
method, the symbolic values remain unchanged. The method’s execution changes concrete val-
ues, path conditions of symbolic states, and the local variables that contain the computational
expressions of the symbolic values. Recall Figure 2.1, p. 19. With every iteration of a symbolic
loop, the symbolic values will be the same. This results in the same subset of symbolic states
having satisfiable path conditions with every iteration. Thus, all symbolic states in the SET,
that are part of the subset of symbolic states in the loop that will be marked as covered, are
marked as hit with every iteration. So to resolve this inaccuracy, the coverage counters should
only be updated with the first iteration of the loop. All subsequent iterations may be followed
and monitored, but no coverage counters should be updated for the affected subset. However,
due to time constraints during the implementation of ATCO, this was not implemented.
3.3.4 Test Redundancy Detection
Having a satisfactory level of code coverage indicates that a program is sufficiently tested, but
it does not indicate that a program is tested efficiently. Ideally, a test suite should contain no
redundant tests. A test is considered redundant if it does not exercise any new behaviour of a
program that has not already been exercised by other tests in the suite [45]. These redundant
tests increase the resources required to generate, execute, and maintain a test suite, without
adding any value to the suite itself.
ATCO provides a mechanism for identifying such redundant tests by gathering statistics
on what value each test case adds to the test suite during coverage calculation. Whenever
coverage calculation determines which state in the SET was hit during testing, the statistics
of the test that was executed is examined. If the state, hit during testing, has not yet been
hit by a previous test, a counter is incremented to indicate that this test has hit a new state,
i.e., it is testing a new behaviour in the program. If the state was previously hit, a counter is
incremented to indicate that the test has performed a redundant hit, i.e., it is testing behaviour
that has already been tested. Therefore, after all the tests in the suite have been executed and
coverage was calculated, the statistics of each test will indicate whether the test is a redundant
test or not. It is the user’s responsibility to decide whether these tests should remain in the
suite, or whether they may be removed.
It is important to note that the sequence in which the tests are executed have a great impact
Stellenbosch University http://scholar.sun.ac.za

CHAPTER 3. DESIGN AND IMPLEMENTATION 64
on the statistics of the tests. Take, for example, two tests, testA and testB, that test a similar
behaviour of a program. If testA is executed first, then B may be marked as a redundant test,
and vice versa. There may also be situations where redundant tests are desirable, as the tests
may test a specific behaviour in conjunction with other behaviours that may have already been
tested in other scenarios. ATCO only provides the statistics that indicate whether the tests
hit any states that were not previously reached by other tests.
3.3.5 Optimisation
The information analysis phase consists of numerous time-consuming tasks. Some optimisation
steps have, therefore, been taken to reduce the execution time of this phase.
Concurrency Considerations
Because tests are executed concurrently, and because more than one test may test the same
behaviour of a program, it is possible that more than one test may be executing the same
class in parallel. It is, therefore, possible that a race condition may occur with the coverage
counters of some states in a SET. A race condition occurs when a process attempts to access
or modify data while it is being modified by another process. This may cause inconsistencies
in the data, which would result in erroneous data. To protect the coverage data of the SET,
Java’s synchronisation is used to ensure that only one process may read or modify the coverage
counter of a specific state. Therefore, multiple processes may update the coverage counters of
different states in a single SET, but only one process may update the counter of a single state.
Java’s method synchronisation idiom was chosen to protect against race conditions, because
the resource requirements to assign a copy of all the SET s of large and complex programs may
be too large for the available resources. Synchronisation may, however, have a negative impact
on the execution time of concurrent processes, as a process may be blocked from completing
its assigned task, if another process is currently accessing the state it requires.
Constraint Solving Reduction
The purpose of constraint solving during coverage calculation was discussed in an earlier sec-
tion: constraint solving is used to determine which symbolic state was hit during test execution.
Constraint solving reduction was applied to this process, by only performing constraint solving
Stellenbosch University http://scholar.sun.ac.za

CHAPTER 3. DESIGN AND IMPLEMENTATION 65
when a single statement has multiple symbolic states representing it. Therefore, when a state-
ment has only one symbolic state representing it, that symbolic state will be the state that was
hit during test execution, and thus constraint solving is unnecessary.
The number of constraint solving operations may be reduced even further, at the cost of
test redundancy detection. For test redundancy detection, the actual values of the coverage
counters are relevant. This is because test redundancy detection needs to be aware of how
many times each statement was hit. When test redundancy detection is not required, the only
relevant information is whether a statement was hit at least once. Therefore, when a symbolic
state has been marked as hit for the first time, i.e., its coverage counter was incremented, all
subsequent constraint solving operations on that symbolic state becomes irrelevant, since it is
already covered. Therefore, when test redundancy detection is not measured, constraint solving
will only be performed on a symbolic state if the statement it represents has multiple symbolic
states representing it, and the symbolic state in question has not already been hit during
testing. Whether the redundancy of tests should be measured during coverage calculation is
configurable in ATCO.
3.3.6 Execution Tracing of Manual Testing
It was mentioned earlier that execution tracing is used during the execution of the JUnit
tests in order to calculate coverage. One of the benefits of execution tracing is that any
Java application, executed within a JDI controlled JVM, may be traced. Therefore, coverage
calculation does not have to be limited to the execution of JUnit test cases only. Allowing
a user to manually test an application, while performing execution tracing on that manual
test, allows coverage to be calculated on a manual test plan, i.e., a document, containing steps
to follow, to test an application. Performing coverage calculation on manual testing allows
application testers to verify the completeness of a test plan.
3.4 Result Analysis Phase
After coverage calculation is completed, as discussed in Section 3.3, the resulting SET s contain
the coverage statistics of all statements, branches, and so on. These statistics are then used
in the last phase of ATCO ’s execution, namely the result analysis phase. This phase involves
Stellenbosch University http://scholar.sun.ac.za
CHAPTER 3. DESIGN AND IMPLEMENTATION 66
guiding Artemis’s test generation engine to generate tests for all the branches that are not
covered by the existing test suite.
3.4.1 Artemis’ Test Generation Engine
As mentioned earlier, Artemis detects unhandled run-time exceptions, and generates JUnit
tests to verify the soundness of these detected exceptions. To accomplish the test generation,
Artemis has a test generation engine that is used to convert a symbolic state, together with its
path condition, into a JUnit test. This involves solving the constraints on the path condition
of the symbolic state, and using the results of the solved path condition as input parameters
for the method that contains the unhandled run-time exception.
3.4.2 Test Generation in ATCO
The test generation engine is used in ATCO to generate tests for symbolic states that were not
hit during coverage calculation, instead of generating tests for symbolic states that represent
statements that cause the unhandled exceptions.
3.5 Eclipse Plug-in
Analysis tools are, more often than not, difficult to set up and run. There are long descriptions
on dependencies, setup requirements, like environment variables, long classpaths, and, often,
complex build scripts are needed, to run these tools. With Integrated Development Environ-
ments (IDEs), integrating functionality into an easy-to-use interface to speed up compilation,
testing, and deploying of programs, why not attempt to integrate such an analysis tool into
the IDE as well? This would greatly reduce the effort to use such a tool, thereby encouraging
developers to use such tools more frequently.
Eclipse is an open-source IDE with an extensible plug-in system. It consists of a run-time
core that launches the platform base and then dynamically runs other plug-ins. The entire
architecture of Eclipse, including the core, is comprised of plug-ins, allowing developers to
completely remodel and customise Eclipse, should they so desire. This makes Eclipse ideal for
integrating an analysis tool, such as ATCO.
Stellenbosch University http://scholar.sun.ac.za

CHAPTER 3. DESIGN AND IMPLEMENTATION 67
ATCO extends three of the standard plug-ins within Eclipse, namely the Resource Man-
agement plug-in, the Workbench plug-in, and the run-time core plug-in.
3.5.1 Resource Management Plug-in
As the name suggests, the resource management plug-in manages all the resources the user is
working with. Resources include projects, folders, and files present in the Eclipse workspace.
The workspace is where all the user’s data files reside. Information on all resources within the
workspace, all elements such as libraries, dependencies with other projects, etc. can be accessed
through the resource management plug-in. The user can define a workspace directory on the
file system to house projects, but the resources within the workspace are not limited to projects
within that directory. Eclipse allows projects and other resources from arbitrary locations on
the file system, or perhaps even on another machine, to be imported into the Eclipse workspace
without physically copying it into the workspace directory.
The functionality provided by this plug-in is useful for a tool such as ATCO. It allows the
tool to dynamically build classpaths for files to be analysed, by accessing the project’s library
list, and adding the locations of all libraries to the classpath, before running Soot during
the information gathering phase. The resource management plug-in allows ATCO to access
information on resources across the entire workspace, even if those resources are not physically
stored in a single location. Therefore, apart from being able to handle projects within the
workspace directory, ATCO can also handle projects within the workspace that reside outside
the workspace directory.
3.5.2 Workbench Plug-in
The workbench is the User Interface (UI ) plug-in that contains most of the UI components in
Eclipse. It defines the extension points that other plug-ins can use to contribute to the UI of
Eclipse. Some of the extension points include preferences, views, and the tool bar.
Preferences
When using a plug-in within an IDE, the user would expect a level of customisation. Plug-ins,
therefore, allow a user to control the behaviour of the plug-in, to a certain extent, by presenting
the user with a settings, or preferences, menu. The workbench provides some support for this
Stellenbosch University http://scholar.sun.ac.za

CHAPTER 3. DESIGN AND IMPLEMENTATION 68
Figure 3.13: The main preferences page that houses the other preferences pages as sub pages.
through the Preferences dialog. The preferences dialog allow the user to customise the plug-in,
and let these settings persist, even if Eclipse is terminated and launched again. This greatly
improves the usability of a tool.
ATCO contains three preference pages: the Symbolic Execution Preferences (Figure 3.14,
p. 69), the Coverage Preferences (Figure 3.15, p. 70), and the Manual Execution Preferences
(Figure 3.16, p. 70), all grouped under a parent preference page (Figure 3.13, p. 68). These
preference pages contain all the settings the user may use to configure ATCO. Settings for
symbolic execution include the classes to be analysed, the interprocedural call depth, and
the loop count limiter when symbolically executing the classes. The user may also specify
the output directory where all debugging and graph files are stored. Settings for coverage
calculation include selecting the tests to run, how many concurrent threads to use and how
much memory to allocate to each thread, and the flag to indicate whether redundancy detection
should be used during coverage calculation. Settings for manual execution include specifying
the class to execute, together with the JVM parameters and the command-line parameters to
send to the class. The input required from the user is minimal, since all other information is
extracted from the resource management plug-in.
A filtering implementation was added to the file selection component of the preferences
pages, to filter the files to display. Within the symbolic execution preferences, only Java class
files are displayed, since these are the only files ATCO can analyse. In the coverage preferences,
Stellenbosch University http://scholar.sun.ac.za

CHAPTER 3. DESIGN AND IMPLEMENTATION 69
Figure 3.14: The symbolic execution preferences page.
only files that import the JUnit library are displayed, thereby limiting the user’s selection of
files to files that are likely to be actual JUnit tests. To improve usability when selecting
multiple files with the file selection interface, recursive selection was implemented. When a
folder is ticked or unticked, then all objects within that folder are ticked or unticked as well.
Thus, ticking the project will select all applicable files within the entire file structure of the
project.
The preferences pages of ATCO are listed under the general Eclipse preferences (see Fig-
ure 3.17, p. 70) since ATCO is not project specific, but spans across the entire workspace.
Keeping the settings uniform across the whole workspace, this allows the user to test multiple
projects simultaneously, without having to do the setup for each project individually. However,
this prevents individual ATCO configurations for the various projects within the workspace.
Views
A View is a component that provides a visual output of information. A common example
within Eclipse is the Problems view that lists compilation errors and warnings of the projects
in the workspace. This is the component ATCO uses to display the classes to be analysed, as
well as the result of the analysis, after it is finished.
ATCO contains two views. First, the File Coverage View, shown in Figure 3.18, p. 71,
Stellenbosch University http://scholar.sun.ac.za

CHAPTER 3. DESIGN AND IMPLEMENTATION 70
Figure 3.15: The coverage preferences page.
Figure 3.16: The manual execution preferences page.
Figure 3.17: The standard Window drop down menu in Eclipse houses the preferences page.
Stellenbosch University http://scholar.sun.ac.za
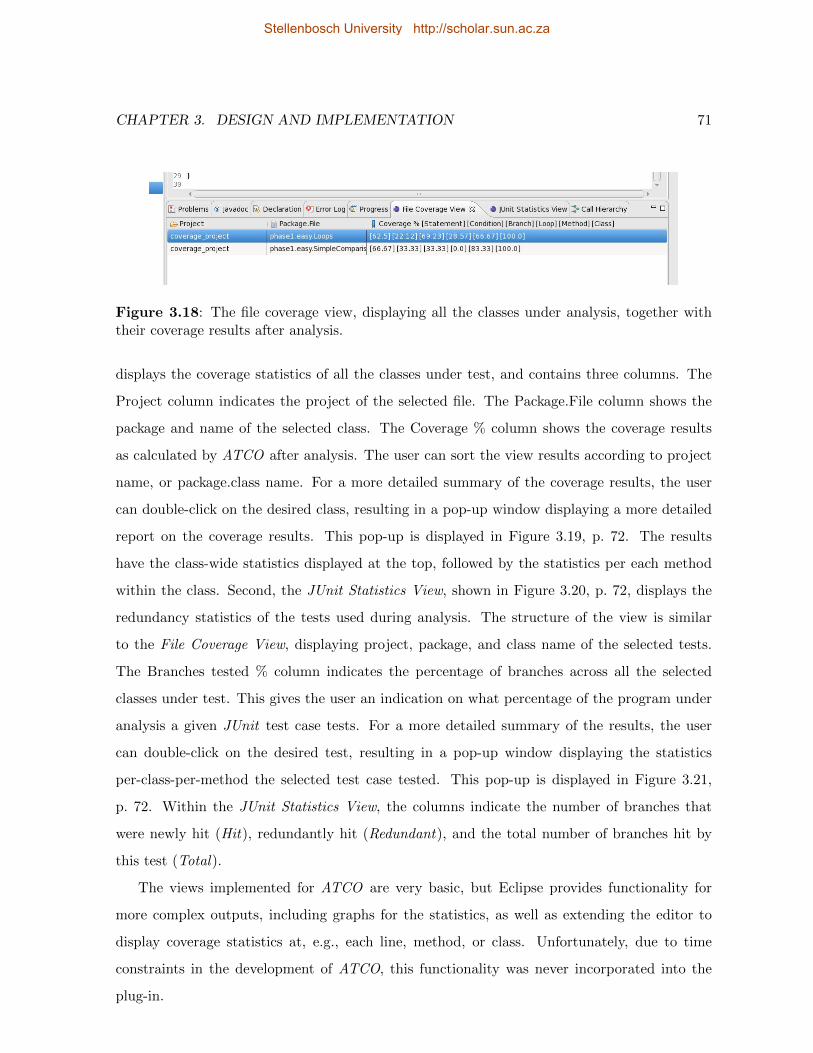
CHAPTER 3. DESIGN AND IMPLEMENTATION 71
Figure 3.18: The file coverage view, displaying all the classes under analysis, together withtheir coverage results after analysis.
displays the coverage statistics of all the classes under test, and contains three columns. The
Project column indicates the project of the selected file. The Package.File column shows the
package and name of the selected class. The Coverage % column shows the coverage results
as calculated by ATCO after analysis. The user can sort the view results according to project
name, or package.class name. For a more detailed summary of the coverage results, the user
can double-click on the desired class, resulting in a pop-up window displaying a more detailed
report on the coverage results. This pop-up is displayed in Figure 3.19, p. 72. The results
have the class-wide statistics displayed at the top, followed by the statistics per each method
within the class. Second, the JUnit Statistics View, shown in Figure 3.20, p. 72, displays the
redundancy statistics of the tests used during analysis. The structure of the view is similar
to the File Coverage View, displaying project, package, and class name of the selected tests.
The Branches tested % column indicates the percentage of branches across all the selected
classes under test. This gives the user an indication on what percentage of the program under
analysis a given JUnit test case tests. For a more detailed summary of the results, the user
can double-click on the desired test, resulting in a pop-up window displaying the statistics
per-class-per-method the selected test case tested. This pop-up is displayed in Figure 3.21,
p. 72. Within the JUnit Statistics View, the columns indicate the number of branches that
were newly hit (Hit), redundantly hit (Redundant), and the total number of branches hit by
this test (Total).
The views implemented for ATCO are very basic, but Eclipse provides functionality for
more complex outputs, including graphs for the statistics, as well as extending the editor to
display coverage statistics at, e.g., each line, method, or class. Unfortunately, due to time
constraints in the development of ATCO, this functionality was never incorporated into the
plug-in.
Stellenbosch University http://scholar.sun.ac.za

CHAPTER 3. DESIGN AND IMPLEMENTATION 72
Figure 3.19: The detailed view available from the file coverage view by double-clicking onany of the classes in the view.
Figure 3.20: The JUnit statistics view, displaying all the selected JUnit test cases, togetherwith their redundancy results after analysis.
Figure 3.21: The detailed view available from the JUnit statistics view by double-clicking onany of the test cases in the view.
Stellenbosch University http://scholar.sun.ac.za

CHAPTER 3. DESIGN AND IMPLEMENTATION 73
Figure 3.22: The ATCO action button, housed within its own tool bar group, and completewith tool-tip, used to launch the analysis of the selected class(es). For lack of an icon for thebutton, the tool name was used.
Tool Bar Action Button
The workbench contains many extension points for adding action buttons, which perform an
action when pressed. These buttons can be added to many places in the workbench, from
the views, to drop-down menus, the tool bar, and so on. These action buttons, when clicked,
execute the code embedded within the class used to implement the button.
Within ATCO, the implemented action button is used to launch its entire analysis process.
The user may set the preferences of ATCO through its preferences pages, then click the action
button to run the analysis on the selected classes. Within the action button, the arguments,
to be passed to Soot, are constructed by using the resource management plug-in to locate the
required libraries and source locations, and compiling all the necessary information into a valid
Soot argument string to be passed to Artemis. Artemis is then invoked with this argument
string, which is then followed by the analysis implemented in ATCO. Figure 3.22, p. 73 shows
the action button with tool-tip.
3.5.3 Jobs
One of the challenges of plugging a processor intensive tool into an IDE is that the tool must be
able to run concurrently with the other operations constantly running within the IDE. Merely
running the tool will seize the other functions of the IDE, such as the various views, compilers,
and even the editors. This issue holds throughout the entire Eclipse environment, since it
constantly has plug-ins running various tasks at all times. Eclipse addresses this issue with its
concurrency infrastructure by introducing the Jobs package. A job represents a unit of work
that needs to be able to run asynchronously. A plug-in creates and schedules a job, which is
then added to the job queue maintained by the Eclipse platform.
Stellenbosch University http://scholar.sun.ac.za

CHAPTER 3. DESIGN AND IMPLEMENTATION 74
Figure 3.23: The progress bar indicating the overall progress of the various execution phaseswithin ATCO. This example displays the information gathering phase, where Soot converts theJava bytecode into Jimple format, and where symbolic execution will be performed.
The analysis in ATCO is run within a job object. This allows the processor intensive
operation of symbolic execution and constraint solving to execute concurrently with the rest
of Eclipse, allowing the user to still use the IDE during analysis.
Another feature provided by the job package is the Progress Monitor, shown in Figure
3.23, p. 74. This may be used to output statistics on the progress of the job being executed
under the Progress view, which is standard to Eclipse. ATCO use the progress monitor to
display the phase it is currently executing, the class currently being analysed, and so on. The
concurrent execution of the information analysis phase makes the use of the progress monitor
difficult, since there is only one progress monitor for each job. Therefore, the progress monitor
is used to display the progress across all classes analysed, i.e., the percentage of classes already
analysed, as opposed to displaying the progress of each class currently being analysed.
Stellenbosch University http://scholar.sun.ac.za

Chapter 4
Evaluation
Previous chapters presented the theory, as well as the design and implementation of the ATCO
plug-in. This chapter will describe the various experiments that were used to evaluate ATCO.
The experiments were designed with the following objectives in mind.
Correctness of Coverage Calculation: The correctness of coverage calculation with ATCO,
i.e., whether the coverage calculation, measured with ATCO, is correct, needs to be eval-
uated. The impact that the analysis configurations in ATCO have on the accuracy of
the coverage calculation, needs to be evaluated as well. The analysis may be configured
by changing any of the following values (default values are included in parentheses): call
depth (1), loop count (4), and whether redundancy detection is turned on (yes).
Performance of Coverage Calculation: The performance of coverage calculation with ATCO
needs to be evaluated. The impact of the concurrent configuration in ATCO, i.e., the
number of concurrent threads used during coverage calculation, needs to be evaluated as
well.
Effectiveness of Generated Test Cases: The effectiveness and correctness of the test cases,
generated through ATCO ’s analysis, need to be evaluated. The impact of the analysis
configurations on the effectiveness of the generated test cases needs to be evaluated as
well.
75
Stellenbosch University http://scholar.sun.ac.za

CHAPTER 4. EVALUATION 76
4.1 Test Setup
ATCO has been developed as an Eclipse plug-in to take advantage of Eclipse’s Graphical User
Interface (GUI ) extensions, as was described in the previous chapter. However, the tool was
also developed to allow it to be executed from a normal command-line interface. The purpose
of this is to allow ATCO to be executed on two different environments, both of which will be
discussed here.
4.1.1 Single-core GUI Environment
Eclipse is a GUI application, and, therefore, require an environment that is able to display its
interfaces. Most standard operating systems, such as Microsoft Windows and Linux, are capable
of displaying GUI applications. However, the GUI environment available for the evaluation
of the ATCO plug-in is a single-core machine with limited resources. This environment is,
therefore, only used during testing of the ATCO plug-in’s GUI. All experiments, which are
presented in this chapter, are performed on a multi-core command-line environment.
4.1.2 Multi-core Command-Line Environment
To fully utilise the concurrent design in ATCO, a multi-core system is necessary. The multi-core
system, used for all of the experiments, contains two 2.26GHz Intel Xeon E5520 processors,
which supports up to a total of 8 threads, with 4GB of allocated memory. However, this
environment is only accessible remotely via secure shell (SSH ). Therefore, Eclipse could not be
used in this environment. Thus, ATCO is adapted to allow it to execute on a command-line
interface, in order to use this environment.
4.2 Other Tools
There are a number of tools that generate test cases for the purpose of maximising coverage, like
JTest [27] and Symstra [44]. However, these tools do not consider an already existing JUnit
test suite. These tools generate an additional, independent test suite. As the focus of this
thesis is coverage calculation, and using that information to generate tests, it is decided that
little value would be received from comparing ATCO to these tools. Instead, the experiments,
described in this chapter, will be compared to EMMA [17], a popular coverage calculation tool
Stellenbosch University http://scholar.sun.ac.za

CHAPTER 4. EVALUATION 77
discussed in Section 2.8.4, p. 39. EMMA is the chosen tool because it is an open-source, freely
available coverage calculation tool, that is well documented and easy to use. It also presents
its results in a manner that makes it easy to compare to ATCO.
4.3 Correctness of Coverage Calculation
The first set of experiments aims to verify whether ATCO measures coverage correctly. This
is separated into three groups of tests. First, a set of custom applications, together with JUnit
test cases. Second, a set of small, real-world applications, often used to demonstrate the usage
of the JUnit test framework. Third, a large, real-world application, often used in evaluations
of program analysis and program verification tools.
4.3.1 Custom Applications
The purpose of the custom applications is to allow for accurate, manual confirmation that
ATCO yields the expected results. These custom applications are also used to evaluate the
impact of the analysis configurations. These results are compared to the results generated by
EMMA [17], to further verify the correctness of ATCO.
There are three custom applications used for this evaluation:
• SimpleComparisons: This application is a single class that consists of independent meth-
ods. Thus, no method within the class invokes another method, so its coverage results
are unaffected by the configured call depth. It also contains no loops, so its coverage
results are unaffected by the configured loop count.
• InterprocInvestigations: This application is a single class that consists of methods that
invoke other methods in the class. The methods also have varying scopes, i.e., public,
private, and protected methods. This application is used to evaluate the effect of
various call depth configurations on the SET and the coverage calculation results. It also
demonstrates the benefits of interprocedural analysis on methods that cannot be directly
invoked outside of their scope. It contains no loops, so its coverage results are unaffected
by the configured loop count.
• Loops: This application is a single class that consists of independent methods that contain
loops. This application is used to evaluate the effect of various loop count configurations
Stellenbosch University http://scholar.sun.ac.za

CHAPTER 4. EVALUATION 78
on the SET and the coverage calculation results. Since the methods are independent, the
results are unaffected by the configured call depth.
Each of the above-mentioned custom applications have corresponding JUnit test cases, used
to test the application. These test cases are designed to follow specific paths through the
various methods in the applications. Knowledge of the specific paths, gained through manual
inspection of the applications and their JUnit tests, allow the results to be verified manually.
Results
The results in Table 4.1, p. 79, displays the accuracy of ATCO and the impact of the different
analysis configurations. The results are verified as correct and accurate through manual inspec-
tion of the source code of the custom applications, together with the JUnit test cases. Further
confidence in the results, presented by ATCO, is gained by using EMMA to measure coverage
on the custom applications as well. The comparable results between ATCO and EMMA are
displayed in Table 4.2, p. 80. EMMA rounds its results to the nearest integer value. Therefore,
for the sake of comparison, ATCO ’s coverage results are also rounded to the nearest integer
value.
Evaluation
Manual code inspection of the experiments in Table 4.1, p. 79, together with the comparison
to EMMA in Table 4.2, p. 80, provides sufficient evidence that ATCO yields the correct results
during coverage calculation. The results in Table 4.1 will now be discussed in more detail.
• SimpleComparisons: This custom application contains no interprocedural method calls,
no symbolic loops, and no nested or sequential symbolic branching statements. Therefore,
each statement has, at most, one symbolic state representing it. As such, no constraint
solving is required during coverage calculation, since constraint solving is only required
when a single statement is represented by multiple symbolic states. As no constraint solv-
ing occurs during coverage calculation, there is also no benefit from disabling redundancy
detection.
• InterprocInvestigations: An increase in explored symbolic states is observed, when com-
paring the intraprocedural analysis, i.e., CD = 0, to interprocedural analysis, i.e., CD >
Stellenbosch University http://scholar.sun.ac.za

CHAPTER 4. EVALUATION 79
SimpleComparisons
CD LC RD St CS Cl Me Br Ln Lo TR
N/A N/A Yes 60 0 100% 83.33% 62.5% 76.19% N/A 54.55%
N/A N/A No 60 0 100% 83.33% 62.5% 76.19% N/A N/A
InterprocInvestigations
CD LC RD St CS Cl Me Br Ln Lo TR
0 N/A Yes 161 0 100% 100% 61.54% 78.26% N/A 41.46%
0 N/A No 161 0 100% 100% 61.54% 78.26% N/A N/A
1 N/A Yes 225 39 100% 100% 61.54% 78.26% N/A 43.90%
1 N/A No 225 27 100% 100% 61.54% 78.26% N/A N/A
2 N/A Yes 227 43 100% 100% 61.54% 78.26% N/A 43.90%
2 N/A No 227 31 100% 100% 61.54% 78.26% N/A N/A
3 N/A Yes 227 43 100% 100% 61.54% 78.26% N/A 43.90%
3 N/A No 227 31 100% 100% 61.54% 78.26% N/A N/A
Loops
CD LC RD St CS Cl Me Br Ln Lo TR
N/A 2 Yes 198 116 100% 100% 69.23% 100% 85.71% 80.6%
N/A 2 No 198 62 100% 100% 69.23% 100% 0% N/A
N/A 4 Yes 466 329 100% 100% 76.92% 100% 85.71% 81.51%
N/A 4 No 466 232 100% 100% 76.92% 100% 0% N/A
N/A 6 Yes 863 645 100% 100% 84.62% 100% 85.71% 82.74%
N/A 6 No 863 506 100% 100% 84.62% 100% 0% N/A
N/A 8 Yes 1392 1065 100% 100% 84.62% 100% 85.71% 83.67%
N/A 8 No 1392 901 100% 100% 84.62% 100% 0% N/A
N/A 10 Yes 2050 1589 100% 100% 92.31% 100% 85.71% 84.07%
N/A 10 No 2050 1399 100% 100% 92.31% 100% 0% N/A
Table 4.1: The correctness evaluation of ATCO through custom applications. Each tableheader contains the name of the custom application analysed. The columns contain the config-ured call depth (CD), the configured loop count (LC), whether redundancy detection was used(RD), the number of explored symbolic states (St), the number of constraint solving opera-tions performed during the information gathering phase and information analysis phase (CS),and the following coverage statistics: Class coverage (Cl), Method coverage (Me), Branchcoverage (Br), Line coverage (Ln), and Loop coverage (Lo). The last column contains the testredundancy statistics (TR), indicating the percentage of states, hit during testing, that werealready hit, i.e., redundant.
Stellenbosch University http://scholar.sun.ac.za

CHAPTER 4. EVALUATION 80
SimpleComparisons
Class Method Line
Tool Total Cov Total Cov Total Cov
ATCO 1 100% 6 83% 21 76%
EMMA 1 100% 6 83% 21 76%
InterprocInvestigations
Class Method Line
Tool Total Cov Total Cov Total Cov
ATCO 1 100% 18 100% 69 78%
EMMA 1 100% 18 100% 69 78%
Loops
Class Method Line
Tool Total Cov Total Cov Total Cov
ATCO 1 100% 6 100% 30 100%
EMMA 1 100% 6 100% 30 100%
Table 4.2: The correctness evaluation of ATCO, by comparing its results to that of EMMA.Each table header contains the name of the custom application analysed. The columns containthe tool used (Tool), and the total number (Total) of classes, methods, and executable linesfound in the applications, as well as the corresponding percentage of this number to the totalnumber of classes, methods, and executable lines that are covered (Cov).
0. Also, an increase in call depth increases the number of constraint solving operations
required to accurately perform coverage calculation, since the invoked methods have mul-
tiple return states. A method that invokes another method gains an execution path for
every possible return state in the method it invoked. Interprocedural analysis yields an
increase in test redundancy, as the invoked methods are also considered, which increases
the number of symbolic states that may be hit redundantly. Disabling redundancy de-
tection yields a decrease in the number of constraint solving operations, but due to the
small size of this application, the benefits are minimal. Larger examples will yield more
significant benefits.
• Loops: A significant increase in explored symbolic states, together with a significant
increase in constraint solving operations, is observed with an increase in loop count (LC ).
This is to be expected, as the loop count dictates the number of times a symbolic loop is
iterated during symbolic execution. A notable occurrence is that line coverage is at 100%,
while the branch coverage is less than 100%. This occurs when the loop count is less than
the number of times the loop is actually iterated during testing. The path where the test
Stellenbosch University http://scholar.sun.ac.za

CHAPTER 4. EVALUATION 81
execution exits the loop is never represented symbolically. So, when the test execution
exits the loop, no symbolic state contains those path conditions, and thus the loop exit
branch is never hit during testing. The branch coverage increases with the increase in
loop count, because the JUnit test cases iterate over all the loops variably between 1
and 10 times. Therefore, the increase in loop count reduces the instances where the loop
count is less than the number of actual test iterations of a loop. Finally, the high test
redundancy statistic is due to the interesting case with symbolic loops, as discussed in
Section 3.3.3, p. 62. Test redundancy is measured on the symbolic states being hit during
testing. And, as stated in Section 3.3.3, with every iteration of a loop during testing, all
the branches representing that loop in the SET, that fall within the bounds of the actual
loop, will be marked as a hit. This results in each test hitting many states repeatedly,
which, in turn, causes the high test redundancy.
The custom applications, used to evaluate ATCO, all contain only primitive data types as
method input parameters, and in the branching statements. The experiments indicate that this
works well with symbolic execution and constraint solving. However, to evaluate the real-world
use of ATCO, non-primitive data types need to be considered.
4.3.2 Small Real-World Applications
Three small, real-world examples of the JUnit test framework are used to evaluate ATCO.
The purpose of these experiments are to evaluate ATCO with small examples that are not
custom applications, written specifically to test ATCO. These results are compared to the
results generated by EMMA [17], to further verify the correctness of ATCO.
The three applications used for these experiments are:
• Latitude [24]: This application is a single class that houses latitude coordinate informa-
tion. This is a simple application, with no interprocedural method calls or loops.
• ShoppingCart [6]: This is a simple example of a shopping cart application. It consists of
two classes (ShoppingCart, and Product), and a custom exception (ProductNotFoundEx-
ception). It contains some interprocedural method calls, and one loop, which will iterate
at most twice, according to its test.
Stellenbosch University http://scholar.sun.ac.za

CHAPTER 4. EVALUATION 82
• Money [29]: This is a simple example of a currency conversion system, with some basic
calculations between currencies. It consists of two classes (Money, and MoneyBag), and
one interface (IMoney). It contains many interprocedural method calls, and many loops.
Results
The results in Table 4.3, p. 82, display the accuracy and configuration impact of ATCO. EMMA
is used to measure coverage on the small applications as well. The comparable results between
ATCO and EMMA are displayed in Table 4.4, p. 83. As before, ATCO ’s coverage results are
rounded to the nearest integer for the sake of comparison.
Latitude
CD LC RD St CS Cl Me Br Ln Lo TR
N/A N/A N/A 57 0 100% 100% 80% 95.24% N/A 25%
ShoppingCart
CD LC RD St CS Cl Me Br Ln Lo TR
0 N/A N/A 161 0 100% 90.91% 50% 75.86% N/A 25%
1 N/A N/A 161 0 100% 90.91% 50% 75.86% N/A 25%
Money
CD LC RD St CS Cl Me Br Ln Lo TR
0 4 Yes 602 2681 100% 96.88% 80% 86.73% 85.71% 96.48%
0 4 No 602 103 100% 96.88% 80% 86.73% N/A N/A
0 8 Yes 882 4653 100% 96.88% 80% 86.73% 85.71% 96.27%
0 8 No 882 183 100% 96.88% 80% 86.73% N/A N/A
1 4 Yes 6728 22478 100% 96.88% 80% 86.73% 85.71% 90.39%
1 4 No 6728 2186 100% 96.88% 80% 86.73% N/A N/A
1 8 Yes 1530380 4595462 100% 96.88% 80% 86.73% 85.71% 88.89%
1 8 No 1530380 524546 100% 96.88% 80% 86.73% N/A N/A
Table 4.3: The correctness evaluation of ATCO through small, real-world applications. Eachtable header contains the name of the application analysed. The columns contain the config-ured call depth (CD), the configured loop count (LC), whether redundancy detection was used(RD), the number of explored symbolic states (St), the number of constraint solving opera-tions performed during the information gathering phase and information analysis phase (CS),and the following coverage statistics: Class coverage (Cl), Method coverage (Me), Branchcoverage (Br), Line coverage (Ln), and Loop coverage (Lo). The last column contains the testredundancy statistics (TR), indicating the percentage of states, hit during testing, that werealready hit, i.e., redundant.
Stellenbosch University http://scholar.sun.ac.za

CHAPTER 4. EVALUATION 83
Latitude
Class Method Line
Tool Total Cov Total Cov Total Cov
ATCO 1 100% 3 100% 21 95%
EMMA 1 100% 3 100% 21 90%
ShoppingCart
Class Method Line
Tool Total Cov Total Cov Total Cov
ATCO 3 100% 11 90% 29 75%
EMMA 3 100% 11 100% 29 97%
Money
Class Method Line
Tool Total Cov Total Cov Total Cov
ATCO 2 100% 32 96% 98 86%
EMMA 2 100% 32 97% 98 88%
Table 4.4: The correctness evaluation of ATCO, by comparing its results with that of EMMA.Each table header contains the name of the application analysed. The columns contain the toolused (Tool), and the total number (Total) of classes, methods, and executable lines found inthe applications, as well as the corresponding percentage of this number to the total numberof classes, methods, and executable lines that are covered (Cov).
Evaluation
First, the results, displayed in Table 4.3, p. 82, are discussed in detail.
• Latitude: Similar to the SimpleComparisons example in the custom application evalu-
ation, this application is unaffected by the analysis configurations. Constraint solving
never has to be used, as there are no statements that are represented by more than one
symbolic state.
• ShoppingCart: This application contains some interprocedural method calls, but the
results show no change, regardless of call depth. This is because the methods, invoked
by other methods, do not contain any branches. Therefore, it does not contribute any
additional paths to the invoking method, and thus the results remain unchanged across
the configured call depths.
• Money: This application provides a clear example of, first, the state-explosion problem
when using interprocedural analysis and symbolic loops, and second, the benefits of not
Stellenbosch University http://scholar.sun.ac.za

CHAPTER 4. EVALUATION 84
performing redundancy detection. First, there is a significant increase in explored sym-
bolic states across the configured call depths, and an even more significant increase across
the configured loop counts. This is because the application contains methods, with sym-
bolic loops, that invoke other methods with a number of execution paths. Since symbolic
execution iterates a symbolic loop a number of times, and since interprocedural analysis
follows all invoked methods, up to a certain depth, the state space grows exponentially.
A notable observation is the reduction in test redundancy levels as the state space grows.
Because test redundancy is measured on the symbolic states in the SET, an increase in
the state space increases the total number of states that may be hit during testing. Thus,
if the state space grows, but the number of symbolic states that are hit redundantly
remain the same, or at least increases at a slower rate, then the total test redundancy
level will decrease. Second, disabling redundancy detection vastly reduces the number of
constraint solving operations required to perform coverage calculation, showing up to a
96.16% reduction in constraint solving operations.
Second, the comparable results between ATCO and EMMA, displayed in Table 4.4, p. 83 are
presented and evaluated. These results all yield different results to EMMA. This is because the
symbolic execution engine is still under development, and currently cannot handle non-primitive
types properly. Also, constraint solving, by definition, is used to solve constraints of primitive
variable types, such as binary or numeric data types. It is not for Objects, which are non-
primitive types. These small applications contain non-primitive input parameters to methods,
and symbolic loops over Collections of non-primitive types. They also contain non-primitive
conditions on branches, by using the instanceof operator in Java. As a result, constraint
solving cannot solve some of the path conditions on symbolic states. Therefore, the information
analysis phase cannot accurately determine which of the symbolic states, representing the
statement in question, should be marked as hit. This results in no symbolic states being
marked as covered, which causes the degradation in accuracy, seen in Table 4.4.
4.3.3 Large Real-World Application
The large, real-world application, used for these experiments, is JTopas [28], a Java tokenizer
and parsing tool. JTopas is open-source, has an accompanying JUnit regression test suite, and
is freely available from the Software-artifact Infrastructure Repository [5].
Stellenbosch University http://scholar.sun.ac.za

CHAPTER 4. EVALUATION 85
The symbolic execution engine, still under development at the time of evaluation, could not
handle some of the classes in JTopas. These classes included more complex constructs, such
as synchronized blocks, exceptions, and referencing array entries in conditional statements.
Thus, these classes had to be omitted during all experiments involving JTopas. However, the
experiments still yield sufficient results to demonstrate the goals of this thesis.
Results
Table 4.5, p. 85, presents the coverage calculation results of JTopas, while Table 4.6, p. 86
displays the comparable results between EMMA and ATCO. As before, ATCO ’s coverage
results are rounded to the nearest integer for the sake of comparison.
CD LC RD St CS Cl Me Br Ln Lo TR
0 4 Yes 2060 269694 54.17% 49.73% 36.21% 44.17% 0% 99.99%
0 4 No 2060 26 54.17% 49.73% 36.21% 44.17% N/A N/A
0 8 Yes 13340 269694 54.17% 49.73% 36.21% 44.17% 0% 99.99%
0 8 No 13340 26 54.17% 49.73% 36.21% 44.17% N/A N/A
1 4 Yes 4117 269694 54.17% 43.78% 31.41% 41.3% 0% 99.99%
1 4 No 4117 26 54.17% 43.78% 31.41% 41.3% N/A N/A
1 8 Yes 121399 269694 54.17% 43.78% 31.41% 41.3% 0% 99.99%
1 8 No 121399 26 54.17% 43.78% 31.41% 41.3% N/A N/A
2 4 Yes 4117 269694 54.17% 43.78% 31.41% 41.3% 0% 99.99%
2 4 No 4117 26 54.17% 43.78% 31.41% 41.3% N/A N/A
2 8 Yes 121399 269694 54.17% 43.78% 31.41% 41.3% 0% 99.99%
2 8 No 121399 26 54.17% 43.78% 31.41% 41.3% N/A N/A
Table 4.5: The correctness evaluation of ATCO through JTopas, a large, real-world applica-tion. The columns contain the configured call depth (CD), the configured loop count (LC),whether redundancy detection was used (RD), the number of explored symbolic states (St),the number of constraint solving operations performed during the information gathering phaseand information analysis phase (CS), and the following coverage statistics: Class coverage(Cl), Method coverage (Me), Branch coverage (Br), Line coverage (Ln), and Loop coverage(Lo). The last column contains the test redundancy statistics (TR), indicating the percentageof states, hit during testing, that were already hit, i.e., redundant.
Evaluation
None of the behaviour, observed in the experiments presented in Table 4.5, have not already
been observed in previous experiments. There is a reduction in branch coverage, and line
Stellenbosch University http://scholar.sun.ac.za

CHAPTER 4. EVALUATION 86
Class Method Line
Tool Total Cov Total Cov Total Cov
ATCO 21 54% 183 43% 520 41%
EMMA 21 95% 183 72% 520 74%
Table 4.6: The correctness evaluation of ATCO, by comparing its results, when measuring thecode coverage of JTopas, with that of EMMA. The columns contain the tool used (Tool), andthe total number (Total) of classes, methods, and executable lines found in the applications,as well as the corresponding percentage of this number to the total number of classes, methods,and executable lines that are covered (Cov).
coverage, when interprocedural analysis (CD > 0) is used. Also, there is a consistent 0%
loop coverage, across all experiments. As mentioned in previous experiments, the presence
of non-primitive conditions for branches, and symbolic loops, causes a degradation in the
accuracy of coverage calculation. However, the benefits of disabling redundancy detection in
these experiments are remarkable, requiring only 26 constraint solving operations to yield the
same coverage results. This demonstrates the repetitive design of the JUnit test suite of JTopas.
This repetitive design is further illuminated by the high test redundancy levels, detected during
coverage calculation.
The comparable results between ATCO and EMMA, again indicate the limitations of the
current implementation of the symbolic execution engine, still under development at the time
of evaluation. Since constraint solving cannot be used to determine which symbolic states are
hit during testing when non-primitive types are used, none of the symbolic states are marked
as hit, even though the test did, in fact, execute that specific line.
4.4 Performance of Coverage Calculation
The second set of experiments aims to measure the performance gains from the concurrent
design of coverage calculation in ATCO. These experiments are performed with the custom
application Loops, and the large, real-world application JTopas.
Each experiment is performed with varying concurrent configurations. Each experiment is
executed five times, and the results are calculated as an average over the five executions. This
is to account for varying loads on the experimentation environment. The average provides a
more accurate approximation of the actual performance.
Stellenbosch University http://scholar.sun.ac.za

CHAPTER 4. EVALUATION 87
4.4.1 Custom Applications
To increase the visibility of the performance gains of ATCO ’s concurrent design, the Loops
application is analysed with a loop count configuration of 30. A high loop count increases the
number of explored symbolic states, as well as the number of constraint solving operations
during coverage calculation, as is shown in Table 4.1, p. 79.
Results
The results in Table 4.7, p. 87, displays the monitored execution times of the full information
analysis phase, as well as the execution time of the longest running JUnit test case. The
purpose of displaying the longest running test case is to provide a more visible indication of
the benefits of ATCO ’s concurrent design.
St CS Tst Thr Time Long Gain
15848 12549 3 1 40.08s 23.51s 0%
15848 12549 3 2 30.72s 23.97s 23.35%
15848 12549 3 3 27.07s 24.24s 32.46%
Table 4.7: The performance evaluation of ATCO with the Loops custom application, config-ured with a loop count of 30. The columns contain the number of explored symbolic states (St),the number of constraint solving operations performed during the information gathering phaseand information analysis phase (CS), the number of JUnit tests executed (Tst), the numberof configured concurrent threads (Thr), the total execution time of the information analysisphase (Time), the execution time of the longest running test (Long), and the performancegain (Gain) received from the concurrent configuration, when compared to the execution withonly one concurrent thread.
Evaluation
With only one concurrent thread, all the test cases are executed sequentially. Therefore, the
total execution time is the sum of the execution time of each test, together with post-processing
performed by ATCO, such as updating coverage counters, and so on. A noticeable improvement
on execution time is observed with the increase in concurrent threads. However, this experiment
is small, so a large, real-world application will yield more accurate and reliable results.
Stellenbosch University http://scholar.sun.ac.za

CHAPTER 4. EVALUATION 88
4.4.2 Large Real-World Applications
JTopas should provide a more reliable and accurate indication of the performance gains of
ATCO ’s concurrent design, as it contains many classes and test cases. For these experiments,
the default analysis configurations are used.
Results
As with the previous performance evaluation, the results in Table 4.8, p. 88, displays the
monitored execution times of the full information analysis phase, as well as the execution time
of the longest running JUnit test case.
St CS Tst Thr Time Long Gain
4117 269694 17 1 4930s 2124s 0%
4117 269694 17 2 2599s 2058s 47.28%
4117 269694 17 3 2243s 2051s 54.50%
4117 269694 17 4 2245s 2101s 54.46%
4117 269694 17 5 2252s 2158s 54.32%
Table 4.8: The performance evaluation of ATCO with the JTopas application, with the defaultconfigurations for call depth (1), loop count (4), and whether redundancy detection is used (yes).The columns contain the number of explored symbolic states (St), the number of constraintsolving operations performed during the information gathering phase and information analysisphase (CS), the number of JUnit tests executed (Tst), the number of configured concurrentthreads (Thr), the total execution time of the information analysis phase (Time), the executiontime of the longest running test (Long), and the performance gain (Gain) received from theconcurrent configuration, when compared to the execution with only one concurrent thread.
Evaluation
The concurrent design of ATCO yields notable improvements to the performance of the tool.
However, the results in Table 4.8 also reveals a bottleneck in the current design. The maximum
performance gain, through the current concurrent design, is determined by the execution time
of the longest running test case. This is because ATCO is designed to execute each test in
its own concurrent thread. So, if one thread performs, e.g., 90% of all the work, the greatest
performance gain would be e.g., 10%. While having 10 threads, each doing 10% of the work,
the greatest performance gain could be closer to 90%.
There is a way to alleviate this issue. All the threads, used to execute the JUnit tests,
Stellenbosch University http://scholar.sun.ac.za

CHAPTER 4. EVALUATION 89
are stored in a thread pool. At the moment, all threads are only used to execute the JUnit
tests. To avoid the bottleneck, the management of the thread pool needs to be changed. A
possible option is to have two types of tasks to be assigned to threads. The first and highest
priority task, is the execution of the JUnit tests. Whenever constraint solving is required for
coverage calculation, ATCO should first check whether any threads are idle, with idle threads
indicating that no new tests need to be executed. If no idle threads are present, perform
constraint solving with the current, sequential process. If idle threads are present, create a
thread task for every required constraint solving operation. These operations will then execute
in parallel. This solution utilises the concurrent execution of the JUnit tests, and benefits from
idle threads when there are tests that require large numbers of constraint solving operations.
Unfortunately, due to time constraints, this solution was never implemented in ATCO.
4.5 Effectiveness of Generated Test Cases
The third set of experiments aims to indicate the effectiveness of the automatically generated
test cases when ATCO uses the SET with the coverage results, to generate test cases for
uncovered areas of an application. However, the test generation engine, still under development
at the time of evaluation, imposed various limitations. These limitations caused that only the
SimpleComparisons application can be used for this evaluation.
Results
Table 4.9, p. 90, presents the effectiveness of the test generation from the coverage results. The
experiment was executed two times. The purpose of the first execution is to measure code
coverage of the initial test suite, and automatically generate JUnit test cases. The second
execution uses both the original test suite, together with the newly generated test cases, to
measure the code coverage of the resulting test suite.
Evaluation
Although this experiment is small and basic, it does give an indication of the effectiveness
of using symbolic execution, with coverage calculation, to automatically generate test cases.
The initial JUnit test suite tests every method, but poorly tests the various branches in those
Stellenbosch University http://scholar.sun.ac.za

CHAPTER 4. EVALUATION 90
Before Test Generation
Gen Cl Me Br Ln RH TR
3 100% 83.33% 62.5% 76.19% 6 54.55%
After Test Generation
Gen Cl Me Br Ln RH TR
0 100% 83.33% 100% 90.48% 8 50%
Table 4.9: The evaluation the automatically generated test cases through ATCO, by per-forming coverage calculation, and automatically generating test cases for uncovered areas. Thetable headers indicate the phase of the experiments, the one phase being before test generationthe other being after test generation. The first column contains the number of generated testcases (Gen). Then, the columns contain the coverage statistics, which include Class coverage(Cl), Method coverage (Me), Branch coverage (Br), and Line coverage (Ln). The next col-umn indicates the number of symbolic states that are redundantly hit during testing (RH),while the last column contains the test redundancy statistics (TR), as before, indicating thepercentage of states, hit during testing, that were already hit, i.e., redundant.
methods. The coverage calculation results indicate these uncovered branches in the SET, and
tests are generated for each uncovered branch. The resulting test suite fully covers all the
branches of the application.
There are still a number of uncovered lines in the application, however these are in the main
method, which has a String array input parameter, that is not supported by the current test
generation engine.
Notably, a reduction in test redundancy is detected, while an increase in the number of
redundantly hit symbolic states is observed. This indicates that the resulting test suite does
generate some redundant tests, but an overall net gain is observed.
Stellenbosch University http://scholar.sun.ac.za

Chapter 5
Conclusion
This thesis investigated the practical applicability of using the static analysis formal method
known as symbolic execution, to calculate code coverage of an existing JUnit regression test
suite. The goal of this investigation was to determine whether this information could be used
to generate thorough and efficient regression test suites, by automatically generating JUnit test
cases for areas of a program currently not covered by its regression test suite. To achieve this
goal, a tool named ATCO was implemented. ATCO is an acronym compiled from Automated
Test Coverage Calculation and GeneratiOn.
ATCO has shown that coverage calculation could be performed with symbolic execution.
The symbolic execution information, stored in a Symbolic Execution Tree (SET ), represented
each method as a symbolic model of all its execution paths. With the SET, code coverage
of various common testing requirements, such as class coverage, method coverage, branch
coverage, and line coverage, could be measured accurately for methods with primitive data
types and branching conditions. The use of the SET, together with execution tracing, used to
measure the coverage, also allowed for an uncommon testing requirement, i.e., loop coverage,
to be measured accurately. However, coverage cannot currently be calculated for non-primitive
data types, such as Objects and arrays, because the current symbolic execution engine does not
support non-primitive data types. When ATCO, while executing a test, reaches a branch with
a condition that includes non-primitive data types, and the branch is represented by more than
one symbolic state, the current symbolic execution engine cannot be used to identify which of
these symbolic states was actually hit. In such cases, none of the states are marked as hit, even
though the branch was actually hit.
91
Stellenbosch University http://scholar.sun.ac.za

CHAPTER 5. CONCLUSION 92
One of the objectives was to use concurrency to reduce the time it takes to execute the
coverage calculation phase. This is because constraint solving is an expensive computation.
Constraint solving is used to determine which symbolic state is hit during testing, by solving
the constraints on the path condition of the symbolic state, with the input parameters of the
method, received during testing. If the input parameter values satisfy the path conditions of
a symbolic state, that state may be marked as hit. ATCO was designed to perform coverage
calculation concurrently, by executing each JUnit test case in its own concurrent thread. The
results have shown significant performance gains with this concurrent design, indicating up to
a 54% reduction in execution time. However, a bottleneck could be observed with this design,
as the maximum performance gain is restricted by the execution time of the longest running
test case. A solution to the bottleneck was proposed, but never implemented in this thesis.
Together with the concurrent design, further attempts to optimise the execution of coverage
calculation included reducing the number of constraint solving operations, required to measure
coverage. The first step was to only perform constraint solving if a branch has more than
one symbolic state representing it, as in the case of nested or sequential if statements in a
method. The second step was to ignore a symbolic state if it was previously marked as covered.
Therefore, constraint solving would only be performed on a symbolic state if there was more
than one symbolic state representing a branch, and if the state has not already been hit. These
two steps yield significant decreases in constraint solving operations, in some cases reducing
the number of operations from 269694 to 26, while still yielding identical coverage results to
the case where constraint solving is always performed. However, this eliminates the ability
to indicate how many times each symbolic state is hit during testing. Since this information
is useful for other features, this constraint solving reduction can be activated or deactivated.
Knowledge of how many times each state was hit during testing could be used to perform test
redundancy detection.
Test redundancy detection was implemented to improve the efficiency of the regression test
suite by identifying the level of redundancy of the current regression test suite. It is used to
indicate how many of the symbolic states, hit during testing, were hit redundantly. This could
be used to determine if there are tests in the regression test suite that do not test any new
areas of the program. Identifying these test cases, and removing them from the suite, improves
the efficiency of a test suite.
Stellenbosch University http://scholar.sun.ac.za

CHAPTER 5. CONCLUSION 93
One of the main aims of this thesis was to automatically generate JUnit test cases for the
areas of a program, not being tested by the current regression test suite. The current test
generation engine, still under development at the time, has limited functionality, and thus, the
experiments to evaluate this feature was very basic. However, the experiments indicated that
the SET and the coverage information could be used to accurately identify areas that are not
covered, and tests could be effectively generated for only those areas. This information ensures
that all the generated tests hit at least one previously uncovered state, during testing.
To improve the usability of ATCO, it was integrated into Eclipse as a plug-in, utilising the
graphical user interface (GUI ) extensions, provided by Eclipse. This showed many usability
improvements, provided by Eclipse, that analysis tools can use to encourage developers to use
such tools. These usability improvements include easy file and test selection, configuration
menus, persistent configurations that remain after Eclipse is closed and re-opened, and list
views to display coverage results. All these improvements make such a tool easier to use,
configure, and display the results in an easy-to-view format.
5.1 Future Work
This thesis provides a number of avenues for future development. These avenues include:
• The symbolic execution engine and test generation engine, used in this thesis, currently
only supports primitive data types. An important avenue of future work is to extend
the symbolic execution engine, and test generation engine, to include support for non-
primitive data types.
• ATCO executes in three distinct phases. This requires all the information of each phase
to be stored, which greatly increases the resource requirements of the tool. Future de-
velopments may involve finding efficient methods of reducing the resource requirements,
without significantly increasing execution times, by having the three phases interact more
closely.
• This thesis used run-time information collection, in the form of execution tracing to
measure coverage. However, as discussed in this thesis, there are other methods available
to measure coverage. These are source code instrumentation, and intermediate code
Stellenbosch University http://scholar.sun.ac.za

CHAPTER 5. CONCLUSION 94
instrumentation. Experimenting with various methods of coverage calculation may yield
interesting results, with regards to execution times.
• This thesis performs its analysis from Java byte code. This reduces the complexity of
the code to analyse. However, useful information such as the actual Java source code
statements, are hidden from the analysis tool. This prevents ATCO from measuring other
forms of coverage criteria, such as assertion coverage. An avenue of future development
involves extending the current implementation of ATCO to perform its analysis directly
from the Java source code.
• The JUnit test cases currently generated by ATCO only attempt to reach the symbolic
state. An avenue of future development would be to extend the test generation in ATCO
to evaluate the values returned from the invoked methods. These returned values may
then be used to generate assertion statements for use in the JUnit test cases. This
will allow for fully usable regression test suites, complete with assertions for the current
functionality of an application, to be generated automatically.
• The monitoring of a manual execution with ATCO currently only aims to measure code
coverage of that execution. However, there is sufficient information in the SET, and
additional information may be collected during execution tracing, to generate JUnit test
cases that mirror the behaviour, exhibited during manual execution. Possible research in
future may involve studying the effectiveness of generating such tests. This may enable
users unfamiliar with the JUnit test framework, and, in fact, the Java programming
language, to generate JUnit test cases, by simply testing the program manually.
Stellenbosch University http://scholar.sun.ac.za

Bibliography
[1] Agitar. http://www.agitar.com/. [2]
[2] B. Aktan, G. Greenwood, and M. H. Shor. Improving evolutionary algorithm performance
on maximizing functional test coverage of asics using adaptation of the fitness criteria. In
Proceedings of the Evolutionary Computation on 2002. CEC’02. Proceedings of the 2002
Congress - Volume 02, CEC’02, pages 1825–1829, Washington, DC, USA, 2002. IEEE
Computer Society. [34]
[3] H. Amjad. Combining model checking and theorem proving. In Technical Report UCAM-
CL-TR-601, University of Cambridge Computer Laboratory, 2004. [13]
[4] Java Platform Debugger Architecture.
http://java.sun.com/javase/6/docs/technotes/guides/jpda/architecture.html. [6, 53]
[5] Software artifact Infrastructure Repository. http://sir.unl.edu/portal/index.php. [84]
[6] Mike Clark. JUnitPrimer.
http://clarkware.com/articles/junitprimer.html. [81]
[7] Edmund M. Clarke, E. Allen Emerson, and Joseph Sifakis. Model checking: algorithmic
verification and debugging. Commun. ACM, 52(11):74–84, 2009. [13]
[8] Edmund M. Clarke and Jeannette M. Wing. Formal methods: state of the art and future
directions. ACM Comput. Surv., 28(4):626–643, 1996. [11, 12, 15]
[9] Clover. http://www.atlassian.com/software/clover/. [5, 39]
[10] Alberto Coen-Porisini, Giovanni Denaro, Carlo Ghezzi, and Mauro Pezze. Using symbolic
execution for verifying safety-critical systems. In ESEC/FSE-9: Proceedings of the 8th
95
Stellenbosch University http://scholar.sun.ac.za

BIBLIOGRAPHY 96
European software engineering conference held jointly with 9th ACM SIGSOFT interna-
tional symposium on Foundations of software engineering, pages 142–151, New York, NY,
USA, 2001. ACM. [24, 28]
[11] James C. Corbett, Matthew B. Dwyer, John Hatcliff, Shawn Laubach, Corina S.
Pasareanu, Robby, and Hongjun Zheng. Bandera: extracting finite-state models from
Java source code. In ICSE’00: Proceedings of the 22nd international conference on Soft-
ware engineering, pages 439–448, New York, NY, USA, 2000. ACM. [14]
[12] Patrick Cousot, Radhia Cousot, Jerome Feret, Laurent Mauborgne, Antoine Min, David
Monniaux, and Xavier Rival. The ASTREE analyzer. In Programming Languages and
Systems, Proceedings of the 14th European Symposium on Programming, volume 3444 of
Lecture Notes in Computer Science, pages 21–30. Springer, 2005. [17]
[13] Christoph Csallner and Yannis Smaragdakis. JCrasher: an automatic robustness tester
for Java. Softw. Pract. Exper., 34(11):1025–1050, 2004. [1, 28, 29]
[14] Christoph Csallner and Yannis Smaragdakis. Check ’n’ Crash: combining static checking
and testing. In ICSE’05: Proceedings of the 27th international conference on Software
engineering, pages 422–431, New York, NY, USA, 2005. ACM. [29]
[15] Christoph Csallner and Yannis Smaragdakis. DSD-Crasher: a hybrid analysis tool for
bug finding. In ISSTA’06: Proceedings of the 2006 international symposium on Software
testing and analysis, pages 245–254, New York, NY, USA, 2006. ACM. [30]
[16] Christoph Csallner, Nikolai Tillmann, and Yannis Smaragdakis. Dysy: dynamic sym-
bolic execution for invariant inference. In ICSE’08: Proceedings of the 30th international
conference on Software engineering, pages 281–290, New York, NY, USA, 2008. ACM.
[22, 27, 28]
[17] EMMA. http://emma.sourceforge.net/index.html. [36, 39, 76, 77, 81]
[18] Michael D. Ernst, Jake Cockrell, William G. Griswold, and David Notkin. Dynamically
discovering likely program invariants to support program evolution. In ICSE’99, pages
213–224, 1999. [30]
Stellenbosch University http://scholar.sun.ac.za

BIBLIOGRAPHY 97
[19] Cormac Flanagan, K. Rustan M. Leino, Mark Lillibridge, Greg Nelson, James B. Saxe,
and Raymie Stata. Extended Static Checking for Java. In PLDI’02: Proceedings of the
ACM SIGPLAN 2002 Conference on Programming Language Design and Implementation,
pages 234–245, New York, NY, USA, 2002. ACM. [17, 29]
[20] D. Geist, M. Farkas, A. Landver, Y. Lichtenstein, S. Ur, and Y. Wolfsthal. Coverage-
directed test generation using symbolic techniques, 1996. [34]
[21] Raanan Grinwald, Eran Harel, Michael Orgad, Shmuel Ur, and Avi Ziv. User defined
coverage – a tool supported methodology for design verification. In Proceedings of the
35th annual Design Automation Conference, DAC’98, pages 158–163, New York, NY,
USA, 1998. ACM. [34]
[22] Gerard J. Holzmann and Rajeev Joshi. Model-driven software verification. In In Proc.
2001 ACM SIGPLANSIGSOFT Workshop on Program Analysis for Software Tools and
Engineering (PASTE01, pages 80–89. ACM Press, 2004. [14]
[23] David Hovemeyer and William Pugh. Finding bugs is easy. In OOPSLA’04: Companion
to the 19th annual ACM SIGPLAN conference on Object-oriented Programming Systems,
Languages, and Applications, pages 132–136, New York, NY, USA, 2004. ACM. [17]
[24] Dan Hyde. Latitude.
http://www.eg.bucknell.edu/ cs475/f04-s05/junitsample.html. [81]
[25] Petri Ihantola. Test data generation for programming exercises with symbolic execution
in java pathfinder. In Baltic Sea’06: Proceedings of the 6th Baltic Sea Conference on
Computing education research, pages 87–94, New York, NY, USA, 2006. ACM. [22]
[26] JCover. http://www.codework.com/jcover/product.html. [39]
[27] JTest. http://www.parasoft.com/jsp/products/jtest.jsp/. [2, 76]
[28] JTopas. http://jtopas.sourceforge.net/jtopas/index.html. [84]
[29] JUnit.org. http://www.junit.org/. [1, 82]
[30] Cem Kaner. Software negligence and testing coverage. In Software Testing, Analysis &
Review Conference (STAR), page 313, 1996. [5, 39, 51, 52]
Stellenbosch University http://scholar.sun.ac.za

BIBLIOGRAPHY 98
[31] Sarfraz Khurshid, Corina S. Pasareanu, and Willem Visser. Generalized symbolic execution
for model checking and testing. In Proceedings of the 9th international conference on Tools
and algorithms for the construction and analysis of systems, TACAS’03, pages 553–568,
Berlin, Heidelberg, 2003. Springer-Verlag. [20]
[32] James C. King. A new approach to program testing. In Proceedings of the international
Conference on Reliable Software, pages 228–233, New York, NY, USA, 1975. ACM. [16, 18]
[33] James C. King. Symbolic execution and program testing. Commun. ACM, 19(7):385–394,
1976. [1, 2, 6, 18]
[34] Flemming Nielson, Hanne R. Nielson, and Chris Hankin. Principles of Program Analysis.
Springer-Verlag New York, Inc., Secaucus, NJ, USA, 1999. [15, 16]
[35] Martin Ouimet. Formal software verification: Model checking and theorem proving. In
Embedded Systems Laboratory Technical Report, Massachusetts Institute of Technology,
2005. [13, 14]
[36] Tuomo Pyhala and Keijo Heljanko. Specification coverage aided test selection. In Johan
Lilius, Felice Balarin, and Ricardo J. Machado, editors, Proceeding of the 3rd International
Conference on Application of Concurrency to System Design (ACSD’2003), pages 187–195,
Guimaraes, Portugal, June 2003. IEEE Computer Society. [34]
[37] Stephen F. Siegel, Anastasia Mironova, George S. Avrunin, and Lori A. Clarke. Us-
ing model checking with symbolic execution to verify parallel numerical programs. In
ISSTA’06: Proceedings of the 2006 International Symposium on Software Testing and
Analysis, pages 157–168, New York, NY, USA, 2006. ACM. [27]
[38] CHOCO Team. choco: an Open Source Java Constraint Programming Library. In Ecole
des Mines de Nantes. http://www.emn.fr/z-info/choco-solver/pdf/choco-presentation.pdf,
2010. [50]
[39] Aaron Tomb, Guillaume Brat, and Willem Visser. Variably interprocedural program anal-
ysis for runtime error detection. In ISSTA’07: Proceedings of the 2007 International
Symposium on Software Testing and Analysis, pages 97–107, New York, NY, USA, 2007.
ACM. [6, 26, 27]
Stellenbosch University http://scholar.sun.ac.za

BIBLIOGRAPHY 99
[40] Shmuel Ur and Avi Ziv. Off-the-shelf vs. custom made coverage models, which is the one
for you? [34]
[41] Concurrency Utilities.
http://download.oracle.com/javase/6/docs/technotes/guides/concurrency/overview.html.
[41]
[42] Raja Vallee-Rai, Phong Co, Etienne Gagnon, Laurie Hendren, Patrick Lam, and Vijay
Sundaresan. Soot – a java bytecode optimization framework, 1999. [42, 43]
[43] Willem Visser, Klaus Havelund, Guillaume Brat, and SeungJoon Park. Model checking
programs. In ASE’00: Proceedings of the 15th IEEE international conference on Au-
tomated Software Engineering, page 3, Washington, DC, USA, 2000. IEEE Computer
Society. [14]
[44] T. Xie, D. Marinov, W. Schulte, and D. Notkin. Symstra: A framework for generating
object-oriented unit tests using symbolic execution. In 11th International Conference
on Tools and Algorithms for the Construction and Analysis of Systems, pages 365–381.
Springer Verlag, April 2005. [76]
[45] Tao Xie. Improving effectiveness of automated software testing in the absence of specifi-
cations. PhD thesis, University of Washington, Seattle, WA, USA, 2005. AAI3183442.
[1, 2, 6, 63]
[46] Qian Yang, J. Jenny Li, and David M. Weiss. A survey of coverage-based testing tools.
Comput. J., 52:589–597, August 2009. [2, 5, 7, 39]
[47] Hong Zhu, Patrick A. V. Hall, and John H. R. May. Software unit test coverage and
adequacy. ACM Comput. Surv., 29(4):366–427, 1997. [2, 4, 30, 31, 32, 34, 35, 36, 37, 38, 39, 52]
Stellenbosch University http://scholar.sun.ac.za
![Automated Test Case Generation for Function Block ...821396/FULLTEXT01.pdfstructural coverage criteria required by the industry for operation [12]. An evaluation of this automated](https://img.pdfslide.us/doc/110x75/5f2d6c5480c7f828874fd9ec/automated-test-case-generation-for-function-block-821396fulltext01pdf-structural.jpg)