Embed Size (px)
Citation preview
Development of a Visualization Module for Madymo-based Child Restraint System (CRS) Safety Simulation
Authors: K. Hulme, Ph.D., A. Patra, Ph.D., N. Vusirikala, University at Buffalo R. Galganski, Veridian Engineering Keywords: Madymo, Scientific Visualization, CAE methods in crash safety applications, Occupant Safety, Simulation, Virtual Reality Abstract Computational modeling continues to play an increasingly significant role in the design of more effective vehicle crash safety systems. Models configured with sophisticated computer analyses such as Madymo permit researchers to perform extensive “what if?” and other exploratory studies at a fraction of the cost and time that would be required by means of physical testing alone. However, fully understanding and correctly interpreting the results generated by complex crash simulations is often an inherently difficult task, despite the availability of high-caliber, multi-perspective post-processing code imagery. The NYSCEDII CRS Visualization Module (NCVM) serves as a potentially useful 3-D, fully integrated add-on component to the Madymo dynamics analysis software. This paper demonstrates the utility of the NCVM using a combination conventional/finite element system model of a recent-production child restraint system (CRS) and its three-year-old dummy occupant in a modified FMVSS 213 sled test environment. Primarily, the NCVM allows the user to immersively visualize, at every time step of the simulation, the Madymo-calculated imagery depicting: (1) the motion of, and interactions between, the CRS shell, human “dummy”, harness and latch belt assemblies, and applicable vehicle cabin- interior surfaces and structure; and (2) nodal finite element Von Mises color stress contours for the CRS shell and its attendant restraint straps. Supplementary NCVM features include the following: (a) instantaneous body segment acceleration-time responses which can be depicted using an on-screen plotting utility; (b) on-screen reference markers which enable selected dummy displacements to be tracked as a function of time; (c) the simulation is viewable as either a forward-continuous animation or - to better understand localized displacements - frame by frame, forwards or backwards; and (d) the simulation can be viewed in either active or anaglyphic stereo to convey a sense of depth and immersion. 1. Background and Motivation In various parts of the world, child passengers riding in motor vehicles are subject to occupant injury criteria such as those embodied in U.S. Federal Motor Vehicle Safety Standard (FMVSS) 213 [1]. These regulations require that children within specified age and weight categories be constrained within a specially designed device, a child restraint system (CRS), which in turn is secured to the interior of the vehicle cabin. In each case, a rigorous laboratory test procedure (in the U.S., [2]) must be followed to ascertain CRS compliance relative to the stipulated safety requirements.
Currently, CRS prototype development and existing-design optimization are carried out almost exclusively via sled testing. Tooling and other costs associated with this often seemingly endless cycle- fabrication, testing, debugging, redesign, and fabrication- can mount rapidly, especially if too many educated guesses don’t pan out along the way. These costs can be reduced, often substantially, by conducting a series of extensive “what- if?” exploratory studies at critical stages of the initial design and/or redesign process using a suitable analytical tool and supporting software. Madymo (MAthematical DYnamical MOdels) [3], a state-of-the-art general-purpose analytical software package used extensively in the U.S. and abroad, was selected for this purpose in the research outlined below. A group of researchers led by Veridian Engineering and associated with the Center for Transportation Injury Research recently demonstrated that Madymo analyses can be dramatically enhanced by providing users the sensation of immersion in a virtual crash environment. This capability is achieved by means of a newly developed post-processing utility called NCVM (NYSCEDII CRS Visualization Module), described in this paper. It is applied to a combination conventional/finite element system model of a recent-production CRS and its dummy occupant in a modified FMVSS 213 sled test environment. The breakdown of the paper is as follows. First, technical details of the physical sled test will be outlined. This will be followed by a discussion of the Madymo analysis model that has been generated to computationally simulate the physical sled test. This will then be followed by a detailed discussion of the design and development of the NCVM. Thereafter, simulation results will be presented and discussed, after which some appropriate conclusions will be drawn. This paper concludes with numerous suggestions for future avenues of research. 2. Sled Testing Details A modified FMVSS 213 sled test of a current-production 5-point harness child restraint system (CRS) performed at Veridian Engineering’s HYGE sled facility provided the empirical information used to “validate” the fidelity of the Madymo model described in the next section. The CRS accommodated a Part 572 (Hybrid II)1 3-year-old child dummy and was positioned upright on a modified FMVSS 213 test bench (described below) in the forward-facing installation mode. The test (no. 22,238) was conducted without the use of a tether strap. Figure 1 depicts two views of the pre-test setup. As will be noted in the next section, several material property parameters required by the Madymo analysis were not available and were consequently estimated for use in the CRS model. One such material was the foam used in the FMVSS 213 test bench assembly.2 Because the CRS moves along the seat cushion and compresses the foam during the test exposure, these inputs 1 FMVSS 213 mandates the use of Hybrid II dummies. 2 The test bench seat cushion and seat back assemblies feature a laminated construction: two slabs of polyurethane foam having different density and thickness, the stiffer of which is in contact with a 3/8-inch-thick sheet of plywood. This “sandwich” is encased in a tight-fitting jacket made from elastic-backed vinyl automotive upholstery, circa early 1970s.
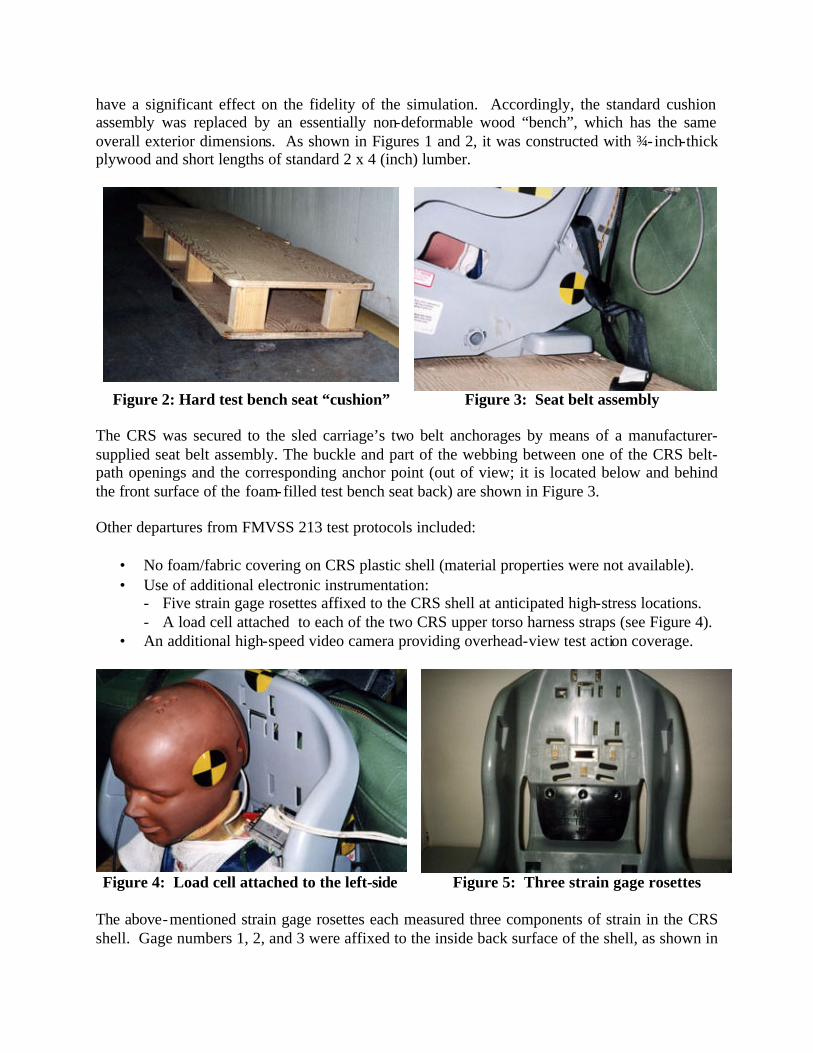
have a significant effect on the fidelity of the simulation. Accordingly, the standard cushion assembly was replaced by an essentially non-deformable wood “bench”, which has the same overall exterior dimensions. As shown in Figures 1 and 2, it was constructed with ¾-inch-thick plywood and short lengths of standard 2 x 4 (inch) lumber.
Figure 2: Hard test bench seat “cushion” Figure 3: Seat belt assembly
The CRS was secured to the sled carriage’s two belt anchorages by means of a manufacturer-supplied seat belt assembly. The buckle and part of the webbing between one of the CRS belt-path openings and the corresponding anchor point (out of view; it is located below and behind the front surface of the foam-filled test bench seat back) are shown in Figure 3. Other departures from FMVSS 213 test protocols included:
• No foam/fabric covering on CRS plastic shell (material properties were not available). • Use of additional electronic instrumentation:
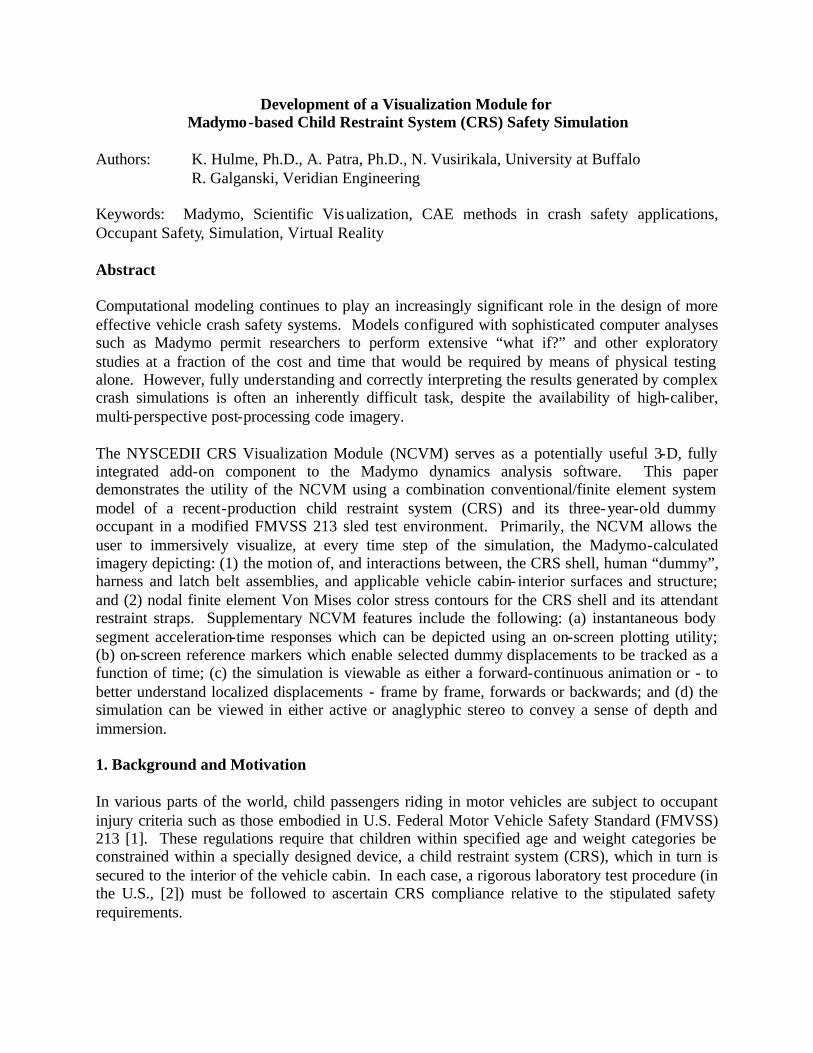
- Five strain gage rosettes affixed to the CRS shell at anticipated high-stress locations. - A load cell attached to each of the two CRS upper torso harness straps (see Figure 4).
• An additional high-speed video camera providing overhead-view test action coverage.
Figure 4: Load cell attached to the left-side Figure 5: Three strain gage rosettes
The above-mentioned strain gage rosettes each measured three components of strain in the CRS shell. Gage numbers 1, 2, and 3 were affixed to the inside back surface of the shell, as shown in
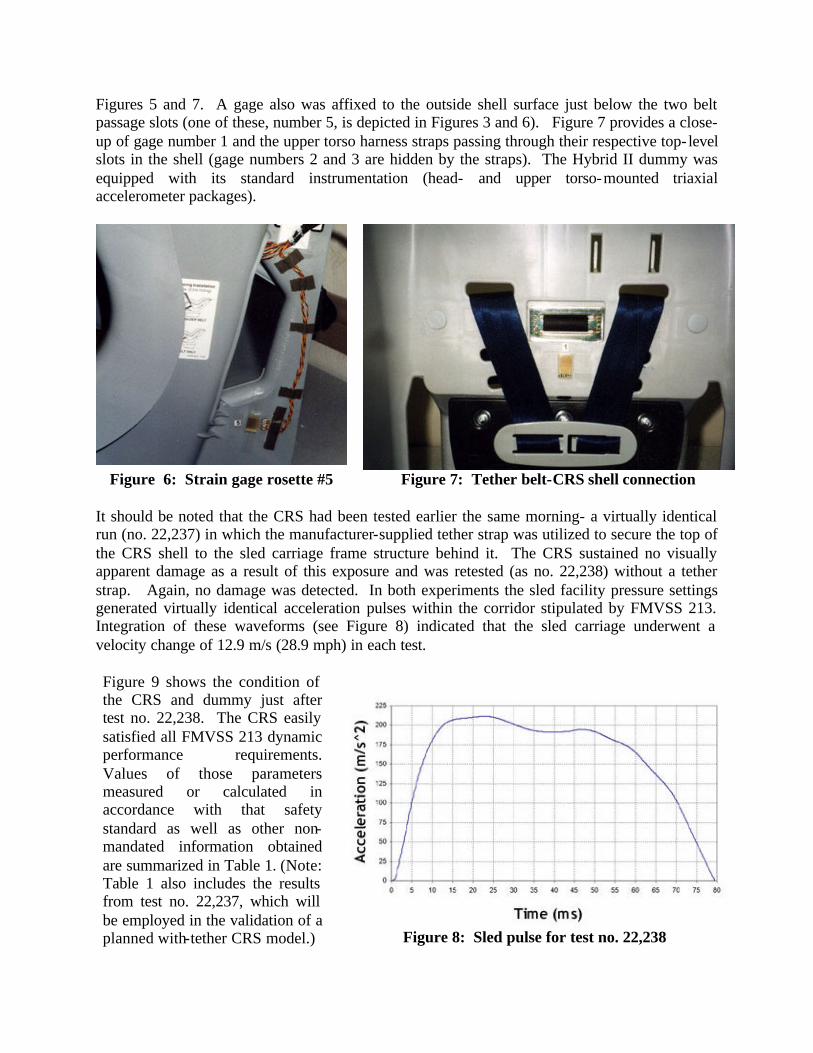
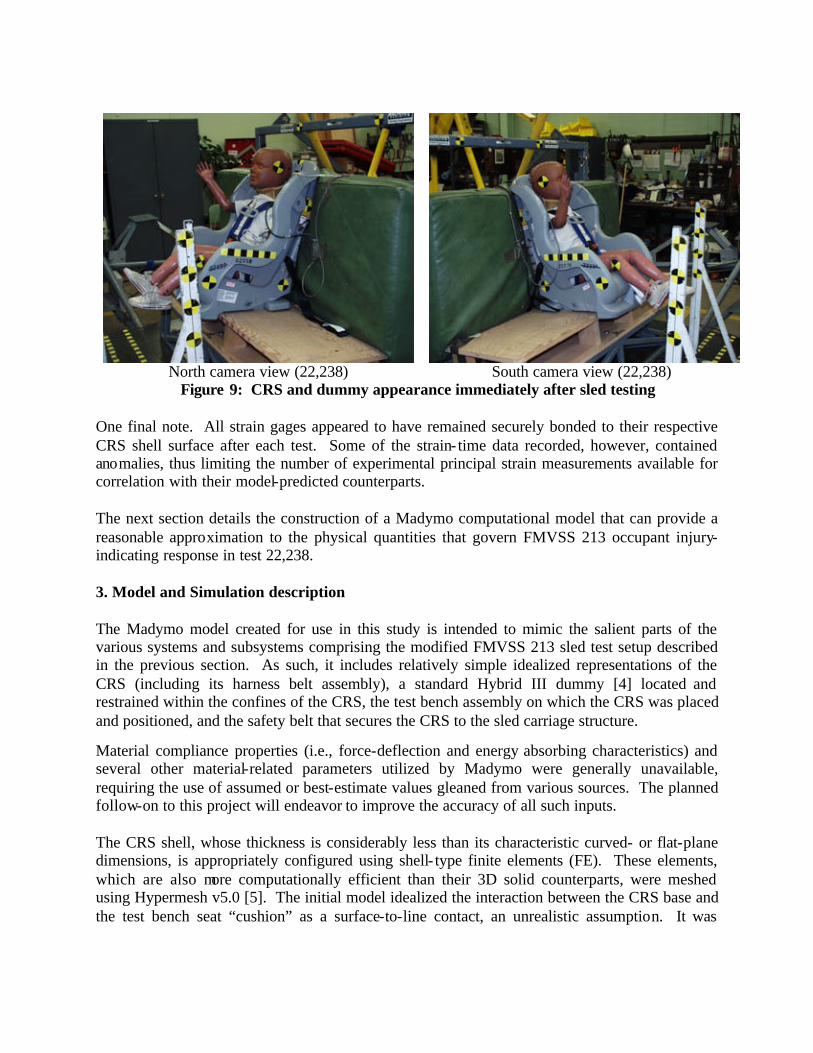
Figures 5 and 7. A gage also was affixed to the outside shell surface just below the two belt passage slots (one of these, number 5, is depicted in Figures 3 and 6). Figure 7 provides a close-up of gage number 1 and the upper torso harness straps passing through their respective top- level slots in the shell (gage numbers 2 and 3 are hidden by the straps). The Hybrid II dummy was equipped with its standard instrumentation (head- and upper torso-mounted triaxial accelerometer packages).
Figure 6: Strain gage rosette #5 Figure 7: Tether belt-CRS shell connection
It should be noted that the CRS had been tested earlier the same morning- a virtually identical run (no. 22,237) in which the manufacturer-supplied tether strap was utilized to secure the top of the CRS shell to the sled carriage frame structure behind it. The CRS sustained no visually apparent damage as a result of this exposure and was retested (as no. 22,238) without a tether strap. Again, no damage was detected. In both experiments the sled facility pressure settings generated virtually identical acceleration pulses within the corridor stipulated by FMVSS 213. Integration of these waveforms (see Figure 8) indicated that the sled carriage underwent a velocity change of 12.9 m/s (28.9 mph) in each test.
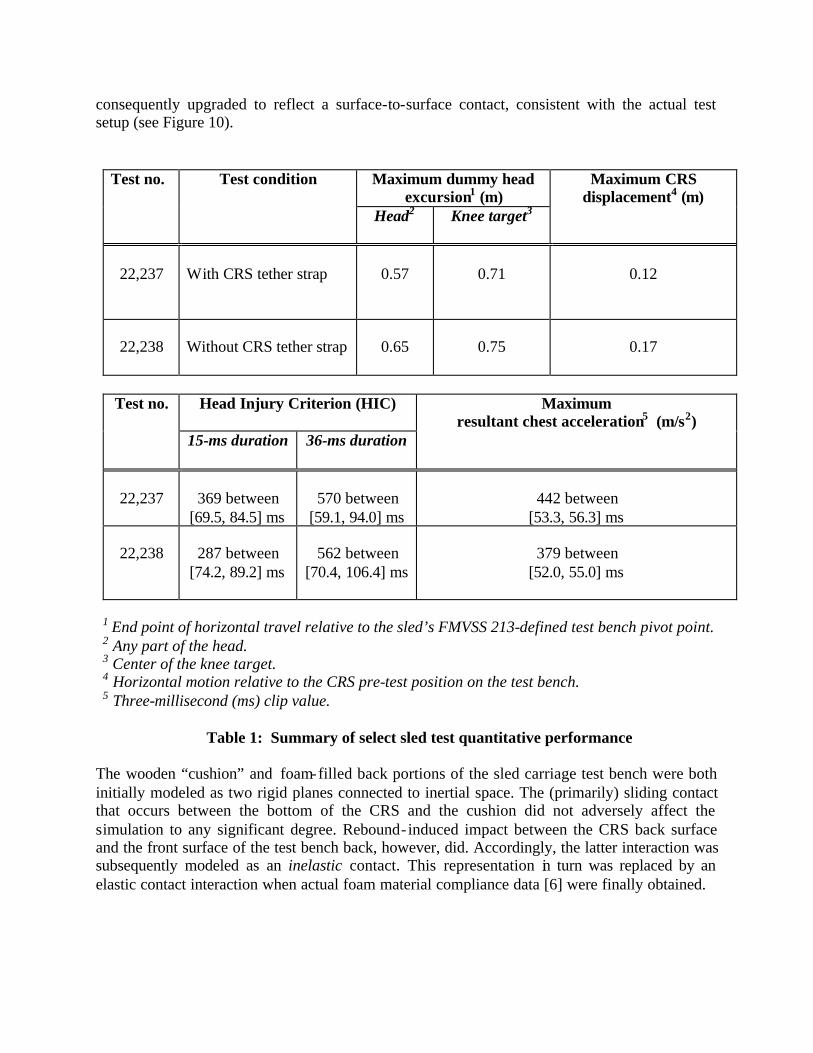
Figure 9 shows the condition of the CRS and dummy just after test no. 22,238. The CRS easily satisfied all FMVSS 213 dynamic performance requirements. Values of those parameters measured or calculated in accordance with that safety standard as well as other non-mandated information obtained are summarized in Table 1. (Note: Table 1 also includes the results from test no. 22,237, which will be employed in the validation of a planned with-tether CRS model.) Figure 8: Sled pulse for test no. 22,238
North camera view (22,238) South camera view (22,238)
Figure 9: CRS and dummy appearance immediately after sled testing One final note. All strain gages appeared to have remained securely bonded to their respective CRS shell surface after each test. Some of the strain- time data recorded, however, contained anomalies, thus limiting the number of experimental principal strain measurements available for correlation with their model-predicted counterparts. The next section details the construction of a Madymo computational model that can provide a reasonable approximation to the physical quantities that govern FMVSS 213 occupant injury-indicating response in test 22,238. 3. Model and Simulation description The Madymo model created for use in this study is intended to mimic the salient parts of the various systems and subsystems comprising the modified FMVSS 213 sled test setup described in the previous section. As such, it includes relatively simple idealized representations of the CRS (including its harness belt assembly), a standard Hybrid III dummy [4] located and restrained within the confines of the CRS, the test bench assembly on which the CRS was placed and positioned, and the safety belt that secures the CRS to the sled carriage structure.
Material compliance properties (i.e., force-deflection and energy absorbing characteristics) and several other material-related parameters utilized by Madymo were generally unavailable, requiring the use of assumed or best-estimate values gleaned from various sources. The planned follow-on to this project will endeavor to improve the accuracy of all such inputs. The CRS shell, whose thickness is considerably less than its characteristic curved- or flat-plane dimensions, is appropriately configured using shell- type finite elements (FE). These elements, which are also more computationally efficient than their 3D solid counterparts, were meshed using Hypermesh v5.0 [5]. The initial model idealized the interaction between the CRS base and the test bench seat “cushion” as a surface-to-line contact, an unrealistic assumption. It was
consequently upgraded to reflect a surface-to-surface contact, consistent with the actual test setup (see Figure 10).
Maximum dummy head excursion1 (m)
Test no. Test condition
Head2 Knee target3
Maximum CRS displacement4 (m)
22,237
With CRS tether strap
0.57
0.71
0.12
22,238
Without CRS tether strap
0.65
0.75
0.17
Head Injury Criterion (HIC)
Test no.
15-ms duration 36-ms duration
Maximum resultant chest acceleration5 (m/s2)
22,237
369 between
[69.5, 84.5] ms
570 between
[59.1, 94.0] ms
442 between
[53.3, 56.3] ms
22,238
287 between [74.2, 89.2] ms
562 between
[70.4, 106.4] ms
379 between
[52.0, 55.0] ms
1 End point of horizontal travel relative to the sled’s FMVSS 213-defined test bench pivot point. 2 Any part of the head. 3 Center of the knee target. 4 Horizontal motion relative to the CRS pre-test position on the test bench. 5 Three-millisecond (ms) clip value.
Table 1: Summary of select sled test quantitative performance
The wooden “cushion” and foam-filled back portions of the sled carriage test bench were both initially modeled as two rigid planes connected to inertial space. The (primarily) sliding contact that occurs between the bottom of the CRS and the cushion did not adversely affect the simulation to any significant degree. Rebound- induced impact between the CRS back surface and the front surface of the test bench back, however, did. Accordingly, the latter interaction was subsequently modeled as an inelastic contact. This representation in turn was replaced by an elastic contact interaction when actual foam material compliance data [6] were finally obtained.
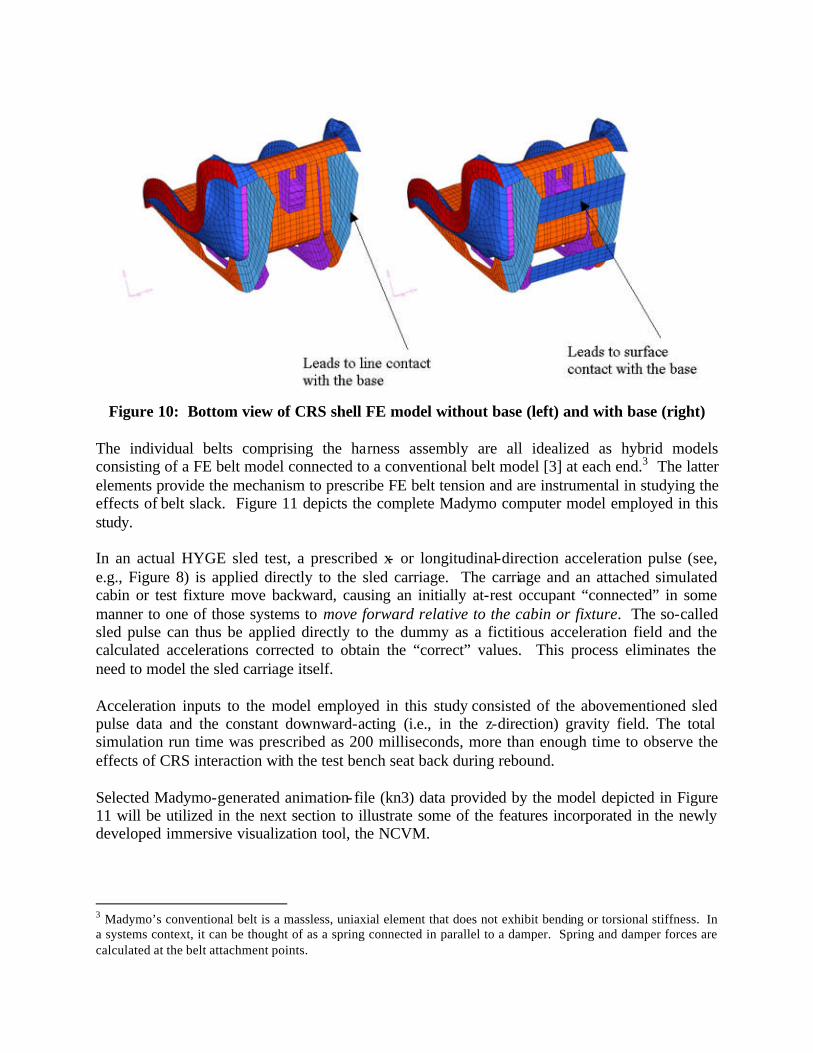
Figure 10: Bottom view of CRS shell FE model without base (left) and with base (right)
The individual belts comprising the harness assembly are all idealized as hybrid models consisting of a FE belt model connected to a conventional belt model [3] at each end.3 The latter elements provide the mechanism to prescribe FE belt tension and are instrumental in studying the effects of belt slack. Figure 11 depicts the complete Madymo computer model employed in this study. In an actual HYGE sled test, a prescribed x- or longitudinal-direction acceleration pulse (see, e.g., Figure 8) is applied directly to the sled carriage. The carriage and an attached simulated cabin or test fixture move backward, causing an initially at-rest occupant “connected” in some manner to one of those systems to move forward relative to the cabin or fixture. The so-called sled pulse can thus be applied directly to the dummy as a fictitious acceleration field and the calculated accelerations corrected to obtain the “correct” values. This process eliminates the need to model the sled carriage itself. Acceleration inputs to the model employed in this study consisted of the abovementioned sled pulse data and the constant downward-acting (i.e., in the z-direction) gravity field. The total simulation run time was prescribed as 200 milliseconds, more than enough time to observe the effects of CRS interaction with the test bench seat back during rebound. Selected Madymo-generated animation-file (kn3) data provided by the model depicted in Figure 11 will be utilized in the next section to illustrate some of the features incorporated in the newly developed immersive visualization tool, the NCVM.
3 Madymo’s conventional belt is a massless, uniaxial element that does not exhibit bending or torsional stiffness. In a systems context, it can be thought of as a spring connected in parallel to a damper. Spring and damper forces are calculated at the belt attachment points.
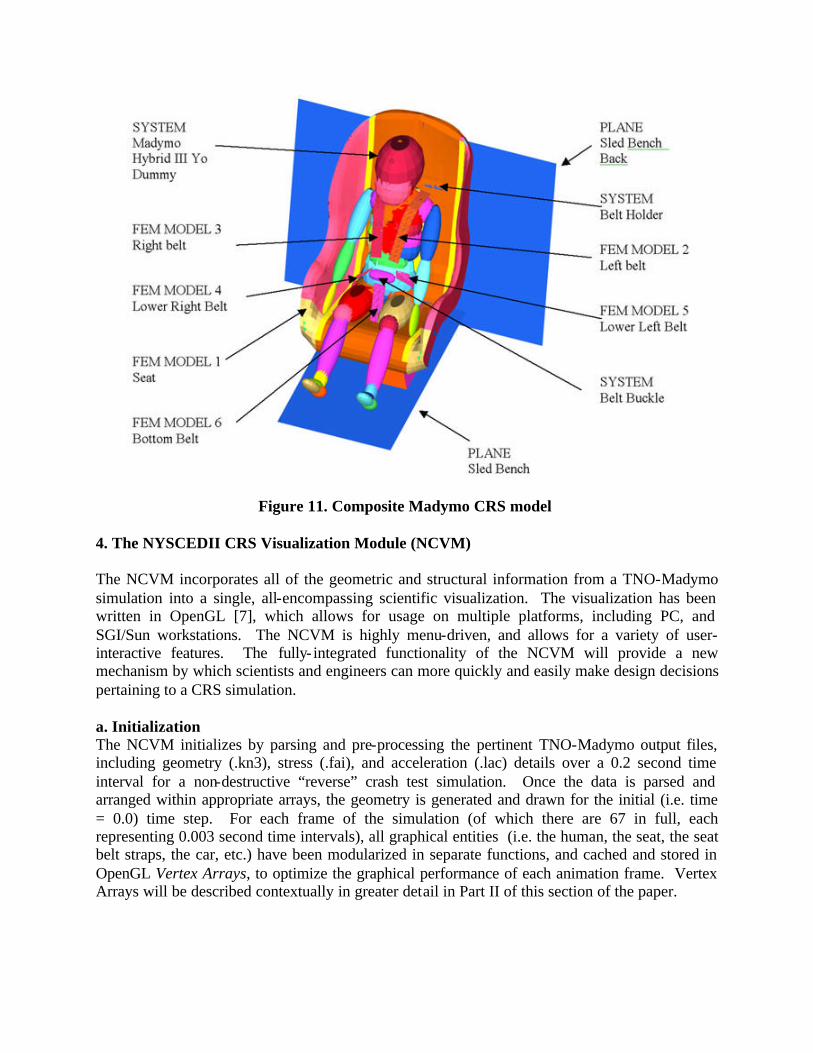
Figure 11. Composite Madymo CRS model
4. The NYSCEDII CRS Visualization Module (NCVM) The NCVM incorporates all of the geometric and structural information from a TNO-Madymo simulation into a single, all-encompassing scientific visualization. The visualization has been written in OpenGL [7], which allows for usage on multiple platforms, including PC, and SGI/Sun workstations. The NCVM is highly menu-driven, and allows for a variety of user-interactive features. The fully- integrated functionality of the NCVM will provide a new mechanism by which scientists and engineers can more quickly and easily make design decisions pertaining to a CRS simulation. a. Initialization The NCVM initializes by parsing and pre-processing the pertinent TNO-Madymo output files, including geometry (.kn3), stress (.fai), and acceleration (.lac) details over a 0.2 second time interval for a non-destructive “reverse” crash test simulation. Once the data is parsed and arranged within appropriate arrays, the geometry is generated and drawn for the initial (i.e. time = 0.0) time step. For each frame of the simulation (of which there are 67 in full, each representing 0.003 second time intervals), all graphical entities (i.e. the human, the seat, the seat belt straps, the car, etc.) have been modularized in separate functions, and cached and stored in OpenGL Vertex Arrays, to optimize the graphical performance of each animation frame. Vertex Arrays will be described contextually in greater detail in Part II of this section of the paper.
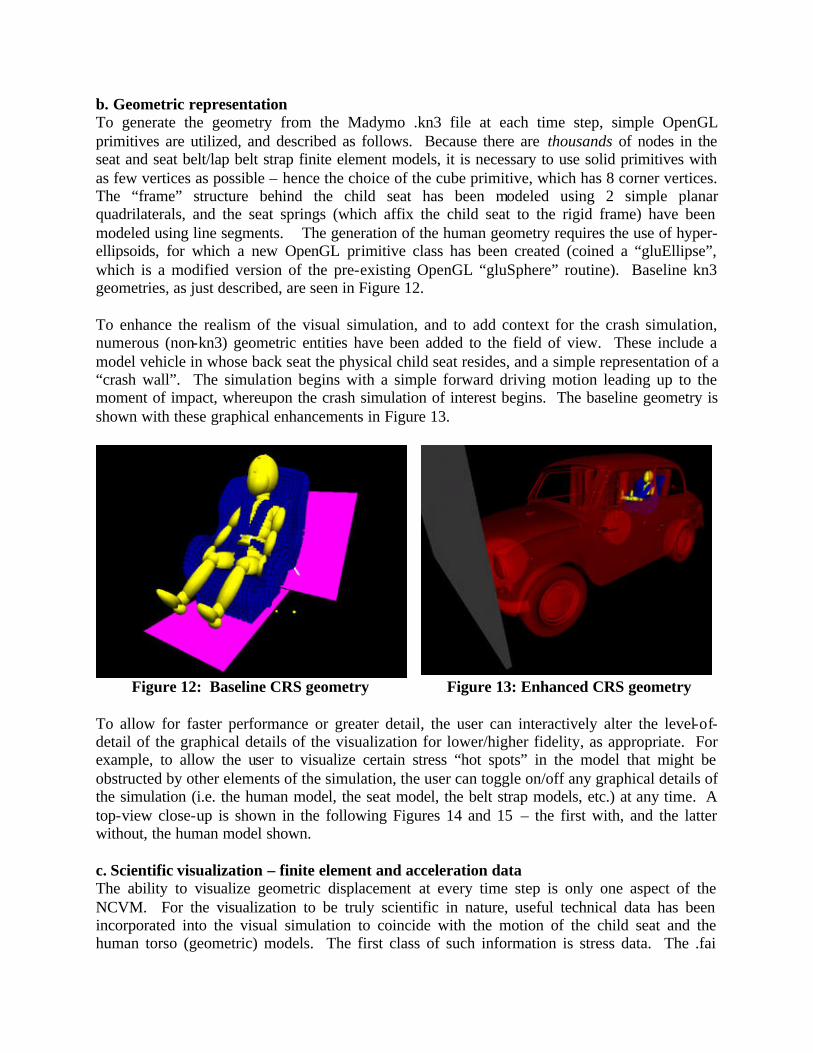
b. Geometric representation To generate the geometry from the Madymo .kn3 file at each time step, simple OpenGL primitives are utilized, and described as follows. Because there are thousands of nodes in the seat and seat belt/lap belt strap finite element models, it is necessary to use solid primitives with as few vertices as possible – hence the choice of the cube primitive, which has 8 corner vertices. The “frame” structure behind the child seat has been modeled using 2 simple planar quadrilaterals, and the seat springs (which affix the child seat to the rigid frame) have been modeled using line segments. The generation of the human geometry requires the use of hyper-ellipsoids, for which a new OpenGL primitive class has been created (coined a “gluEllipse”, which is a modified version of the pre-existing OpenGL “gluSphere” routine). Baseline kn3 geometries, as just described, are seen in Figure 12. To enhance the realism of the visual simulation, and to add context for the crash simulation, numerous (non-kn3) geometric entities have been added to the field of view. These include a model vehicle in whose back seat the physical child seat resides, and a simple representation of a “crash wall”. The simulation begins with a simple forward driving motion leading up to the moment of impact, whereupon the crash simulation of interest begins. The baseline geometry is shown with these graphical enhancements in Figure 13.
Figure 12: Baseline CRS geometry Figure 13: Enhanced CRS geometry
To allow for faster performance or greater detail, the user can interactively alter the level-of-detail of the graphical details of the visualization for lower/higher fidelity, as appropriate. For example, to allow the user to visualize certain stress “hot spots” in the model that might be obstructed by other elements of the simulation, the user can toggle on/off any graphical details of the simulation (i.e. the human model, the seat model, the belt strap models, etc.) at any time. A top-view close-up is shown in the following Figures 14 and 15 – the first with, and the latter without, the human model shown. c. Scientific visualization – finite element and acceleration data The ability to visualize geometric displacement at every time step is only one aspect of the NCVM. For the visualization to be truly scientific in nature, useful technical data has been incorporated into the visual simulation to coincide with the motion of the child seat and the human torso (geometric) models. The first class of such information is stress data. The .fai
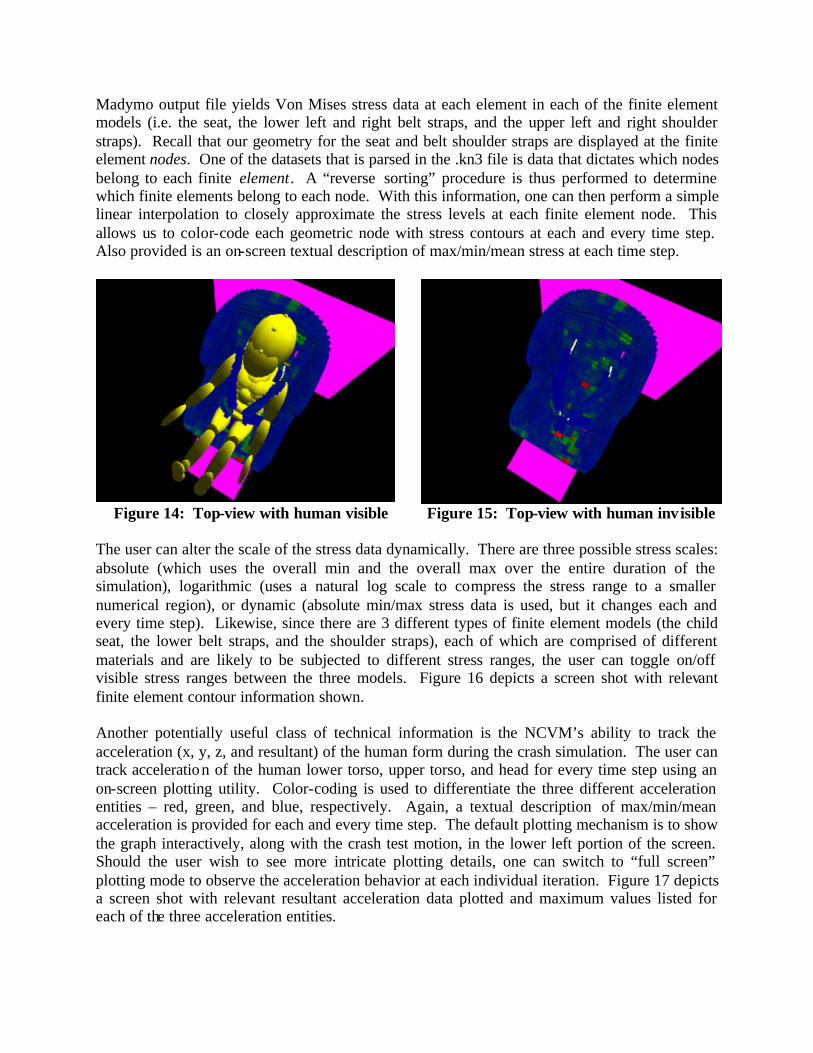
Madymo output file yields Von Mises stress data at each element in each of the finite element models (i.e. the seat, the lower left and right belt straps, and the upper left and right shoulder straps). Recall that our geometry for the seat and belt shoulder straps are displayed at the finite element nodes. One of the datasets that is parsed in the .kn3 file is data that dictates which nodes belong to each finite element. A “reverse sorting” procedure is thus performed to determine which finite elements belong to each node. With this information, one can then perform a simple linear interpolation to closely approximate the stress levels at each finite element node. This allows us to color-code each geometric node with stress contours at each and every time step. Also provided is an on-screen textual description of max/min/mean stress at each time step.
Figure 14: Top-view with human visible Figure 15: Top-view with human invisible
The user can alter the scale of the stress data dynamically. There are three possible stress scales: absolute (which uses the overall min and the overall max over the entire duration of the simulation), logarithmic (uses a natural log scale to compress the stress range to a smaller numerical region), or dynamic (absolute min/max stress data is used, but it changes each and every time step). Likewise, since there are 3 different types of finite element models (the child seat, the lower belt straps, and the shoulder straps), each of which are comprised of different materials and are likely to be subjected to different stress ranges, the user can toggle on/off visible stress ranges between the three models. Figure 16 depicts a screen shot with relevant finite element contour information shown. Another potentially useful class of technical information is the NCVM’s ability to track the acceleration (x, y, z, and resultant) of the human form during the crash simulation. The user can track acceleration of the human lower torso, upper torso, and head for every time step using an on-screen plotting utility. Color-coding is used to differentiate the three different acceleration entities – red, green, and blue, respectively. Again, a textual description of max/min/mean acceleration is provided for each and every time step. The default plotting mechanism is to show the graph interactively, along with the crash test motion, in the lower left portion of the screen. Should the user wish to see more intricate plotting details, one can switch to “full screen” plotting mode to observe the acceleration behavior at each individual iteration. Figure 17 depicts a screen shot with relevant resultant acceleration data plotted and maximum values listed for each of the three acceleration entities.
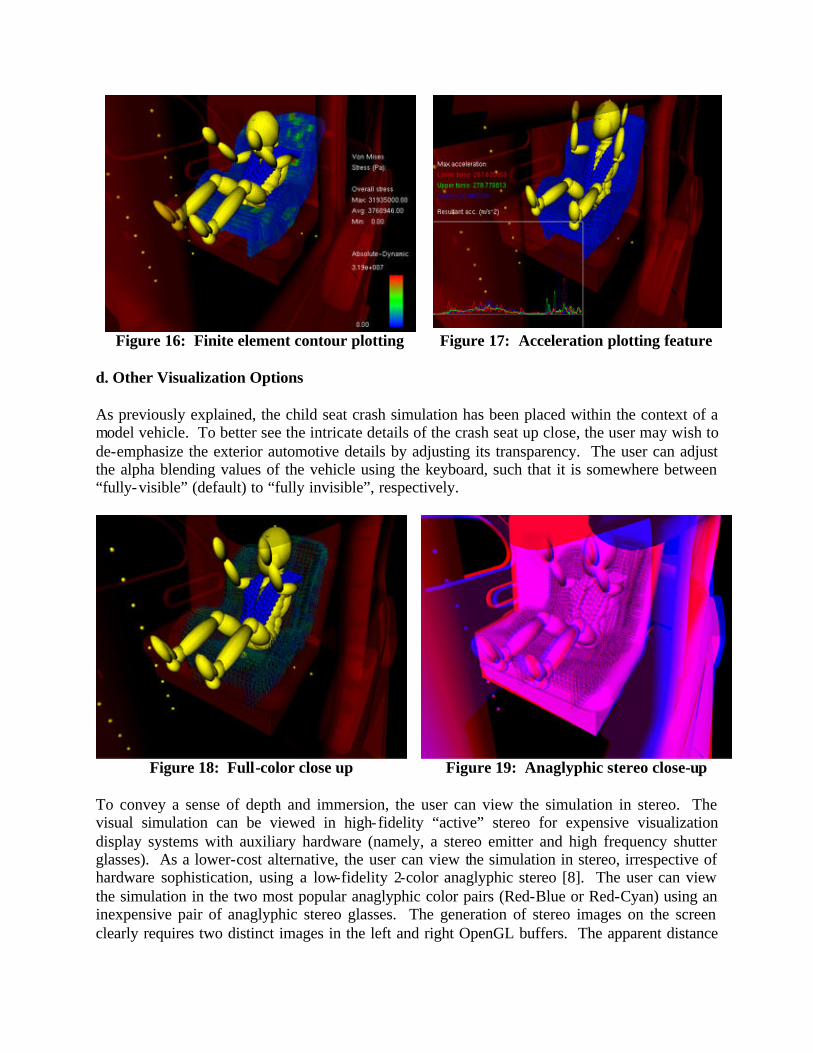
Figure 16: Finite element contour plotting Figure 17: Acceleration plotting feature
d. Other Visualization Options As previously explained, the child seat crash simulation has been placed within the context of a model vehicle. To better see the intricate details of the crash seat up close, the user may wish to de-emphasize the exterior automotive details by adjusting its transparency. The user can adjust the alpha blending values of the vehicle using the keyboard, such that it is somewhere between “fully-visible” (default) to “fully invisible”, respectively.
Figure 18: Full-color close up Figure 19: Anaglyphic stereo close-up
To convey a sense of depth and immersion, the user can view the simulation in stereo. The visual simulation can be viewed in high-fidelity “active” stereo for expensive visualization display systems with auxiliary hardware (namely, a stereo emitter and high frequency shutter glasses). As a lower-cost alternative, the user can view the simulation in stereo, irrespective of hardware sophistication, using a low-fidelity 2-color anaglyphic stereo [8]. The user can view the simulation in the two most popular anaglyphic color pairs (Red-Blue or Red-Cyan) using an inexpensive pair of anaglyphic stereo glasses. The generation of stereo images on the screen clearly requires two distinct images in the left and right OpenGL buffers. The apparent distance
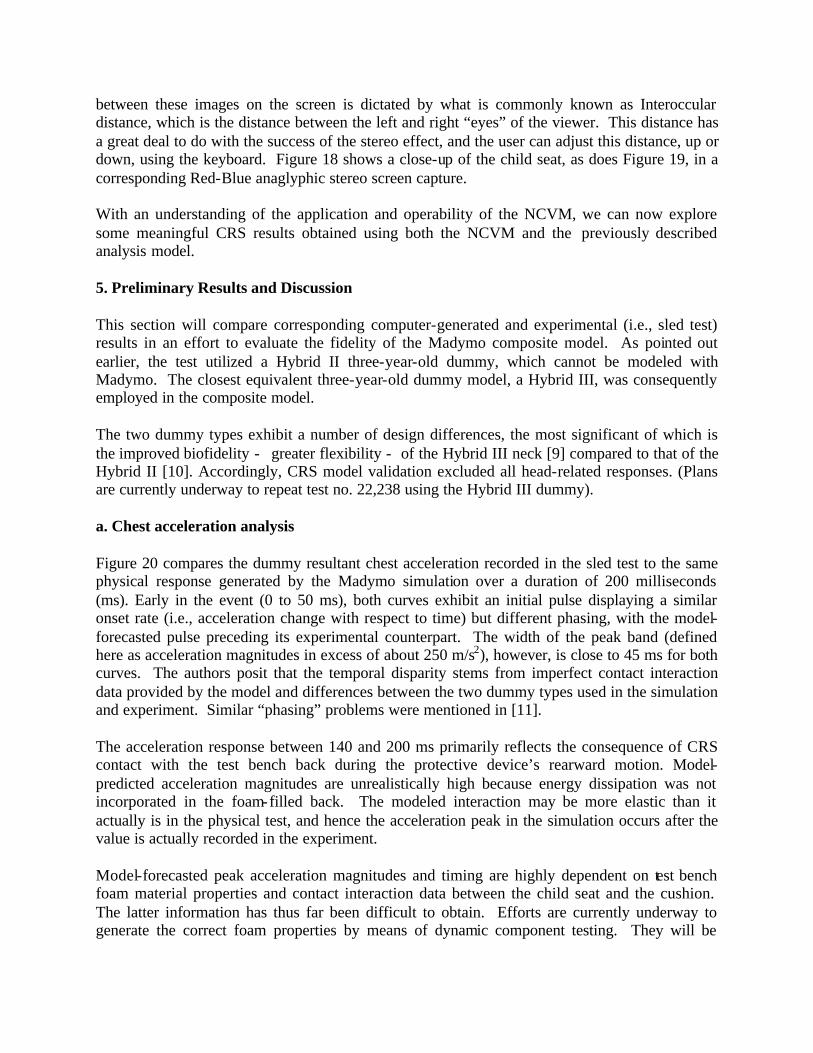
between these images on the screen is dictated by what is commonly known as Interoccular distance, which is the distance between the left and right “eyes” of the viewer. This distance has a great deal to do with the success of the stereo effect, and the user can adjust this distance, up or down, using the keyboard. Figure 18 shows a close-up of the child seat, as does Figure 19, in a corresponding Red-Blue anaglyphic stereo screen capture. With an understanding of the application and operability of the NCVM, we can now explore some meaningful CRS results obtained using both the NCVM and the previously described analysis model. 5. Preliminary Results and Discussion This section will compare corresponding computer-generated and experimental (i.e., sled test) results in an effort to evaluate the fidelity of the Madymo composite model. As pointed out earlier, the test utilized a Hybrid II three-year-old dummy, which cannot be modeled with Madymo. The closest equivalent three-year-old dummy model, a Hybrid III, was consequently employed in the composite model. The two dummy types exhibit a number of design differences, the most significant of which is the improved biofidelity - greater flexibility - of the Hybrid III neck [9] compared to that of the Hybrid II [10]. Accordingly, CRS model validation excluded all head-related responses. (Plans are currently underway to repeat test no. 22,238 using the Hybrid III dummy). a. Chest acceleration analysis Figure 20 compares the dummy resultant chest acceleration recorded in the sled test to the same physical response generated by the Madymo simulation over a duration of 200 milliseconds (ms). Early in the event (0 to 50 ms), both curves exhibit an initial pulse displaying a similar onset rate (i.e., acceleration change with respect to time) but different phasing, with the model-forecasted pulse preceding its experimental counterpart. The width of the peak band (defined here as acceleration magnitudes in excess of about 250 m/s2), however, is close to 45 ms for both curves. The authors posit that the temporal disparity stems from imperfect contact interaction data provided by the model and differences between the two dummy types used in the simulation and experiment. Similar “phasing” problems were mentioned in [11]. The acceleration response between 140 and 200 ms primarily reflects the consequence of CRS contact with the test bench back during the protective device’s rearward motion. Model-predicted acceleration magnitudes are unrealistically high because energy dissipation was not incorporated in the foam-filled back. The modeled interaction may be more elastic than it actually is in the physical test, and hence the acceleration peak in the simulation occurs after the value is actually recorded in the experiment. Model-forecasted peak acceleration magnitudes and timing are highly dependent on test bench foam material properties and contact interaction data between the child seat and the cushion. The latter information has thus far been difficult to obtain. Efforts are currently underway to generate the correct foam properties by means of dynamic component testing. They will be
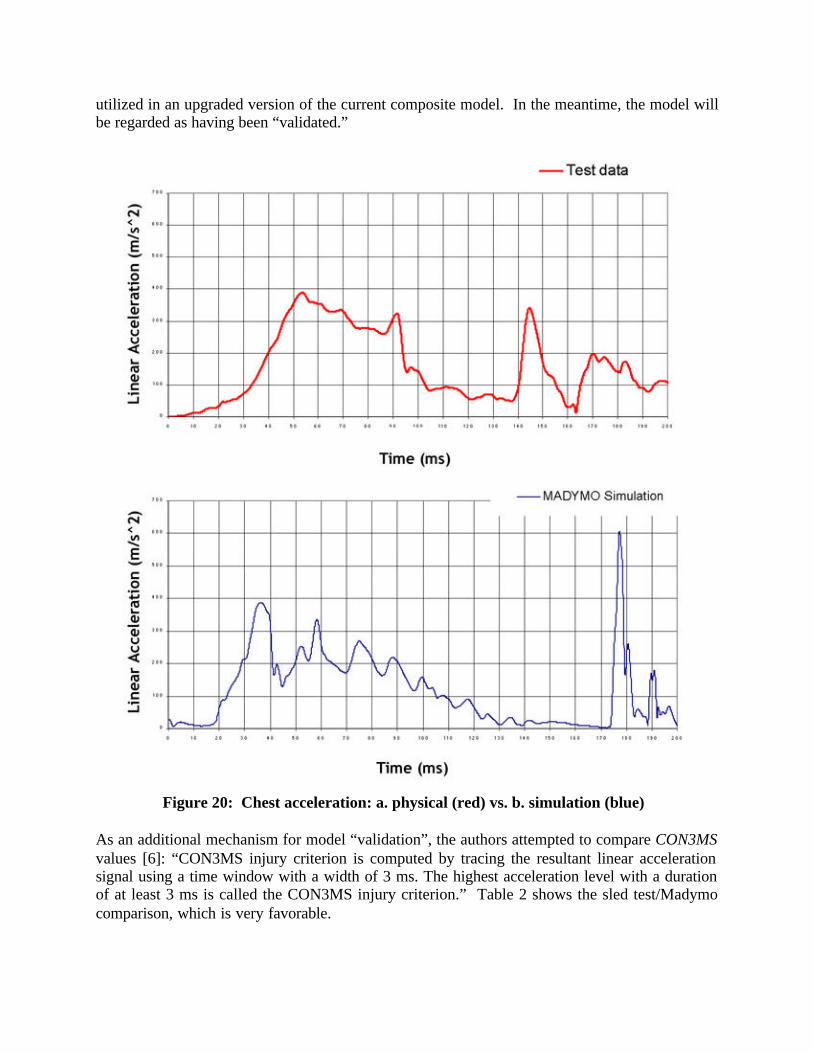
utilized in an upgraded version of the current composite model. In the meantime, the model will be regarded as having been “validated.”
Figure 20: Chest acceleration: a. physical (red) vs. b. simulation (blue)
As an additional mechanism for model “validation”, the authors attempted to compare CON3MS values [6]: “CON3MS injury criterion is computed by tracing the resultant linear acceleration signal using a time window with a width of 3 ms. The highest acceleration level with a duration of at least 3 ms is called the CON3MS injury criterion.” Table 2 shows the sled test/Madymo comparison, which is very favorable.
Case CON3MS (m/s2) Sled test experiment 379.16 Madymo Simulation 374.5
Table 2: CON3MS Comparison b. CRS misuse parametric study This section presents a brief “what if?” study using the Madymo CRS model to ascertain the effects of selected changes involving harness and/or latch belt tensioning on CRS performance. Table 3 lists the seven cases considered. Cases 1 and 2 provide, respectively, sled test and Madymo-predicted results for properly tensioned belts. Cases 3 and 4 examine the implications of two “incorrect” harness system tensioning levels while cases 5 and 6 do the same for similarly incorrect latch belt usage. The last scenario (case 7) looks at what happens when both the harness system and the latch belt are insufficiently tightened (the two levels considered were arbitrarily selected).
Table 3: Test case details
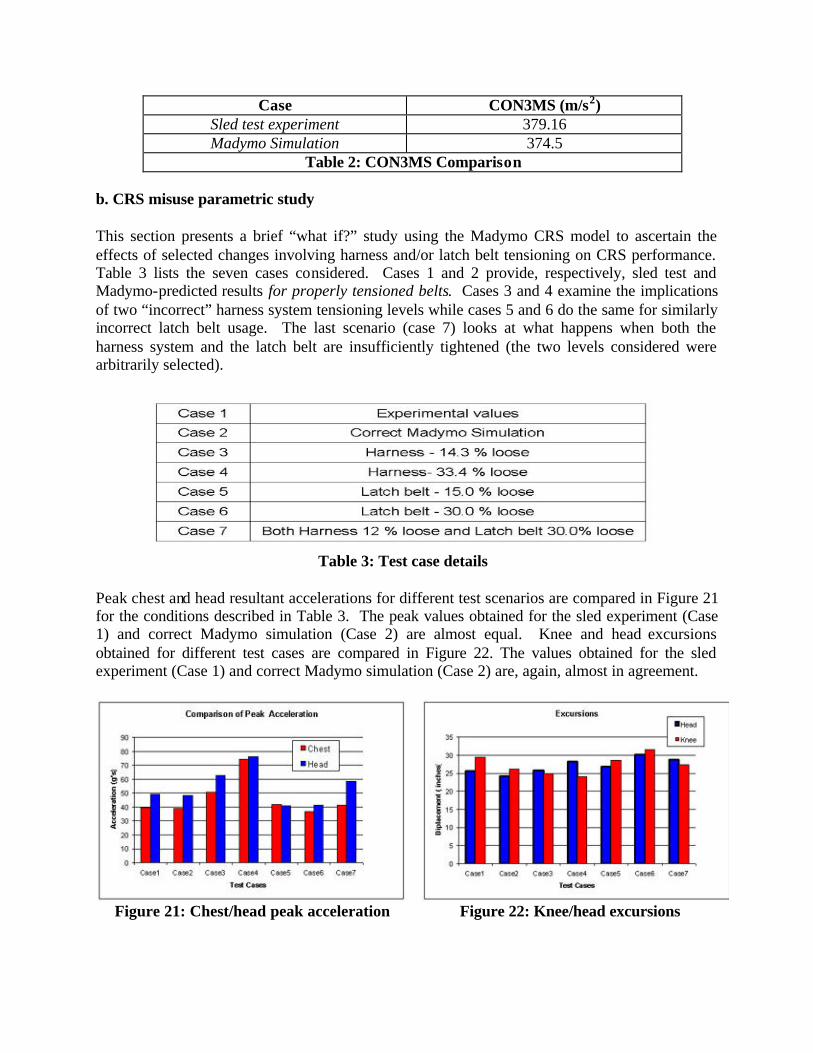
Peak chest and head resultant accelerations for different test scenarios are compared in Figure 21 for the conditions described in Table 3. The peak values obtained for the sled experiment (Case 1) and correct Madymo simulation (Case 2) are almost equal. Knee and head excursions obtained for different test cases are compared in Figure 22. The values obtained for the sled experiment (Case 1) and correct Madymo simulation (Case 2) are, again, almost in agreement.
Figure 21: Chest/head peak acceleration Figure 22: Knee/head excursions
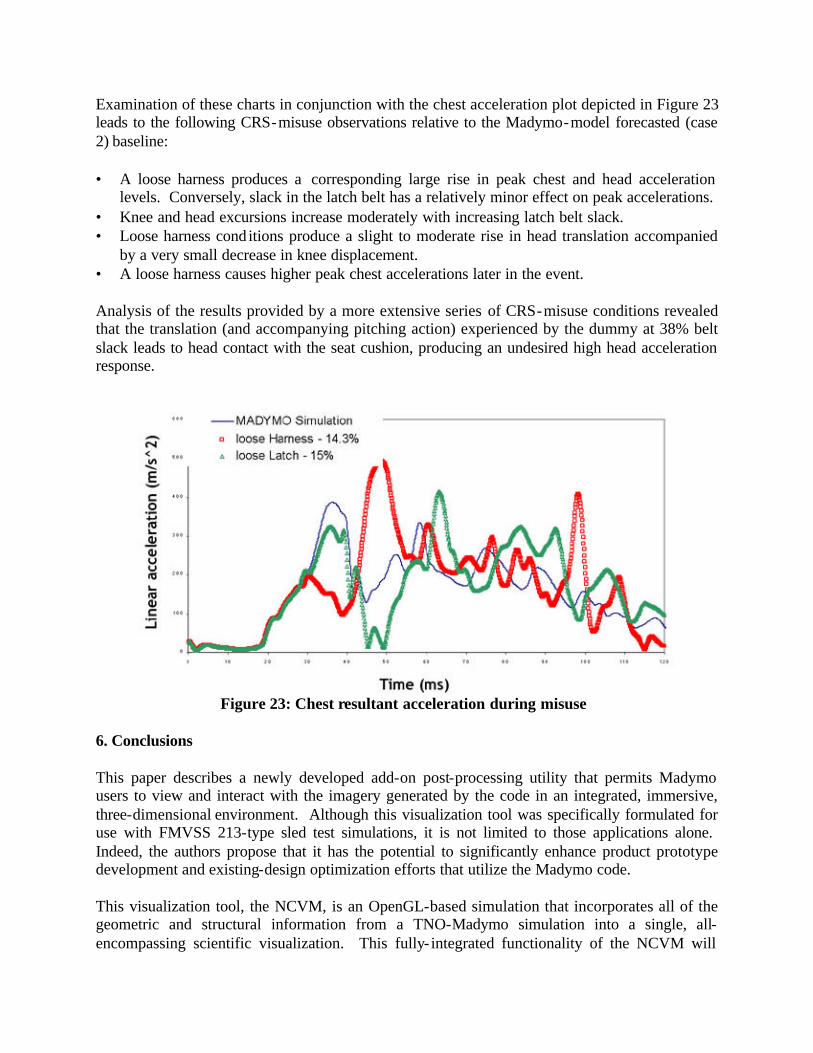
Examination of these charts in conjunction with the chest acceleration plot depicted in Figure 23 leads to the following CRS-misuse observations relative to the Madymo-model forecasted (case 2) baseline: • A loose harness produces a corresponding large rise in peak chest and head acceleration
levels. Conversely, slack in the latch belt has a relatively minor effect on peak accelerations. • Knee and head excursions increase moderately with increasing latch belt slack. • Loose harness cond itions produce a slight to moderate rise in head translation accompanied
by a very small decrease in knee displacement. • A loose harness causes higher peak chest accelerations later in the event. Analysis of the results provided by a more extensive series of CRS-misuse conditions revealed that the translation (and accompanying pitching action) experienced by the dummy at 38% belt slack leads to head contact with the seat cushion, producing an undesired high head acceleration response.
Figure 23: Chest resultant acceleration during misuse
6. Conclusions This paper describes a newly developed add-on post-processing utility that permits Madymo users to view and interact with the imagery generated by the code in an integrated, immersive, three-dimensional environment. Although this visualization tool was specifically formulated for use with FMVSS 213-type sled test simulations, it is not limited to those applications alone. Indeed, the authors propose that it has the potential to significantly enhance product prototype development and existing-design optimization efforts that utilize the Madymo code. This visualization tool, the NCVM, is an OpenGL-based simulation that incorporates all of the geometric and structural information from a TNO-Madymo simulation into a single, all-encompassing scientific visualization. This fully- integrated functionality of the NCVM will
provide a new mechanism by which scientists and engineers can more quickly and easily make design decisions pertaining to a CRS simulation. In addition to displaying the geometry of the crash simulation at each and every time step, the NCVM integrates various visual cues to convey other scientific information to the user in a dynamic fashion, most notably acceleration data and finite element stress contours. An anaglyphic stereoscopic viewing functionality provides the user with a stronger sense of depth and immersion, and gives the NCVM a “larger than life” feel, when studying the displaced geometry of a CRS simulation. Note that the Madymo model referred to throughout this paper is provisional and has not yet been properly validated. That situation notwithstanding, the current model displays “fair” correlation between those experimental and model-predicted physical parameters that can be (at least from an approximate standpoint) directly compared - specifically, maximum-allowable dummy chest and knee responses stipulated by FMVSS 213. A more robust model incorporating a number of planned changes will be exercised and the relevant part of its output compared with corresponding data obtained from replicate sled testing using the correct (Hybrid III) dummy. 7. Future Work The authors have numerous ideas for future improvements and enhancements, pertaining to both the analysis (simulation) and visualization aspects of this research. These are outlined briefly as follows: A. Analysis 1. Exercise current model with crash pulse from NCAP 35 mph flat frontal barrier crash test. Compare predicted CRS performance to that forecasted for FMVSS 213 test conditions. 2. Develop impact-condition material property inputs for the foam material used in the current FMVSS 213 test bench. Data to be generated via component-level testing (impactor device). 3. Perform additional perturbation studies with the small-mesh model to examine the effects of alternative vehicle (sled) CRS-securement seat belt anchorage locations, sled test bench geometry, sled test bench foam material compliance properties, and frontal crash sled pulses. 4. Incorporate large CRS shell FE mesh in the final model and repeat selected simulations to evaluate mesh-size effects on the fidelity of shell strain prediction and occupant kinematics and injury- indicating parameters. 5. Develop a Madymo model that simulates CRS performance in typical off-standard (e.g., angled frontal, rear, and side impact) crash configurations. B. Visualization At present, the NCVM serves largely as a post-processing utility. In other words, the Madymo simulation is presented a load case and a set of initial conditions, the analysis simulation executes, and the output files (.kn3, .lac, .fai, etc.) are subsequently generated. As mentioned previously, it is these output files that are then parsed and utilized in the NCVM. The authors envision a more sophisticated simulator wherein the analysis and visualization modules operate
in conjunction with one another; the NCVM producing visual imagery “on the fly” as the data is generated by the Madymo simulation each time step. This will allow the analysis to be performed on one computer in one location, while the visualization proceeds on another computer, in another location, nearly simultaneously. The authors have already begun to incorporate this functionality into the overall simulation scheme through the use of Parallel Virtual Machine (PVM) [12, 13]. PVM was chosen as it has proven reliable for message passing on the Windows environment, and also within cross-platform heterogeneous computing environments. This is desirable for the CRS-NCVM research effort as we may have some users on a Workstation (Unix) platform and others on PC (Windows) platforms. A “Master-Slave” model will be utilized; the Madymo simulation (Master) will perform the analysis, and rather than store the iterational data in one massive data file at the end of the simulation, the data will be delivered immediately, in near-real time, to the NCVM (Slave) for visualization. In this way, the NCVM will receive the current data each iteration, and process the most recent analysis/geometry data as it becomes ready. This eliminates the need for massive array storage requirements upfront, which will help to lessen run-time memory resources. Early experiments have shown that message passing latency (between Master/Slave) is on the order of 10-4, and is thus more than acceptable for maintaining a (visually desirable) 60 Hz frame display rate. Acknowledgements The authors will like to thank David P. Roberts, Facility Manager of Veridian Engineering’s HYGE Sled Facility. The authors would also like to acknowledge the funding support of the Calspan-UB Research Center (CUBRC) and the Center for Transportation Injury Research (CenTIR). Specifically, the authors also thank Alan Blatt of Veridian Engineering and John Lordi of the University at Buffalo for their valuable advice and guidance in this project. Finally, Dr. Hulme would like to acknowledge the partial funding support of the New York State Assembly for their financial support of NYSCEDII, the research organization for which the NCVM portion of the present research work was performed. References [1] Title 49 CFR: Part 571, Federal Motor Vehicle Safety Standard 213, “Child Restraint Systems.” [2] Department of Transportation Laboratory Test Procedure # TP-2 13-04, September 1, 1997. [3] “Madymo Manuals, Version 5.4, Revision 1.4”, (web link), TNO Automotive, July, 1999. www.Madymo.com. [4] Hybrid III 3 year old (revision 1.4 of d3hyb33y.dat), in TNO-Madymo, “Database Manual, Version 5.4.” Delft, The Netherlands, July, 1999.
[5] “Hypermesh v5.0 User’s Manual”, (web link), Altair Engineering. http://www.altair.com/software/hw_hm.htm. [6] Technical Report on dynamic crash test series conduc ted using modified FMVSS 213 test bench assembly, NAWCADPAX/TR2003. [7] Woo, M., Neider, J., Davis, T., and Shreiner, D., “OpenGL Programming Guide, Third Edition.” Addison-Wesley Publishing, Reading, MA, 2000. [8] Bourke, P., “Creating Anaglyphs Using OpenGL.” On-line web reference: http://astronomy.swin.edu.au/~pbourke/opengl/redblue/, August, 2000. [9] “Hybrid III 3 Year Old Child Dummy 210-0000,” First Technology Safety Systems, 2003. On-line reference: http://www.ftss.com [10] “VIP 3 Year Old Dummy SA103C002,” First Technology Safety Systems, 2003. On- line reference: http://www.ftss.com [11] Giovanni, F., Alexandre, M., “Comparison of child seat simulation as of ECE 44 with and without ISOFIX attachment.” TNO Automotive France. [12] Geist, G.A., Kohl, J.A., and Papadopoulos, P.M., “PVM and MPI: a Comparison of Features.” Calculateurs Paralleles Vol. 8 No. 2, June, 1996, pp. 137-150. [13] Geist, A., Beguelin, A., Dongerra, J., Weicheng, J., Mancheck, R., and Sunderam, V., “PVM: Parallel Virtual Machine - A User's Guide and Tutorial for Networked Parallel Computing.” The MIT Press, Cambridge, MA, 1994.


![STR-module for Avizo - cpfs.mpg.dekohout/Documents/Avizo-module.pdf · Chapter 1 Visualization with the STR module for Avizo DGrid [3] does not perform visualization of any kind of](https://img.pdfslide.us/doc/110x75/60c8f64acfaed612cd16dbe8/str-module-for-avizo-cpfsmpg-kohoutdocumentsavizo-modulepdf-chapter-1-visualization.jpg)