Embed Size (px)
Citation preview

7/31/2019 Development of a Testing Procedure Using Cone Index to Allow For
http://slidepdf.com/reader/full/development-of-a-testing-procedure-using-cone-index-to-allow-for 1/38
DEVELOPMENT OF A TESTING PROCEDURE USING CONE INDEX TO
ALLOW FOR OPTIMAL TIRE PERFORMANCE
By
Ryan Pehle
Agricultural Systems Management
BioResource and Agricultural Engineering Department
California Polytechnic State University
San Luis Obispo
2011
7/31/2019 Development of a Testing Procedure Using Cone Index to Allow For
http://slidepdf.com/reader/full/development-of-a-testing-procedure-using-cone-index-to-allow-for 2/38

7/31/2019 Development of a Testing Procedure Using Cone Index to Allow For
http://slidepdf.com/reader/full/development-of-a-testing-procedure-using-cone-index-to-allow-for 3/38
iii
ACKNOWLEDGEMENTS
First I would like to thank the Cal Poly Tractor Pull Team with providing me the
opportunity to work on a project that will help future students with the sport of tractorpull.
Next I would like to thank Mr. Virgil Threlkel for helping me with fabrication techniques
and machining tips for the project.
I would like to thank Dr. Shaun Kelly and Stephen Hirashima for their assistance with theelectrical components of the project.
Finally I would like to thank my senior project advisor Dr. Mark Zohns for advising myproject and being able to provide an insight to the sport of tractor pull.

7/31/2019 Development of a Testing Procedure Using Cone Index to Allow For
http://slidepdf.com/reader/full/development-of-a-testing-procedure-using-cone-index-to-allow-for 4/38
iv
ABSTRACT
This project discusses the design, fabrication, and evaluation of a Soil Cone Penetrometer
that is to be used to test tracks designated for modified tractor pulling. The penetrometer
measures the force required to penetrate a soil and provides a recommended tire pressurespecific for the conditions present at the point in time.

7/31/2019 Development of a Testing Procedure Using Cone Index to Allow For
http://slidepdf.com/reader/full/development-of-a-testing-procedure-using-cone-index-to-allow-for 5/38
v
DISCLAIMER STATEMENT
The university makes it clear that the information forwarded herewith is a project
resulting from a class assignment and has been graded and accepted only as a fulfillment
of a course requirement. Acceptance by the university does not imply technical accuracyor reliability. Any use of the information in this report is made by the user(s) at his/her
own risk, which may include catastrophic failure of the device or infringement of patentor copyright laws.
Therefore, the recipient and/or user of the information contained in this report agrees to
indemnify, defend and save harmless the State its officers, agents and employees fromany and all claims and losses accruing or resulting to any person, firm, or corporation
who may be injured or damaged as a result of the use of this report.

7/31/2019 Development of a Testing Procedure Using Cone Index to Allow For
http://slidepdf.com/reader/full/development-of-a-testing-procedure-using-cone-index-to-allow-for 6/38
vi
TABLE OF CONTENTS
Page
SIGNATURE PAGE..…………………………………………………………………….ii
ACKNOWLDGEMENTS..………………………………………………………………iii
ABSTRACT…..……..…………………………………………………………………...ivDISCLAIMER STATEMENT..…………………………………………………………..v
LIST OF FIGURES..…………………………………………………...…....…………..viiLIST OF TABLES……………………………………………………………………...viii
INTRODUCTION…..…………………………………………………………………….1
LITERATURE REVIEW…..……………………………………………………………..2
PROCEDURE AND METHODS…………………………………………………………4RESULTS………………………………………………………………………….…….15
DISCUSSION……………………………………………………………………………17
RECOMMENDATIONS ………………………………………………………………..18REFERENCES ………………………………………………………………………….20
APPENDICESAppendix A: How Project Meets Requirements for the ASM Major…...…….…21Appendix B: Individual Part Drawings………………………………………….24

7/31/2019 Development of a Testing Procedure Using Cone Index to Allow For
http://slidepdf.com/reader/full/development-of-a-testing-procedure-using-cone-index-to-allow-for 7/38
vii
LIST OF FIGURES
Page
1. Graph of Cone Index Compared to depth.………………………………………2
2. Standard Penetrometer………………….……………………………………….3
3.
Final Design of Soil Cone Penetrometer.………………………………………..44. Load Cell………………………………………………………………………...5
5. Housing Unit with Load Cell…………………………………………………….56. Housing Cap Design……………………………………………………………..6
7. Housing Cap with Bushing……………………………………………………....6
8. Display Unit……………………………………………………………………..7
9. Taper Cut for the Cone.………………………………………………………….810. Increments being made on lathe…………………………………………………8
11. Milling the Keyway……………………………………………………………...9
12. Boring Bar Creating ID of Housing Unit………………………………………..913. Drilling Set Screw Holes………………………………………………………..10
14. Tapping holes for Set Screws…………………………………………………...1015. Facing the Cap…………………………………………………………………..11
16. Finished End of Handle………………………………………………………....12
17. Wiring of Circuit………………………………………………………………..13
18. Dimensions of Track with Test Points………………………………………….1419. Completed Penetrometer………………………………………………………..15
20. Mock graph of the test results…………………………………………………..19
21. Penetrating Unit Design………………………………………………………...25
22. Housing Unit Design…………………………………………………………....2623. Housing Cap Design…………………………………………………………….27
24. Bushing Design…………………………………………………………………28
25. Handle Stem Design…………………………………………………………….2926. Handle Design…………………………………………………………………..30

7/31/2019 Development of a Testing Procedure Using Cone Index to Allow For
http://slidepdf.com/reader/full/development-of-a-testing-procedure-using-cone-index-to-allow-for 8/38
viii
LIST OF TABLES
Page
1. Initial Lab Tests……………………………………………….…………………..16
2. Mock Data Acquisition…………………………………………………………...18

7/31/2019 Development of a Testing Procedure Using Cone Index to Allow For
http://slidepdf.com/reader/full/development-of-a-testing-procedure-using-cone-index-to-allow-for 9/38
1
INTRODUCTION
Background
The sport of tractor pulling in America began in the early part of the 20
st
century in theEastern part of the United States in Bowling Green, Kentucky. Throughout the years
competitors have tried to modify their vehicles to outperform their competition. One of the easiest modifications a tractor puller can do is adjust the tire pressure depending on
track conditions. Small adjustments could mean better traction resulting in better
performance. Decisions on what tire pressure to use are determined by which soil type
the track consists of.
Justification
Because of the common variability of the track conditions, predicting the cone index of a
soil is not easily done, however, there are tools that can assist with this process. Thesetools are called soil penetrometers. Penetrometers typically measure the force required topenetrate the soil and how far the penetration goes into the soil. Standard units usually
measure soil hardness from the surface to the root zone of the plants which can
commonly range anywhere from six inches to three feet. These units are usually veryexpensive and only used for scientific purposes. A smaller penetrometer could be
developed to be used by the Cal Poly Tractor Pull Team to assist with determining soil
hardness for considering tire pressures. The penetrometer would only be required to
penetrate the top portion of the track since the tractor tires only interface with the top soillayers. The device would be simple enough for any member to use. The information
would then be recorded in the log book and used for record keeping.
Objectives
The main objectives of this project include:
1. Create a Soil Cone Index penetrometer that meets ASABE standards for a design
2. The device will be used to test any track that the pull team competes on3. The device should be easy enough to operate so only one person is required to
collect data
4. A testing procedure will be developed and incorporated into the log book
The completion of this project will benefit the Tractor Pull Team allowing any member
with any amount of experience to make critical decisions that directly influence
performance of the tractor. The data will be able to assist the team with future recordsand data collection.

7/31/2019 Development of a Testing Procedure Using Cone Index to Allow For
http://slidepdf.com/reader/full/development-of-a-testing-procedure-using-cone-index-to-allow-for 10/38
Determining tire pressure
change in tire pressure co
performance. This is whassist pullers with the det
each track will be vastly
have a penetrometer that
Cone Index and Soil Pr
Cone index (CI), is a me
many factors including s
measure of the force per
index provides some indi
upon the strength propertdirectly when being relat
the soil from tires also ef
soil is used, the greater it
2009). The greater comp
project will develop a pr
particular soil regardless
simple formula using con
By using this informatio
cone index pressure in re
types will allow one to d
hardness.
Figure 1: Gr
LITERATURE REVIEW
has always been a focal point for tractor pullin
uld have a great effect on the outcome of the tr
a soil cone penetrometer tool should be develermination of their tire pressures. Because soil
ifferent from one another (Argabright, 2009), i
will be able to be used at any location.
perties
sure of the penetration resistance of a soil. It is
il density, moisture content, and soil type. The
ase area required to penetrate this cone into th
cation of the shear resistance of the soil which i
ies of the soil (Ayers and Perumpral 1982). Cod to bulk density and depth (Kumar et al, 2006
ects bulk density therefore effecting cone inde
is compacted which in turn creates a higher de
ction creates less traction (Hayes and Ligen, 1
cedure that will be able to determine the cone i
of its properties. The easiest way to determine t
e base area and force applied.
one can develop a graph similar to Figure 1, w
lation to the depth penetrated. A graph containi
termine the proper tire pressure to use in relati
ph of CI compared to Depth (Balad and Rohan
2
g. The slightest
ctor’s
ped in order toroperties for
t is important to
affected by
cone index is a
soil. The cone
n turn depends
e index varies). Compaction of
. The more a
sity (Hughes,
81). This
dex for a
e CI is to use a
hich shows the
g multiple soil
n to soil
, 1981)
7/31/2019 Development of a Testing Procedure Using Cone Index to Allow For
http://slidepdf.com/reader/full/development-of-a-testing-procedure-using-cone-index-to-allow-for 11/38
3
Penetrometers
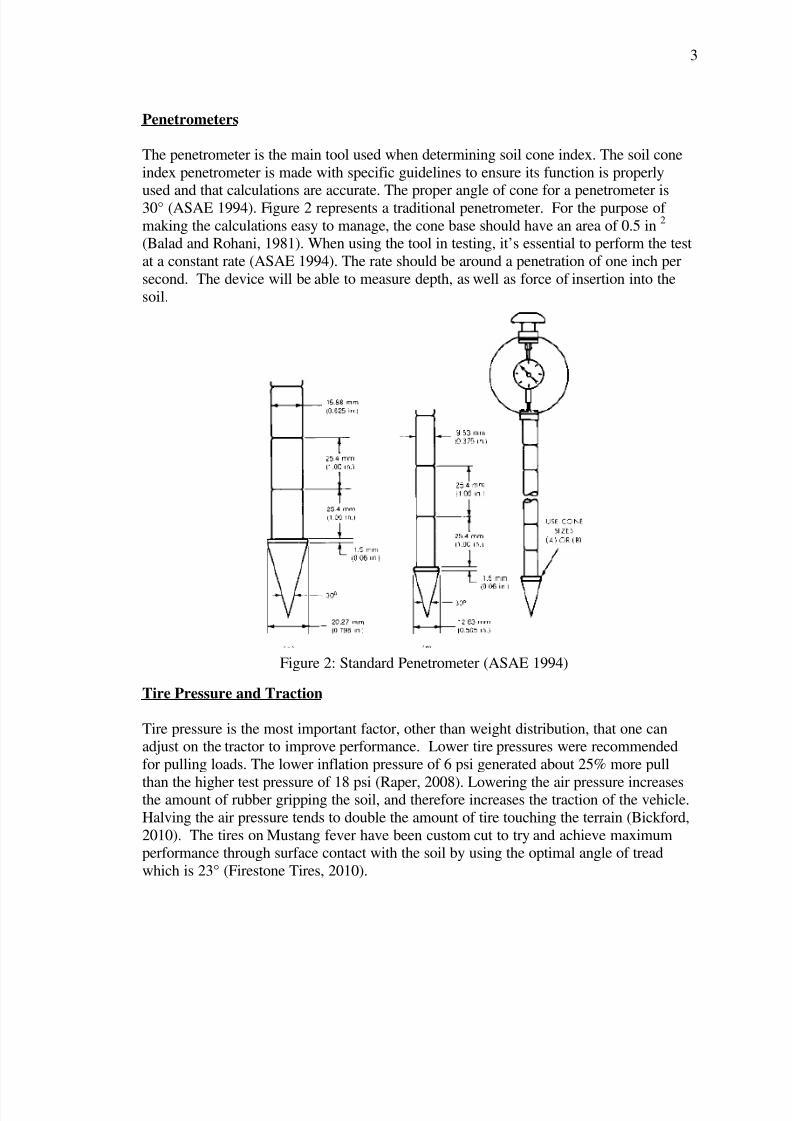
The penetrometer is the main tool used when determining soil cone index. The soil cone
index penetrometer is made with specific guidelines to ensure its function is properly
used and that calculations are accurate. The proper angle of cone for a penetrometer is30° (ASAE 1994). Figure 2 represents a traditional penetrometer. For the purpose of
making the calculations easy to manage, the cone base should have an area of 0.5 in2
(Balad and Rohani, 1981). When using the tool in testing, it’s essential to perform the test
at a constant rate (ASAE 1994). The rate should be around a penetration of one inch per
second. The device will be able to measure depth, as well as force of insertion into the
soil.
Tire Pressure and Traction
Tire pressure is the most important factor, other than weight distribution, that one canadjust on the tractor to improve performance. Lower tire pressures were recommended
for pulling loads. The lower inflation pressure of 6 psi generated about 25% more pull
than the higher test pressure of 18 psi (Raper, 2008). Lowering the air pressure increasesthe amount of rubber gripping the soil, and therefore increases the traction of the vehicle.
Halving the air pressure tends to double the amount of tire touching the terrain (Bickford,
2010). The tires on Mustang fever have been custom cut to try and achieve maximumperformance through surface contact with the soil by using the optimal angle of tread
which is 23° (Firestone Tires, 2010).
Figure 2: Standard Penetrometer (ASAE 1994)

7/31/2019 Development of a Testing Procedure Using Cone Index to Allow For
http://slidepdf.com/reader/full/development-of-a-testing-procedure-using-cone-index-to-allow-for 12/38
4
PROCEDURE AND METHODS
Design Procedure
The main design standard for this senior project was to follow the design requirements asstated by ASAE for Soil Cone Penetrometers. This meant having a 30⁰ cone to penetrate
the soil with a base area of 0.50 square inches. All other aspects of the design were
designed around the main components of the penetrometer. The completed design isshown in Figure 3 below.
Figure 3: Final Design of the Soil Cone Penetrometer showing thedisplay mounted
Penetrating Unit. The penetrating unit for the penetrometer was the main component in
which all other parts were built around. The unit needed to have the 30° cone. NormalSoil Cone Penetrometers are built to be able to penetrate up to three feet of soil. Because
the penetrometer was going to be used on tracks, it only needed to be able to penetrate a
max depth of eight inches. To allow for students using the device to know how far theyhad penetrated, one inch increments were placed on the unit. A keyway was made to
allow for a depth stop to be set for testing so that the user knows how far they have
penetrated during the test.
Load Cell. The load cell for the unit needed to be able to handle the wide range of forces
that would be experienced while using the device on a wide variety of tracks. It was
decided that a load cell with capabilities of measuring a maximum force of 250 poundswould suffice for the maximum force needed to measure Soil Cone Index. The reasoning
for this decision was that an average person would not be able to produce forces greater

7/31/2019 Development of a Testing Procedure Using Cone Index to Allow For
http://slidepdf.com/reader/full/development-of-a-testing-procedure-using-cone-index-to-allow-for 13/38
5
than 250 pounds. This meant the range of the load cell would not need to measure
beyond 250 pounds. Any force exceeding the range of the load cell would require thatthe tire pressure be set at the maximum pressure recommended. The load cell can be seen
in Figure 4.
Figure 4: The load cell. The photo on the left is an isometric view. The photo on the
right shows the mount screw holes on the bottom of the cell.
Housing for the Load Cell. The housing unit could not be designed until the load cell
was decided upon. The housing would hold the load cell in place and keep it from
moving around during testing. It would also protect the load cell from getting damagedduring transit or handling. The load cell came with a set of mounting screws that would
hold the load cell securely in position. The housing had to allow for the mounting screwsto access the bottom of the load cell so it could be mounted in place (Figure 5).
Figure 5: The figure shows the sectional view of the housingunit with the load cell in place.
Housing Unit Cap. The cap needed to fit within the top portion of the housing and stay
secure. The idea was to make a cap that fit into the top of the load cell housing and stay

7/31/2019 Development of a Testing Procedure Using Cone Index to Allow For
http://slidepdf.com/reader/full/development-of-a-testing-procedure-using-cone-index-to-allow-for 14/38
6
in place with set screws. A hole was to be made in the center of the cap to allow for the
handle unit to fit through to be able to interact with the load cell (Figure 6).
Figure 6: The cap as designed in SolidWorks
Handle Unit. When designing the handle unit, the actual handle needed to be wide
enough that someone could use two hands while operating the penetrometer. The stem of the handle had to be large enough to handle the loads that would be experienced during
operation with minimal deflection.
Bushing for Handle. A bushing needed to be made to ensure that the handle did not
move around while testing. The bushing would keep the handle stem perpendicular to the
load cell to make sure the forces were directly applied in a perfectly vertical manner as
seen in Figure 7.
Figure 7: The cap with the bushing in place
Display Unit. A digital display was chosen to read out the outputs of the load cell. Thedigital display was chosen over a mechanical display because the digital display would

7/31/2019 Development of a Testing Procedure Using Cone Index to Allow For
http://slidepdf.com/reader/full/development-of-a-testing-procedure-using-cone-index-to-allow-for 15/38
7
read out exact values large enough for someone to see clearly while testing. The display
is shown in Figure 8. Another major factor when deciding on the type of display was thatthe one chosen only required 9 volts of power to function. The Cub4V display was
chosen to use because it was inexpensive and met the suggested requirements.
Figure 8: Red Lion Cub4V display unit.
Construction Procedure
The construction portion of the project took multiple steps. Each piece was constructed
separately then put together at the end of the fabrication. The machine most utilized in the
machining process was the lathe.
Penetrating Unit. The material used for the penetrating unit was 1 inch hot rolled round
stock. A piece of 12 inches was cut to length by the band saw. The material was then
faced in the lathe and center drilled to be able to machine a length of 9 inches andminimize wobble. The material was turned down from a diameter of 1 inch to 0.798
inches over the 9 inches. The material was faced again to remove the centering hole.
The next part of the process was to begin the tapering cut for the cone. The cross feedcompound was rotated to the 75º mark to produce a 30º cone (Figure 9). The cut
produced a length of 1.49 inches for the cone.

7/31/2019 Development of a Testing Procedure Using Cone Index to Allow For
http://slidepdf.com/reader/full/development-of-a-testing-procedure-using-cone-index-to-allow-for 16/38
8
The piece was then filed with a fine file to smooth out any rough spots on the material
from the lathe work. Sandpaper was then used to produce a clean shine. 1 inchincrements were cut into the part using a parting tool. The first mark was placed 2 inches
from the end of the cone. The remaining increments were then made off of the 2 inch
mark as shown in Figure 10.
Once the increments were made the penetrating unit cut to the proper length of 8 inches.Next it was placed in the mill to have a keyway milled into it. After the mill was
trammed the unit was placed on parallels to ensure that the unit was machined squarely.Using the Acu-Rite, the center was found on the piece. The keyway was then cut using a¼ inch end mill 1/8 inch deep as seen in Figure 11.
Figure 9: Taper cut being made for the cone of the penetrometer.
Figure 10: Increments being made using the parting tool.
7/31/2019 Development of a Testing Procedure Using Cone Index to Allow For
http://slidepdf.com/reader/full/development-of-a-testing-procedure-using-cone-index-to-allow-for 17/38
9
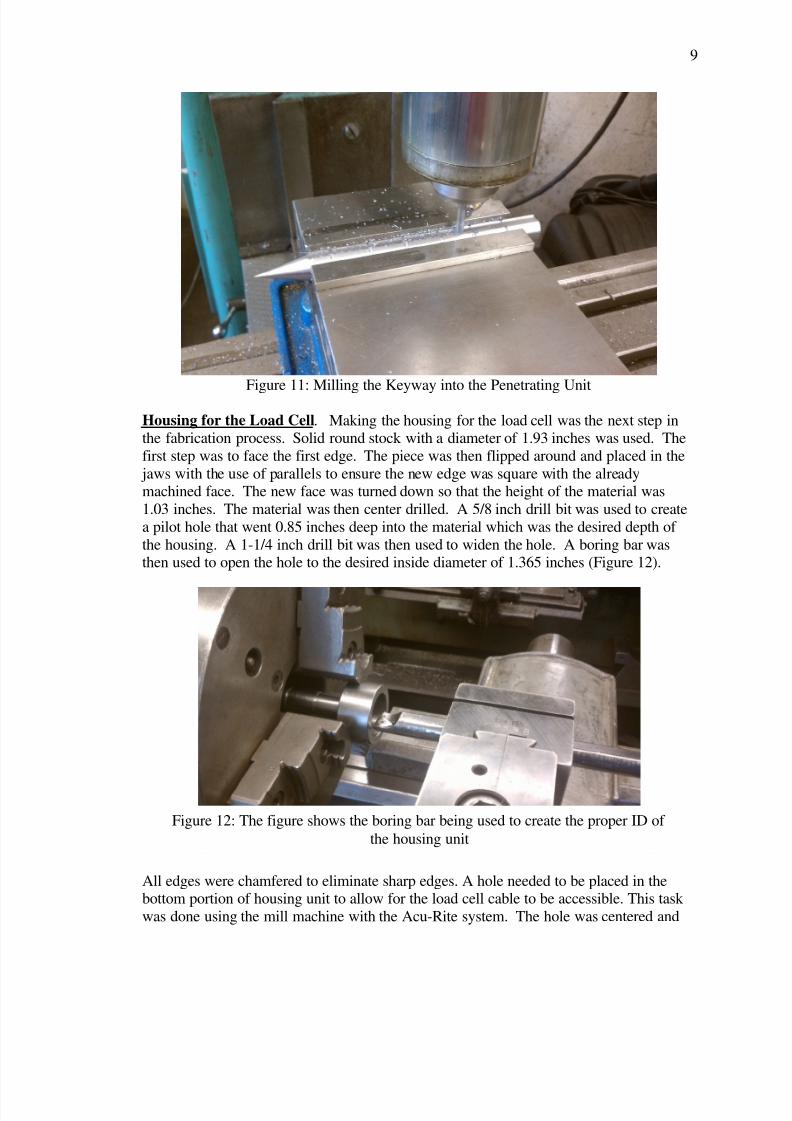
Figure 11: Milling the Keyway into the Penetrating Unit
Housing for the Load Cell. Making the housing for the load cell was the next step inthe fabrication process. Solid round stock with a diameter of 1.93 inches was used. The
first step was to face the first edge. The piece was then flipped around and placed in the
jaws with the use of parallels to ensure the new edge was square with the alreadymachined face. The new face was turned down so that the height of the material was
1.03 inches. The material was then center drilled. A 5/8 inch drill bit was used to create
a pilot hole that went 0.85 inches deep into the material which was the desired depth of
the housing. A 1-1/4 inch drill bit was then used to widen the hole. A boring bar wasthen used to open the hole to the desired inside diameter of 1.365 inches (Figure 12).
All edges were chamfered to eliminate sharp edges. A hole needed to be placed in thebottom portion of housing unit to allow for the load cell cable to be accessible. This task
was done using the mill machine with the Acu-Rite system. The hole was centered and
Figure 12: The figure shows the boring bar being used to create the proper ID of
the housing unit

7/31/2019 Development of a Testing Procedure Using Cone Index to Allow For
http://slidepdf.com/reader/full/development-of-a-testing-procedure-using-cone-index-to-allow-for 18/38
10
drilled ¼ inch from the bottom of the bottom of the housing unit. While still in the mill
two holes were drilled into the top portion of the unit to allow for set screws that wouldhold the cap in place. The holes were drilled out using a #29 drill bit (Figure 13). A
single motion on the mill was used to drill both holes. After the holes were drilled, an 8-
32 tap was used to thread the holes for the 8-32 x 1/8 inch set screws (Figure 14). The
next step for the housing unit was to make mounting holes to allow the load cellmounting screws to secure the load cell. The holes were located ½ inch off of center, 1
inch apart. The initial holes were drilled out using a #29 drill bit. The holes were thenrecessed using a 1/8 inch end mill so the mounting screws sat flush with the bottom of the
housing unit.
Figure 13: Drilling the Set Screw holes
Figure 14: Tapping the holes for the set screws

7/31/2019 Development of a Testing Procedure Using Cone Index to Allow For
http://slidepdf.com/reader/full/development-of-a-testing-procedure-using-cone-index-to-allow-for 19/38
11
Cap for Housing Unit. A 0.65 inch thick piece of 1.93 inch solid round stock was cut
out on the band saw to make the cap. The first edge was faced and chamfered on thelathe. The cap was then turned around in the jaws and placed using the parallels to
ensure squareness to the machined face. Half of the material was turned down to the
desired diameter of 1.30 inches to ensure that it would fit inside the top portion of the
housing unit. The turned down edge was then faced to width of 0.22 inches to allow foropen space between the bottom of the cap and the top of the load cell (Figure 15). A 5/8
inch hole was then drilled through the center of the cap to allow for a bronze bushing.
Figure 15: Facing the cap to fit into the housing unit
Bushing. Using ¾ inch bronze round stock, a bushing was manufactured for the handleunit by the processes of turning, facing, and parting. The bushing was turned down to 5/8
inches to fit snuggly into the hole drilled through the center of the cap. A 0.495 inch hole
was drilled through the bushing to fit the 0.494 inch handle stem. The bushing waspressed into the cap with an interference fit. The hole was then reamed to allow some
clearance of the handle stem for a perfect fit.
Handle Stem. The handle stem was created from a ½ inch grade 2 bolt that was 6 incheslong. The head of the bolt was cut off in the band saw. Next the threaded portion of the
bolt was cut off to create a piece that was 4.50 inches in length. The stem was placed
into the lathe and faced on one edge. A depression bump was created on the end of thestem using free hand lathing. This bump would help create maximum depression on the
load cell. A snap ring groove was creating using the grooving tool. The cut was made
0.10 inches from the end of stem on the side with the bump. Once there, an external snapring was placed.
7/31/2019 Development of a Testing Procedure Using Cone Index to Allow For
http://slidepdf.com/reader/full/development-of-a-testing-procedure-using-cone-index-to-allow-for 20/38
12
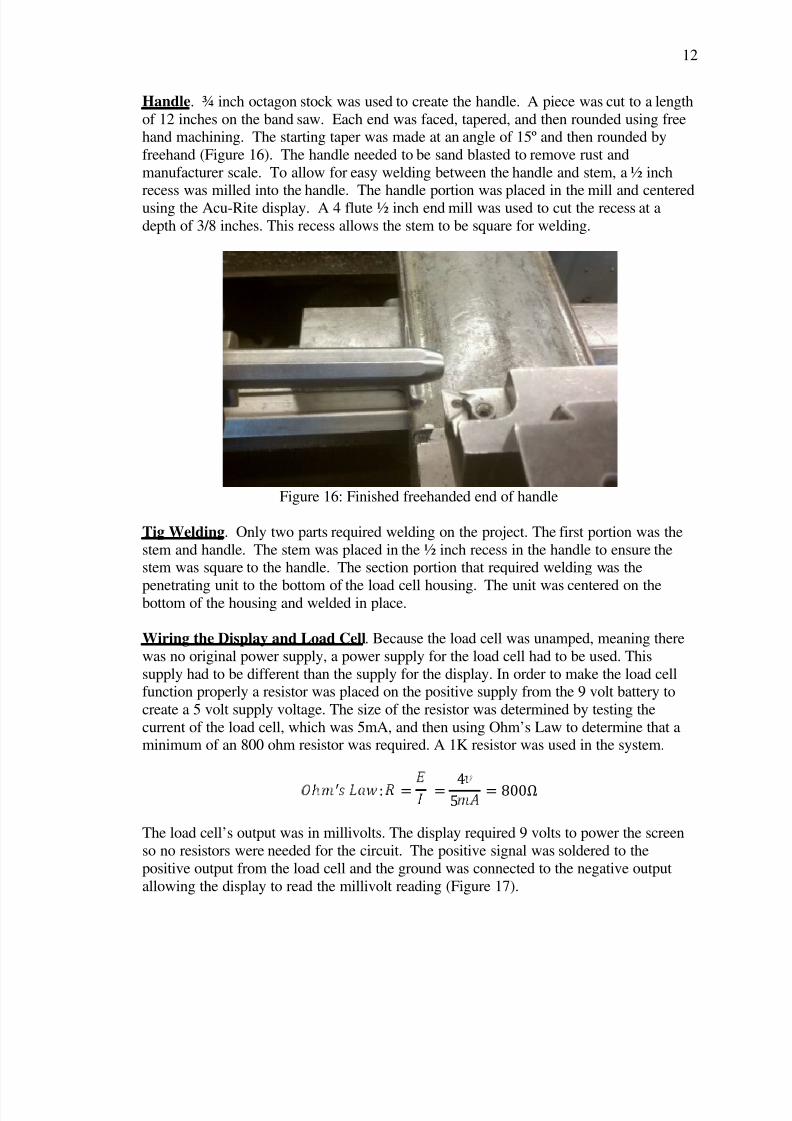
Handle. ¾ inch octagon stock was used to create the handle. A piece was cut to a length
of 12 inches on the band saw. Each end was faced, tapered, and then rounded using freehand machining. The starting taper was made at an angle of 15º and then rounded by
freehand (Figure 16). The handle needed to be sand blasted to remove rust and
manufacturer scale. To allow for easy welding between the handle and stem, a ½ inch
recess was milled into the handle. The handle portion was placed in the mill and centeredusing the Acu-Rite display. A 4 flute ½ inch end mill was used to cut the recess at a
depth of 3/8 inches. This recess allows the stem to be square for welding.
Figure 16: Finished freehanded end of handle
Tig Welding. Only two parts required welding on the project. The first portion was the
stem and handle. The stem was placed in the ½ inch recess in the handle to ensure thestem was square to the handle. The section portion that required welding was the
penetrating unit to the bottom of the load cell housing. The unit was centered on thebottom of the housing and welded in place.
Wiring the Display and Load Cell. Because the load cell was unamped, meaning there
was no original power supply, a power supply for the load cell had to be used. This
supply had to be different than the supply for the display. In order to make the load cellfunction properly a resistor was placed on the positive supply from the 9 volt battery to
create a 5 volt supply voltage. The size of the resistor was determined by testing the
current of the load cell, which was 5mA, and then using Ohm’s Law to determine that aminimum of an 800 ohm resistor was required. A 1K resistor was used in the system.
ᇱ : ൌ ൌ4
5ൌ 800Ω
The load cell’s output was in millivolts. The display required 9 volts to power the screen
so no resistors were needed for the circuit. The positive signal was soldered to the
positive output from the load cell and the ground was connected to the negative output
allowing the display to read the millivolt reading (Figure 17).

7/31/2019 Development of a Testing Procedure Using Cone Index to Allow For
http://slidepdf.com/reader/full/development-of-a-testing-procedure-using-cone-index-to-allow-for 21/38
13
Testing Procedure
To make sure the unit was functioning properly, it was testing using a scale. The scalewould measure the force in pounds produced by pushing the penetrometer into a piece of
wood. A constant force was applied and compared to the table created for the results.
Field Testing. Once tested in the lab, the unit was tested out in the field to gather realdata that would be used during tractor pull events. Soil was collected and then tested
using the penetrometer. The depth penetrated for the tests was 5 inches. Thepenetrometer can be set at a specific depth depending on the stop setting. This test was
used to compare lab testing with field data. Because the display unit will be mounted on
the penetrometer, only one person will be required to do the testing.
Event Procedure. This procedure requires the tester to take measurements at 9 to 12
points on the track depending on soil variability. The spots on the track to be tested, as
shown in Figure 18, allow the driver to pick a section of track that may have the mostconsistent soils. The data collected from the testing is to be used with the table created to
assist with the recommended tire pressures. The pressure range uses data that has beenaccumulated over the last 11 years at different events. This range is 4 psi to 6.5 psi.
Figure 17: This figure shows the wiring for the circuit.

7/31/2019 Development of a Testing Procedure Using Cone Index to Allow For
http://slidepdf.com/reader/full/development-of-a-testing-procedure-using-cone-index-to-allow-for 22/38
14
Figure 18: This figure shows the dimensions of the track. It also shows the
different areas that the soil is to be tested.

7/31/2019 Development of a Testing Procedure Using Cone Index to Allow For
http://slidepdf.com/reader/full/development-of-a-testing-procedure-using-cone-index-to-allow-for 23/38
15
RESULTS
Lab Testing
When the completed penetrometer was done (Figure 19), a series of 2 tests were
conducted in the lab to make sure the unit was working properly. The tests measured theforce applied. These values were compared to the values displayed on the digital display
that were measured in millivolts. The results of the test are shown in Table 1. This testwas used to calibrate the accuracy of the load cell and output reading on the display.
Figure 19: Completed penetrometer without the display mounted

7/31/2019 Development of a Testing Procedure Using Cone Index to Allow For
http://slidepdf.com/reader/full/development-of-a-testing-procedure-using-cone-index-to-allow-for 24/38
16
Measured
(mV)
Factored
(mV to lbs.)
Actual
Measured
(lbs.) % Error
1.3 3.25 3.4 4.4138.4 96 86 11.63
51.4 128.5 120 7.08
Table 1: Initial test results from the lab tests

7/31/2019 Development of a Testing Procedure Using Cone Index to Allow For
http://slidepdf.com/reader/full/development-of-a-testing-procedure-using-cone-index-to-allow-for 25/38
17
DISCUSSION
In order to make an accurate estimation more data needs to be gathered to compare tire
pressure with performance of the tractor in order to develop a relationship.
A major component of the design that required more effort than the other parts was the
wiring of the digital read out and load cell. The issue faced was a mysterious 2 voltreading that would read out on the display when hooked up. This was due to the single
power supply using 2 common grounds that connected to both the load cell output and
the display signal. The way this issue was resolved was to make separate power supplies
for the load cell and display unit. This eliminated the 2 volt current showing up on thedisplay.
Another change in the design occurred when the handle was initially placed in the capunit and did not fit snuggly. The solution to the problem was to fabricate a bushing that
would eliminate the slop of the handle.

7/31/2019 Development of a Testing Procedure Using Cone Index to Allow For
http://slidepdf.com/reader/full/development-of-a-testing-procedure-using-cone-index-to-allow-for 26/38
18
RECOMMENDATIONS
In order to make this project valid, the Penetrometer should be used during the Tractor
Pull season at the various events. Data needs to be collected at each event, analyzed, and
acted upon. The performance of the tractor can then be evaluated to determine whetheror not the recommended tire pressure helped with performance or hurt the performance.
After a season’s worth of data has been collected, alterations to the table can be made if necessary to help improve the performance of the tractor.
Recommended Procedure
The penetrometer should travel with the Tractor Pull team over the course of the summer
to different events and be used to measure the Cone Index of the soils.
Pre-Pull Procedure. The event testing procedure should be used for the pre-pull data
collection. This means that data points along the track need to be tested and recorded.The average force at the data points needs to then be determined. The average forceapplied should be recorded as well as the soil conditions for the track. The tire pressure
should then be set according to the log book records for that location or personal
recommendation.
Post Pull Procedure. After the pull, the performance of the tires needs to be analyzed.
The analysis should determine whether or not the tires performed as desired. If the tires
did not perform as intended then a recommendation needs to be made to adjust the tirepressure up or down. All of this information should be recorded into the data table
(Table 4). This table will be incorporated into the log book. The corrected tire pressure is
the pressure that would have been used if there were a second run at the same location.
Table 2: A mock table of data collected and analyzed for referencing.
Event DateSoil
Condition
Pene.
Reading
Average
(mV)
Pene.
Force
(lbs.)
Performance
of Tires
Corrected
pressure (psi)
Pull # 14/16/1
1
Compacted
Pasture 70175
Good 4
Pull # 25/30/1
1
Rodeo
Arena86 215 ok 5
Pull # 35/23/1
1
soft top
with hard
ground
underneat
h
70 175 ok 5.5
Pull # 45/25/1
1
Hard
compacted
track
95 237.5 ok 6
… . . . . . .

7/31/2019 Development of a Testing Procedure Using Cone Index to Allow For
http://slidepdf.com/reader/full/development-of-a-testing-procedure-using-cone-index-to-allow-for 27/38
19
Once the data is recorded on the table the information will be logged into the data sheet
using Microsoft Excel. The information will be plotted on to a graph (Figure 20).
Figure 20: Mock graph showing potential data results
Once the pull season is over the tire data needs to be evaluated. The graph should
conclude a line of best fit for forces and pressures. This line should be the optimal tirepressure performance based off of the soil cone index. The measurements would then
need to be used for the future pulls. When this table is made, members of the tractor pull
team will only need to measure the force required to penetrate the soil. The reading willallow the team to determine the pressure based off of the graph of data. If the data from
the penetrometer are in between 2 points, the value on the line on the graph will be used.
Because the initial testing was done for the tractor “Mustang Fever” and its specific tires,another table with recommended tire pressure would need to be made to accommodate
the needs of tractors using the tires “Firestone Puller 2000’s”.
To avoid faulty wiring and other potential electrical failures, a mechanical read out using
a pressure gauge or spring read out could be used to measure the forces applied to the
soils.
0
50
100
150
200
250
4 4.5 5 5.5 6 6.5 7
F o r c e (
l b s )
Pressure Used (psi)
Tire Pressure and Force
Corrected Tire Pressure

7/31/2019 Development of a Testing Procedure Using Cone Index to Allow For
http://slidepdf.com/reader/full/development-of-a-testing-procedure-using-cone-index-to-allow-for 28/38
20
REFERENCES
Argabright, Dave. February, 2009. Dirt Track Prep. <http://www.circle track.com/
techarticles/40158/index.html>, referenced Nov 12, 2010
Ayers, P.D., Perumpral, J.V. 1982. Moisture and Density Effect on Cone Index.
Transactions of the American Society of Agricultural Engineers.
Baladi, George Y. Rohani, Bohzad. 1981. Correlation of Mobility Cone Index with
Fundamental Engineering Properties of Soil. Structures Laboratory US Army of
Engineers, Paper SL-81-4.
Bickford, Robert. 2010. Toyota Off Road. The Low Down on Tire Pressure.
<http://www.toyotaoffroad.com/Articles/Projects/Tire_Pressure/Tire_Pressure.ht
m>, referenced Nov 12, 2010.
Hayes, John. Ligon, James. 1981. Traction Prediction Using Soil Physical Properties .
Transactions of the ASAE Vol. 24 (6): 1420-1425.
Hughes, Jodi. 2009. Tires, Traction and Compaction. Report M1271. University of
Minnesota Extension.
Kumar, Arun., Chen, Ying., Rahman, Sahfiqur. 2006. Soil Cone Index Estimation for
Different Tillage Systems. ASABE Paper No. MBSK 06-101
Puller 2000 – R-1. 2010. Firestone Tires.
<http://www.firestoneag.com/tirelist.asp?ref=27>, referenced Nov 11, 2010.
Raper, R.L. 2008. Tire Pressure Effects on Soil Compaction. USDA Research Project
Report No. 04.
Soil Cone Penetrometer. December 1994. ASAE standards. ASAE S313.2.

7/31/2019 Development of a Testing Procedure Using Cone Index to Allow For
http://slidepdf.com/reader/full/development-of-a-testing-procedure-using-cone-index-to-allow-for 29/38
21
APPENDIX A
HOW PROJECT MEETS REQUIREMENTS FOR THE ASM MAJOR

7/31/2019 Development of a Testing Procedure Using Cone Index to Allow For
http://slidepdf.com/reader/full/development-of-a-testing-procedure-using-cone-index-to-allow-for 30/38
22
HOW PROJECT MEETS REQUIREMENTS FOR THE ASM MAJOR
ASM PROJECT REQUIREMENTS
.
The ASM senior project must include a problem solving experience that incorporates theapplication of technology and the organizational skills of business and management, and
quantitative, analytical problem solving. This project addresses these issues as follows.
Application of Agricultural Technology. The project will involve the application of
problem solving, design procedures, mechanical and electrical systems, and fabrication
technologies.
Application of Business and/ or Management Skills. Cost analysis was used during the
project to help minimize money spent while being able to produce a quality product.
Quantitative, Analytical Problem Solving. Quantitative problem solving will includethe design of a soil testing device used to increase performance of a modified pullingtractor.
Capstone Project Experience
The ASM senior project must incorporate knowledge and skills acquired in earlier
coursework (Major, Support, and/ or GE courses). This project incorporates knowledge/
skills from these key courses.
• BRAE 129 Lab Skills and Safety
• BRAE 133 Engineering Design Graphics
• BRAE 142 Ag Power and Machinery
• BRAE 151 CAD for Ag Engineering
• BRAE 152 3D Solids Modeling
• BRAE 203 Ag Systems Management
• BRAE 301 Hydraulic/Mechanical Power Systems
• BRAE 324 Principles of Ag Electrification
• BRAE 342 Ag Materials
• BRAE 343 Mechanical Systems Analysis
• BRAE 344 Fabrication Systems
• BRAE 418/419 Ag Systems Management
• ENG 148 Reasoning, Argumentation, and Professional Writing• SS 121 Introductory Soil Science

7/31/2019 Development of a Testing Procedure Using Cone Index to Allow For
http://slidepdf.com/reader/full/development-of-a-testing-procedure-using-cone-index-to-allow-for 31/38
23
ASM Approach
Agricultural Systems Management involves the development for solutions to
technological, business or management problems associated with agricultural or related
industries. A systems approach, interdisciplinary experience, and agricultural training in
specialized areas are common features of this type of problem solving. This projectaddresses these issues as follows.
Systems Approach. The project involves testing and analysis of data to increase
performance of a piece of equipment.
Interdisciplinary Features. The project includes aspects of mechanical systems anddesign, along with problem solving and data analysis.
Specialized Agricultural Knowledge. The project requires specialized knowledge of modified pulling tractors and an understanding of Soil Cone Index.

7/31/2019 Development of a Testing Procedure Using Cone Index to Allow For
http://slidepdf.com/reader/full/development-of-a-testing-procedure-using-cone-index-to-allow-for 32/38
24
APPENDIX B
INDIVIDUAL PARTS DRAWINGS

7/31/2019 Development of a Testing Procedure Using Cone Index to Allow For
http://slidepdf.com/reader/full/development-of-a-testing-procedure-using-cone-index-to-allow-for 33/38
25
Figure 21: Penetrating Unit Part Design

7/31/2019 Development of a Testing Procedure Using Cone Index to Allow For
http://slidepdf.com/reader/full/development-of-a-testing-procedure-using-cone-index-to-allow-for 34/38
26
Figure 22: Load Cell Housing

7/31/2019 Development of a Testing Procedure Using Cone Index to Allow For
http://slidepdf.com/reader/full/development-of-a-testing-procedure-using-cone-index-to-allow-for 35/38
27
Figure 23: Housing Unit Cap

7/31/2019 Development of a Testing Procedure Using Cone Index to Allow For
http://slidepdf.com/reader/full/development-of-a-testing-procedure-using-cone-index-to-allow-for 36/38
28
Figure 24: Bushing for Cap

7/31/2019 Development of a Testing Procedure Using Cone Index to Allow For
http://slidepdf.com/reader/full/development-of-a-testing-procedure-using-cone-index-to-allow-for 37/38
29
Figure 25: Handle Stem

7/31/2019 Development of a Testing Procedure Using Cone Index to Allow For
http://slidepdf.com/reader/full/development-of-a-testing-procedure-using-cone-index-to-allow-for 38/38
30
Figure 26: Handle for Penetrometer