Embed Size (px)
Citation preview

PCA R&D Serial No. SN3149
Development of a Simple and Fast Test Method for Measuring the Durability of
Portland Cement Pervious Concrete
by Qiao Dong, Hao Wu, Baoshan Huang, Xiang Shu, and Kejin Wang
©Portland Cement Association 2010 All rights reserved
5420 Old Orchard Road Skokie, Illinois 60077-1083 847.966.6200 Fax 847.966.8389 www.cement.org


DEVELOPMENT OF A SIMPLE AND FAST TEST METHOD FOR MEASURING THE DURABILITY OF
PORTLAND CEMENT PERVIOUS CONCRETE (FINAL REPORT)
Submitted to Portland Cement Association
Qiao Dong, Hao Wu, Baoshan Huang*, Xiang Shu Dept. of Civil and Environmental Engineering
The University of Tennessee Knoxville, TN 37996
*Corresponding Author Phone: (865)974-7713
Email: [email protected]
Kejin Wang Dept. of Civil, Construction, and Environmental Engineering
Iowa State University Ames, IA 50011
November, 2010

1
ABSTRACT Portand cement pervious concrete (PCPC) has been increasingly used in concrete pavements during recent years. In addition to strength and permeability, abrasion durability is another important property of PCPC. In this paper, three potential abrasion test methods (Cantabro, loaded wheel, and surface abrasion tests) were investigated for evaluation of abrasion and raveling resistance of PCPC. Eight mixes of PCPC made with different sizes of coarse aggregate and different additives (latex and fiber) were studied. The results indicated that all the three abrasion tests were effective and their results agreed with each other. The surface abrasion test exhibited the best sensitivity. The Cantabro test produced good repeatability and the lowest variation, whereas the variation from the loaded wheel and the surface abrasion tests was relatively high. Studded steel wheel and high wheel pressure were suggested for the loaded wheel abrasion test for PCPC abrasion testing. The results from all the three tests suggested that using small size aggregate (4.75mm) and/or adding latex and fiber could improve the abrasion resistance and compressive strength of PCPC. Addition of latex together with fiber provided the most significant improvement in the abrasion resistance of PCPC. Keywords: Pervious concrete, Loaded wheel test, Cantabro Loss, Surface abrasion, Durability

2
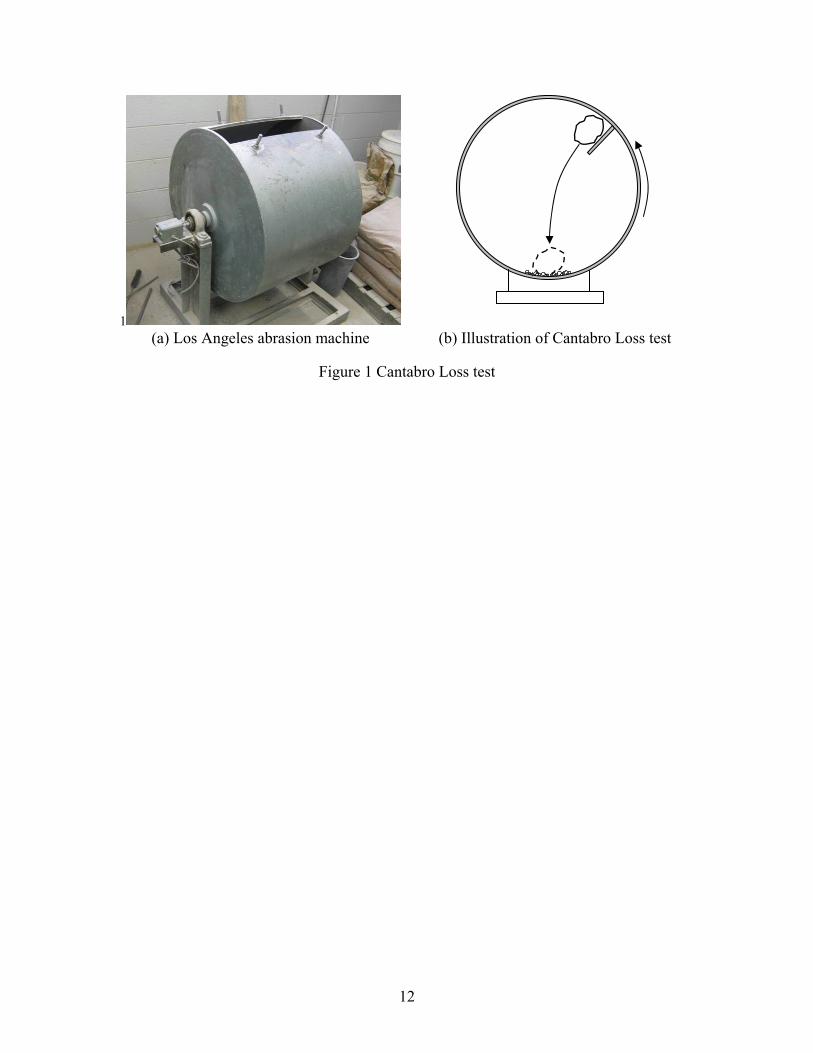
1. Introduction Portland cement pervious concrete (PCPC) is a special concrete that has high inter-connected void content of 15 ~ 25% (1). Due to the open pore structure that allows high rates of water transmission, PCPC has been increasingly used on low traffic pavements and parking lots to reduce the amount of runoff water. The rapid drainage of water through interconnected voids can minimize wet weather spray, improve visibility, and minimize glare (2,3). Because of those advantages, PCPC is promising for application on conventional highway. One of important concerns about the durability of pavement concrete is the abrasion and raveling under repeated traffic loading. Due to the reduced strength and contact area between neighboring aggregate particles, PCPC is more vulnerable than conventional portland cement concrete to cracking and raveling under traffic loads. How to characterize the durability property of PCPC is of great practical importance. 2. Objective and Scope The objective of the present study was to investigate available laboratory test methods for evaluating abrasion and raveling resistance of PCPC. The three tests considered were the Cantabro, the loaded wheel abrasion, and the surface abrasion tests. Eight mixtures of PCPC made with two different aggregate sizes and different additives were prepared for the evaluation. Necessary modifications to the test setup and test procedures were also investigated in this study. 3. Potential Tests The following potential tests were investigated in this study: 3.1. Cantabro Test The Cantabro test, initially used in Europe and South Africa to characterize the durability and resistance to stone loss for open-graded friction course (OGFC) mixtures of hot-mix asphalt (HMA), has been introduced into the United States to determine the resistance of HMA to abrasion (4,5,6,7). OGFC is a porous asphalt mixture with typical air voids of 15%. Since PCPC has many similarities with HMA OGFC, the Cantabro test has the potential of testing PCPC for its durability and abrasion resistance under traffic loads. The Cantabro test is conducted in the Los Angeles (LA) abrasion machine without the steel ball charges, as shown in Figure 1. The PCPC specimens before and after the Cantabro test are shown in Figure 2. The weight loss occurred during the test was used to characterize to the abrasion resistance of PCPC. 3.2. Loaded Wheel Abrasion Test

3
The loaded wheel tester (LWT) is commonly used to test the rutting potential of asphalt mixtures by applying a moving wheel load to the surface of an asphalt mixture sample. Several LWTs currently used in the United States include the Georgia Loaded Wheel Tester (GLWT), the Asphalt Pavement Analyzer (APA), the Hamburg Wheel Tracking Device (HWTD), the LCPC (French) Wheel Tracker, and the Purdue University Laboratory Wheel Tracking Device (PURWheel). Among these LWTs, APA is a modification of Georgia loaded wheel tester and is capable of evaluating rutting, fatigue cracking and moisture susceptibility of asphalt mixture (8). APA features controllable wheel load and contact pressure that are representative of actual field conditions (9,10) and thus has the potential of testing the durability and abrasion resistance of PCPC under traffic loads. As shown in Figure 3, APA was utilized in this study to test the abrasion resistance of PCPC. Since PCPC has much higher stiffness than asphalt mixture, a higher load level (5.5 kN for each wheel) was selected for this abrasion test to provide a higher abrasion force. At the initial stage of this study, steel wheel of smooth surface was used. However, only a very small amountof abrasion was observed due to the smooth wheel surface and the relatively high strength and stiffness of PCPC. The weight loss was less than 0.5%. It was determined that the wheels need to be modified by adding steel studs onto the surface of the wheels (Figure 3) to increase the severity of the abrasion. The studs were 5 mm in diameter and protruded 1.5 mm from the wheel surface. By using studded steel wheel, the wearing and abrasion occurring during the test were significantly improved. Figure 4 shows the specimens after the loaded wheel abrasion test. 3.3. Surface Abrasion Test (ASTM C944) The surface abrasion test (ASTM C944) is a standard test method to determine the resistance of conventional concrete or mortar to surface abrasion by using rotating-cutter method. The surface abrasion test has been successfully used in the quality control of highway and bridge concrete subject to traffic (11). It has been used by other researchers to evaluate the surface abrasion resistance of PCPC under different curing conditions (12) and has the potential of evaluating the abrasion/raveling resistance of PCPC. As shown in Figure 5(a), a rotating cutter is mounted in the abrasion device to apply an abrasion force on the surface of PCPC specimens. After the test, the specimen was brush cleaned and its weight loss was recorded and used as an indicator of the abrasion resistance of PCPC. 4. Methodology 4.1. Material Preparation Eight mixtures of PCPC were used for the evaluation of these three tests (Table 1). The basic mix proportion was cement:coarse aggregate:water = 1:4.5:0.35 (by weight). Two

4
gradations of single-sized limestone, 9.5 mm (3/8 in.) and 4.75 mm (No. 4), were used as coarse aggregate. Two additives, SBR latex and polypropylene fiber, were added to improve strength and abrasion resistance of PCPC. Typically PCPC has no or little fine aggregate. However, considering the effect of sand for improving the strength of PCPC, a small amount of natural sand was incorporated in the mixes. The specimens were made and cured in the standard curing room for 28 days and cut into specific size for testing. 4.2. Compressive Strength and Porosity tests The specimens were tested at 28d for compressive strength and porosity to verify that the designed PCPC had sufficient strength and permeability. Three 100 mm-diameter and 200 mm high cylindrical specimens were tested for compressive strength according to ASTM C 39. Three 150 mm-diameter and 100 mm high specimens were used for the porosity test. In the porosity test, the CoreLok device was utilized to measure the void content, which is intimately related to permeability. The Corelok vacuum-sealing method is usually used to determine the density of asphalt mixtures with high air voids such as OGFC (13) and has been successfully applied to PCPC. 4.3. Cantabro Test The Cantabro testing involves recording the initial weight of individual sample, placing it in the LA abrasion, and then rotating it for 300 revolutions at the rate of 30 revolutions per minute. 150 mm diameter by 100 mm height cylinder specimens were used in the test. The weight loss after the Cantabro test (called Cantabro Loss) is calculated in percentage using Equation (1).
100Loss Cantabro1
21 ×−
=W
WW (1)
where, Cantabro Loss = Weight loss, %; W1 = Initial sample weight, g; W2 = Final sample weight, g.
4.4. Loaded Wheel Abrasion Test The specimen used in the loaded wheel abrasion test was 300mm x 125mm x 75mm beam. The abraded area was 116 cm2 on the 300mm x 125mm surface. Three specimens were tested for each group. After cleaning the specimen surface and measuring the initial weight, specimens were put into APA for 5500 times fatigue test. The weight loss from this test was calculated in percentage with Equation (1) to evaluate the abrasion resistance of PCPC. 4.5. Surface Abrasion Test Beam specimens of 300mm x 125mm x 75mm were used in the surface abrasion test. Two locations on the 300mm x 125mm surface were tested for each specimen. The diameter of the abraded circular area is 82.5 mm and the area is 53.5 cm2. The normal constant load was 98 N, rotation speed was 200 times/min and the test period was 6 mins.

5
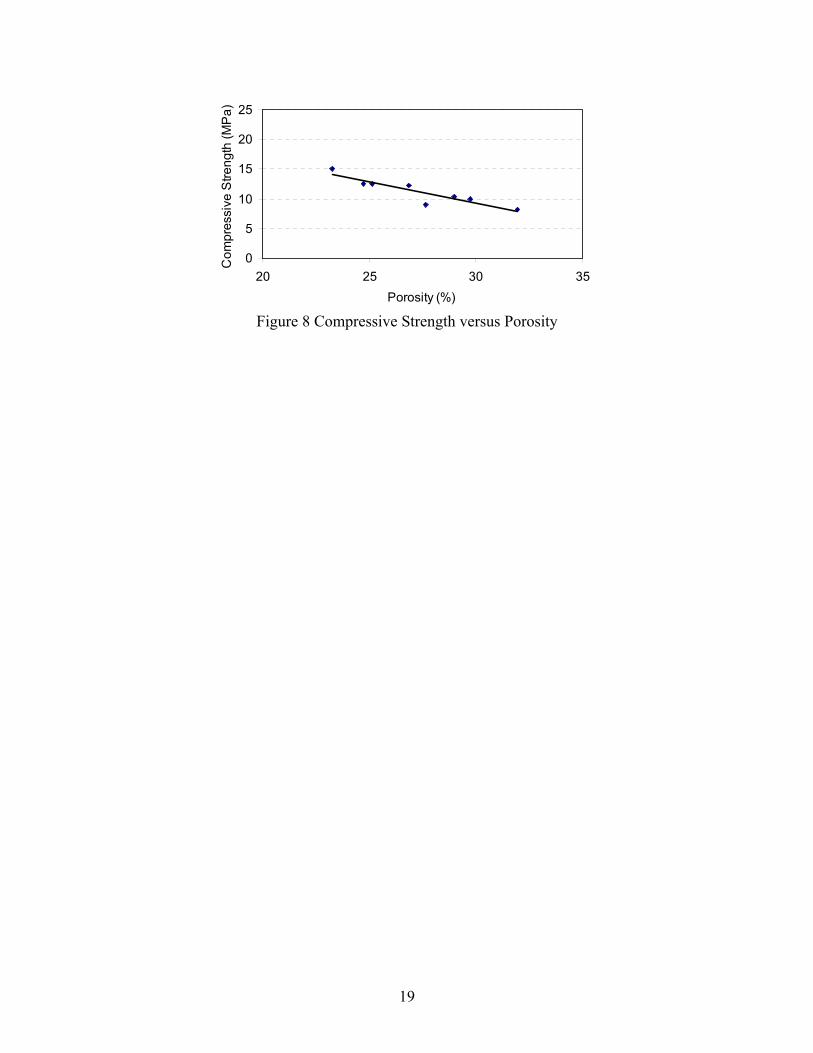
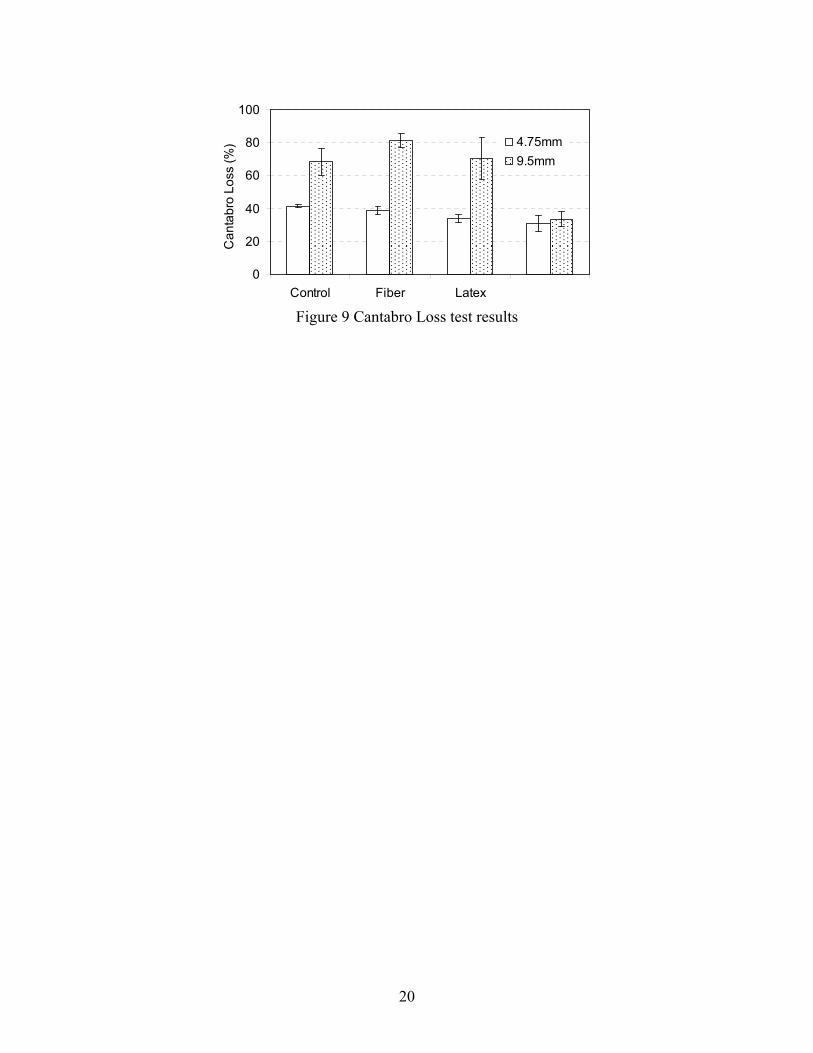
After cleaning specimen surface and measuring the initial weight, the specimen was fastened in the abrasion device for testing. Equation (1) was used to calculate the weight loss in percentage from this abrasion test to evaluate the abrasion resistance of PCPC. 4.6. Sensitivity and Repeatability Sensitivity is an indication of whether a test can differentiate samples with different properties. The sensitivities of the three tests were compared in this study. The result ranges and the ratios of the lowest results to those of the control mix were calculated and compared for the three tests. Low ratio value and high range indicate that a test is capable of differentiating different samples and thus the test method has a good sensitivity. The coefficient of variation (CV), the ratio of standard deviation to the mean, is a normalized measure of variety and can be used to compare the variation of data sets with different units or mean values. CVs of the test results were calculated in this study to evaluate the repeatability of these tests. Low CV value means high repeatability. 5. Results and Discussion 5.1. Strength and Porosity Test Typical pervious concrete has just enough cementitious paste to coat the coarse aggregate particles while preserving the interconnectivity. Thus, compared with conventional PCC, PCPC normally has relatively lower compressive strength ranging from 2.8 to 10 MPa (14). Figure 6 presents the compressive strength results of the PCPC studied. It can be seen that the compressive strength of the PCPC mixtures ranged from 5 to 15 MPa,. Addition of latex and fiber and/or using small size aggregate (4.75mm) generally improved the compressive strength. Moreover, compressive strength can be used as an indicator of the abrasion resistance of PCPC. Generally, the higher the strength, the higher the abrasion resistance. Thus, it’s estimated that adding latex and fiber and/or using small size aggregate (4.75mm) might be effective in improving the abrasion resistance. Typically, PCPC has void content of 15 to 25% to ensure sufficient permeability (15). Figure 7 presents the porosity results of PCPC. It can be seen that the porosity results ranged from 20% to 30%, which indicates that the designed PCPC had enough permeability. Figure 8 presents the plot of compressive strength versus porosity. It can be seen that generally the higher porosity, the lower compressive strength. 5.2. Cantabro Test Figure 9 presents Cantabro loss results. It can be seen that the results could clearly show difference among the tested PCPC mixes, indicating that this test was sensitive enough to

6
differentiate PCPC mixes with different properties. Generally, using small size aggregate (4.75mm) and/or adding latex and fiber reduced the Cantabro loss, which agreed well with the compressive strength results. Figure 9 also shows that the Cantabro loss range was within 35% and 80% (1200~2800g), indicating that more than half of the specimen weight was lost during the test for some mixes. The possible reason for this was that that some of the specimens fallen apart due to the crash in the test rather than were abraded away because of their low strength. In this case, the test protocol (300 revolution) may be too severe. Less revolutions will be investigated as a potential way to mitigate the weight loss value and to improve the effectiveness of the test. 5.3. Loaded Wheel Abrasion Test Figure 10 presents the loaded wheel abrasion test results. It can be seen that the test results clearly showed the difference among tested PCPC mixtures. Generally, using small size aggregate (4.75mm) and/or adding latex and fiber could reduce the weight loss, which was in good agreement with the results from the strength and the Cantabro tests. The weight loss values from this test fell within the range of 0.5%~2% (33~101g). The low percent weight loss was mainly due to the relatively small abraded area (116 cm2) compared to the specimen size. 5.4. Surface Abrasion Test The results from the surface abrastion test are shown in Figure 11. It is observed that the different PCPC mixtures could be clearly differentiated with this test. It can also be seen from Figure 10 that using small size aggregate (4.75mm), and/or adding latex and fiber could increase the abrasion resistance of PCPC. This was very consistent with the results from the Cantabro and the loaded wheel abrasion tests. The weight loss values ranged from 0.2% to 0.5% (11~28g) for this test. In the case of low weight loss value, the inspection of the tested specimen showed that only several small aggregate particles were abraded away from the specimen, which could be attributed to the small abraded area (53.5 cm2) and short testing period (6 min). 5.5. Comparison of the Three Abrasion Tests Figure 12 presents weight loss of the three abrasion test versus the compressive strength. Table 2 presents the comparison of specimen size, test period, test equipment, test results value, ratio of lowest result to that of the control mix and CVs of the three tests. The comparison of the three abrasion tests was summarized as follows: 1. It can be seen from Figure 12 that, for porous concrete made with large size aggregate
(9.5mm), the higher compressive strength, the higher abrasion resistance. 2. The surface abrasion test used the smallest specimen. The specimens having a
circular area of 82.5mm in diameter could be used for the surface abrasion test.

7
3. The test equipment was readily available for the three tests. Only a simple modification (adding studs onto steel wheels) was needed for the loaded wheel abrasion test.
4. The weight loss results from the Cantabro test were much higher and the results from the loaded wheel abrasion and the surface abrasion tests were much lower due the difference in nature between these tests.
5. The loaded wheel abrasion test exhibited the lowest ratio of 45%, followed by the surface abrasion test with 58%. The Cantabro test gave the highest ratio of 62%. All of the three tests exhibited sufficient sensitivity.
6. The CVs of the compressive strength and porosity results were 10% and 8%, respectively. The Cantabro test had the lowest CV of 11.1%, followed by the loaded wheel abrasion test with 19%. The surface abrasion test produced the highest CV of 32%. Researchers at Iowa State University reported that the surface abrasion test had a CV of 31% (14).
6. Conclusions The Cantabro, loaded wheel, and surface abrasion tests were evaluated and compared. Eight mixes of PCPC made with different sizes of coarse aggregate and different additives (latex and fiber) were studied. Based on the results from this study, the following can be concluded: 1. The loaded wheel abrasion test had the best sensitivity and sufficient repeatability
among the three tests. Studded steel wheel and high wheel pressure were suggested for this test for PCPC abrasion testing.
2. The surface abrasion test was also effective for evaluating the abrasion resistance of PCPC though its results had relatively large variance. Longer test period was suggested to increase the severity of the test and enhance its effectiveness.
3. The Cantabro test had fairly good sensitivity and repeatability. However, it also gave high values of weight loss and was not as effective as the other two tests for the evaluation of the abrasion resistance of PCPC. A fewer revolutions were recommended as a potential way to improve its capability.
4. The results from the three tests indicated that using small size aggregate (4.75mm) and/or adding latex and fiber could improve the abrasion resistance and compressive strength of PCPC.
Acknowledgement This study was supported by the Portland Cement Association Education Foundation (PCA). The authors would like to express their gratitude to the sponsoring agency. The Materials and Tests Division of The Tennessee Department of Transportation (TDOT) is especially acknowledged for their assistance with the Cantabro test.

8
References 1. American Concrete Institute, Pervious Concrete. ACI Committee 522, technical
committee document 522R-06, 2006. 2. P.D. Tennis, M.L. Leming, and D.J. Akers, Pervious Concrete Pavements. Portland
Cement Association, 2004. 3. J. Yang and G. Jiang, Experimental study on properties of pervious concrete
pavement materials, Cement and Concrete Research, 33(2003), pp. 381-386. 4. Ltd. Sabita, Porous Asphalt Manual 17., Roggebaai, South Africa, Nov. 1995. 5. F. E. Perez-Jimenez, and J. Gordillo. Optimization of Porous Mixes Through the Use
of Special Binders. Transportation Research Record, No. 1265, TRB, National Research Council, Washington, D.C., 1990, pp. 59-68.
6. A. Ruiz, R. Alberola, F. Perez, and B. Sanchez. Porous Asphalt Mixtures in Spain. In Transportation Research Record 1265, TRB, National Research Council, Washington, D.C., 1990, pp. 87–94.
7. D.E. Watson, K.A. Moore, K. Williams, and L.A. Cooley, Jr. Refinement of New-Generation Open-Graded Friction Course Mix Design. Transportation Research Record, No. 1832, TRB, National Research Council, Washington, D.C., 2003, pp. 78-85.
8. L. A. Cooley Jr., P. S. Kandhal, M. S. Buchanan, F. Fee, and A. Epps, Loaded Wheel Testers in the United States: State of the Practice, NCAT Report 00-04, July 2000.
9. P.S. Kandal and L.A. Cooley, Jr., Accelerated Laboratory Rutting Tests: Evaluation of the Asphalt Pavement Analyzer, NCHRP Report 508, Transportation Research Board, 2003.
10. E. Skok, E. Johnson, A. Turk. Asphalt Pavement Analyzer (APA) Evaluation, Minnesota Department of Transportation, 2003.
11. Z. Shi and D. D. L. Chung, Improving the abrasion resistance of mortar by adding latex and carbon fibers, Cement and Concrete Research, Volume 27, Issue 8, August 1997, pp 1149-1153.
12. J. T. Kevern, Advancements in pervious concrete, PhD dissertation, Iowa State University. 2008, pp 85-99.
13. M.S. Buchanan, An Evaluation of Selected Methods for Measuring the Bulk Specific Gravity of Compacted Hot Mix Asphalt (HMA) Mixes. Journal of the Association of Asphalt Paving Technologists, 69(2000), pp. 608-634.
14. American Concrete Institute, Specification for Pervious Concrete, ACI Committee 522, technical committee document 522.1-08, 2008.
9
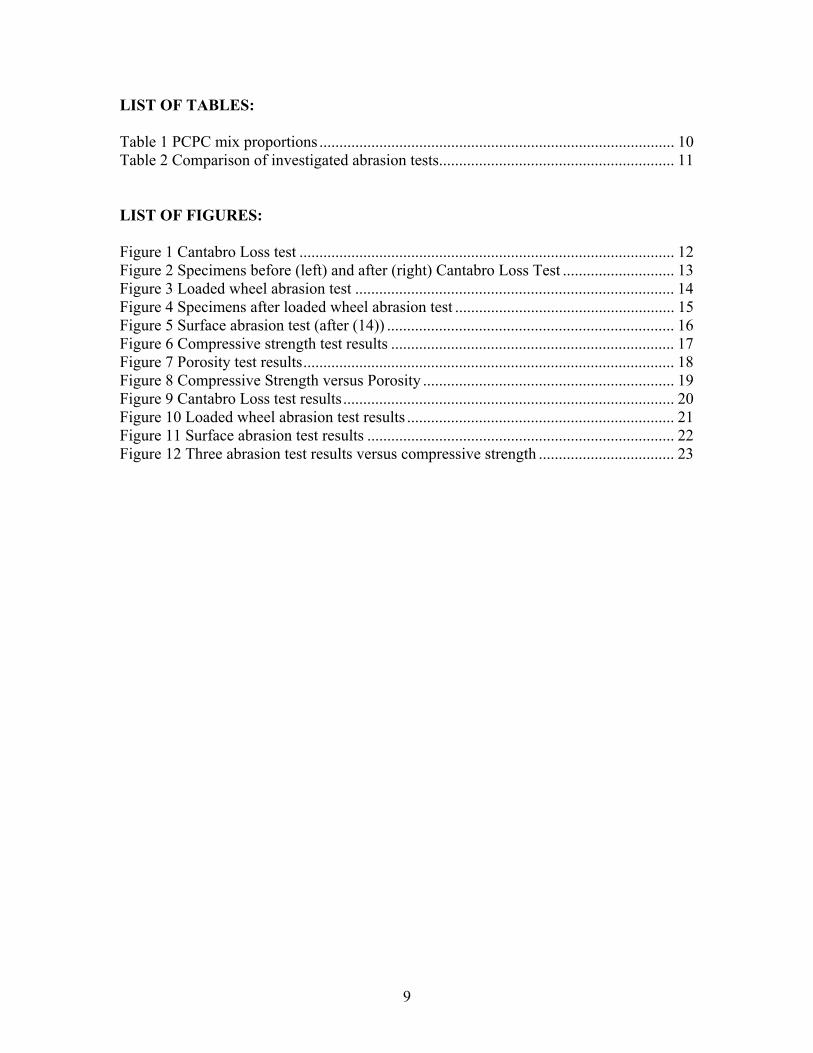
LIST OF TABLES: Table 1 PCPC mix proportions ......................................................................................... 10 Table 2 Comparison of investigated abrasion tests ........................................................... 11 LIST OF FIGURES: Figure 1 Cantabro Loss test .............................................................................................. 12 Figure 2 Specimens before (left) and after (right) Cantabro Loss Test ............................ 13 Figure 3 Loaded wheel abrasion test ................................................................................ 14 Figure 4 Specimens after loaded wheel abrasion test ....................................................... 15 Figure 5 Surface abrasion test (after (14)) ........................................................................ 16 Figure 6 Compressive strength test results ....................................................................... 17 Figure 7 Porosity test results ............................................................................................. 18 Figure 8 Compressive Strength versus Porosity ............................................................... 19 Figure 9 Cantabro Loss test results ................................................................................... 20 Figure 10 Loaded wheel abrasion test results ................................................................... 21 Figure 11 Surface abrasion test results ............................................................................. 22 Figure 12 Three abrasion test results versus compressive strength .................................. 23
10
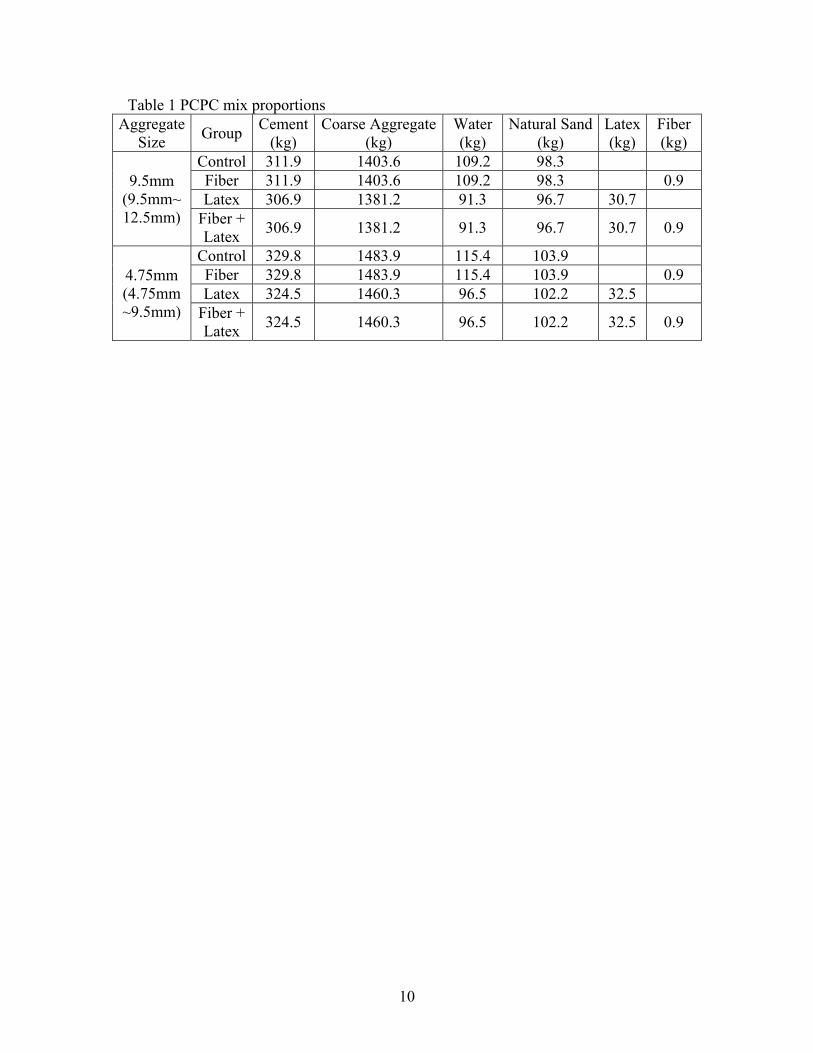
Table 1 PCPC mix proportions Aggregate
Size Group Cement (kg)
Coarse Aggregate (kg)
Water (kg)
Natural Sand (kg)
Latex (kg)
Fiber (kg)
9.5mm (9.5mm~ 12.5mm)
Control 311.9 1403.6 109.2 98.3 Fiber 311.9 1403.6 109.2 98.3 0.9 Latex 306.9 1381.2 91.3 96.7 30.7
Fiber + Latex 306.9 1381.2 91.3 96.7 30.7 0.9
4.75mm (4.75mm ~9.5mm)
Control 329.8 1483.9 115.4 103.9 Fiber 329.8 1483.9 115.4 103.9 0.9 Latex 324.5 1460.3 96.5 102.2 32.5
Fiber + Latex 324.5 1460.3 96.5 102.2 32.5 0.9
11
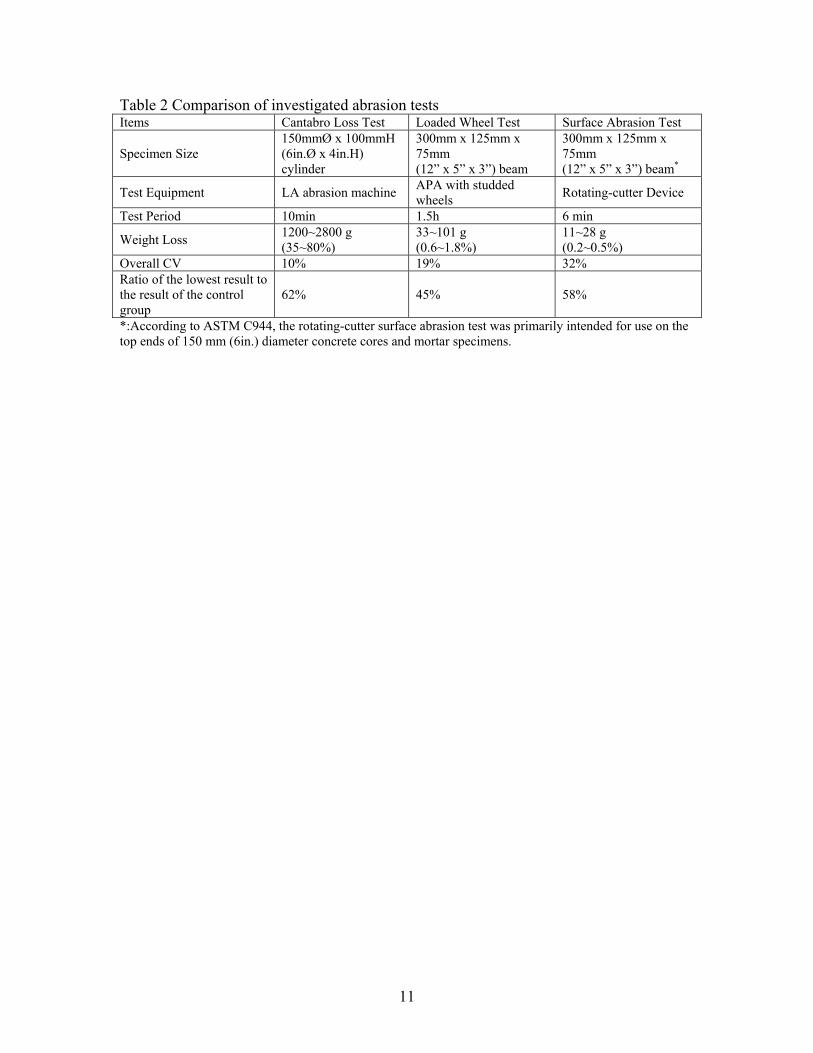
Table 2 Comparison of investigated abrasion tests Items Cantabro Loss Test Loaded Wheel Test Surface Abrasion Test
Specimen Size 150mmØ x 100mmH (6in.Ø x 4in.H) cylinder
300mm x 125mm x 75mm (12” x 5” x 3”) beam
300mm x 125mm x 75mm (12” x 5” x 3”) beam*
Test Equipment LA abrasion machine APA with studded wheels Rotating-cutter Device
Test Period 10min 1.5h 6 min
Weight Loss 1200~2800 g (35~80%)
33~101 g (0.6~1.8%)
11~28 g (0.2~0.5%)
Overall CV 10% 19% 32% Ratio of the lowest result to the result of the control group
62% 45% 58%
*:According to ASTM C944, the rotating-cutter surface abrasion test was primarily intended for use on the top ends of 150 mm (6in.) diameter concrete cores and mortar specimens.
12
1
(a) Los Angeles abrasion machine (b) Illustration of Cantabro Loss test
Figure 1 Cantabro Loss test

13
Figure 2 Specimens before (left) and after (right) Cantabro Loss Test

14
(a) Asphalt Pavement Analyzer (APA) (b) Studded steel wheels
Figure 3 Loaded wheel abrasion test

15
Figure 4 Specimens after loaded wheel abrasion test

16
(a) Rotating-Cutter Drill Press (b) specimens before and after test
Figure 5 Surface abrasion test (after (14))

17
0
4
8
12
16
20
Control Fiber Latex Fiber+Latex
Com
pres
sive
Stre
ngth
(MP
a)
4.75mm9.5mm
Figure 6 Compressive strength test results

18
0
10
20
30
40
50
Control Fiber Latex Fiber+Latex
Por
osity
(%)
4.75mm9.5mm
Figure 7 Porosity test results
19
0
5
10
15
20
25
20 25 30 35Porosity (%)
Com
pres
sive
Stre
ngth
(MP
a)
Figure 8 Compressive Strength versus Porosity
20
0
20
40
60
80
100
Control Fiber Latex
Can
tabr
o Lo
ss (%
) 4.75mm9.5mm
Figure 9 Cantabro Loss test results

21
0
0.5
1
1.5
2
2.5
Control Fiber Latex Fiber+Latex
Wei
ght L
oss
(%)
4.75mm9.5mm
Figure 10 Loaded wheel abrasion test results

22
0
0.2
0.4
0.6
0.8
Control Fiber Latex Fiber+Latex
Wei
ght L
oss
(%)
4.75mm9.5mm
Figure 11 Surface abrasion test results

23
0
20
40
60
80
100
0 5 10 15 20Compressive Strength (MPa)
Can
tabr
o Lo
ss (%
)
4.75mm9.5mm
0
0.5
1
1.5
2
2.5
0 5 10 15 20Compressive Strength (MPa)
Load
ed W
heel
A
bras
ion
Test
Wei
ght
Loss
(%)
4.75mm9.5mm
0
0.2
0.4
0.6
0.8
0 5 10 15 20Compressive Strength (MPa)
Sur
face
Abr
asio
n Te
stW
eigh
t Los
s (%
)
4.75mm9.5mm
Figure 12 Three abrasion test results versus compressive strength
24
APPENDIX
Laboratory Evaluation of Abrasion Resistance of Portland Cement Pervious Concrete
(Accepted by ASCE Journal of Materials in Civil Engineering as a
technical note, in press.) Laboratory Evaluation of Abrasion Resistance of Portland Cement Pervious Concrete