Embed Size (px)
Citation preview
AuthorsCourtney Milner and Russell Kinghorn
Baseline Separation Technologies Pty Ltd.
Abstract
The most common method of screening for drugs of abuse in human samples is a straight-forward immunoassay technique, which although allowing for a rapid turnaround of screening samples, involves a slower confirmatory test of derivatization and detection by gas chromatography/mass spectrometry (GC/MS).
This application note presents the potential for the Agilent Time-of-Flight Mass Spectrometer (LC/MSD TOF) for use as both a screening and a confirmation tool in one analytical run of 30 minutes.
Development of a Screening Analysis by LCTime-Of-Flight MS for Drugs of Abuse
Application
IntroductionMany drugs of choice are derived directly from nat-ural substances. One of the most common of these is cannabis. An extensive review of the illicit drug market in 25 major U.S. cities is pro-vided in the Office of National Drug Control Policy Document “Pulse Check” [1].
Forensic Toxicology
2
Interest in the analysis of drugs of abuse coversmany areas, all with different concerns in theresults obtained. Some of the areas of significanceinclude:
• Workplace screening
• Forensic pathology
• Accident investigation
• Crime scene investigation
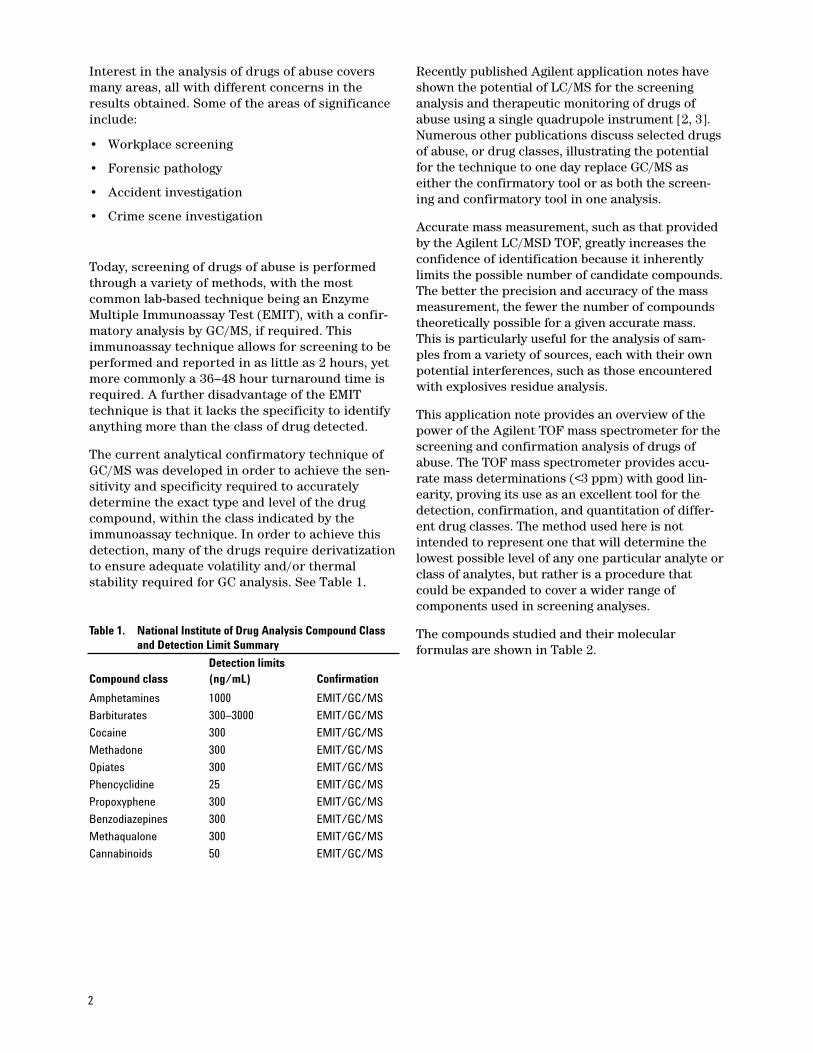
Today, screening of drugs of abuse is performedthrough a variety of methods, with the mostcommon lab-based technique being an EnzymeMultiple Immunoassay Test (EMIT), with a confir-matory analysis by GC/MS, if required. Thisimmunoassay technique allows for screening to beperformed and reported in as little as 2 hours, yetmore commonly a 36–48 hour turnaround time isrequired. A further disadvantage of the EMIT technique is that it lacks the specificity to identifyanything more than the class of drug detected.
The current analytical confirmatory technique ofGC/MS was developed in order to achieve the sen-sitivity and specificity required to accuratelydetermine the exact type and level of the drugcompound, within the class indicated by theimmunoassay technique. In order to achieve thisdetection, many of the drugs require derivatizationto ensure adequate volatility and/or thermal stability required for GC analysis. See Table 1.
Table 1. National Institute of Drug Analysis Compound Classand Detection Limit Summary
Detection limitsCompound class (ng/mL) Confirmation
Amphetamines 1000 EMIT/GC/MS
Barbiturates 300–3000 EMIT/GC/MS
Cocaine 300 EMIT/GC/MS
Methadone 300 EMIT/GC/MS
Opiates 300 EMIT/GC/MS
Phencyclidine 25 EMIT/GC/MS
Propoxyphene 300 EMIT/GC/MS
Benzodiazepines 300 EMIT/GC/MS
Methaqualone 300 EMIT/GC/MS
Cannabinoids 50 EMIT/GC/MS
Recently published Agilent application notes haveshown the potential of LC/MS for the screeninganalysis and therapeutic monitoring of drugs ofabuse using a single quadrupole instrument [2, 3].Numerous other publications discuss selected drugsof abuse, or drug classes, illustrating the potentialfor the technique to one day replace GC/MS aseither the confirmatory tool or as both the screen-ing and confirmatory tool in one analysis.
Accurate mass measurement, such as that providedby the Agilent LC/MSD TOF, greatly increases theconfidence of identification because it inherentlylimits the possible number of candidate compounds.The better the precision and accuracy of the massmeasurement, the fewer the number of compoundstheoretically possible for a given accurate mass.This is particularly useful for the analysis of sam-ples from a variety of sources, each with their ownpotential interferences, such as those encounteredwith explosives residue analysis.
This application note provides an overview of thepower of the Agilent TOF mass spectrometer for thescreening and confirmation analysis of drugs ofabuse. The TOF mass spectrometer provides accu-rate mass determinations (<3 ppm) with good lin-earity, proving its use as an excellent tool for thedetection, confirmation, and quantitation of differ-ent drug classes. The method used here is notintended to represent one that will determine thelowest possible level of any one particular analyte orclass of analytes, but rather is a procedure thatcould be expanded to cover a wider range of components used in screening analyses.
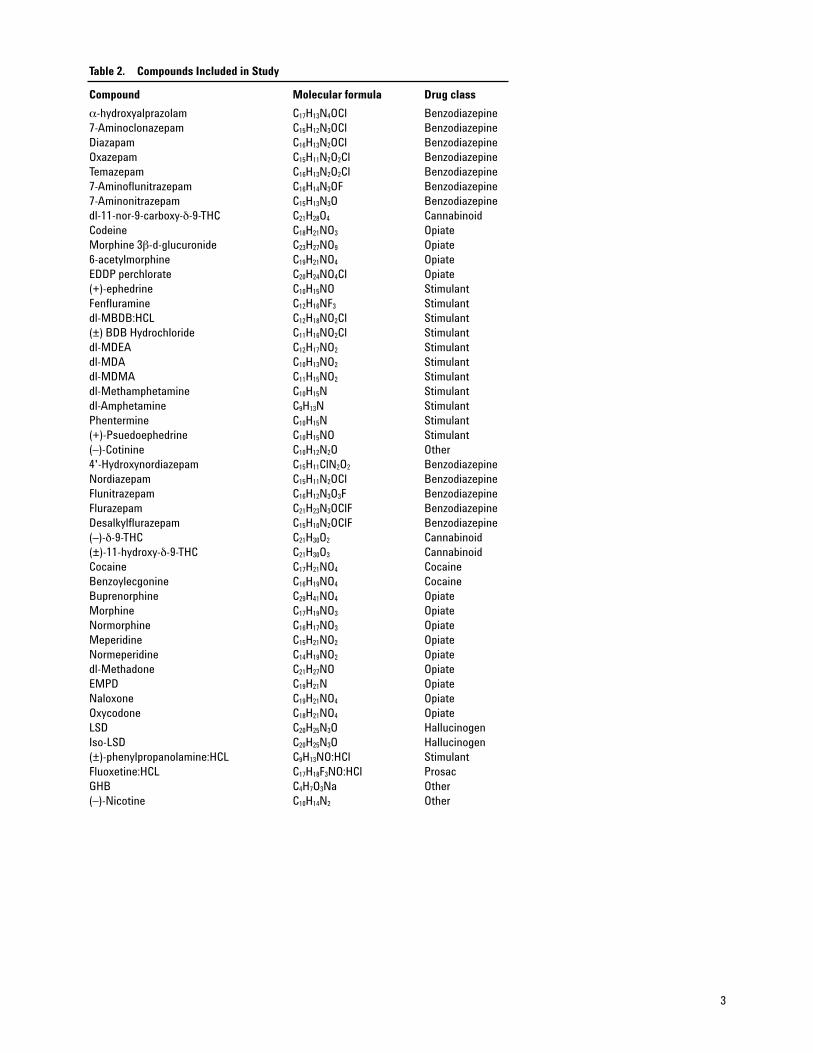
The compounds studied and their molecular formulas are shown in Table 2.
3
Table 2. Compounds Included in Study
Compound Molecular formula Drug class
α-hydroxyalprazolam C17H13N4OCl Benzodiazepine
7-Aminoclonazepam C15H12N3OCl Benzodiazepine
Diazapam C16H13N2OCl Benzodiazepine
Oxazepam C15H11N2O2Cl Benzodiazepine
Temazepam C16H13N2O2Cl Benzodiazepine
7-Aminoflunitrazepam C16H14N3OF Benzodiazepine
7-Aminonitrazepam C15H13N3O Benzodiazepine
dl-11-nor-9-carboxy-δ-9-THC C21H28O4 Cannabinoid
Codeine C18H21NO3 Opiate
Morphine 3β-d-glucuronide C23H27NO9 Opiate
6-acetylmorphine C19H21NO4 Opiate
EDDP perchlorate C20H24NO4Cl Opiate
(+)-ephedrine C10H15NO Stimulant
Fenfluramine C12H16NF3 Stimulant
dl-MBDB:HCL C12H18NO2Cl Stimulant
(±) BDB Hydrochloride C11H16NO2Cl Stimulant
dl-MDEA C12H17NO2 Stimulant
dl-MDA C10H13NO2 Stimulant
dl-MDMA C11H15NO2 Stimulant
dl-Methamphetamine C10H15N Stimulant
dl-Amphetamine C9H13N Stimulant
Phentermine C10H15N Stimulant
(+)-Psuedoephedrine C10H15NO Stimulant
(–)-Cotinine C10H12N2O Other
4'-Hydroxynordiazepam C15H11ClN2O2 Benzodiazepine
Nordiazepam C15H11N2OCl Benzodiazepine
Flunitrazepam C16H12N3O3F Benzodiazepine
Flurazepam C21H23N3OClF Benzodiazepine
Desalkylflurazepam C15H10N2OClF Benzodiazepine
(–)-δ-9-THC C21H30O2 Cannabinoid
(±)-11-hydroxy-δ-9-THC C21H30O3 Cannabinoid
Cocaine C17H21NO4 Cocaine
Benzoylecgonine C16H19NO4 Cocaine
Buprenorphine C29H41NO4 Opiate
Morphine C17H19NO3 Opiate
Normorphine C16H17NO3 Opiate
Meperidine C15H21NO2 Opiate
Normeperidine C14H19NO2 Opiate
dl-Methadone C21H27NO Opiate
EMPD C19H21N Opiate
Naloxone C19H21NO4 Opiate
Oxycodone C18H21NO4 Opiate
LSD C20H25N3O Hallucinogen
Iso-LSD C20H25N3O Hallucinogen
(±)-phenylpropanolamine:HCL C9H13NO:HCl Stimulant
Fluoxetine:HCL C17H18F3NO:HCl Prosac
GHB C4H7O3Na Other
(–)-Nicotine C10H14N2 Other
4
Methodology
The work undertaken in this study was performedon an Agilent 1100 system consisting of:
Binary pumpStandard auto-samplerThermostated column compartmentDiode Array Detector (DAD)G1969 LC/MSD TOF.
Instrument Conditions
PumpTime % Water % Methanol Flow rate(min) (0.1% formic acid) (0.1% formic acid) (mL/min)
0 90 10 0.4
4 90 10 0.4
22 0 100 0.4
29 0 100 0.4
29.6 90 10 0.4
30 90 10 0.4
Reference Mass Introduction with LC-TOF
The Agilent TOF MS uses a reference mass in thegeneration of reliable high level accurate mass.The electro-spray source for the TOF is a uniquedual spray assembly that allows the simultaneousconstant introduction of a reference mass component.
The reference mix 1 used in these experimentsconsists of 2 mL of purine and 0.8 mL of HP-0921.This mixture was prepared in 1 L of 90:10methanol:water to better represent the mobilephase.
The control software enables the use of the following reference masses:
Positive Ion Detection121.050873922.009798
Analysis of Drugs of Abuse by LC-TOF MS
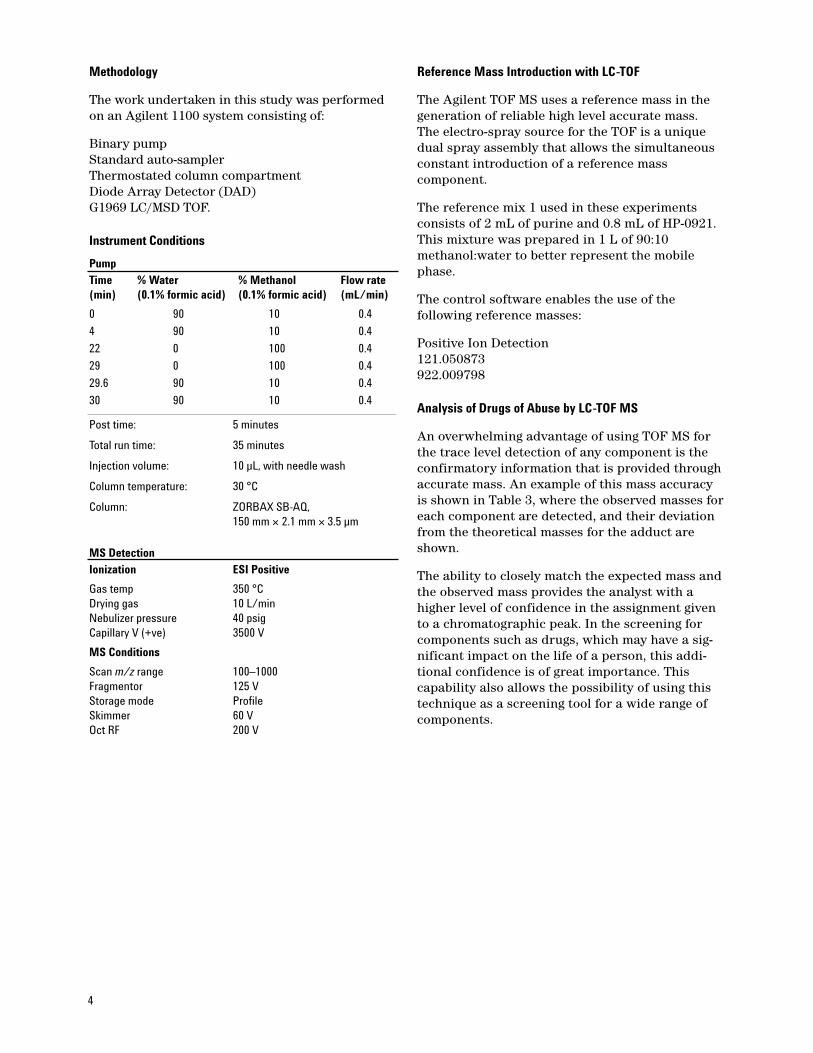
An overwhelming advantage of using TOF MS forthe trace level detection of any component is theconfirmatory information that is provided throughaccurate mass. An example of this mass accuracyis shown in Table 3, where the observed masses foreach component are detected, and their deviationfrom the theoretical masses for the adduct areshown.
The ability to closely match the expected mass andthe observed mass provides the analyst with ahigher level of confidence in the assignment givento a chromatographic peak. In the screening forcomponents such as drugs, which may have a sig-nificant impact on the life of a person, this addi-tional confidence is of great importance. Thiscapability also allows the possibility of using thistechnique as a screening tool for a wide range ofcomponents.
Post time: 5 minutes
Total run time: 35 minutes
Injection volume: 10 µL, with needle wash
Column temperature: 30 °C
Column: ZORBAX SB-AQ,
150 mm × 2.1 mm × 3.5 µm
MS DetectionIonization ESI Positive
Gas temp 350 °C
Drying gas 10 L/min
Nebulizer pressure 40 psig
Capillary V (+ve) 3500 V
MS Conditions
Scan m/z range 100–1000
Fragmentor 125 V
Storage mode Profile
Skimmer 60 V
Oct RF 200 V
5
Table 3. Theoretical Accurate Mass, Observed Mass and Mass Error
Compound Monoisotopic Retention Observed Adduct Mass error mass time Adduct mass accurate mass (ppm)
α-Hydroxyalprazolam 324.0778 17.76 [M+H]+ 325.0852 325.0850 0.41
7-Aminoclonazepam 285.0669 13.32 [M+H]+ 286.0739 286.0741 –0.93
Diazapam 284.0716 19.15 [M+H]+ 285.0796 285.0789 2.39
Oxazepam 286.0509 17.4 [M+H]+ 287.0579 287.0581 –0.98
Temazepam 300.0666 18.2 [M+H]+ 301.0741 301.0738 0.89
7-Aminoflunitrazepam 283.1121 15.3 [M+H]+ 284.1191 284.1093 –0.94
7-Aminonitrazepam 251.1059 8.82 [M+H]+ 252.1134 251.1131 1.04
dl-11-nor-9-carboxy-δ-9-THC 344.1988 21.38 [M+H]+ 345.2061 345.2060 0.18
Codeine 299.1521 5.5 [M+H]+ 300.1592 300.1594 –0.73
Morphine 3 β-d-glucuronide 461.1686 1.7 [M+H]+ 462.1764 462.1758 1.17
6-Acetylmorphine 327.1471 8.9 [M+H]+ 328.1542 328.1543 –0.41
EDDP perchlorate 377.1394 15.42 [M-O4Cl]+ 278.1909 278.1903 2.06
(+)-Ephedrine 165.1154 2.46 [M+H]+ 166.1225 166.1226 –0.85
Fenfluramine 231.1235 12.9 [M+H]+ 232.1303 232.1307 –1.98
dl-MBDB:HCL 243.1026 10.63 [M-Cl]+ 208.1337 208.1332 2.37
(±) BDB hydrochloride 229.087 9.5 [M-Cl]+ 194.1181 194.1175 2.81
dl-MDEA 207.1259 9.6 [M+H]+ 208.1332 208.1332 –0.03
dl-MDA 179.0946 4.9 [M+H]+ 180.1019 180.1191 –0.03
dl-MDMA 193.1103 6.4 [M+H]+ 194.1174 194.1175 –0.08
dl-Methamphetamine 149.1204 3.85 [M+H]+ 150.1281 150.1277 2.49
dl-Amphetamine 135.1048 3.05 [M+H]+ 136.1125 136.112 3.11
Phentermine 149.1204 5.34 [M+H]+ 150.1278 150.1277 0.49
(+)-Psuedoephedrine 165.1154 2.76 [M+H]+ 166.1231 166.1226 2.76
(–)-Cotinine 176.095 2.56 [M+H]+ 177.1023 177.1022 0.34
4'-Hydroxynordiazepam 286.0509 14.23 [M+H]+ 287.0582 287.0581 0.06
Nordiazepam 270.056 18.1 [M+H]+ 271.0634 271.0632 0.49
Flunitrazepam 313.0863 18.1 [M+H]+ 314.0924 314.0935 –3.65
Flurazepam 387.1514 15.23 [M+H]+ 388.1591 388.1586 1.17
Desalkylflurazepam 288.0466 18.2 [M+H]+ 289.0535 289.0538 –1.19
(–)-δ-9-THC 314.2246 22.31 [M+H]+ 315.2328 315.2318 2.99
(±)-11-hydroxy-δ-9-THC 330.2195 21.07 [M+H]+ 331.2267 331.2267 –0.22
Cocaine 303.1471 12.6 [M+H]+ 304.1545 304.1543 0.54
Benzoylecgonine 289.1314 12.1 [M+H]+ 290.1386 290.1386 –0.29
Buprenorphine 467.3036 16.11 [M+H]+ 468.3107 468.3108 –0.29
Morphine 285.1365 2.2 [M+H]+ 286.1438 286.1437 –0.1
Normorphine 271.1208 2 [M+H]+ 272.1286 272.1281 1.7
Meperidine 247.1572 12.4 [M+H]+ 248.1652 248.1645 2.8
Normeperidine 233.1416 12.5 [M+H]+ 234.1493 234.1488 1.9
dl-Methadone 309.2093 16.72 [M+H]+ 310.2166 310.2165 0.19
EMPD 263.1674 16.4 [M+H]+ 264.1754 264.1746 2.7
Naloxone 327.1471 5.74 [M+H]+ 328.1541 328.1543 –0.72
Oxycodone 315.1471 7.2 [M+H]+ 316.1547 316.1543 1.15
LSD 323.1998 14.7 [M+H]+ 324.2073 324.207 0.8
Iso-LSD 323.1998 14.55 [M+H]+ 324.2078 324.207 2.34
(±)-Phenylpropanolamine:HCL 187.0764 1.95 [M-Cl]+ 152.1069 152.1069 –0.59
Fluoxetine:HCL 345.1107 16.3 [M-Cl]+ 310.1412 310.1413 1.85
GHB 126.0293 1.72 [M+H]+ 127.0369 127.0365 2.63
(–)-Nicotine 162.1157 1.6 [M+H]+ 163.1233 163.1229 1.99
2-oxo-3-hydroxy-LSD 355.1896 n.d. Not detected in +veESI
6
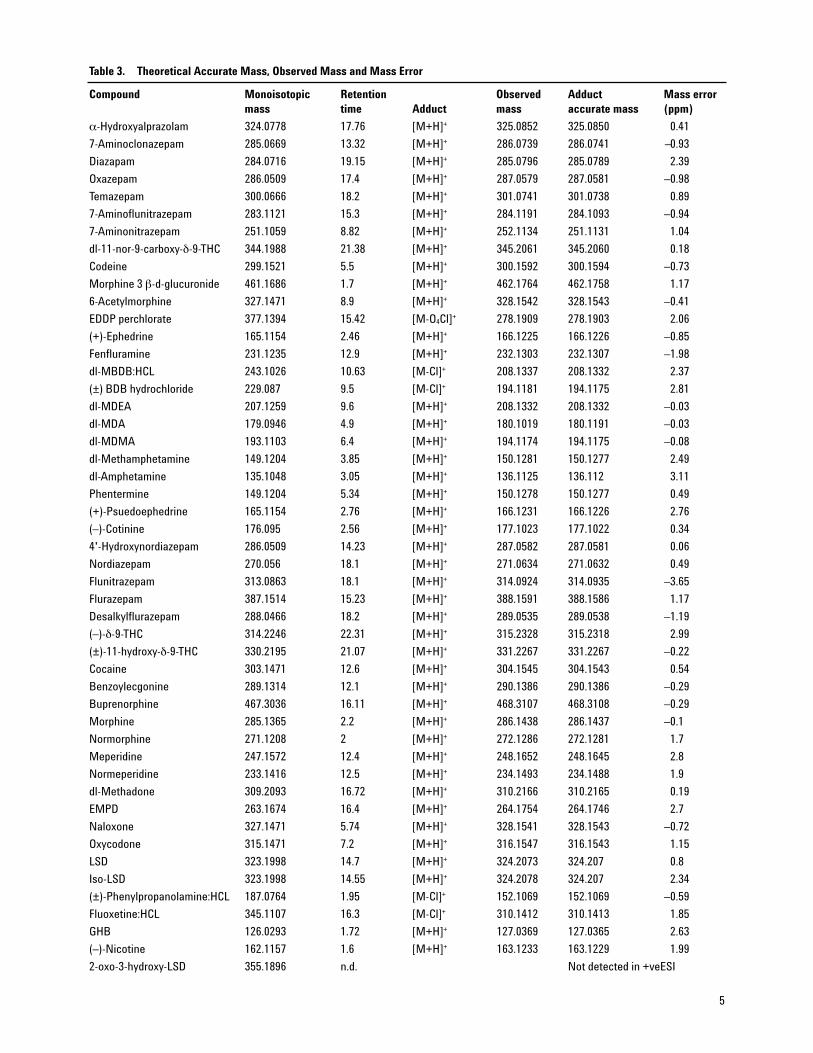
A greater than two-fold increase in sensitivity formany components is seen with the narrowing ofthe mass-extraction window. Figure 1 shows thereduction in noise that is observed with the extrac-tion of a smaller mass range for flunitrazepam,commonly known as Rohypnol, a date-rape drug.The ability of TOF-MS to accurately determine thepresence of components such as Rohypnol at lowlevels may assist with investigations into reportedabuse of the illicit substance, and prove to be acritical factor in confirmation when dealing withcomplex matrices.
1 amu window - S/N 1.6:1
1000 ppm window - S/N 1.8:1
100 ppm window - S/N 3.5:1
10 ppm window - S/N 4:1
Figure 1. Effect of extracted ion range on noise – 1 ng/mL flunitrazepam.
7
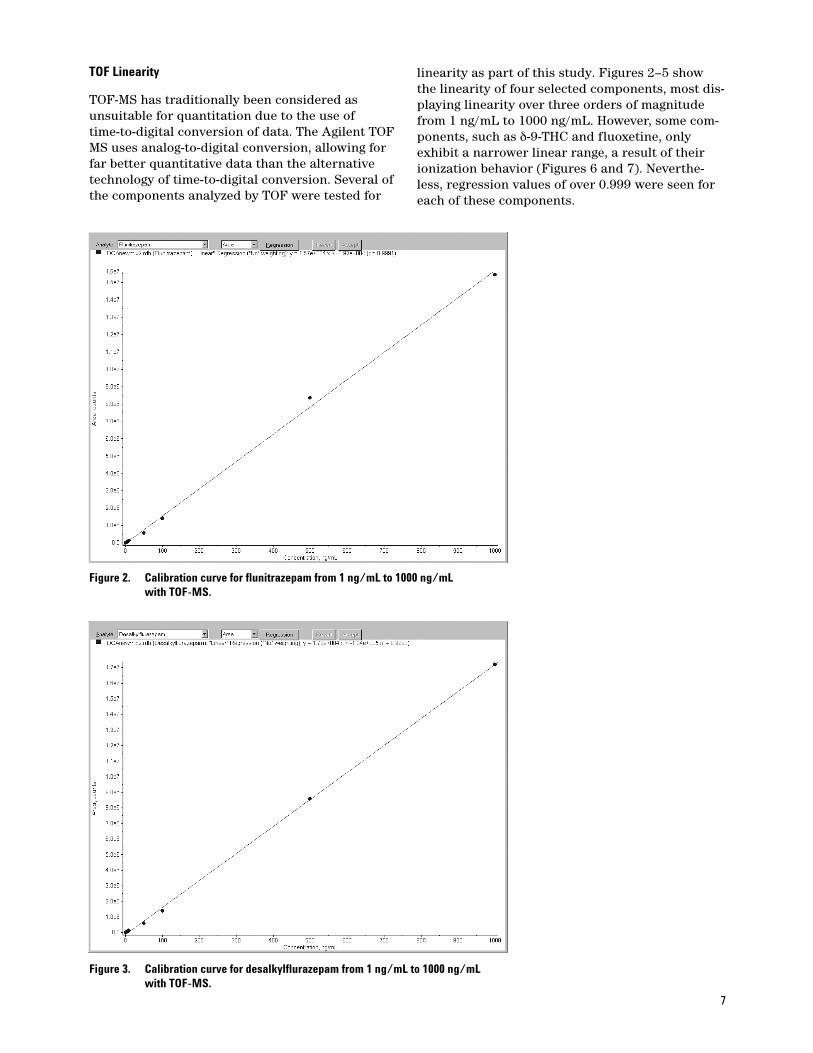
TOF Linearity
TOF-MS has traditionally been considered asunsuitable for quantitation due to the use of time-to-digital conversion of data. The Agilent TOFMS uses analog-to-digital conversion, allowing forfar better quantitative data than the alternativetechnology of time-to-digital conversion. Several ofthe components analyzed by TOF were tested for
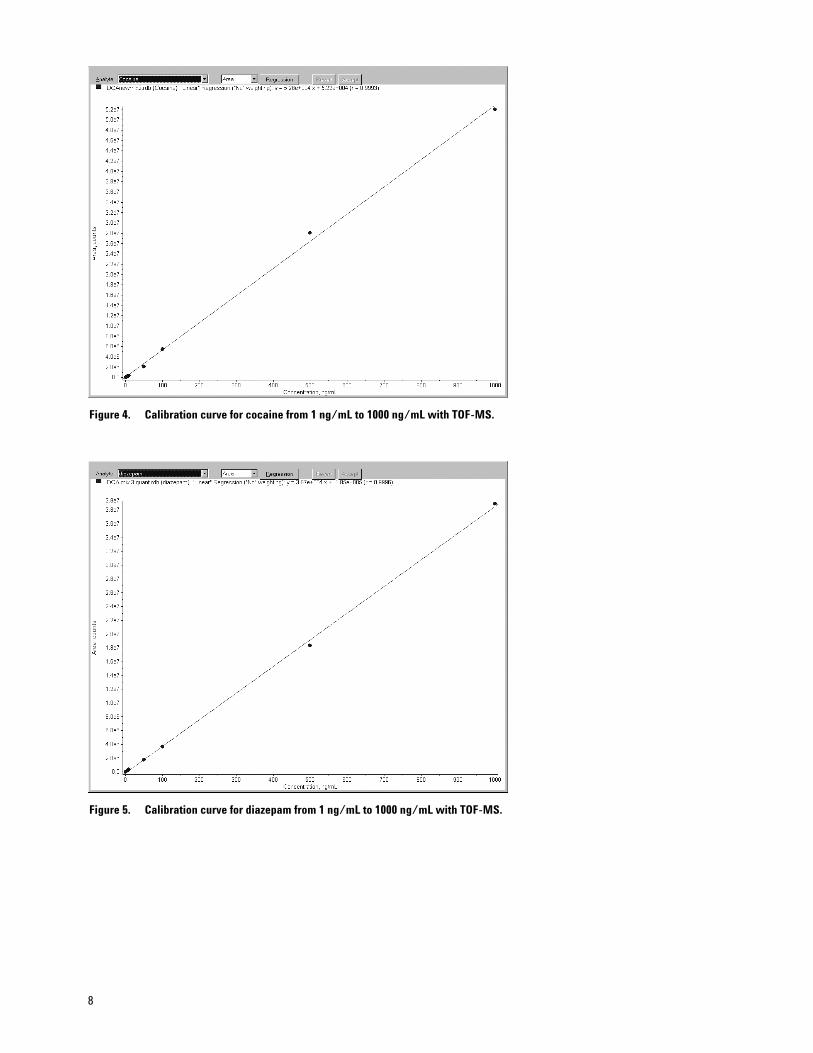
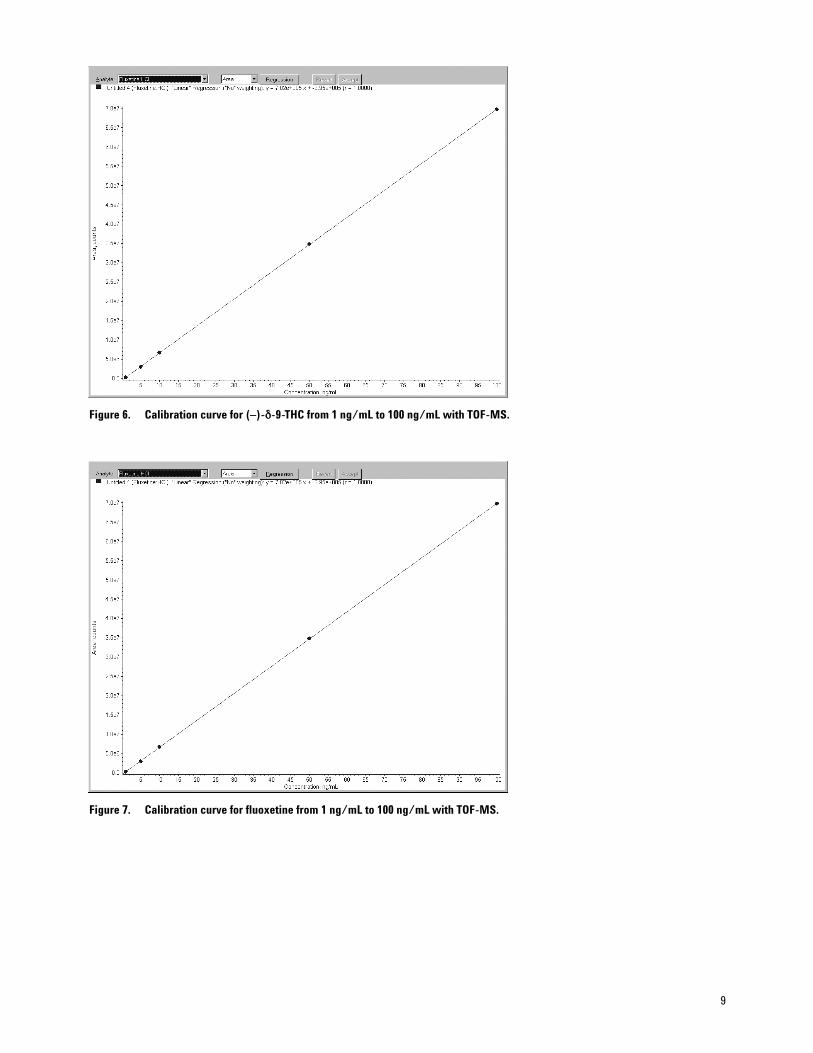
linearity as part of this study. Figures 2–5 showthe linearity of four selected components, most dis-playing linearity over three orders of magnitudefrom 1 ng/mL to 1000 ng/mL. However, some com-ponents, such as δ-9-THC and fluoxetine, onlyexhibit a narrower linear range, a result of theirionization behavior (Figures 6 and 7). Neverthe-less, regression values of over 0.999 were seen foreach of these components.
Figure 2. Calibration curve for flunitrazepam from 1 ng/mL to 1000 ng/mL with TOF-MS.
Figure 3. Calibration curve for desalkylflurazepam from 1 ng/mL to 1000 ng/mL with TOF-MS.
8
Figure 4. Calibration curve for cocaine from 1 ng/mL to 1000 ng/mL with TOF-MS.
Figure 5. Calibration curve for diazepam from 1 ng/mL to 1000 ng/mL with TOF-MS.
9
Figure 6. Calibration curve for (–)-δ-9-THC from 1 ng/mL to 100 ng/mL with TOF-MS.
Figure 7. Calibration curve for fluoxetine from 1 ng/mL to 100 ng/mL with TOF-MS.
10
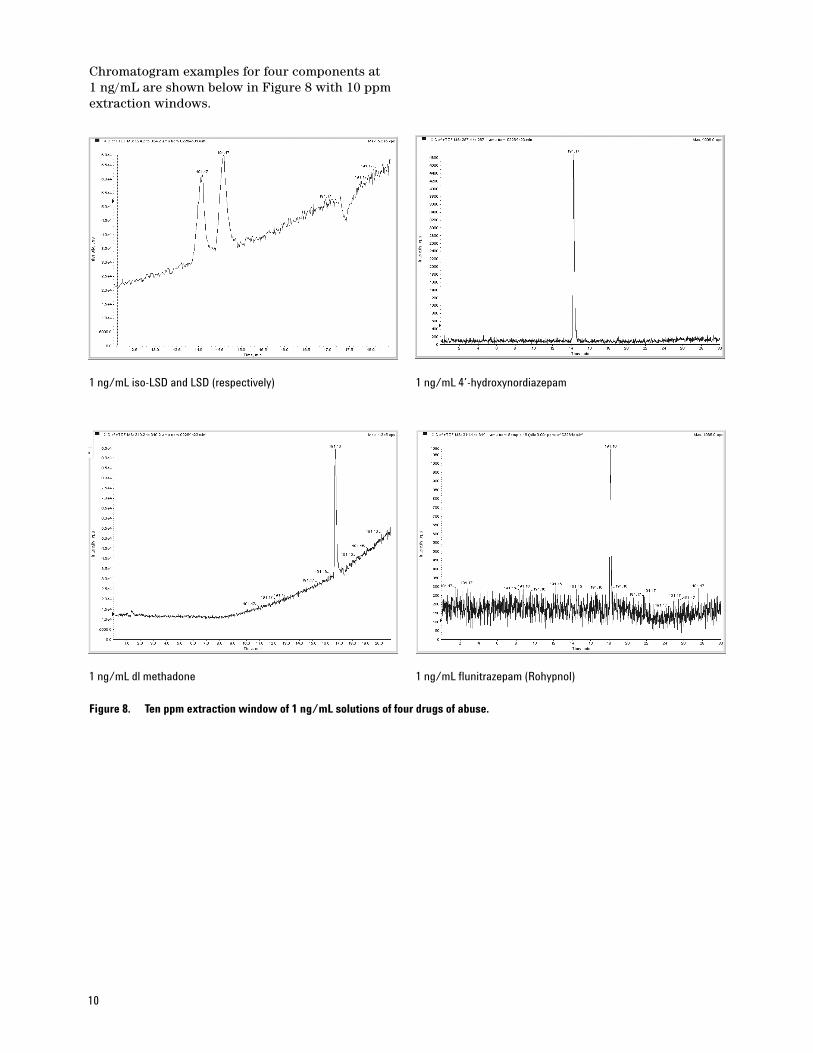
Chromatogram examples for four components at 1 ng/mL are shown below in Figure 8 with 10 ppmextraction windows.
1 ng/mL iso-LSD and LSD (respectively)
Figure 8. Ten ppm extraction window of 1 ng/mL solutions of four drugs of abuse.
1 ng/mL 4’-hydroxynordiazepam
1 ng/mL dl methadone 1 ng/mL flunitrazepam (Rohypnol)
11
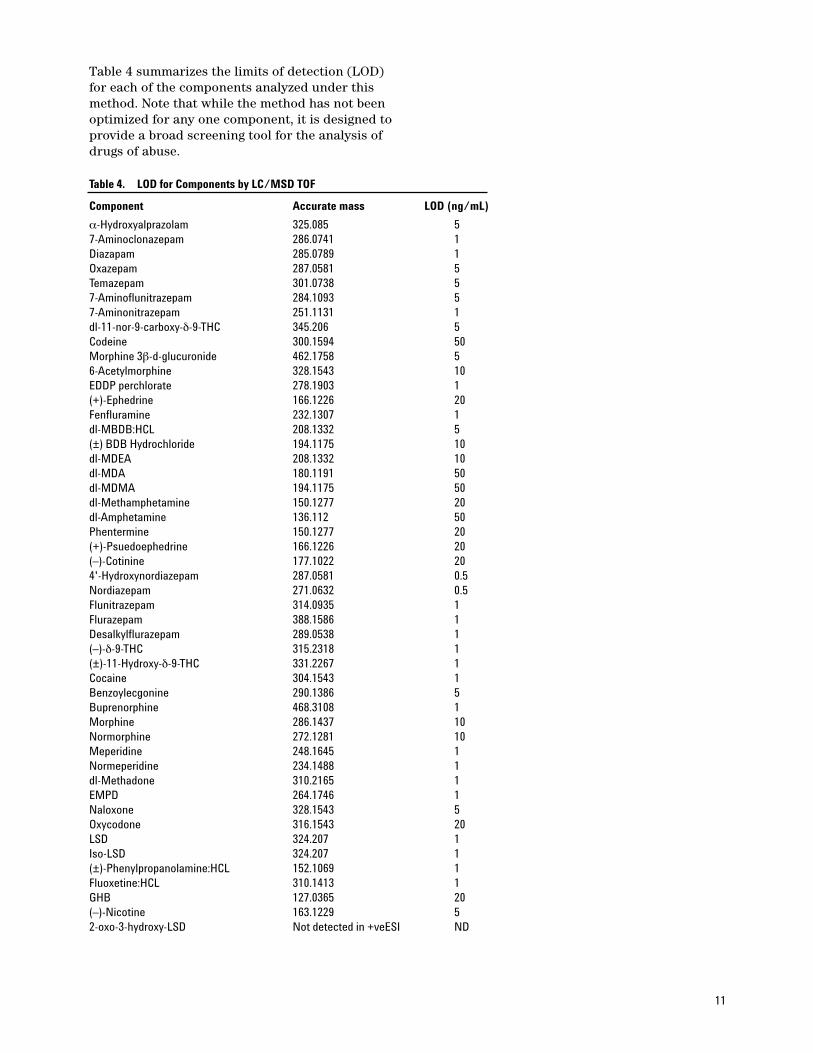
Table 4 summarizes the limits of detection (LOD)for each of the components analyzed under thismethod. Note that while the method has not beenoptimized for any one component, it is designed toprovide a broad screening tool for the analysis ofdrugs of abuse.
Table 4. LOD for Components by LC/MSD TOF
Component Accurate mass LOD (ng/mL)
α-Hydroxyalprazolam 325.085 5
7-Aminoclonazepam 286.0741 1
Diazapam 285.0789 1
Oxazepam 287.0581 5
Temazepam 301.0738 5
7-Aminoflunitrazepam 284.1093 5
7-Aminonitrazepam 251.1131 1
dl-11-nor-9-carboxy-δ-9-THC 345.206 5
Codeine 300.1594 50
Morphine 3β-d-glucuronide 462.1758 5
6-Acetylmorphine 328.1543 10
EDDP perchlorate 278.1903 1
(+)-Ephedrine 166.1226 20
Fenfluramine 232.1307 1
dl-MBDB:HCL 208.1332 5
(±) BDB Hydrochloride 194.1175 10
dl-MDEA 208.1332 10
dl-MDA 180.1191 50
dl-MDMA 194.1175 50
dl-Methamphetamine 150.1277 20
dl-Amphetamine 136.112 50
Phentermine 150.1277 20
(+)-Psuedoephedrine 166.1226 20
(–)-Cotinine 177.1022 20
4'-Hydroxynordiazepam 287.0581 0.5
Nordiazepam 271.0632 0.5
Flunitrazepam 314.0935 1
Flurazepam 388.1586 1
Desalkylflurazepam 289.0538 1
(–)-δ-9-THC 315.2318 1
(±)-11-Hydroxy-δ-9-THC 331.2267 1
Cocaine 304.1543 1
Benzoylecgonine 290.1386 5
Buprenorphine 468.3108 1
Morphine 286.1437 10
Normorphine 272.1281 10
Meperidine 248.1645 1
Normeperidine 234.1488 1
dl-Methadone 310.2165 1
EMPD 264.1746 1
Naloxone 328.1543 5
Oxycodone 316.1543 20
LSD 324.207 1
Iso-LSD 324.207 1
(±)-Phenylpropanolamine:HCL 152.1069 1
Fluoxetine:HCL 310.1413 1
GHB 127.0365 20
(–)-Nicotine 163.1229 5
2-oxo-3-hydroxy-LSD Not detected in +veESI ND
12
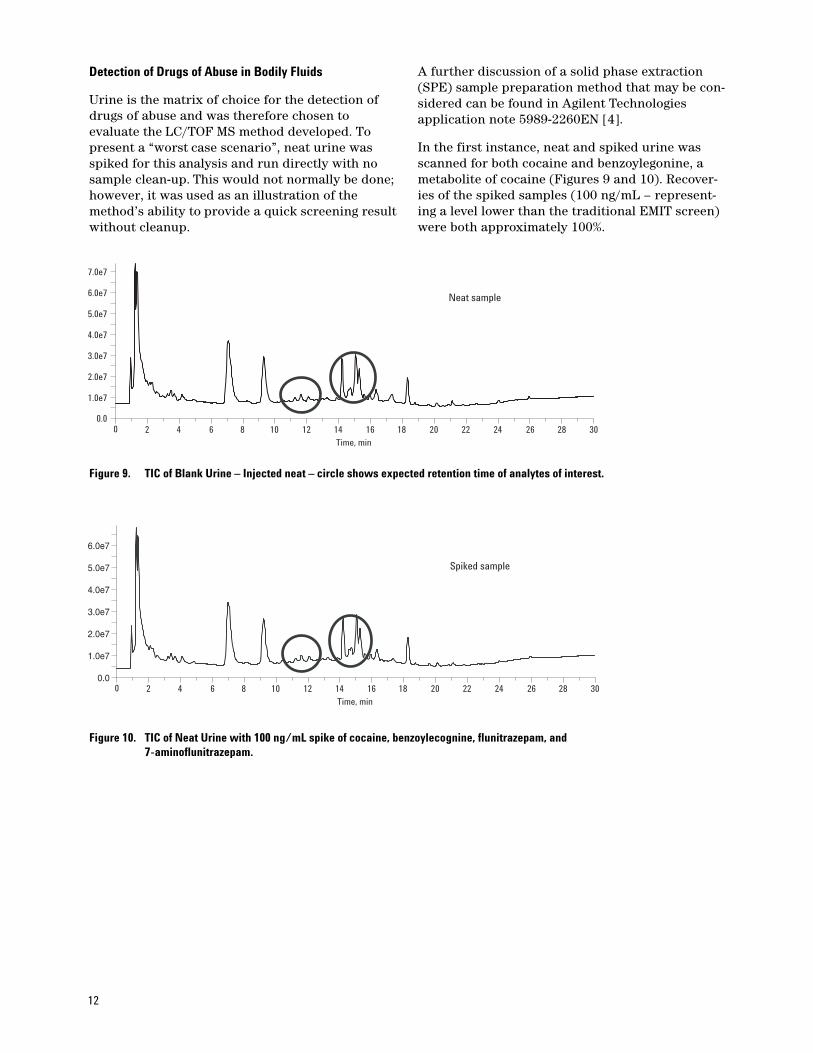
Detection of Drugs of Abuse in Bodily Fluids
Urine is the matrix of choice for the detection of drugs of abuse and was therefore chosen to evaluate the LC/TOF MS method developed. To present a “worst case scenario”, neat urine was spiked for this analysis and run directly with no sample clean-up. This would not normally be done; however, it was used as an illustration of the method’s ability to provide a quick screening result without cleanup.
A further discussion of a solid phase extraction(SPE) sample preparation method that may be con-sidered can be found in Agilent Technologies application note 5989-2260EN [4].
In the first instance, neat and spiked urine wasscanned for both cocaine and benzoylegonine, ametabolite of cocaine (Figures 9 and 10). Recover-ies of the spiked samples (100 ng/mL – represent-ing a level lower than the traditional EMIT screen)were both approximately 100%.
2 4 6 8 10 12 14
Time, min
16 18 20 22 24
Neat sample
26 28 300
1.0e7
0.0
2.0e7
3.0e7
4.0e7
5.0e7
6.0e7
7.0e7
Figure 9. TIC of Blank Urine – Injected neat – circle shows expected retention time of analytes of interest.
1.0e7
0.0
2.0e7
3.0e7
4.0e7
5.0e7
6.0e7
Spiked sample
2 4 6 8 10 12 14
Time, min
16 18 20 22 24 26 28 300
Figure 10. TIC of Neat Urine with 100 ng/mL spike of cocaine, benzoylecognine, flunitrazepam, and 7-aminoflunitrazepam.
13
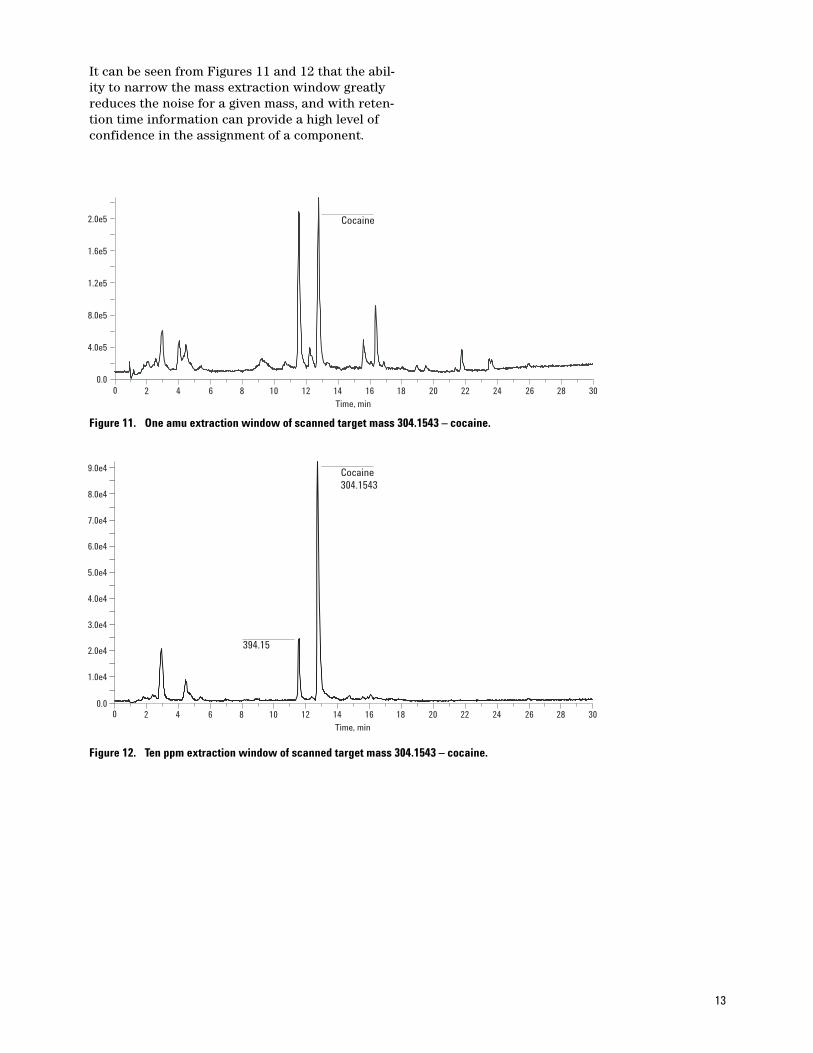
It can be seen from Figures 11 and 12 that the abil-ity to narrow the mass extraction window greatlyreduces the noise for a given mass, and with reten-tion time information can provide a high level ofconfidence in the assignment of a component.
0.0
4.0e5
8.0e5
1.2e5
1.6e5
2.0e5 Cocaine
2 4 6 8 10 12 14
Time, min
16 18 20 22 24 26 28 300
Figure 11. One amu extraction window of scanned target mass 304.1543 – cocaine.
2 4 6 8 10 12 14
Time, min
16 18 20 22 24 26 28 300
Cocaine304.1543
394.15
0.0
1.0e4
2.0e4
3.0e4
4.0e4
5.0e4
6.0e4
7.0e4
8.0e4
9.0e4
Figure 12. Ten ppm extraction window of scanned target mass 304.1543 – cocaine.
14
303.0 304.0 305.0
m/z, amu
306.0 307.0 308.0 309.0 310.0302.0
Max. 2.0e5 countsCocaine304.1543
0.0
1.0e4
2.0e4
3.0e4
4.0e4
5.0e4
6.0e4
7.0e4
8.0e4
Inte
nsity
, cou
nts
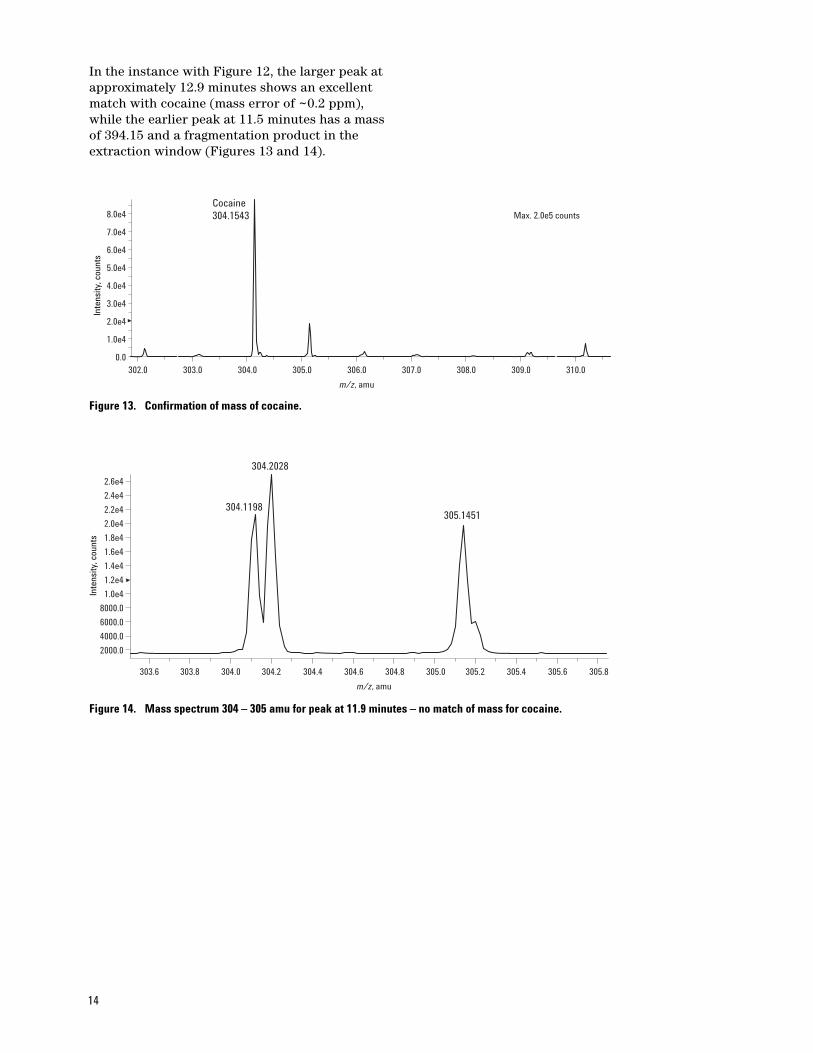
Figure 13. Confirmation of mass of cocaine.
2000.0
4000.0
6000.0
8000.0
1.0e4
1.2e4
1.4e4
1.6e4
1.8e4
2.0e4
2.2e4
2.4e4
2.6e4
303.8 304.0 304.2
m/z, amu
304.4 304.6 304.8 305.0 305.2 305.4 305.6 305.8303.6
304.2028
304.1198305.1451
Inte
nsity
, cou
nts
Figure 14. Mass spectrum 304 – 305 amu for peak at 11.9 minutes – no match of mass for cocaine.
In the instance with Figure 12, the larger peak atapproximately 12.9 minutes shows an excellentmatch with cocaine (mass error of ~0.2 ppm),while the earlier peak at 11.5 minutes has a massof 394.15 and a fragmentation product in theextraction window (Figures 13 and 14).
15
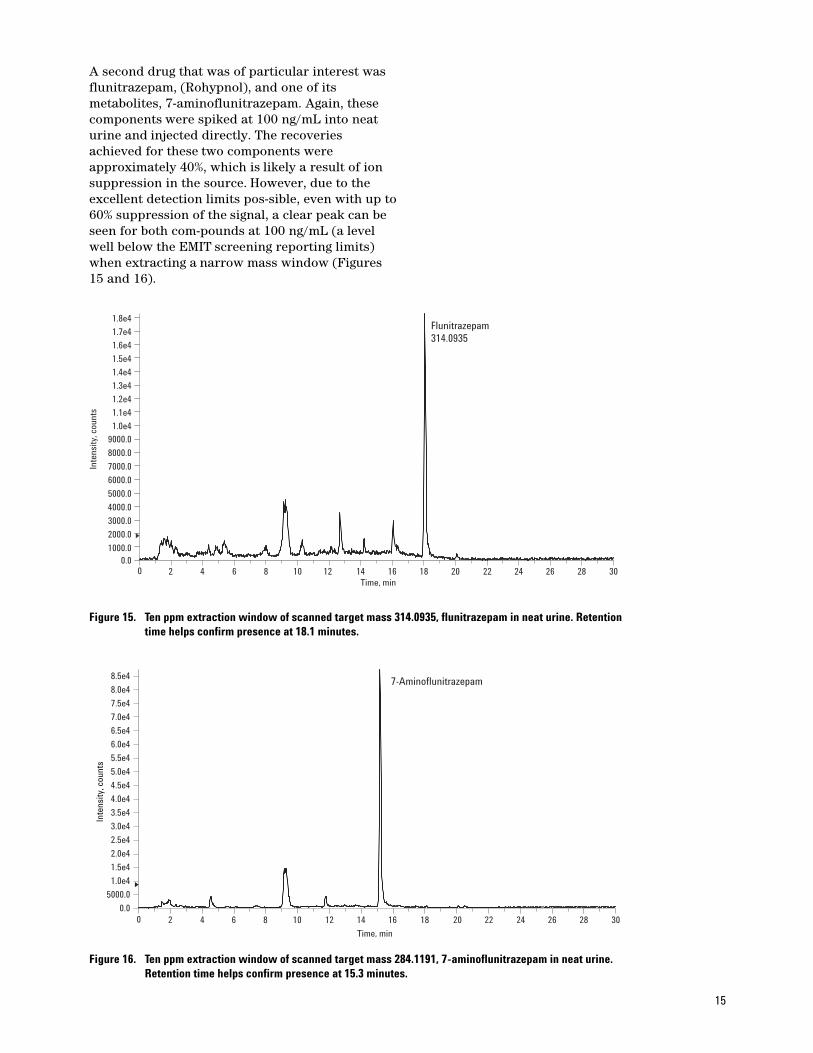
A second drug that was of particular interest was flunitrazepam, (Rohypnol), and one of its metabolites, 7-aminoflunitrazepam. Again, these components were spiked at 100 ng/mL into neat urine and injected directly. The recoveries achieved for these two components were approximately 40%, which is likely a result of ion suppression in the source. However, due to the excellent detection limits pos-sible, even with up to 60% suppression of the signal, a clear peak can be seen for both com-pounds at 100 ng/mL (a level well below the EMIT screening reporting limits) when extracting a narrow mass window (Figures 15 and 16).
Flunitrazepam314.0935
1000.00.0
2000.0
3000.0
4000.0
5000.0
6000.0
7000.0
8000.0
9000.0
1.0e4
1.1e4
1.2e4
1.3e4
1.4e4
1.5e4
1.6e4
1.7e4
1.8e4
Inte
nsity
, cou
nts
2 4 6 8 10 12 14Time, min
16 18 20 22 24 26 28 300
Figure 15. Ten ppm extraction window of scanned target mass 314.0935, flunitrazepam in neat urine. Retentiontime helps confirm presence at 18.1 minutes.
7-Aminoflunitrazepam
0.0
5000.0
1.0e4
1.5e4
2.0e4
2.5e4
3.0e4
3.5e4
4.0e4
4.5e4
5.0e4
5.5e4
6.0e4
6.5e4
7.0e4
7.5e4
8.0e4
8.5e4
Inte
nsity
, cou
nts
2 4 6 8 10 12 14
Time, min
16 18 20 22 24 26 28 300
Figure 16. Ten ppm extraction window of scanned target mass 284.1191, 7-aminoflunitrazepam in neat urine.Retention time helps confirm presence at 15.3 minutes.
16
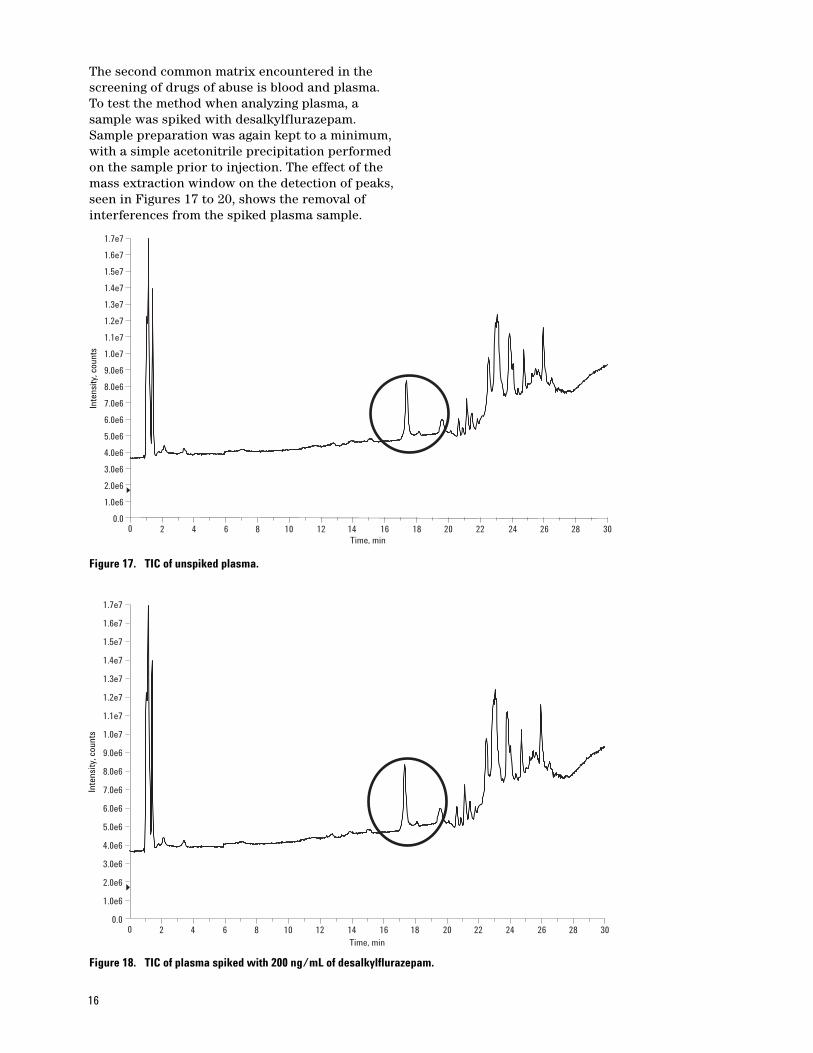
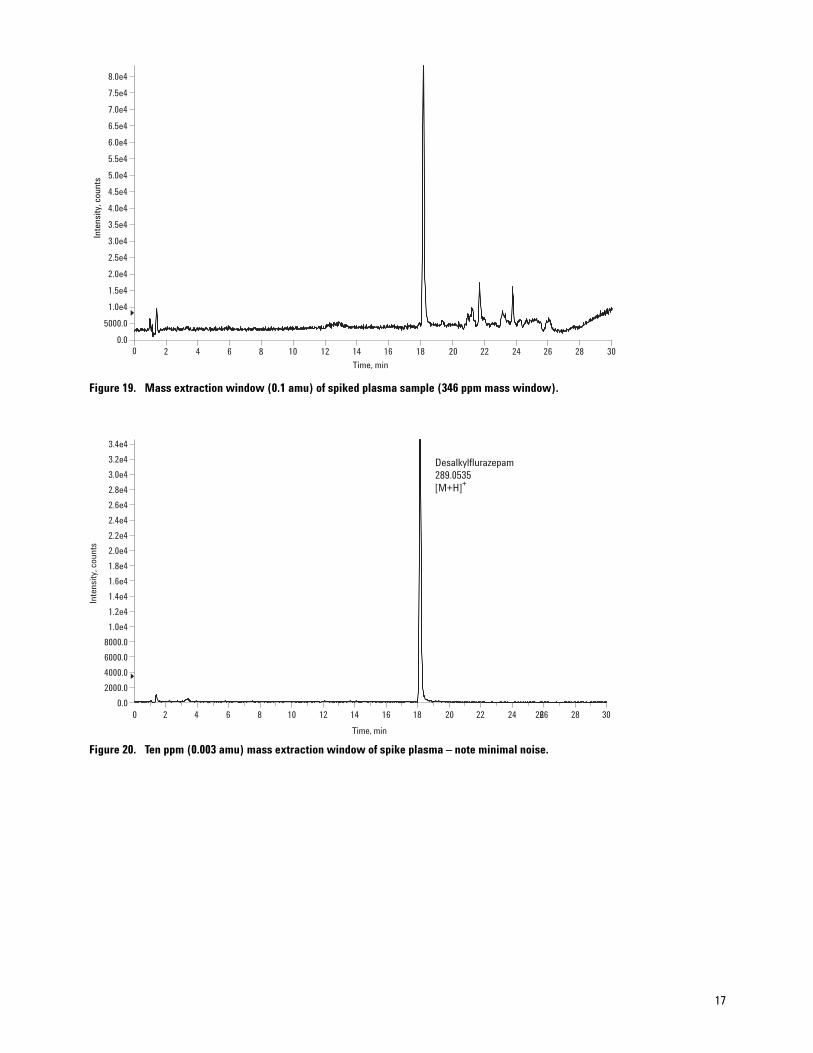
The second common matrix encountered in thescreening of drugs of abuse is blood and plasma.To test the method when analyzing plasma, asample was spiked with desalkylflurazepam.Sample preparation was again kept to a minimum,with a simple acetonitrile precipitation performedon the sample prior to injection. The effect of themass extraction window on the detection of peaks,seen in Figures 17 to 20, shows the removal ofinterferences from the spiked plasma sample.
2 4 6 8 10 12 14Time, min
16 18 20 22 24 26 28 3000.0
1.0e6
2.0e6
3.0e6
4.0e6
5.0e6
6.0e6
7.0e6
8.0e6
9.0e6
1.0e7
1.1e7
1.2e7
1.3e7
1.4e7
1.5e7
1.6e7
1.7e7
Inte
nsity
, cou
nts
Figure 17. TIC of unspiked plasma.
0.0
1.0e6
2.0e6
3.0e6
4.0e6
5.0e6
6.0e6
7.0e6
8.0e6
9.0e6
1.0e7
1.1e7
1.2e7
1.3e7
1.4e7
1.5e7
1.6e7
1.7e7
Inte
nsity
, cou
nts
2 4 6 8 10 12 14Time, min
16 18 20 22 24 26 28 300
Figure 18. TIC of plasma spiked with 200 ng/mL of desalkylflurazepam.
17
0.0
5000.0
1.0e4
1.5e4
2.0e4
2.5e4
3.0e4
3.5e4
4.0e4
4.5e4
5.0e4
5.5e4
6.0e4
6.5e4
7.0e4
7.5e4
8.0e4
Inte
nsity
, cou
nts
2 4 6 8 10 12 14
Time, min
16 18 20 22 24 26 28 300
Figure 19. Mass extraction window (0.1 amu) of spiked plasma sample (346 ppm mass window).
20 4 6 8 10 12 14
Time, min
Desalkylflurazepam289.0535[M+H]+
16 18 20 22 24 26 28 300.0
2000.0
4000.0
6000.0
8000.0
1.0e4
1.2e4
1.4e4
1.6e4
1.8e4
2.0e4
2.2e4
Inte
nsity
, cou
nts
2.4e4
2.6e4
2.8e4
3.0e4
3.2e4
3.4e4
26
Figure 20. Ten ppm (0.003 amu) mass extraction window of spike plasma – note minimal noise.
18
Analysis of Coronial Samples – Using a ScreenerDatabase
The instrumentation and software provides theuser the ability to create a screener database forall components they wish to automatically screenfor. The minimum requirement for this database isthe empirical formula and name for the componentof interest, although the inclusion of a retentiontime will assist with confidence in the confirmation and reduce analysis time.
Several samples were acquired from the local coro-nial office to test the procedure that was devel-oped. These samples were provided as butylchloride extracts of blood samples obtained fromdeceased persons, for screening using the developed method.
The coronial samples supplied were screened usinga database created from the 48 components analyzed under this method.
Sample Preparation
Samples were obtained from 1-mL blood volumes,liquid-liquid extracted with 6–8 mL of butyl chloride following centrifugation. Organic layerevaporated to dryness and then reconstituted in100-µL mobile phase for a final 10-fold concentration.
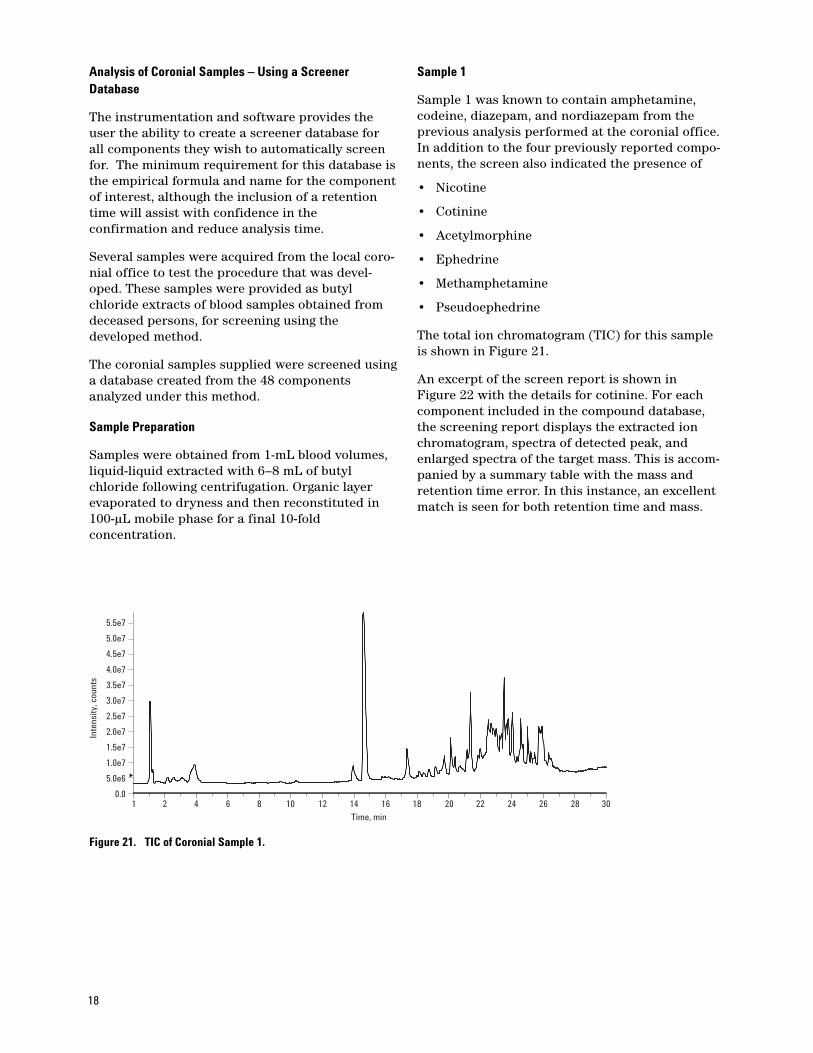
Sample 1
Sample 1 was known to contain amphetamine,codeine, diazepam, and nordiazepam from the previous analysis performed at the coronial office.In addition to the four previously reported compo-nents, the screen also indicated the presence of
• Nicotine
• Cotinine
• Acetylmorphine
• Ephedrine
• Methamphetamine
• Pseudoephedrine
The total ion chromatogram (TIC) for this sampleis shown in Figure 21.
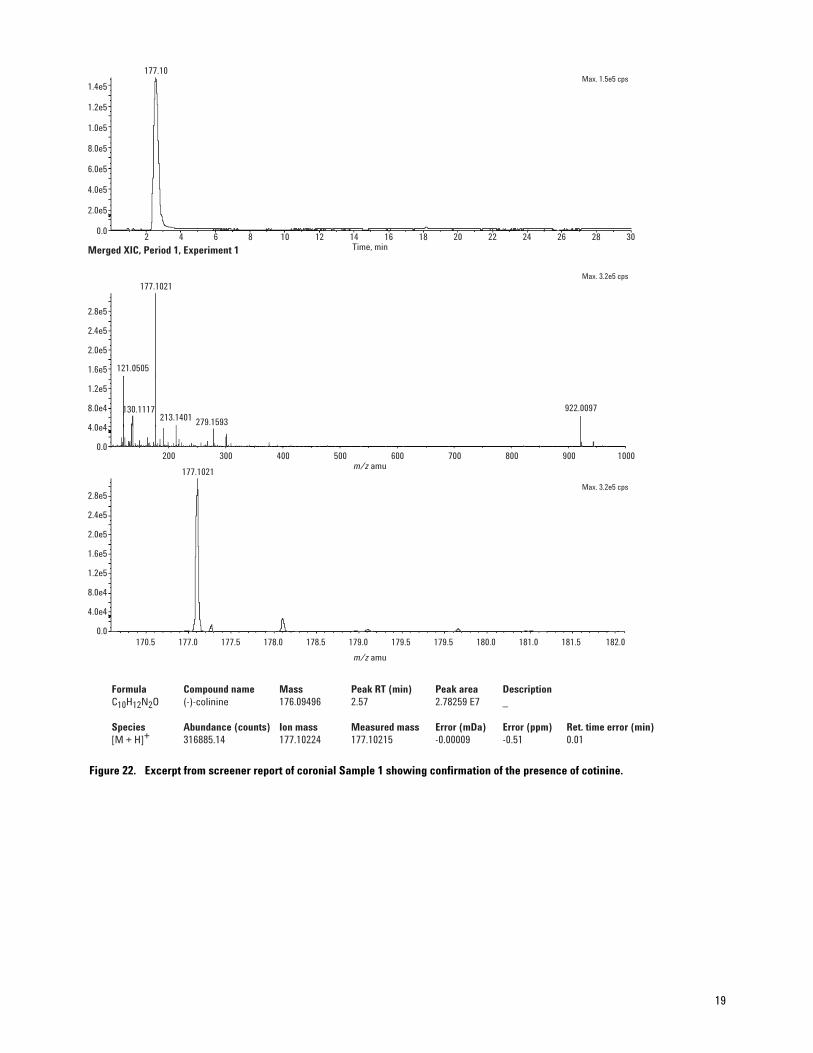
An excerpt of the screen report is shown in Figure 22 with the details for cotinine. For eachcomponent included in the compound database,the screening report displays the extracted ionchromatogram, spectra of detected peak, andenlarged spectra of the target mass. This is accom-panied by a summary table with the mass andretention time error. In this instance, an excellentmatch is seen for both retention time and mass.
0.0
5.0e6
1.0e7
1.5e7
2.0e7
2.5e7
3.0e7
Inte
nsity
, cou
nts
3.5e7
4.0e7
4.5e7
5.0e7
5.5e7
21 4 6 8 10 12 14 16 18 20 22 24 26 28 30
Time, min
Figure 21. TIC of Coronial Sample 1.
19
Merged XIC, Period 1, Experiment 1
Max. 1.5e5 cps
Max. 3.2e5 cps
Max. 3.2e5 cps
0.02 4 6
177.10
8 10 12 14 16 18 20 22 24 26 28 30
2.0e5
4.0e5
6.0e5
8.0e5
1.0e5
1.2e5
1.4e5
0.0
4.0e4
8.0e4
1.2e5
1.6e5
2.0e5
2.4e5
2.8e5
0.0
4.0e4
8.0e4
1.2e5
1.6e5
2.0e5
2.4e5
2.8e5
Time, min
200
170.5 177.0 177.5 178.0 178.5 179.0 179.5 179.5 180.0 181.0 181.5 182.0
300
177.1021
121.0505
130.1117213.1401
279.1593
922.0097
177.1021
400 500 600 700 800 900 1000m/z amu
m/z amu
Formula Compound name Mass Peak RT (min) Peak area DescriptionC10H12N2O (-)-colinine 176.09496 2.57 2.78259 E7 _
Species Abundance (counts) Ion mass Measured mass Error (mDa) Error (ppm) Ret. time error (min)[M + H]+ 316885.14 177.10224 177.10215 -0.00009 -0.51 0.01
Figure 22. Excerpt from screener report of coronial Sample 1 showing confirmation of the presence of cotinine.
20
The results obtained from the analysis of Sample 1suggest the deceased was a smoker, with the pres-ence of both the nicotine and cotinine in thesample.
Sample 2
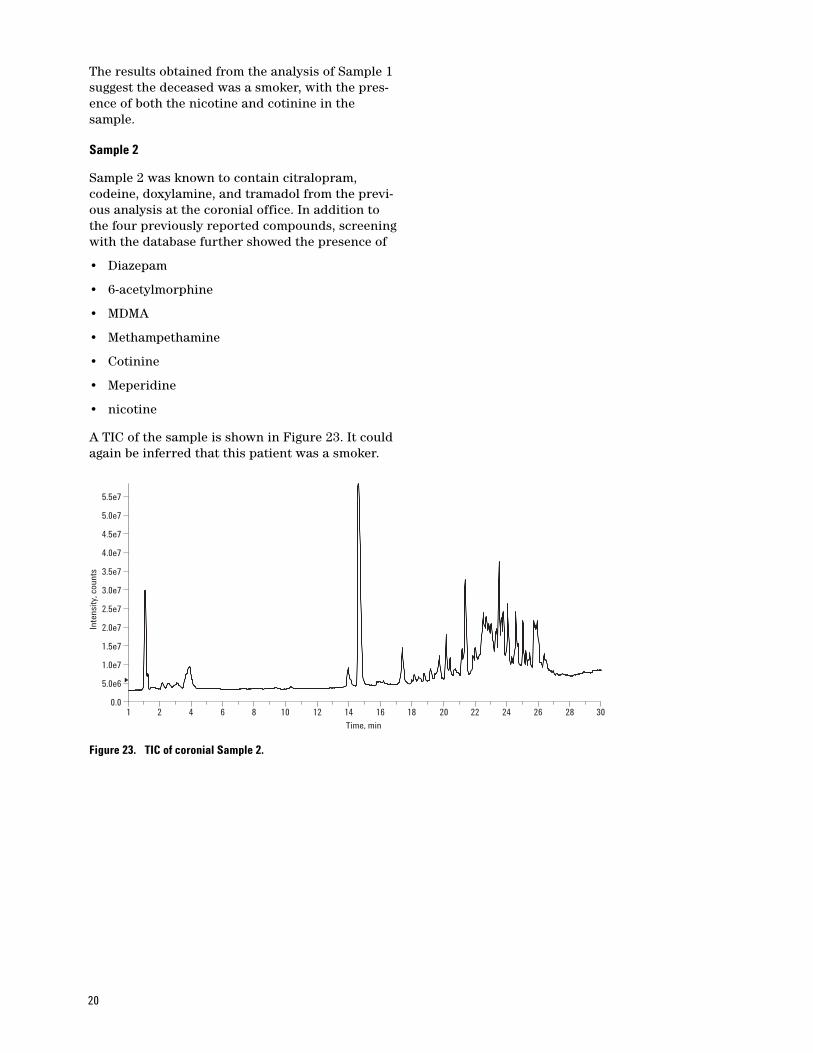
Sample 2 was known to contain citralopram,codeine, doxylamine, and tramadol from the previ-ous analysis at the coronial office. In addition tothe four previously reported compounds, screeningwith the database further showed the presence of
• Diazepam
• 6-acetylmorphine
• MDMA
• Methampethamine
• Cotinine
• Meperidine
• nicotine
A TIC of the sample is shown in Figure 23. It couldagain be inferred that this patient was a smoker.
0.0
5.0e6
1.0e7
1.5e7
2.0e7
2.5e7
3.0e7
Inte
nsity
, cou
nts 3.5e7
4.0e7
4.5e7
5.0e7
5.5e7
21 4 6 8 10 12 14 16 18 20 22 24 26 28 30
Time, min
Figure 23. TIC of coronial Sample 2.
21
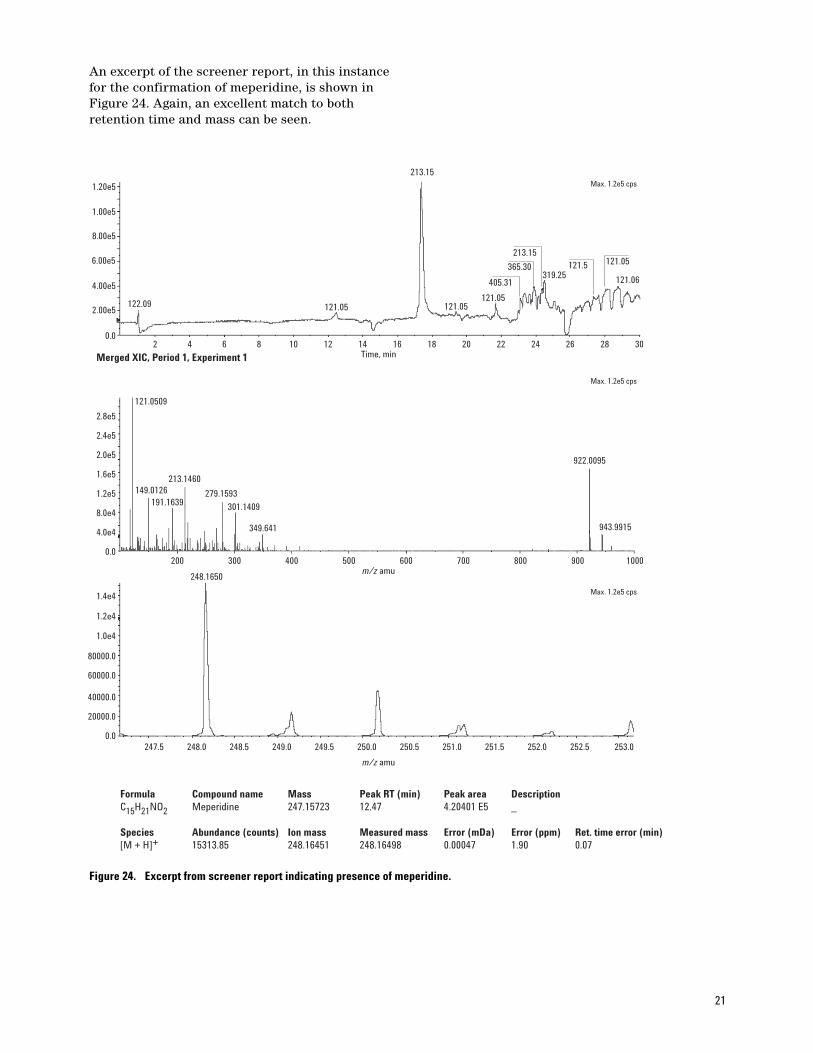
An excerpt of the screener report, in this instancefor the confirmation of meperidine, is shown inFigure 24. Again, an excellent match to both retention time and mass can be seen.
Merged XIC, Period 1, Experiment 1
Max. 1.2e5 cps
Max. 1.2e5 cps
Max. 1.2e5 cps
0.02 4 6
122.09 121.05 121.05121.05
121.06
121.05
405.31
121.5213.15
319.25365.30
213.15
8 10 12 14 16 18 20 22 24 26 28 30
2.00e5
4.00e5
6.00e5
8.00e5
1.00e5
1.20e5
0.0
4.0e4
8.0e4
1.2e5
1.6e5
2.0e5
2.4e5
2.8e5
0.0
20000.0
40000.0
60000.0
80000.0
1.0e4
1.2e4
1.4e4
Time, min
200
247.5 248.0 248.5 249.0 249.5 250.0 250.5 251.0 251.5 252.0 252.5 253.0
300
121.0509
191.1639149.0126
213.1460
279.1593
301.1409
349.641
922.0095
943.9915
248.1650
400 500 600 700 800 900 1000m/z amu
m/z amu
Formula Compound name Mass Peak RT (min) Peak area DescriptionC15H21NO2 Meperidine 247.15723 12.47 4.20401 E5 _
Species Abundance (counts) Ion mass Measured mass Error (mDa) Error (ppm) Ret. time error (min)[M + H]+ 15313.85 248.16451 248.16498 0.00047 1.90 0.07
Figure 24. Excerpt from screener report indicating presence of meperidine.
For Forensic Use only.
Information is subject to change without notice.
© Agilent Technologies, Inc. 2005
Printed in the USAAugust 24, 20065989-3157EN
www.agilent.com/chem
Conclusions
The analysis of drugs of abuse is important in many different areas of our society, for example law enforcement. Current ana-lytical techniques use a two-step screening and confirmation procedure to achieve the required specificity and sensitivity required. This applica-tion note has investigated 48 of the more common drugs of abuse and their applicability for determi-nation through LC-TOF MS. It is not intended to be a comprehensive study of all possible components, but provides an excellent launching pad for the inclusion of the full gamut of possibilities
This application note shows the potential of the Agilent LC-TOF-MS as a single tool for both screen-ing and confirmatory analysis, with quantitative information, often at levels below those currently analyzed for today. As a final example of the power of this technique, real-life coronial samples were evaluated under a screening protocol, with an additional seven components other than those previously reported by the coronial office detected.
References1. Executive Office of the President – Office of
National Drug Control Policy “Pulse Check –Drug Markets and Chronic Users in 25 ofAmericas Largest Cities” January 2004.
2. Kolbjorn Zahlsen, Trond Aamo, and JerryZweigenbaum, “Screening Drugs of Abuse byLC/MS”, Agilent Technologies, publication5989-1541EN www.agilent.com/chem
3. Kolbjorn Zahlsen, Trond Aamo, and JerryZweigenbaum, “Therapeutic Drug Monitoring byLC/MSD – Clozapine, an example”, AgilentTechnologies, publication 5989-1267ENwww.agilent.com/chem
4. Jerry Zweigenbaum, “Quantitative Analysis ofOpiates in Urine Using Accurate Mass LC/MSDTOF”, Agilent Technologies, publication5989-2206EN www.agilent.com/chem
For More Information
For more information on our products and services,visit our Web site at www.agilent.com/chem.