Embed Size (px)
Citation preview

Development of a Possible Paper Based Detector of
Pure Food Allergen for Possible Onsite Detection
by
Amit Tah
A Thesis
presented to
The University of Guelph
In partial fulfillment of requirements
for the degree of
Master of Applied Science
in
Engineering
Guelph, Ontario, Canada
© Amit Tah, September, 2019

ABSTRACT
DEVELOPMENT OF A PAPER BASED FOOD ALLERGEN DETECTOR FOR ONSITE
CONSUMER AND PRODUCER APPLICATIONS
Amit Tah
University of Guelph, 2019
Advisor(s):
Dr. M. Annamalai
Dr. G. Hayward
Dr. A. Singh
Currently, available food allergen detection methods are a mixture of cumbersome, time-consuming, complicated, and
expensive. Lack of technology for simple allergen detection for food samples could potentially lead to anaphylactic
shock in the consumer by cross-contamination. There is a need for techniques that is rapid, on-site, cost-effective,
disposable, highly sensitive, and accurate to identify these molecules urges the development of a point-of-care device.
The aim of this work was to develop a microfluidic paper-assisted analytical device (μPAD) using hydrophobic
channels, set by a wax printer on filter paper, and nanomaterials to identify the allergens arachin (Ara h 1) for peanuts,
β-lactoglobulin (β LG) for milk, and tropomyosin (Pen a 1) for shrimp and other shellfish presence. Polymer
Nanoparticles (PnP) and gold nanoparticles (AuNP) were investigated and exploited for the development of assays,
which could meet the need for rapid onsite detectors. We utilized aptamers as the primary biorecognition element in
conjugation with their particular interaction with graphene oxide (GO) in their unbound state. The developed μPAD
used AuNP to create a colorimetric system which has enough sensitivity to detect in the allergens present down to the
nanogram range (allergens measured from 25 nM – 1000 nM with an LoD of 7.8 nM, 12.4 nM and 6.2 nM for peanut,
milk and shrimp allergens respectively), in contrast to the microgram range of commonly used enzymatic
immunoassays. The simple color indicator, varying from uncolored to pink in the presences of allergens allows
utilization of the readout without the need for highly specific equipment or training. Alternatively, the results can be
quantified by taking a picture and measuring the color. This presented μPAD can provide results in real time and has
the potential to become a rapid, low-cost, and accurate portable point-of-care device for people to avoid cross-
reactivity of food-borne allergens. Further investigation into PnP nanomaterial platforms may yield better, cheaper
alternatives for use with μPADs.

iii
ACKNOWLEDGEMENTS
I would first and foremost like to thank my parents Kailash and Shanta and the rest of my family
for believing and supporting me through all the ups and downs during my time spent exploring
and learning. Your love, support, and imparted wisdom will be the basis of any achievements I
may produce in this life. I would also like to offer my sincere and significant thanks to Dr.
Manickavasagan Annamalai for the support given in the later of my thesis. I thank him for letting
me pursue and finish my research in a field he is not fluent within and his guidance in my
personal development. I would also like to thank Dr. Suresh Neethirajan, without his initial
guidance and acceptance, I would not have been able to begin my journey and learn as much as I
have. My time spent learning, while somewhat turbulent, has been one of the most impactful
time of my life thus far and I once again sincerely thank all my friends (and very specifically
Patrick, Josephine, Rick, and Saipryia) and those who have helped me along in this journey.

iv
TABLE OF CONTENTS
Abstract ........................................................................................................................................... ii
Acknowledgements ........................................................................................................................ iii
Table of Contents ........................................................................................................................... iv
List of Tables ................................................................................................................................ vii
List of Figures ............................................................................................................................... vii
1 Introduction ............................................................................................................................. 1
2 Objectives ............................................................................................................................... 5
3 Literature Review.................................................................................................................... 6
3.1 Background ...................................................................................................................... 6
Specific Background on Food Allergens .................................................................. 8
3.2 Current Laboratory Methods .......................................................................................... 10
Current Point of Care Testing (POCT) Methodologies .......................................... 15
3.3 Paper-Based Microfluidics (µPADs) ............................................................................. 16
Brief Description ..................................................................................................... 16
Design Methodologies ............................................................................................ 21
Paper-Based Microfluidics Bio-Detection Molecules ............................................ 27
Sensory Methods Utilized on Paper-Based Microfluidic Sensors .......................... 28
Overview of Available Paper Based Sensors for Food Allergen Detection .......... 40
3.4 Assay Materials and Background ................................................................................... 47
Conducting Polymer Nanoparticles ........................................................................ 47
Gold Nanoparticles ................................................................................................. 50

v
Aptamers ................................................................................................................. 52
Graphene Materials ................................................................................................. 53
4 Materials and Methods .......................................................................................................... 56
4.1 General Equipment ......................................................................................................... 56
4.2 MEH-PPV (PnP) Florescent Based Method .................................................................. 57
Principles................................................................................................................. 57
Material ................................................................................................................... 58
Synthesis Protocols ................................................................................................. 58
Characterization ...................................................................................................... 59
Optimization ........................................................................................................... 59
4.3 Gold Nanoparticle (AuNP) Optical / Colorimetric Based Method ................................ 61
Principles................................................................................................................. 61
Materials ................................................................................................................. 62
AuNP+SA+Apt + GO Production Protocols .......................................................... 64
Characterization ...................................................................................................... 65
Optimization ........................................................................................................... 66
Allergen Detection Studies ..................................................................................... 70
Specificity and Cross-Reactivity Studies ................................................................ 70
Paper-Based Device ................................................................................................ 71
5 Results and Discussion ......................................................................................................... 72
5.1 Results of PnP Florescent Based Method ...................................................................... 72
PnP Synthesis Results ............................................................................................. 72
PnP Method Optimization Results .......................................................................... 74
Methodology Failure ............................................................................................... 78
vi
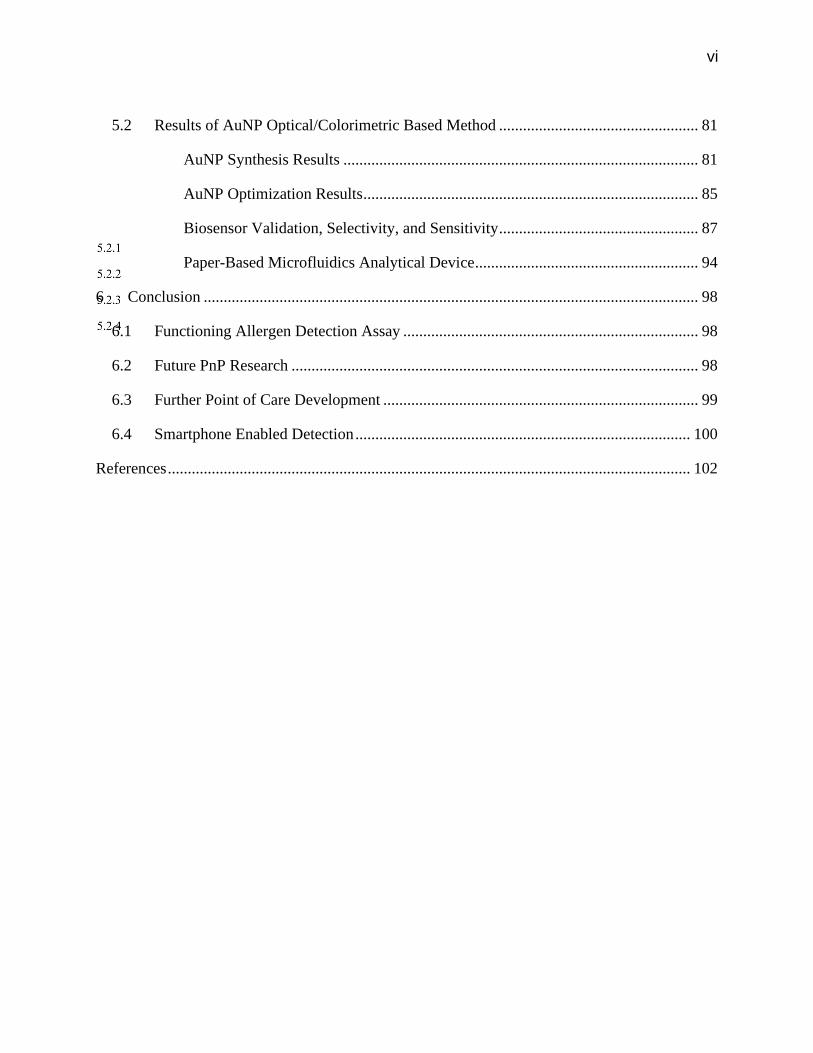
5.2 Results of AuNP Optical/Colorimetric Based Method .................................................. 81
AuNP Synthesis Results ......................................................................................... 81
AuNP Optimization Results .................................................................................... 85
Biosensor Validation, Selectivity, and Sensitivity .................................................. 87
Paper-Based Microfluidics Analytical Device ........................................................ 94
6 Conclusion ............................................................................................................................ 98
6.1 Functioning Allergen Detection Assay .......................................................................... 98
6.2 Future PnP Research ...................................................................................................... 98
6.3 Further Point of Care Development ............................................................................... 99
6.4 Smartphone Enabled Detection .................................................................................... 100
References ................................................................................................................................... 102

vii
LIST OF TABLES
Table 1: Properties of paper with a summary of the known effect and the relation to paper-based
microfluidics ................................................................................................................................. 18
Table 2: Breakdown of common LFA device components and usage (Koczula and Gallotta,
2016) ............................................................................................................................................. 20
Table 3: Graphene Oxide Properties ............................................................................................. 54
LIST OF FIGURES
Figure 1: Types of ELISA and their general principles and methodologies. A) Direct, B) Indirect,
C) Sandwich, D) Competitive ELISA methods (Aydin, 2015) and best viewed in color ............ 12
Figure 2: Breakdown of a standard commercial LFA device used for environmental, medical,
and food testing. Adapted from Yetisen et al., 2013. ................................................................... 20
Figure 3: A) Schematic of the assay for detection of Rabbit IgE. B) Colorimetric detection of
Rabbit IgE on paper C) The results of detection with femta mol sample concentration. adapted
from Cheng et al., 2010................................................................................................................. 30
Figure 4: A) Layout and material of the paper-based microfluidic electrode B) Characterization
of both paper-based against conventional testing electrodes ((a) paper chip and (b) conventional
cell. (c) The effect of scan rate and SAM measured at constant analyte concentration with paper
chip-II. (d) The effect of varying scan rate and analyte concentration measured with glass-chip.
The effect of scan rate measured with a conventional cell using (e) Ag/AgCl/3 M KCl and (f)
Ag/AgCl disk as the reference). This has been adapted from Määttänen et al., 2013. Best viewed
in color .......................................................................................................................................... 32
Figure 5: Paper-based upconversion technique for MMP-2 biomarker fluorescent signal
generation with experimental assay results conducted by a portable fluorescence detector.
Adapted from He and Liu, 2013 and best viewed in color. .......................................................... 36
Figure 6: Detection and quantification of L-Cysteine with the use of an AuNP-Luminol-H202
paper-based sensor. Adapted from Liu et al., 2014 and best viewed in color. ............................. 39
Figure 7: Design and function of a paper-based device developed by Dr. Weng of the BioNano
Laboratory for the detection of fluorescent detection of two food allergens (Egg white lysozyme
and ß-conglutin lupine) two food toxins (okadaic acid and brevetoxin). Adapted from Weng and
Neethirajan, 2017a and best viewed in color. ............................................................................... 42
Figure 8: A) Schematic of the paper-based microfluidic sensor developed by H. Xu et al., 2014
for the visual detection of proteins of interest by eye or simple color scanning. B) Florescent

viii
paper LFA based assay for the detection milk allergen casein using labeled florescent
microspheres by Cheng et al., 2017. C) Electrochemical based detection of analytes of interest
using secondary binding antibodies conducted on paper by (Abbas et al., 2013). Adapted from
Abbas et al., 2013; Cheng et al., 2017; H. Xu et al., 2014. Best viewed in color......................... 46
Figure 9: Molecular structure of a single MEH-PPV monomer (Hooley et al., 2014). ................ 49
Figure 10: Common SELEX procedure conducted for the isolation and development of analyte-
specific aptamers. Adapted from Kim and Gu, 2013 and best viewed in color. .......................... 53
Figure 11: Schematic of principles of MEH-PPV polymer nanoparticle-based food allergen
detection. Best viewed in color. .................................................................................................... 58
Figure 12: Schematic of principles for proposed mechanism using AuNP's, Aptamers and GO for
the colorimetric detection of food allergens. Best viewed in color. ............................................. 62
Figure 13: TEM micrographs of MEH-PPV Polymer Nanoparticles with Histogram of size
distribution top left. ....................................................................................................................... 72
Figure 14: Normalized absorbance and fluorescent emission spectra for PnP using citation 5
multimodal plate reader. Initial absorbance and emission peaks found at 506-509nm and 590-
595nm, respectively. Best viewed in color. .................................................................................. 74
Figure 15: MEH PPV with increasing GO concentration, showing quenching the of fluorescence
signal after 1hrs incubation. .......................................................................................................... 75
Figure 16: Results of pH optimization on MEH-PPV PnP - GO interaction from pH 4 – 10. ..... 77
Figure 17: Results of mixing time optimization for MEH-PPV PnP – GO. ................................. 77
Figure 18: BSA florescent quenching using GO showing physio-absorption and interaction
between materials. Best viewed in color....................................................................................... 79
Figure 19: Test to verify if quenching prevention is possible with BSA as a large steric blocker
on the surface of GO. PnP emission at 585 nm is utilized. ........................................................... 80
Figure 20: TEM micrographs of A) AuNPs, B) AuNP-SA, C) AuNP-SA-Milk Apt, and D)
AuNP-SA-Milk Apt +GO nanosheets with histogram of average diameter found to right. E)
Image of AuNP, AuNP-SA-ssDNA, AuNP-SA-ssDNA + GO + 1000 nM allergen spiked sample
in solution and AuNP-SA-ssDNA + GO with no allergen spike F) Spectral shift caused by the
conjugation of SA and sptamer compared to bare nanoparticles. G) Spectra of functionalized
AuNPs before and after quenching. Best viewed in color. ........................................................... 84
Figure 21:A) SA conjugation from right to left from 10 μg/mL to 90 μg/mL after NaCl addition.
B) Spectra shift after SA conjugation. C) Spectral shift after aptamer conjugation using different

ix
concentrations. D) GO optimization conjugation using the peak absorbance. Best viewed in
color. ............................................................................................................................................. 87
Figure 22:A) Functionalized AuNP reacted with (from left to right) 25nM, 50nM, 100nM,
500nM and 1000nM of allergenic protein and pulse centrifuged. B1,2&3) Spectral signal of from
supernatant due to reaction and GO quenching from various allergen concentrations of B1)
Peanut, B2) Milk and B3) Shrimp, bottom to top 25nM, 50nM, 100nM, 500nM and 1000nM. C)
Selectivity study of the functionalized AuNP system to the other allergenic proteins. Best viewed
in color. ......................................................................................................................................... 89
Figure 23:A) Image of the supernatant produced after simple filtration with Whatman 1 filter
paper of samples with varying quantities of allergenic protein and the addition of GO, from left
to right: 0nM, 25nM, 50nM, 100nM, 500nM and 1000nM of allergenic protein. B) Image of
simple 3-fold paper-based device for assistance in detection of allergens in food. The Top: Lid
Layer, Middle: Filter Layer, Bottom: Output Layer. C) Image of the output layer after filtering
samples with varying amounts of allergenic proteins, from left to right: 0nM, 25nM, 50nM,
100nM, 500nM and 1000nM of allergenic protein. D) Graph of the measured mean grey value of
ROI from image C. Best viewed in color. .................................................................................... 97
Figure 24: Assay with the utilization of a smart device for the detection of allergenic materials in
food ............................................................................................................................................. 101

1
1 Introduction
Food allergy sensitivity is related to an overreaction of an individual’s immunological system
causing adversely to consumed proteins found in the meal denoted as allergens (aafa, 2017). The
symptoms an individual experience from an allergic reaction vary from one to another and can
range from mild to severe. Unfortunately, the causes of allergies are not yet completely understood,
but the mechanisms are reported and thus allow for precautionary measures to be taken (Smith,
2013). There is no current cure to allergies thus the allergic reactions are prevented by avoiding
contact with the food, controlling the symptoms (taking antihistamines, epinephrine) and allergy
injection therapy (U.S Department of Health and Human Services and National Center for Health
Statistics, 2015).
Federal Drug Administration (FDA) and other governmental bodies have identified eight major
allergens that affect sensitive individuals which include milk, eggs, fish, crustacean shellfish, tree
nuts, wheat and soy (Center for Food Safety and Applied Nutrition, 2017). However, significant
allergens can vary depending on the population and the region of the world thus they are the ones
considered to evoke a reaction in more than 50% of allergic patients (Kallós et al., 1978). In the
United States alone, 15 million individuals are sensitive to the various foodborne allergens (FARE,
2016). To prevent accidental reaction sensitive individuals must rely on manufacturers,
governmental regulation, and imposing a strict diet on themselves to lower the chance of a response
due to allergenic material (World Allergy Organization, 2011). In this study, we selected peanut,
milk, and shellfish allergens due to being the most common food allergens in children in the U.S.
with an incidence of 25.5%, 21.1%, and 17.2%, respectively. It is essential to mention that out of
the affected children, a significant minority had reported having a history of a severe reaction and

2
30.4% were allergic to more than one allergen. While lab-based testing methods are available, they
do not allow those with a allergenic sensitivities to test food stuff for possible contamination onsite,
leading to possible allergenic response. What is specifically needed are new methods which allow
users to conduct onsite detection at their discretion. To accomplish this, we will leverage new
materials and methods, like the use of paper-based microfluidics, polymer nanoparticles, and
modified gold nanoparticles to create a onsite low cost biosensor for consumer use.
The advent of paper-based microfluidics, which utilizes the natural capillary action of cellulosic
substrates to perform rapid diagnostic test, may change this and help bring these Point-of-Care
testing (POCT) to the masses (Martinez et al., 2010). This new type of diagnostic system provides
a methodology which can help take microfluidics from the lab to the consumers. The advantages
paper-based microfluidics include the low cost, ease of manufacturing, the possibility of simple
multiplexing, small sample/reagent consumption and capability for development of the three
dimensionally structured diagnostic tool (Martinez et al., 2007). These advantages allow paper-
based devices to deliver on the promises that original lab on chip microfluidic put forward, the
development of POCT for the entire world.
For this device, the primary sensing mechanism incorporates the use of aptamer to identify the
allergenic proteins. Aptamers are short single-stranded DNA or RNA oligonucleotides that have
the ability of binding to specific molecules showing activity like antibodies. Aptamers thus prove
to have advantages on detection by antibodies due to: being smaller in size (6-30 kDa or 20-100
nt), having a high affinity independent from the number of epitopes in the target molecule,
allowing to identify single point mutation and isomers, detecting a more extensive range of
molecules, rapid production, low variation between batches, low risk of contamination, long

3
stability, having the ability to be modified, and low to none immunogenicity (BasePair
Biotechnologies, 2017; Zhou and Rossi, 2016).
In this research, we describe the work conducted in the development of an onsite detection assay
for food allergens utilizing advanced materials and methods. We utilize aptamer in conjugation
with two different classes of materials to work towards a feasible onsite detection method. Our
first assay procedure utilizes florescent Polymer Nanoparticles (PnP) that are utilized with
aptamers and the specific properties of graphene oxide to create a competitive assay capable of
detecting food allergens. A secondary more direct method using aptamers directly conjugating to
gold nanoparticles (AuNPs) and graphene oxide (GO) is created to develop a functional assay.
Once a functional and validated assay is developed, a simple paper device to simplify food allergen
detection will be created.
Each of these materials (PnP, AuNP, and GO) have been highly exploited for the development of
POCT in recent years thanks to their fantastic properties and interactions. PnP is a class of
materials which use the polymerization of polymer chains into spherical morphologies allowing
utilization of their properties in many new ways. Monomer with specific optical, electrical, and
chemical properties can be selected, doped, combined, and modified into PnP (Nambiar and Yeow,
2011). Thanks to these properties and new advancements, such as simplifying synthesis and
production, more researchers have begun to explore and utilize these materials. In this work, we
selected polymer MEH PPV as it is a naturally fluorescent molecule with high stability and
biocompatibility. Thanks to these properties, they make excellent possible reporters. Furthermore,
it is a highly abundant polymer due to its numerous industrial uses. These properties make it an
ideal material for research into making inexpensive methodologies for onsite detection. The use of

4
gold nanoparticles (AuNP) was also explored in this work as they are a tested platform for assay
development thanks to their amazing properties. AuNPs have optical and electrical properties such
as their specific and robust surface plasmon resonance absorption and extremely high extinction
coefficients allowing them to be ideal reporters for target analytes with low-cost equipment or with
the naked eye (Alves et al., 2016). Furthermore, significant research has been conducted in their
development, modification, and uses; making them an ideal platform for creating the next
generation of onsite detection methods.
Finally, GO can quench fluorophore-labeled bio-recognition molecules, such as labeled
antibodies, which when in the presence of their target reverse the quenching and re-release their
fluorescent signal due to Fӧrster resonance energy transfer (FRET) (Lu et al., 2015). It also has
been shown to interact with a variety of biological molecules such as amino acids, peptides,
proteins and most importantly for this application single-stranded DNA (Li et al., 2014, 2012). It
has shown that single-stranded DNA has a unique adsorption interaction with GO due to π-π
stacking thanks to the ssDNA aptamers bound to them. In contrast, double-stranded DNA or highly
structure molecules of DNA do not show the formation of pi-pi interaction with GO, as their
complex-rigid structure prevents the pi-pi interaction from occurring with GO (Li et al., 2014). By
utilizing the interaction of single-stranded DNA aptamers with either fluorescent (PnP) or
colorimetric (AuNP) labels and GO, it is possible to create a methodology capable of detecting
food allergens. Finally, combining this with a simple paper-based device, it allows for the
possibility of a simple, fast, and quantifiable onsite assessment of allergen concentration in food
products.

5
2 Objectives
There are three main objectives of this work which work to introduce a validated and tested onsite
detector for food allergens. The first objective is the synthetization and characterization of
functional nanomaterial platforms, utilized for the allergen detection process. Next, optimization
of the nanomaterial platforms for the specific purpose of food allergen detection. Finally, we will
validate a functional methodology for its capability of food allergen detection, explicitly focusing
on sensitivity and selectivity, while creating a paper-based mechanism for the onsite testing
application.

6
3 Literature Review
3.1 Background
Food safety is an issue which affects the world as a whole and will be a continued to be a top
priority as our population exceeds 8 billion by 2020 (United Nations Department of Economic and
Social Affairs, 2015). According to the World Health Organization (WHO), 600 million cases of
foodborne illness due to pathogens, toxins, and chemicals had occurred worldwide in 2010 alone.
Though food safety is a global concern, many of these cases are predominantly found in the
developing world were 1/3 of these cases are related to those under the age of 5. Inadequate food
safety resulted in the global estimated deaths of 420 000 individuals (World Health Organization
(WHO), 2015). As stated, many of these food safety incidences are found in the developing world;
however CDC estimates state that 1 in 6 (46 million) Americans were affected in 2015. Leading
to 128,000 hospitalizations and upwards of 3000 deaths (Scallan et al., 2011). Food security is a
global responsibility and affects everyone, irrespective of socioeconomic status. Ensuring food
safety around the world requires an increase in regulations, leading to further burden on producers
as the population increases.
The cost of foodborne illness is immense, taking lives and costing hundreds of millions in
treatment and lost productivity (Food and Agriculture Organization of the United Nations, 2017;
World Health Organization (WHO), 2015). A Majority of food contamination cases around the
world (an estimated 550 million) are caused by diarrheal diseases (Norovirus, Campylobacter spp.,
hepatitis A virus, helminth Ascaris spp. and Salmonella) and other bacteria, parasites, and viruses
(Food and Agriculture Organization of the United Nations, 2017; Scallan et al., 2011; World
Health Organization (WHO), 2015). The other component of food contaminated related illness are

7
caused by allergens, biotoxins, heavy metals, pesticide residue and other biological/chemical
contaminants introduced during the production, manufacturing, and transport of foodstuffs (Busa
et al., 2016; Kantiani et al., 2010). In the case of developing nations, this loss in productivity and
increased burden on the health care system can lead to further impoverishment and decrease quality
of life (Food and Agriculture Organization of the United Nations, 2017; World Health
Organization (WHO), 2015). Furthermore, the loss of food security will also cause significantly
more economic harm over time; consumers trust food producers less, which results in decreasing
sales and increasing costs (Hussain and Dawson, 2013). These effects eventually lead to an
inflation of food products costs and further difficulty in securing a stable and clean supply of food.
In conjunction with our ability for global trade, these contaminate can have a worldwide impact
on all of humanity. Due to all the above factors, food and beverage contaminants are one of the
most significant concerns for the global community.
To help ensure our food security numerous laboratory assays have been developed to detect these
contaminants which utilize either nucleic (PCR), immunoassay (Enzymatic, ELISA),
chromatography (HPLC, GC), gel electrophoresis or bench top spectroscopy methodologies
(Dzantiev et al., 2014; Gámiz-Gracia et al., 2005; Sinha et al., 2010; Taylor et al., 2006; Wang et
al., 2017). However, to utilize them causes a delay of hours to weeks depending on the nation
(McNerney, 2015). Therefore, centralized laboratories are less than ideal for quick detection and
prevention of food contamination borne illness.
As all individuals have the fundamental right to access to clean and uncontained food and water,
there is a significant necessity and requirement for rapid testing methodologies to reduce the
prevalence of contaminant-induced illness (United Nations, 1948). The need for diagnostic

8
methodologies that can prevent delay and inform consumers of contamination immediately is
required, regardless of any economic or social restriction. The WHO has developed guidelines for
such systems and can be summarized by the acronym ASSURED (affordable, sensitive, specific,
user-friendly, rapid and robust, equipment-free and delivered to those in need) (Pai et al., 2012).
This acronym mainly describes the needs and requirements for the development of Point of Care
Testing (POCT) devices, which are cheap and allow producers and consumers to gain relevant
information and make informed decisions.
As we all, regardless of our socioeconomic status, have the right to safe and secure food and
beverage the development and deployment of such technologies is necessary (United Nations,
1948; World Health Organization (WHO), 2015). A variety of POCT testing devices have been
developed for just this purpose, they utilize many electrical, chemical, and optical properties to
provide onsite results for food contamination. Currently using these different methodologies,
several commercially available POCT devices are on the market. Much of these systems utilize
Lateral Flow, Dipstick, and electrochemical or Microfluidics systems to detect clinically relevant
levels of contamination in food. However, in terms of the ASSURED criteria, the newer
technology of paper-based microfluidics is leading the path towards the pragmatic deployment of
biosensors for food and beverage safety at both the consumer and producer level.
Specific Background on Food Allergens
Food allergens are commonly proteins found naturally as a component of foodstuff that causes an
unwanted immune response of varying effects. The immune system creates specific antibodies and
when found cause mast cells to interact through IgE and IgG dependent pathways. While we have
yet to fully ascertain the cause of sensitivity to these normally innocuous proteins found in food

9
products, their structure, specifically the structure of the epitope sites lead to the interaction with
the body’s immune system causing the response. Each year the frequency of individuals who are
sensitive to foodborne allergies increases (World Allergy Organization, 2011). It is estimated that
at least 220 million individuals are clinically sensitive to different food-related allergens, causing
a significant loss in quality of life (World Allergy Organization, 2011). Food allergies themselves
are the result of an immune response caused by the ingestion or contact of certain food products.
The effect of an allergic reaction can vary between slight discomfort to anaphylactic shock leading
to death. As allergies are becoming increasingly prevalent in both adults and children, it has
become a significant health concern (FARE, 2017a; World Allergy Organization, 2011). The
primary food allergens which impose a significant danger as they are most common are peanuts,
tree nuts, milk, eggs, wheat, soy, fish, and shellfish (FARE, 2017a; World Allergy Organization,
2011). To limit the effect of this contamination suffering individuals, impose strict diets on
themselves; this is in conjugation with increasing regulations for food producers to reduce the
possibility of accidental exposure. With such a substantial prevalence and range of impacts, food
allergens have become a significant public health concern.
The eight significant groups contribute the most considerable number of hospitalizations of the
30,000 cases reported each year in the USA (FARE, 2017b). Though the frequency of sensitivity
of each allergen varies region by region, these eight main groups are the most common and
prevalent in both adult and children populations (Prescott et al., 2013; World Allergy Organization,
2011). In the case of allergens, an individual’s sensitivity is highly variable as well as the response.
The developed laws and regulation for detection of allergenic proteins are therefore limited in
global acceptance (Center for Food Safety and Applied Nutrition, 2016). Though this is the case

10
laws requiring the labeling of any possible contact with allergenic proteins and significantly more
stringent regulation on the production of food products to prevent accidental cross-contamination
(World Allergy Organization, 2011). This combination has significantly reduced the frequency of
hospitalization in nations like the USA, regardless of their increasing prevalence within the
population (FARE, 2017b). However, in places with laxer restrictions and less governmental
control over food quality, these are not available to suffering individuals. The result is a highly
strict diet or the use of expensive adrenaline injections and frequent hospital visits.
3.2 Current Laboratory Methods
To test for allergenic material in food numerous assays have been developed to detect these
contaminants which utilize either radioallergosorbent (RAST /EAST) tests, nucleic (PCR),
immunoassay (Enzymatic, ELISA), chromatography (HPLC, GC), or gel electrophoresis
(Dzantiev et al., 2014; Gámiz-Gracia et al., 2005; Sinha et al., 2010; Taylor et al., 2006; Wang et
al., 2017). Though they are highly sensitive, these systems require significant infrastructure and
expertise to utilize. They also are significantly time-consuming and require the use of expensive
systems and reagents. While they may not be a concern in most developed countries where such
infrastructure is in place, but places were food and beverage safety are most compromised, such
luxuries often do not exist. Furthermore, even with the availability of such locations, samples
would require shipping to these centralized laboratories. The delay creates unnecessary uncertainty
and slows the response to the spread of infectious disease or dangerous contamination which in
turn limits food safety and deteriorates public health (Martinez et al., 2010; Pai et al., 2012). The
cost of delayed reaction to food and beverage contamination can lead to tremendous losses in
productivity and cause a significant loss in an entire community’s quality of life. Even with our

11
rapid global urbanization as a civilization, 52% of the developing world population still exist with
rural areas which have limited access to infrastructure (United Nations Department of Economic
and Social Affairs, 2014). As such centralized laboratories, although available, would be less than
ideal for quick detection and prevention of food contamination borne illness like allergens in these
impoverished communities. Even in more developed nations the cost of delayed reaction to food
and beverage contamination can lead to tremendous losses in productivity and cause a significant
loss in an entire community’s quality of life. Lastly, in either developed or developing nations they
will cause an increase in preventable burden on the health care systems.
The outlier of the above methods discussed are the immunoassay, as in comparison to other
methods, is cheap and relatively easy to use. Therefore, they have taken a leading role in the
detection of food allergens in the food production industry. The enzyme-linked immunosorbent
assay (ELISA) immunoassays are the most employed methods as they have been heavily designed
and researched in the past 30 years. In general, there are four main types of ELISA used for the
detection of proteins which focus on the utilization of biomarkers for the detection of the specific
analyte: Direct, Indirect, Sandwich, and Competitive. While these will be further explained, Figure
1 below shows the general principles and methodologies utilized by each of the methods.

12
Figure 1: Types of ELISA and their general principles and methodologies. A) Direct, B) Indirect, C)
Sandwich, D) Competitive ELISA methods (Aydin, 2015) and best viewed in color

13
ELISA are standard because of their use of biomarkers (biologic identifiers specific to the analyte)
which can precisely identify the wanted analyte. Other methods like HPLC use far more
complicated spectral analysis of the entire product and use complex processing to differentiate
compounds based on bonds, energy excitation levels, or energy phase shifts (van Hengel, 2007).
In contrast, ELISA methods include methods to help isolate the analyte of interest and in more
advanced methods, add labels to make their detection easier. Immunoassays like ELISA use
antibodies, antigens or other bio-receptors tagged with designed enzymes anchored to plate walls
using their specific antigens. These enzymes have been targeted to the analyte to isolate and collect
them for measurement. When the analyte is added, it interacts with the enzymes causing a reaction
to occur. Using optical, colorimetric, electrochemical, or other known methods we can identify the
amount of analyte from this reaction after stopping it at a set time. Using the natural biomarkers
found on the analyte, we can identify them without the need for systems like HPLC in mixed
media. This is called Direct ELISA, by immobilizing the bio-receptors (like aptamers, affinity
proteins, and antibodies) to the walls of the plate well, we can hold onto the wanted analyte and
use washing steps to remove everything else (Aydin, 2015). Resulting in the collection of the
analyte of interest in which other methods can then be utilized to detect concentration like gel
electrophoresis, but without the intricate and highly expensive isolation steps (Bülbül et al., 2015).
Alteration to this simple method is to add another bio-receptor with an enzyme acts as the primary
indicator of the amount of the analyte instead. This is an indirect ELISA as the enzyme’s substrate
is added, often causing a colorimetric reaction to occur. Often the change in color or intensity of
the produced color can be directly attributed to the amount of analyte found in the substance
(Aydin, 2015).

14
Recently, more advanced, innovated, and complicated ELISA have also been developed to make
the detection of analyte simpler and less resource intensive. Sandwich ELISA utilize complex
bioreceptors (like antibodies) as well but directly immobilize them to the walls of the plate so that
they cannot be washed away. When the analyte is added in incubates onto the first antibody, a
secondary antibody with a label (sometimes for cells a developed antigen as well) is added. This
label can be an enzymatic, fluorescent, electrochemically active species, or chemiluminescent and
allows for the detection of the analyte based on the concentration or reaction caused by this
secondary labeled bio-receptor. Last of the primary methods is a Competitive ELISA which
utilized a combination reaction to see what the constituents of the reaction are real time. Two bio-
recognition molecules are immobilized onto the surface of the plate, one of which has a weak label
which will react or be measured later. The enzyme tagged bio-recognition molecule and sample
are added together and the reaction can proceed. If the analyte of interest is present than the
secondary tagged bio-recognition element will exist and when measured show higher output
(based on the tags reaction type) than the one on the other primary antibody. Vice versa is there is
no analyte of interest than the ratio of outputs will change, allowing quantification or qualification
of the output (Aydin, 2015). These are the main types of ELISA, and because of how simple they
are in comparison to other available methods, in terms of processing and final result output, they
have essentially become the golden standard for this industry. Furthermore, as it will be discussed
later, immunoassay ELISA methodologies have been widely utilized in new Point of Care testing
methods, that have begun to pave the way to solving the issue this format currently has. These
shortfalls will be discussed and further explained below.

15
First and foremost, ELISA while the best of the laboratory methods, is still a laboratory method
which requires time, expertise, and equipment. For some reactions, the needed amounts of reagents
to be added need sub µL level precision to ensure accurate output. Furthermore as seen in the
diagrams of Figure 1 there are often many steps, each of which can be compromised during the
process and cause a significant shift in the results (Wong and Tse, 2009). Furthermore, these test
use reagents in significant excess because the frequent use of laboratory plates (96 well plates) has
been integrated into the underlying methodology, making high-level optimization difficult. The
biggest issue which prevents the usage of these systems by users and consumer has always been
the time and number of steps they take to process and obtain results. Because of this, the current
batch testing method is used and the consumer cannot get products which can help them when they
are unsure. Making the ELISA system more straightforward and more efficient will further reduce
cost and allow for more consistent testing to occur. To accomplish this, researchers are currently
looking into the development of specialized devices which simplifies the assay steps and allow
any user to conduct these test as needed. Specifically, the development of Point of Care systems
which meet the criteria of being cheap, easy to use, and accurate have become increasingly
researched.
Current Point of Care Testing (POCT) Methodologies
POCT has been on ever-increasing interest as more emphasis is put on fast, accurate, and available
health care support programs. From a consumer’s perspective, they are the solution to current
problems with our health care system. They can conduct on-site detection for ailments of interest
rapidly and accurately. For health care providers, they provide focused methodologies which can
be used in direct conjunction with differential diagnosis for rapid analysis. Removing the need for

16
broadband detection methods and screens which require highly sophisticated laboratories and
trained personnel. Making healthcare more efficient and cost-effective (Mahato et al., 2017).
While this has been the directive of many health care providers, the increasing population and
movement of societies standards for service have begun to show the current limitation with our
available methods. The new focus is on personalized health care solutions, which works with
differential diagnosis to provide individually focused care. This shift in the focus of health care
providers has mostly occurred because of the shift from clinical diagnostics to the realm of the
bio-molecular (Sharma et al., 2015). Specifically, the use of Biomarkers which are used to detect
and predicted illness in a quantifiable and reliable method, have made it possible to create POCT
devices. Using biomarker detection for the development of POCT, healthcare can be made more
accessible and at the same time lessen cost (Sharma et al., 2015; Yetisen et al., 2013). Due to the
above issues, we will see a overtake of the large and expensive instruments and methodologies
with the development of bench-top or handheld devices that will soon be tried and tested enough
to make it to market (Yetisen et al., 2013).
3.3 Paper-Based Microfluidics (µPADs)
Brief Description
In 2007 a paper published by the Whiteside group showed the positive benefits of using simple
paper as a substrate for microfluidics. Though they are similar to previously discussed lateral flow
assays (LFA), there is no need for the use of nitrocellulose; it instead uses natural cellulose,
hydrophobic barriers and the average porosity of paper cellulose to conduct microfluidic assays
(Martinez et al., 2010). While the paper itself has been in use across laboratories for analytical
purposes well before and into the 20th century. The recent highlight of its capabilities has helped

17
raise it as a star for diagnostic tools that are globally accessible (Martinez et al., 2007). Paper is
readily compatible with biological samples and as a base material allows developed devices to be
cheap and easily disposable (Luckham et al., 2010). Looking at paper as a substrate, in the
perspective of microfluidics, its critical properties such as surface chemistry, optical properties,
and porosity make it ideal for self-conducting assays (Costa et al., 2014; Pelton, 2009). The surface
chemistry of paper and porosity allow for immobilization of molecules (antibodies, proteins,
nanoparticles) and its porosity allows for movement of reagents and analyte by wicking (Pelton,
2009). As cellulose is a highly abundant and well-studied molecule, many optical and chemical
properties of paper have been significantly well defined (Costa et al., 2014; Fardim et al., 2005;
Pelton, 2009; Roberts, 1996). This significant research, in conjunction with cellulose base
materials easy chemical modification for new functional groups, allows paper to stand on the
forefront for the development of new POCT diagnostics for the world.
The chemical properties of paper are defined by the cellulosic fibers that are pressed together,
which are commonly attained from wood or cotton (Yetisen et al., 2013). The most used type of
cellulose is from sources like wood and cotton, which are used primarily to create either printer
paper or analytical grade filters and chromatography paper (Pelton, 2009). For diagnostic
applications, cotton based paper substrates are superior as they do not contain lignin, which causes
discoloration and eventual self-destruction of the paper (Roberts, 1996). The critical properties of
paper as discussed by Zhong et al. are related to the surface chemistry, surface area, capillary flow
rate, pore size, thickness and porosity of the specific type of cellulose-based paper substrate. The
choice of the paper type, and by extension, its characteristics, is based on the analytical and
diagnostic needs of the assay (Zhong et al., 2012).

18
To summarize the effect of these parameters, Table 1 below has been provided.
Table 1: Properties of paper with a summary of the known effect and the relation to paper-based
microfluidics
Paper Property Description of effect
Surface
Chemistry
The source of the cellulose, as well as any modification, will alter characteristics such as
surface tension, adhesion, and molecular compatibility of the paper (Roberts, 1996).
Nitrocellulose, which is commonly used in LFT, is esterification of the cellulose fibers with
nitric acid. The resultant paper substrate is hydrophobic and does not wet during assays (Costa
et al., 2014). The fibers do not swell like natural cellulose during interaction with water and
keep consistent pore size during the assay (Pelton, 2009; Yetisen et al., 2013). Often to improve
assay times in nitrocellulose the addition of surfactants need to be incorporated during
manufacturing to help increase the wetting ability of the substrate, increasing the complexity
and cost of the POC device (Costa et al., 2014). In comparison to untreated cellulose,
unmodified nitrocellulose has high surface tension and roughness (increasing hydrophobicity)
decrease immobilization of biomolecules, which make it less desirable for assays.
Porosity and
pore size
Studies have shown that porosity significantly impacts a substrates ability to create hydrophilic
channels. Naturally, the pore size will dictate what particulate size can be moved through the
substrate to testing or mixing zones. The porosity, however, can also limit the ability of an
assay as the cellulose matrix can swell, which restricts the capillary flow (Zhong et al., 2012).
The pore size and average distribution will generally affect the capillary rate of a substrate if
thickness and distribution are unchanging.
Surface Area
The available surface area of a substrate is defined with the inclusion of the pore found within
the substrate area. Specifically, the structure will define the maximum area available for
biosensors to attach to the cellulose matrix. The formula Γ can define this relationship.σ, where
Γ is the maximum density of the immobilized sensor. σ is the specific surface area of the paper
structure accessible to the biosensor and is defined by some relationship with the basis weight
(mass of dry paper (bw)) of a specific type of paper. For instance, glassine, a non-porous
cellulose matrix, has a specific surface area of σ = 2/bw. Γ is the maximum possible biosensor
content within a polymer and is typically between 0.1-1 mg/m2. The effective surface area will
dictate a reagent or sensors content within a specific area (Pelton, 2009). This will, in turn,

19
affect the sensitivity and reproducibility of a paper-based device as even dispersion and
concentration of the biosensor will occur.
Capillary Flow
Rate
The flow rate of liquid, either analyte or reagent, is an essential parameter for diagnostic testing.
The flow rate is effected by many of the above-described parameters, such as the porosity and
chemical properties, but can be altered by both physical and chemical modification (Y. Xu et
al., 2014). Furthermore, the effective concentration of analyte present in a sample is inversely
proportional to the square of the change in flow rate (Yetisen et al., 2013). This means that a
paper-based devices consistency and sensitivity of detection is related to the substrates intrinsic
flow rate. It is also important to note that some assay steps require time for conjugation or
reactivity. Recently paper-based ELISA kits have been developed and use 3D construction
techniques to control the analyte flow during key steps (Murdock et al., 2013). Other
techniques which modify the paper substrate like plasma etching process described by Xu et
al., can tune the capillary rate of the assay in localized regions (Y. Xu et al., 2014).
Paper Thickness
Paper thickness is another physical aspect of the substrate, including the tensile strength, signal
visibility, and bed volume. Bed volume is related to the dimensions of the substrate and the
porosity, which gives the total volume. In paper-based microfluidics, the bed volume capability
of a substrate is an essential characteristic as it determines the amount of a sample which can
be absorbed and therefore transferred through the assay. In comparison to LFA, they utilize an
absorbent pad to help mitigate this. In natural cellulose-based material, this is not necessary as
the paper itself can be the absorbent pad initially (Lisowski and Zarzycki, 2013). Reagents or
samples will disperse in a higher area on thinner paper, as there is less downward area to
absorbed into. This allows for a higher concentration in the specified localized regions and
promotes greater sensitivities (Yetisen et al., 2013). This is because it will increase the
likelihood of interaction between the immobilized biosensor and analyte.
The thickness also affects the signal intensity as the concentration of biosensors will be more
three-dimensionally dispersed within the structure. If the reaction of the biosensor with an
analyte is deep within the structure than it would be far more challenging to see the response
due to the interfaces of the substrate. Having paper that is too thick and distributes reagents
and biosensor to deep will cause a loss in the sensitivity
To utilize these characteristics, many designs and methodologies have been developed to increase
the efficiency of the sensing reaction. This goal has led to the development of reagent confining
and sample flow control methodologies. For example, in Lateral Flow test strips the usage of glass
fiber, polyesters and rayon are used for to facilitate fluid transfer and acts as a region for
conjugation with the first step of the sensing mechanism. The next region is made of nitrocellulose,

20
which has an extreme ability for immobilization of biological molecules, and is where the flowing
sample-conjugation is retained to inform the individual of the result (Yetisen et al., 2013). A
breakdown of a common LFA and explanation of each component can be found in Figure 2 and
Table 2 below:
Figure 2: Breakdown of a standard commercial LFA device used for environmental, medical, and food
testing. Adapted from Yetisen et al., 2013.
Table 2: Breakdown of common LFA device components and usage (Koczula and Gallotta, 2016)
Component Material Function
Sample Pad Commonly made of either one or a
combination of the following: cotton,
rayon or glass fiber
As this is where the sample is added to start the assay,
it sometimes contains pH buffer, pretreatment reagents
and surfactants
Conjugation
Pad
Commonly made of either one or a
combination of the following: glass
fibers, polyester or rayon
This is where the analyte and the biorecognition
component first have a chance to interact and conjugate
with each other

21
Reactionary
Pad
Commonly made of either one or a
combination of the following:
Nitrocellulose or nylon
This area of the LFA is where the conjugated sample
bind to the immobilized secondary biorecognition
element. By doing so, the band will become apparent
in the test and control region of the reactionary pad
giving the assay output.
Absorbent Pad Normally made of cotton This is the final area for where all the excess liquid
flows into and acts as a sponge to allow the assay to
flow until completion.
In paper-based microfluidics however only cellulose is utilized which has led to the development
of methods which control sample flow, reagents depositions and assay methodologies by either
chemical/physical treatments or the development of barriers (Cate et al., 2015; Costa et al., 2014;
Yetisen et al., 2013). By controlling these characteristics with new designs and methodologies, we
can create an efficient system which utilizes small quantities of samples and reagents to produce
powerful results. Below a snapshot into standard methodologies used with paper-based
microfluidics for specific and sensitive detection has been brought together. Lastly, thanks to
paper’s structure and natural bio/chemical-compatibility, it can be utilized with a variety of
materials.
Design Methodologies
As the technology has progressed the fabrication methods of paper-based microfluidics has also
evolved to allow for both more complicated designs and rapid construction. The earliest forms
were commonly just cut paper that was treated with reagents, like a litmus test for pH (Costa et
al., 2014; Lisowski and Zarzycki, 2013). While the most appropriate technique in some cases, this
was not enough to truly bring large scale analytical tests and assays to the masses in a cheap and
available solution. To meet the needs of more complex assays, many different design and

22
manufacturing methodologies have been developed to expand the functionality of paper-based
devices (Yetisen et al., 2013). These new methodologies unlock the potential of paper-based
systems through the integration of new materials or simple 3-dimensional manipulation of the
substrate in an origami-like style. Based on a broad review of available articles, the most common
methods of paper-based microfluidic fabrication are discussed below.
Along with cutting and treating the paper with reagents, one of the most common original methods
was derived from regular lab on chip microfluidics, photolithography (Cate et al., 2015). The zones
of interest or testing are developed by patterning the paper substrate into hydrophilic zones (which
enable capillary fluid transport of analyte) and hydrophobic zones (which prevent said action).
This process were similar to those conducted for the development of regular PDMS based
microfluidic chips, utilizing SU based photoresist to pattern in these zones on paper substrate
(Martinez et al., 2007). The photoresist is cured with the use of a UV lamp in which a pattern is
inlaid by a mask which can resist UV creating hydrophilic and hydrophobic zones. This method is
simple, requiring only a UV lamp and hot plate, and highly effective in creating defined regions.
While convenient, SU type photoresist is understood to have significant environmental impacts,
so more friendly and cheap alternatives like Polyvinyl cinnamate-based photoresist have been
explored and used. Furthermore, utilizing this photoresist was found to be very suitable for
implementation in less structured cellulosic materials like clothing by the authors (Li et al., 2018).
The technology has also been advanced with methodologies which used the coupling of
hydrophobic silane to paper fibers with the application of UV. This is done thanks to the self-
assembly of Alkylsilane in the paper structure, when exposed to UV, these hydrophobic region

23
change to highly hydrophilic allowing the development of microfluidic channels and zones (He et
al., 2013).
Another common paper-based microfluidic fabrication technique was the usage of wax to create
patterned hydro-phobic/phillic regions and channels. This was considered one of the next steps in
paper-based microfluidic fabrication techniques in comparison to photoresist methods, as it has a
lower potential for background reactivity(Martinez et al., 2010). Other than the benefit of reducing
background reactivity or modification of the paper, wax patterning of microfluidic devices is
inexpensive, rapid, has no requirement for solvents and is a straightforward process (printing and
baking) (Zhong et al., 2012). Thanks to these properties, paper has taken a significant role in
manufacturing and prototyping of paper-based devices. Based on a simple review, wax patterning
has been utilized in the development of paper devices for biomedical, pharmaceutical and
environmental testing (Marques et al., 2015; Mohammadi et al., 2015; Santhiago et al., 2014; Seok
et al., 2017). The usage of wax has evolved as well with new faster methods of creating barriers.
Originally wax stamping or liquid wax drawing was used to create design and zone for paper-
based devices (Carrilho et al., 2009). Now even more rapid methods such as inject like printing
(Noh and Phillips, 2010) and wax screen printing (Cate et al., 2015) have been developed which
truly enable mass manufacturing of these devices. Wax inject like printing has been developed to
the point where commercially available units like the XEROX ColorCubetm Series can be
purchased. These printers use common inject technology to print wax in the wanted design; then
the paper is baked at 150 0C for 5 minutes to allow the wax to melt into the porous structure of the
paper to make hydrophobic barriers. The process and limits of this technology have been pushed
to the point were consistent sub-microliter manipulations of sample volumes has been conducted

24
(Tenda et al., 2016). To increase the prototyping ability of this technology the implementation of
wax pen-like devices which allow the quick design of new devices for testing while maintaining
substantial hydrophobic barriers (Zhong et al., 2012).
A complementary technology of wax printing is the usage of commercially available printers to
create one step deposition of device design and associated reagents. These are some of the first
methods researched to allow larger scale manufacturing of paper-based devices (Su et al., 2016;
Yamada et al., 2015). Using the inkjet printers, it is possible to deposit biological molecules and
other testing regents on to the device. We can at the same time use these mechanisms to produce
hydrophobic barriers that allow us to direct and channel flow, shortening the time of manufacturing
of each device. One of the earliest examples of inkjet printing utilizes photoresist-soaked paper
(polystyrene solution (1.0 wt % in toluene)) which when exposed to specialized inks to re-enable
the hydrophilic nature of the paper. The paper which is hydrophobic thanks to the polystyrene
solution has channels etched in with the usage of a highly concentrated toluene ink from the inject
printer. This allows the precise placement and design of channels and sensing zones, limited only
by the possible resolution of the commercial grade inkjet printer (Yamada et al., 2015). One of the
downfalls with this technique is related to the major issues found with the usage of photoresist, the
need for specialized methods and equipment. The toluene required special cartridges as standard
plastic would degrade. The final step also requires the usage of organic solvent to develop the
features and remove any possible background activity or extraneous reaction, which can take place
due to the volatile chemicals. A secondary disadvantage related to this is that the entire printing
process could not contain deposition of reagents as the subsequent exposers to harsh chemicals
limit what can be deposited before the final setting step. Other UV curable inks have been
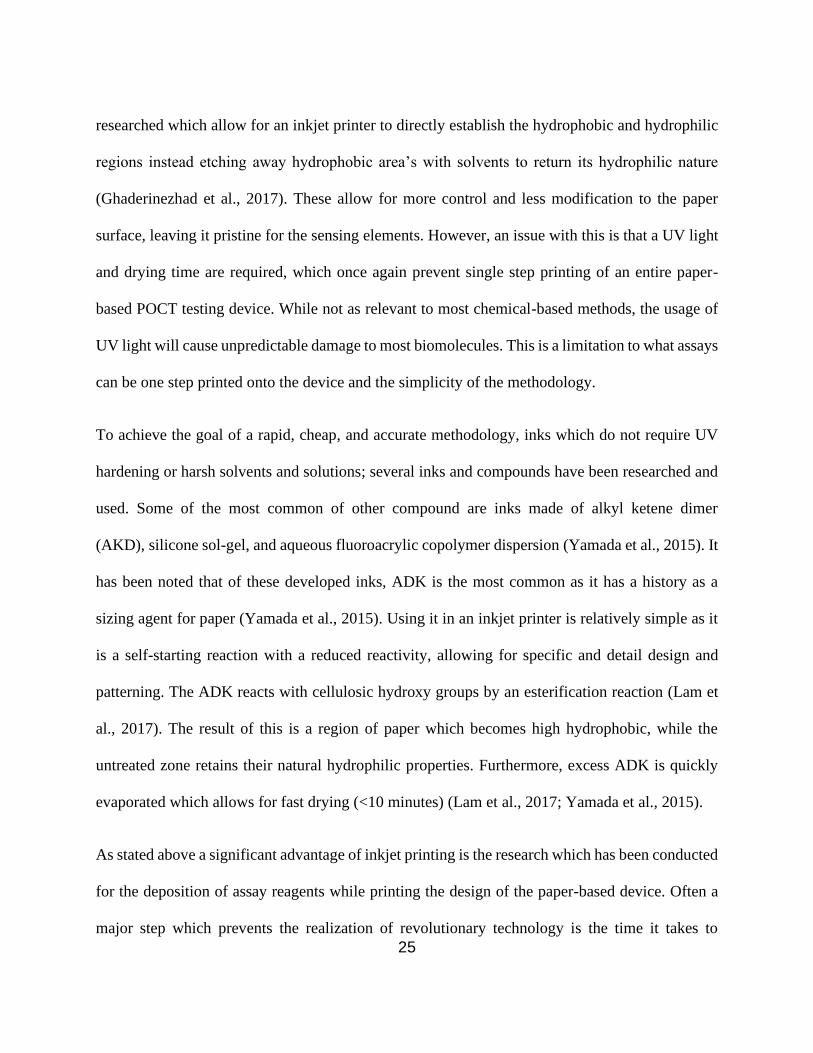
25
researched which allow for an inkjet printer to directly establish the hydrophobic and hydrophilic
regions instead etching away hydrophobic area’s with solvents to return its hydrophilic nature
(Ghaderinezhad et al., 2017). These allow for more control and less modification to the paper
surface, leaving it pristine for the sensing elements. However, an issue with this is that a UV light
and drying time are required, which once again prevent single step printing of an entire paper-
based POCT testing device. While not as relevant to most chemical-based methods, the usage of
UV light will cause unpredictable damage to most biomolecules. This is a limitation to what assays
can be one step printed onto the device and the simplicity of the methodology.
To achieve the goal of a rapid, cheap, and accurate methodology, inks which do not require UV
hardening or harsh solvents and solutions; several inks and compounds have been researched and
used. Some of the most common of other compound are inks made of alkyl ketene dimer
(AKD), silicone sol-gel, and aqueous fluoroacrylic copolymer dispersion (Yamada et al., 2015). It
has been noted that of these developed inks, ADK is the most common as it has a history as a
sizing agent for paper (Yamada et al., 2015). Using it in an inkjet printer is relatively simple as it
is a self-starting reaction with a reduced reactivity, allowing for specific and detail design and
patterning. The ADK reacts with cellulosic hydroxy groups by an esterification reaction (Lam et
al., 2017). The result of this is a region of paper which becomes high hydrophobic, while the
untreated zone retains their natural hydrophilic properties. Furthermore, excess ADK is quickly
evaporated which allows for fast drying (<10 minutes) (Lam et al., 2017; Yamada et al., 2015).
As stated above a significant advantage of inkjet printing is the research which has been conducted
for the deposition of assay reagents while printing the design of the paper-based device. Often a
major step which prevents the realization of revolutionary technology is the time it takes to

26
manufacture complex new systems and methodologies. An example of such an issue is the highly
scientifically successful lab-on-chip technologies which have been extensively researched but
generally have not made a significant splash into commercialized systems and technologies
(Yetisen et al., 2013). The main contribution to this is the need for more considerable research in
manufacturing methods and the ancillary technologies (pumps and power supplies) required for
the function of a vast majority of lab-on-chip technology (Mohammed et al., 2015). Utilizing pre-
established technologies and no requirement for pumps, paper-based microfluidics has a
significant advantage in overcoming these issues. Furthermore, the ability to disperse reagents and
biomolecules while patterning the paper substrate with well-developed and available inkjet
technology will play a significant role in moving the technology and methods from the research
bench to commercial success. For example, Hossain et al. used specially designed silica sol-gel
inks with entrapped enzymes for the development of an aflatoxin/paraoxon colorimetric sensor.
The inkjet cartages have the specialized inks added and while the device is being printed the
reagent are also added to the necessary sensing zones completing the test strip in one step. The
paper-based testing devices were manufactured entirely by the printer with modified inks and
could detect down to 30 nM of toxins when utilized with a simple color level algorithm (Hossain
et al., 2009b). This group also has used this technology in a variety of other assay configuration,
detecting pesticides, and pathogens at the nano-molar level (Hossain et al., 2012, 2009a). Other
compatible inks which integrate functionalized nanoparticles, carbon nanorods, and other
biological molecules (enzymes and antibodies) have been derived (Yamada et al., 2015).
The above are the main most common methods utilizes in the development of paper-based
microfluidic devices. However many others have been explored from utilizing screen printing

27
methods to create paper-based electrodes of varying materials (gold, silver, graphene) (Nie et al.,
2010b; Silveira et al., 2016), mass manufacturing flexographic printing (Olkkonen et al., 2010)
and more advanced methods like using laser and plasma techniques pattern paper (Xia et al., 2016).
These many different fabrication methods have made paper-based microfluidics more available
for development by researchers. Furthermore, many of these techniques can be utilized instead of
others, offering benefits and tradeoffs, meaning the most appropriate based on external factors can
be chosen. For example, photolithography is the most archaic but produces small diameter
channels very consistently. For a researcher with microfluidic facilities to develop PDMS / silicon
lab-on-chips, it is possible to switch over to developing paper-based technologies if the assay is
more appropriate on such a platform easily. The device design and components using this
technique can then be easily transferred to a more cost-effective, appropriate, or advanced method.
With conventional fabrication methods reviewed, we will now consider what methodologies are
possible on a paper-based microfluidic chip.
Paper-Based Microfluidics Bio-Detection Molecules
While it is often that antibodies are used as primary bio-recognition elements, they have significant
drawbacks which can limit their applicability in PoC systems. As stated previously as proteins,
they have specific environmental concerns which can affect the function or worse be damaged and
prevent functions. In recent years newer sensitive and specific bio-recognition molecules called
aptamers have been designed. Briefly, aptamers are short single-stranded DNA or RNA
oligonucleotides that have the ability of binding to specific molecules showing activity like
antibodies. Aptamers are structured as complementary base pairs that allow a stable secondary
structure to form a rigid functional structure to bind with their target molecule. Because of these

28
properties, aptamers have been developed to identify metal ions, small organic molecules,
peptides, proteins, viruses, bacteria, and whole cells (Keefe et al., 2010). Furthermore, they can be
used in biosensors with a higher density than antibodies and have been proven to be reusable
without changes in specificity or sensitivity (Lakhin et al., 2013). Lastly, this specific researcher
is their capability to bind and unbind to florescent quenching 2D material like graphene and
graphene oxide (Weng and Neethirajan, 2017a).
Sensory Methods Utilized on Paper-Based Microfluidic Sensors
3.3.4.1 Colorimetric
Most of the paper-based devices found are mostly an adaptation of current LFA and thin
chromatography assays brought into the realm of paper only microfluidics. These are assays which
utilize dyes which are molecular, enzymes, or nanoparticles based to show the presence of the
specified analyte (Adkins et al., 2017). For paper-based microfluidics patterned design allows us
to control and modulate the flow as we want directly. So, we can direct a single addition of a
sample to multiple different regions with stored reagents, creating detection zones. This is the
primary advantage of paper-based microfluidics in comparison to common LFA or thin
chromatography assays. The reagents that have been added to the detection zones can be
enzymatic, acid-base indicators, or dyes (organic and nano-particle based). The primary principle
of colorimetric analysis is visual change caused by a change in color in the zone of interest (Cate
et al., 2015). A common type of colorimetric assay is a modified sandwich-based ELISA which
uses immobilized antibodies first to capture immobilize an analyte of interest. Then a
complementary secondary antibody (or any other type of recognition elements like aptamers)
which is tied with an organic dye, tagged to a nanoparticle or has a reaction catalyst (enzyme)

29
attached to facilitate further future reactions is then allowed to diffuse across the region of
detection. The complementary antibodies interact with the analyte, that has been immobilized in
this specific region, causing a buildup of the secondary reagent. This either directly produces a
visible change in color or will cause one when the addition of a tertiary reagent is added to the
detection zone. An example of this is the paper-based ELISA developed by Cheng et al. which
utilized paper as the primary substrate to detect Rabbit IgE, producing a change in color on the
papers surface(Cheng et al., 2010). As seen in Figure 3, the rabbit IgE is immobilized on the papers
surface, the secondary antibody, which is tagged with alkaline phosphatase (ALP), is then
immobilized due to the rabbit IgE. After washing, BCI/NBT substrate is added to the cell and a
color change based on the amount of IgE present occurs (Cheng et al., 2010).

30
Figure 3: A) Schematic of the assay for detection of Rabbit IgE. B) Colorimetric detection of Rabbit IgE on
paper C) The results of detection with femta mol sample concentration. adapted from Cheng et al., 2010
Not all colorimetric methods use this modified ELISA methodology, but what is in common is
how the output of the device is perceived. Having a change, emergence, or stain of color represents
a change that is directly related to the analyte of interest. The example given above is quantitative;
however other may output more similar to most LFA and gives the user information that the analyte
of interest is present in detectable amount but provide no information as to how much is possibly
present (Koczula and Gallotta, 2016). Furthermore, the above assay is many times more complex

31
than the straightforward reactionary methods in which the reagents are designed to interact with
the analyte directly. These test act like litmus strips and just required the addition of the sample
and time for the reaction to occur. However, the original principle holds, a change in the color on
the device give the user direct-instrument free information on the status of the sample. This is the
main benefit of colorimetric assays and is highly accentuated when combined with the cheap cost
and easy manufacturability of paper-based devices for low resource settings.
3.3.4.2 Electrochemical Detection
Electrochemical detection is another detection methodology that has been utilized on paper-based
microfluidics due to its high sensitivity and specificity for the detection of analytes. The theory
which has been well developed over the last 50 years are often identically applied in paper-based
microfluidics. Electrode material like graphene or silver/silver chloride are patterned onto paper,
often in the traditional three-electrode configuration (Dungchai et al., 2010; Nie et al., 2010b).
These are commonly patterned by screen printing as done by Nie et al., 2010b, but other methods
such as the usage of inkjets to print gold and silver substrate have also been discussed Määttänen
et al., 2013. The basic theory to electrochemical detection is the evaluation of a change in the
electrical properties (resistance, inductance, capacitance, etc..) of an electrode due to the addition
of a sample. For this purpose, significant characterization has been done on commercial electrodes
so that these changes can be detected and attributed to specific causes or reactions. To prove that
they function as regular electrode Määttänen et al. conducted a comparative analysis of the paper-
based electrode to conventional chip, which as seen in Figure 4, shows significant equivalency
(Määttänen et al., 2013). The result of screen-coating the paper substrate created a surface that was
in most cases identical to those produced on conventional substrates like glass.

32
Figure 4: A) Layout and material of the paper-based microfluidic electrode B) Characterization of both
paper-based against conventional testing electrodes ((a) paper chip and (b) conventional cell. (c) The effect of
scan rate and SAM measured at constant analyte concentration with paper chip-II. (d) The effect of varying
scan rate and analyte concentration measured with glass-chip. The effect of scan rate measured with a
conventional cell using (e) Ag/AgCl/3 M KCl and (f) Ag/AgCl disk as the reference). This has been adapted
from Määttänen et al., 2013. Best viewed in color
Furthermore, Nie et al. also showed their equivalent capability to common disposable screen-
printed electrodes by creating a paper-based electrode for the detection of glucose that worked
together with a commercially available glucometer using chronoamperometry techniques (Nie et
al., 2010a). Using the paper electrodes in combination with a handheld meter showed results
identical and within error of the commercially available strips, while costing a fraction of the total
price in comparison (Nie et al., 2010a). Other than consistent baseline characterization of the
paper-based electrodes, it has been shown that standard methodologies like antibody
A
B

33
immobilization are possible and in some cases more efficient thanks to the increased surface area
due to the cellulosic structure of paper (Mettakoonpitak et al., 2016).
Utilizing the maturity and research conducted in the field of electrochemistry along with the
equivalent capability of paper-based electrodes these new ePADs (electrochemical paper
analytical device) can allow electrochemical sensors to have an even more significant impact.
While a reader is required which does not fully meet the needs of an ASSURED type device, the
advantages of electrochemistry (high sensitivity, high specificity and general ease of use) in
combination with a cheap and easily manufactured material (paper) may allow for greater access
to those in lower resourced settings (Mahato et al., 2017; Nie et al., 2010b). Another possible
advantage of this combination is the possibility to use paper designs and manufacturing methods
to increase the efficiency of the device as sample pretreatment steps and flow control of the sample
to the electrode surface can be easily integrated (Yetisen et al., 2013).
3.3.4.3 Optical
While not meeting the criteria required for an ASSURED device for low resource settings, the
advent of new portable optical detectors has made using these approaches more available (Mahato
et al., 2017). As more miniaturized devices for reading fluorescence, absorbance, and other optical
phenomena are developed, paper-based devices are an ideal test conducting platform as it will limit
the total future cost of using these devices. Paper devices can hold all necessary reactants, and
direct samples to multiple sensing zones make them ideal for use with portable optical technology.
A basic description of the principles for different optical techniques and their integration with
paper-based microfluidics will be provided below.

34
3.3.4.3.1 Fluorescence
This technique has begun to see more significant usage in paper-based microfluidics thanks to the
simplicity it provides for quantification of the assay result. Unlike absorbance techniques which
require the emittance and collection of scattering light, many fluorescent-based methodologies
emit or lose energy directly (Lakowicz, 2006). The result of this is portable sensors that emit
specific wavelengths of light and then test to see what is reflected or refracted from the sample.
These devices typically only need to emit a broadband signal of light anywhere between the UV
and IR wavelength ranges and then absorb light. With proper optimization and characterization of
the assay, can be tuned for specific wavelengths of interest (Shin et al., 2015). Furthermore, the
need for sophisticated detectors with light grading and separation of wavelength are not necessary
for fluorescent-based methods as the emission of light at some specific wavelengths are produced.
While this is a significant simplification of the research required, with robust optimization and
testing, it has been proven to be possible to create an onsite powered portable fluorescence sensor
(Fang et al., 2016). The device is capable of being tuned explicitly for a wavelength of interest by
altering the focal length of internal collimating mirrors, making it a truly versatile and portable
system for fluorescent-based detection methodologies (Fang et al., 2016).
Based on a review of available literature, it was seen that Fluorescence Resonance Energy Transfer
(FRET) based techniques are the most technique utilized with paper-based microfluidics. The basis
of the method is the use of a molecule or material which absorbs the energy released by an excited
molecule which releases phosphorescence (Lakowicz, 2006). Further explained, FRET is some
distance-dependent phenomena which the radiation is less transfer of energy from the donor
(phosphor) molecule to acceptor molecule (quencher). As this is a self-regulated interaction
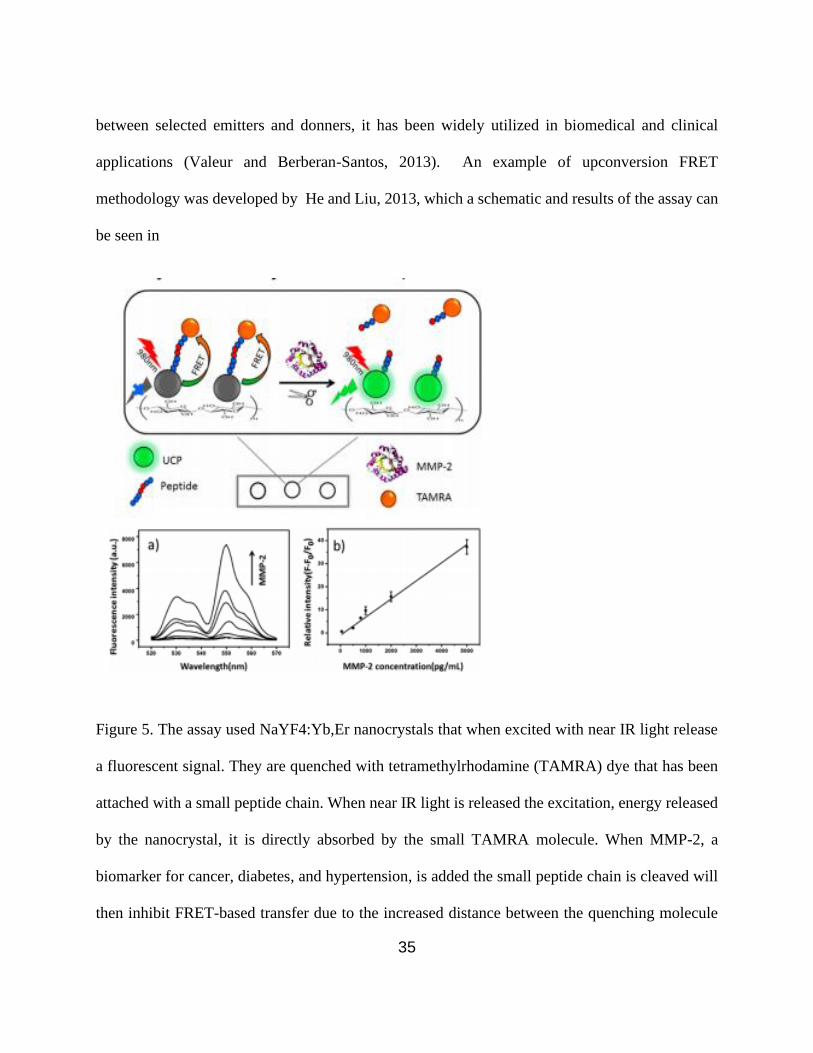
35
between selected emitters and donners, it has been widely utilized in biomedical and clinical
applications (Valeur and Berberan-Santos, 2013). An example of upconversion FRET
methodology was developed by He and Liu, 2013, which a schematic and results of the assay can
be seen in
Figure 5. The assay used NaYF4:Yb,Er nanocrystals that when excited with near IR light release
a fluorescent signal. They are quenched with tetramethylrhodamine (TAMRA) dye that has been
attached with a small peptide chain. When near IR light is released the excitation, energy released
by the nanocrystal, it is directly absorbed by the small TAMRA molecule. When MMP-2, a
biomarker for cancer, diabetes, and hypertension, is added the small peptide chain is cleaved will
then inhibit FRET-based transfer due to the increased distance between the quenching molecule

36
(TAMRA) and the emitting nanocrystal. The primary FRET-based principle has been utilized on
paper substrates with a variety of different emitters and quencher, utilizing material like QD, nano-
materials (nano-particles, graphene, and MoS2 sheets) and other molecules are used to produce
quantifiable detection of a range of analytes (Duan et al., 2015; Qi et al., 2017; Scida et al., 2013;
Su et al., 2015).
Figure 5: Paper-based upconversion technique for MMP-2 biomarker fluorescent signal generation with
experimental assay results conducted by a portable fluorescence detector. Adapted from He and Liu, 2013
and best viewed in color.
3.3.4.3.2 Chemiluminescence
Like fluorescent assays chemiluminescence (CL) does not truly meet the needs of an ASSURED
type device as it requires the usage of a detector for detection of the assay reaction. However,

37
unlike fluorescence which requires some stimulation of molecules to produce fluorescent signals,
CL reactions release photons. Using simple CCD detectors, it is possible to detect and correlated
the emittance of this light to the quantity of interaction between the reagents and the analytes in
the sample. A common CL reaction which is utilized in paper-based microfluidics is the reaction
of Luminol and H2O2 with a catalyst or intermediate, which can be used to increase or suppress
created photons. These photons can be detected and related to the components of the reaction (Xu
et al., 2006). Paper-based microfluidics provides some significant advantages for CL detection,
reagent storage, designability, time-delayed interaction and decrease in background signal all are
of a more significant benefit to CL reactions (Xu et al., 2006; Yetisen et al., 2013). As paper has a
highly voluminous structure, a small region can store significant amounts of reagents internally
(Costa et al., 2014). The paper-based devices can be designed to control and direct flow to slow or
increase the rate of the reaction. It can also be used to add or mix any additional reagents before
the reaction takes place (Yamada et al., 2015). Lastly, as paper as a reactionary background
provides no emission or reaction which produce photons itself, making it ideal for use in CL
reaction (Cate et al., 2015).
The detection of glucose and uric acid by Yu et al. (Yu et al., 2011) was conducted using CL as
the primary indicator for the reaction. The paper-based device was first patterned to direct the
loaded sample into two independent testing zones. The device used a rhodamine derivative with
the generated hydrogen peroxide to create a CL reaction which was then analyzed with a desktop
luminescence analyzer. The results showed that the sensor was capable of detecting uric and
glucose from 0.42mM to 50 mM and 1.4mM to 47 mM accurately (Yu et al., 2011). This is one of
the first real attempts at bringing CL assays to paper-based microfluidics. One of the benefits

38
acknowledged by the authors was the simplicity paper brought when conducting the assay. With
all the reagents pre-loaded, the system only needed the sample in a weak acid solution to be added
and then placed within the sensor. Furthermore, thanks to the protection of the paper, the reagents
were found to last for at least four weeks when stored in the correct environment (Yu et al., 2011).
CL reaction are being ever improved and found, new advancement and methodologies like the
usage of organisms which create chemiluminescent reactions and create light have been attempted
(Burnham et al., 2014). Others have utilized nanoparticles as both anchors and catalyst for the CL
reactions, such as the paper-based CL sensor developed by Liu et al. (Liu et al., 2014) which utilize
an interaction between Lumino-Hydrogen Peroxide reaction and the target analyte of L-Cysteine
is presented in Figure 6 (Liu et al., 2014).
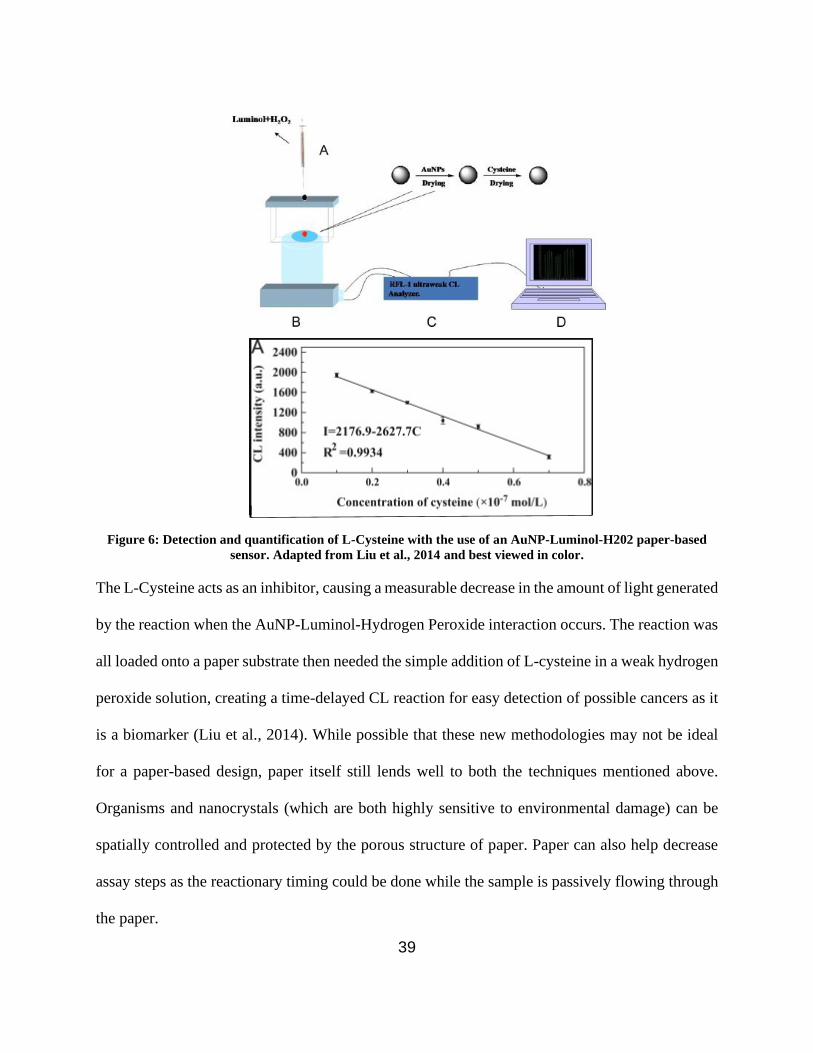
39
Figure 6: Detection and quantification of L-Cysteine with the use of an AuNP-Luminol-H202 paper-based
sensor. Adapted from Liu et al., 2014 and best viewed in color.
The L-Cysteine acts as an inhibitor, causing a measurable decrease in the amount of light generated
by the reaction when the AuNP-Luminol-Hydrogen Peroxide interaction occurs. The reaction was
all loaded onto a paper substrate then needed the simple addition of L-cysteine in a weak hydrogen
peroxide solution, creating a time-delayed CL reaction for easy detection of possible cancers as it
is a biomarker (Liu et al., 2014). While possible that these new methodologies may not be ideal
for a paper-based design, paper itself still lends well to both the techniques mentioned above.
Organisms and nanocrystals (which are both highly sensitive to environmental damage) can be
spatially controlled and protected by the porous structure of paper. Paper can also help decrease
assay steps as the reactionary timing could be done while the sample is passively flowing through
the paper.

40
Overview of Available Paper Based Sensors for Food Allergen Detection
The information provided above is to help the reader understand what paper-based microfluidics
are and what possibilities exist with them. The different methods of manufacturing and the diverse
methodologies possibly make them a potent tool for point of care (POC) diagnostic and testing. In
this section below, we will now look at what research has been developed so far for paper-based
detection of food allergen contaminations. The focus will be on a time frame of the last six years
and be very specific to the device that utilizes paper as the first reactionary surface, fluid transport
mechanism, and reagent storage. Therefore, LFA technologies that are commercially available will
not be discussed, as these mechanisms have been highly explored and exploited (Koczula and
Gallotta, 2016). When necessary, however, new methodologies or uses of materials used on
complex LFA that could be brought to paper only will be discussed.
3.3.5.1 New Developed µPADs Systems for Food Allergen Detection
As food allergies increase in prevalence, the need for paper-based detection methods becomes
increasingly significant. This is because having an easy and cheap method of testing your food
will allow the afflicted individual to either test all commercial food products or at least give them
greater flexibility for testing when they feel it is needed. Although there is a significant need for
POCT devices for allergens, it is to be noted that minimal recent work for paper-based allergens
sensors has been completed. The most recent device for the detection of food allergens was
developed by our group, The BioNano Lab, by Weng and Neethirajan, 2016. This device utilized
a hybrid PDMS-paper design, where paper was used to transport samples to zones with pre-
dispersed reagents for the fluorescent detection of two food allergens (Egg white lysozyme and ß-
conglutin lupine) two food toxins (okadaic acid and brevetoxin). Focusing on allergens, the

41
portable device can detect samples of lysozyme and lupine from 0 to 4,000 and 0 to 30 μg/g,
respectively, in under 5 minutes (Weng and Neethirajan, 2017a). This florescent based detector
utilizes quantum dots (QD) which have been tagged with analyte-specific aptamers. Aptamers are
chains of nucleic acids which have been designed to detect a specific analyte, acting like antibodies
and binding to them. However, in this assay they are used to enable FRET-based quenching of the
QD with graphene oxide (GO) as ssDNA (like aptamers) have unique adsorption onto its surface
through pi-pi bonding (Park et al., 2014). This is a weak interaction which, when in the presence
of the analyte will de-adsorb, allowing the release of fluorescent energy when excited as seen in
Figure 7. Furthermore, a comparison between this paper-based assay and a commercially available
ELISA kit should (Weng and Neethirajan, 2017b). This is a highly versatile assay as the
recognition element, the aptamer, can easily be changed for any specific allergenic protein in
question. The benefit of paper is specifically related to the minimal background fluorescence
created, which further enhances detection. Furthermore, the paper-based device utilizes the paper
porous structure to increase the amount of reagent present so that a high signal in a smaller volume
can be achieved. These two aspects are what make paper so ideal in this application; other recently
conducted research could also benefit from these properties and are discussed below.

42
Figure 7: Design and function of a paper-based device developed by Dr. Weng of the BioNano Laboratory for
the detection of fluorescent detection of two food allergens (Egg white lysozyme and ß-conglutin lupine) two
food toxins (okadaic acid and brevetoxin). Adapted from Weng and Neethirajan, 2017a and best viewed in
color.
The study by Weng and Neethirajan, 2017a were the only literature found in recent years which
detected any of major allergens with the use of paper as a primary substrate. While there is limited
the work conducted in this field so far, there is significant hope for the future. First, it is essential
to note that detection of proteins in paper-based microfluidics has been a significant field of study,
mostly in the biomedical sphere of research (Anderson et al., 2017; Yetisen et al., 2013). This
43
growth is directly correlated with the increasing research and methods for specific detection of
proteins, using molecules like antibodies, aptamers, and proteins with designed affinity to capture
and label proteins of interest (Anderson et al., 2017). Included with this increase in affinity specific
detection methods has been the improvements to localized dispersal of reagents and development
of electrodes (Silveira et al., 2016; Yamada et al., 2015) and new methods for covalent
immobilization of antibodies in the cellulosic structure, without affecting the hydrophilic nature
and bio-compatibility of the paper (Zhu et al., 2018).
New immunological methods that utilize these improvements in bio-recognition and paper
modification make it possible to bring new and previously researched methods to paper-based
microfluidics. H. Xu et al., 2014 used gold nanoparticles that have been labeled with allergen-
specific antibodies, which are mounted within silicon nanorods. These are used in a sandwich
format with the same antibodies immobilized on nitrocellulose for the LFA. The assay can detect
allergenic proteins, which in this case was a model rabbit IgG protein, down to 0.05 ng/mL, which
was found to be 50 times more sensitive than previously developed assays. The readout was a
simple colorimetric line indicator which could later be quantified with a simple camera phone, as
seen in Figure 8A (H. Xu et al., 2014). A similar LFA assay was conducted for the detection of
casein, a milk allergen, but used a fluorescence based detection approach. As seen in Figure 8B,
florescent microspheres were used as the primary label recognition molecule and are immobilized
by the secondary antibody found at the sensing zone. The amount of fluorescent signal was then
directly correlated to the amount of analyte detected, and was able to detect casein concentrations
between 100 – 10000 ng/mL (Cheng et al., 2017). These LFA designs which needed the usage of
nitrocellulose for immobilization of the secondary recognition molecules can now be entirely
44
conducted with similar sensitivity and performance on patterned paper based designs. (Zhu et al.,
2018). LFA are expensive not only because of the variety of materials and modification, but they
need to be assembled. Thanks to recent research, paper only requires slight modification to allow
for immobilization of the sensing elements. The cellulosic structure is modified by sodium
pentahydrate to create an area where antibodies can be covalently immobilized, functioning like
nitrocellulose (Zhu et al., 2018). Paper’s natural porosity allows for the same reagent storage and
fluid movement capabilities that LFA systems are capable of. It is to be noted that common
immunological tests are estimated to cost less than 1 cents per a unit when mass produced with
paper as the base substrate (Yetisen et al., 2013). These developed assays and many other can be
brought into the realm of paper only assays, which would make them cheaper while being as
effective.
Electrochemical (EC) detection of allergenic material has also been very explored in recent years
as it provides a relatively simple analysis method once the assay has been designed and optimized.
With the use of affinity specific biorecognition elements (antibodies, aptamer, affinity proteins),
electrodes can be used for the detection of several different allergens. As previously explained,
paper-based biosensors have been shown to have similar performance and behave identically when
layered with conductive inks (gold, silver, conductive polymers) and standard graphene
(Määttänen et al., 2013). It has also already been shown that they can easily be integrated with
current commercial technologies, lowering the cost of EC detection while retaining its sensitivity
and selectivity (Nie et al., 2010a). In the past ten years, significant work into electrochemical (EC)
allergen sensing has been conducted and many affinity-based EC sensor have been developed for
the entire range of allergens (peanut, milk, egg, soy, shellfish and other nuts) (Vasilescu et al.,

45
2016). An elementary and recent EC detector of Ara h1 by Alves et al., 2015 used cheap disposable
electrode coated with gold nanoparticle ink to detect quantities between 12.6 – 2000 ng/mL (Alves
et al., 2015). The assay, as shown in Figure 8C, utilizes a secondary binding molecule tagged with
silver, which would be reduced to Ag2+, creating a specific peak on a linear sweep voltammogram.
A significant issue for this EC assay was that long-time required for the conjugation of each step,
and necessary washing steps. Paper-based microfluidics offers some possible benefits for this
assay: paper has a natural wicking ability; assay reagents can be stored within the paper itself and
specific design can be made to control diffusion into sensing regions (Abbas et al., 2013;
Jahanshahi-Anbuhi et al., 2014). This assay required frequent washing and drying steps and
continued addition of secondary reagents. Paper can wick away excess sample and reagent which
will decrease washing and drying time. Subsequently, the secondary reagents like the tagged
antibodies could be stored within the paper structures and when required some solution can be
added to allow it to flow into the sensing region. Other solution like new time-delayed bridges
could be used to limit the diffusion rate (Cunningham et al., 2016). These capabilities of paper
would both decrease the time and simplify the assay while still being utilized with commercial
electrochemical readers.

46
Figure 8: A) Schematic of the paper-based microfluidic sensor developed by H. Xu et al., 2014 for the visual
detection of proteins of interest by eye or simple color scanning. B) Florescent paper LFA based assay for the
detection milk allergen casein using labeled florescent microspheres by Cheng et al., 2017. C) Electrochemical
based detection of analytes of interest using secondary binding antibodies conducted on paper by (Abbas et
al., 2013). Adapted from Abbas et al., 2013; Cheng et al., 2017; H. Xu et al., 2014. Best viewed in color.
A B
C
47
3.4 Assay Materials and Background
Conducting Polymer Nanoparticles
Many of the currently available methods utilize gold and enzyme as the primary labels, which is a
result of them being used and heavily researched in the lab setting. Other labels such as quantum
dots and inorganic dyes have also been of increasing research but have an issue related to
sensitivity, expense, or the instrumentation required. For instance, gold which is commonly used
for colorimetric systems is expensive and enzymatic active tags require specific condition,
blocking and stopping reagents and are hard to precisely control in non-lab environments (Aydin,
2015). To solve some of these issues, new materials are tested and used to augment and further
improve immunoassay like methods for PoCT devices. One such material that has begun to see
such usage are the class of polymer nanoparticles. While first developed in 1977, these particles
have seen increasing usage in our technology as they are better understood. Currently, we find
these particles in TV, organic sensing elements, organic transistors, in-vivo drug delivery, and
other state of the art technologies (Nambiar and Yeow, 2011). They are used in such a wide array
of sciences because of how versatile, customizable and inexpensive they are in comparison to
metal or crystal particles.
Briefly explained, their versatility and customizability arise from the fact that many different
monomers and polymer have been polymerized into nanoparticles. The polymers often keep their
independent properties allowing researchers to add new capabilities or methods for PoCT devices.
For example, thanks to the ability to incorporate other elements into their matrix, it is possible to
make non-conductive polymers into semi-conductive or even wholly conductive. This occurs due
to the monomers and subsequent polymer active groups, causing either hydrophobic or hydrophilic

48
interactions (related to charge). The chains are first dispersed to critical solubility in a solvent
(often THF) than quickly pipetted into water and heated. This caused the formed chains to bend
and curl up. These are then polymerized to retain their shape, and thus, polymer nanoparticles are
formed based on the charged groups on the polymer base chain. During this process, it is possible
to add non-polymer elements to the matrix which are encapsulated and found with the internal
structure of the nanoparticle. This is the basis of drug delivery nanoparticles and a highly versatile
method to add new capabilities to the particles without significant effect its base structure as they
can be spread out thinly, this allows for the development of electrodes that can be used equivalently
to gold or carbon electrodes but require less sensitive manufacturing equipment (Ambrosi et al.,
2008). For example, doping a polymer with DBSA (4-Dodecylbenzenesulfonic) allows for high
conductivity, but it can be unstable. Adding it to the polymer particles will protect the doping agent
from full exposer, possibly lengthening the life span of the electrode. Furthermore, it is possible
to use different monomer within one particle to create a system with even more specific properties.
By adding in co-polymer blends into the process, the introduction of new resistances or the
possibility of tuning other parameters like biocompatibility, optical emission, or the previously
mentioned electrical activity is possible (Nambiar and Yeow, 2011). It is also possible to alter the
solubility or increase susceptible to degradation by the human cells. Combining this functionality
with bio-receptors designed to look for diseased cells has made targeted drug delivery possible.
This not only prevents drugs from being used in excess, but the release of the drug on-site of the
disease has been shown to dramatically increase the efficacy of the drug in comparison to current
delivery methods (Li et al., 2017). Thanks to their manufacturing variability, ease of property

49
modification and general bio-compatibility with proteins and DNA they are of increasing
consideration in the field of PoCT devices (Balint et al., 2014; Wang and Duncan, 2017).
In this project, the focus will on the use of MEH-PPV polymers to create the central sensing
platform for allergen detection. Utilizing MEH-PPV to create a system which limits the need for
reagents and can be stored and function in a regular environment. Poly[2-methoxy5-(2′-ethyl-
hexyloxy)-1,4-phenylene-vinylene] (MEH-PPV) as seen in Figure 9, is a long-chain molecule
which has numerous applications in technology itself, from OLED displays to new optoelectrical
sensing devices.
Figure 9: Molecular structure of a single MEH-PPV monomer (Hooley et al., 2014).
The average molecular weight of the polymer chains is known to be between 40 000- 70 000 units.
MEH-PPV, when polymerized, has already been proven to be stable in water and other
physiological environments without causing any biocompatibility issue (Xu et al., 2015).
Furthermore, this polymer exhibits regular fluorescence when excited by wavelengths of light at
485nm (Ghosh et al., 2017). The fluorescent emission is produced by the molecular structure of a
single mer building block, which emit light at a wavelength with the visible spectrum (approx.
580nm) producing an orange-like color when excited. Using a combination of new techniques, we
can, in theory, use the regular florescent of the material as an indicator for the amount of allergen
in a sample indirectly. This would allow the PoC system to produce a qualitative result and if a

50
strong relationship between fluorescence intensity and concentration exist the possibility of
making a quantitative curve which can help identify analyte concentrations. Other important
properties of this polymer are the fact that MEH-PPV is highly stable in water for extended periods
and have already been proven to have low cytotoxicity. This means that the particles themselves
will not cause conformation changes to proteins inducing false reports. Furthermore, their
fluorescence is with an range which can be easily quenched through emission-absorbance
interactions with materials like iron, graphene or gold; this makes future experiments far more
open and versatile if an issue occurs (Huang et al., 2011; Huang and El-Sayed, 2010; Xu et al.,
2015).
Gold Nanoparticles
As stated previously we find that many of the available POC assays utilize gold or other metallic
nanoparticle as the primary labeling mechanism. The biggest issue with the use of these particles
is that in comparison to newly researched labels like polymer nanoparticles is that they have an
inherent expensive cost due to the rarity of the material (Aydin, 2015). The more substantial
benefit, however, to these materials is that they have been widely researched thanks to their
positive qualities as a primary indicator for assay of all types and configurations (Elahi, 2018). The
remarkable properties are all related to gold nanoparticles surface plasmon resonance (SPR), which
is the collective oscillation of the surface conductive electrons affected by the incident
electromagnetic wave. This causes dipole moments to occur, leading to the extinction of specific
wavelengths, resulting in their strong signal and color (Wolfgang Hais, 2009). Specifically, we see
a redshift in color due to the absorbance of green wavelengths; furthermore as size increases, we
see that the extinction band also shift causing a change in color of the solution based on the size

51
of the particles. This can be further exploited as a modification of the surface of AuNP can cause
disturbances in the SPR which results in a shift of wavelengths without size increase. Due to this,
the SPR is highly size, shape and composition-dependent which allows assays to be tuned or
naturally develop specific properties making it possible to utilize different detection methods based
on colorimetric, florescent, Surface Enhanced Raman, and electrochemical principles. (Elahi,
2018).
Furthermore, many assays have been developed for different analytes which require that the
particle can have a tuned affinity. Affinity tuning is most often done by utilizing different chemical
and biological agents to react with the analyte in a method which allows for quantification. For
example, chemical agents such as quaternary ammonium group-terminated thiol (QA-SH) can be
used to detect mercury in water samples by causing aggregation of the AuNP due to ligand
exchange (Chen 2017). Biological methods are far more straightforward and utilize agents like
Antibodies and Aptamers with specific affinities to identify targets with the AuNP acting as the
labeling molecule allowing for detection of the analyte. Both these methods of detection require
surface modification of the gold nanoparticles which can be accomplished through a variety of
methods defined in three main categories. The first most common is based on the absorption
properties on to the surface of the gold nanoparticles to add affinity elements. This is done by
either electrostatic or hydrophobic interaction with the surface. The next method used is to
covalently bind the reagents to the surface of the AuNP, commonly in this case thiol bonds using
sulfur are used as they have one step interaction with gold allowing easy surface modification. The
last commonly used method is adding moieties which have an affinity with specific biological
agents allowing for detection of the wanted analyte (Corderio, 2016). These methods and research

52
have made the utilization of gold for the development of assay far simpler as proven processes
allowing functionalization combined with their steady signal output make assay platform far more
straightforward to develop for a range of analytes.
Aptamers
Aptamers are a single-stranded nucleic acid (DNA or RNA) or peptide biopolymers with high
affinity towards a specific molecule. Their specificity is comparable to that of monoclonal
antibodies. While it is often that antibodies are used as primary bio-recognition elements, they
have significant drawbacks which can limit their applicability in PoC systems. As stated previously
as proteins, they have specific environmental concerns which can affect the function or worse be
damaged and prevent function. In recent years newer sensitive and specific bio-recognition
molecules called aptamers have been designed. Briefly, aptamers are short single-stranded DNA
or RNA oligonucleotides that have the ability of binding to specific molecules showing activity
like antibodies. Aptamers are structured as complementary base pairs that allow a stable secondary
structure to form a rigid functional structure to bind with their target molecule. Because of these
properties aptamers have been developed to identify metal ions, small organic molecules, peptides,
proteins, viruses, bacteria, and whole cells (Keefe et al., 2010). Furthermore, they can be used in
biosensors with a higher density than antibodies and have been proven to be reusable without
changes in specificity or sensitivity (Lakhin et al., 2013). Relevant to this specific researcher is
their capability to bind and unbind to florescent quenching 2D material like graphene and graphene
oxide (Weng and Neethirajan, 2017a). Due to these advantages and properties, aptamers were
chosen. The aptamer are found in a process labeled SELEX, which identifies DNA sequences with
affinities for particular analytes and allows replication. In summary, a Systematic evolution of

53
ligands by exponential enrichment (SELEX) procedure processes seen in Figure 10, would be
conducted. Possible ssDNA chains with affinity to the proteins of interest are identified and
replicated. Testing to identify structure, specificity and affinity of these possible aptamer will be
conducted and the best chosen.
Figure 10: Common SELEX procedure conducted for the isolation and development of analyte-specific
aptamers. Adapted from Kim and Gu, 2013 and best viewed in color.
Graphene Materials
In recent years graphene-based materials have experienced an explosion of research due to their
numerous beneficial properties and availability. Mainly, graphene-based materials like graphene
(G) and graphene oxide (GO) sheets have seen extensive use in the development of new
biosensors for a range of applications. From biomedical to environmental analytes, graphene-
based materials have taken over as a primary component of the designed assays. In this review
we will focus on the use of GO as it has proven interactions with DNA in processes like those we
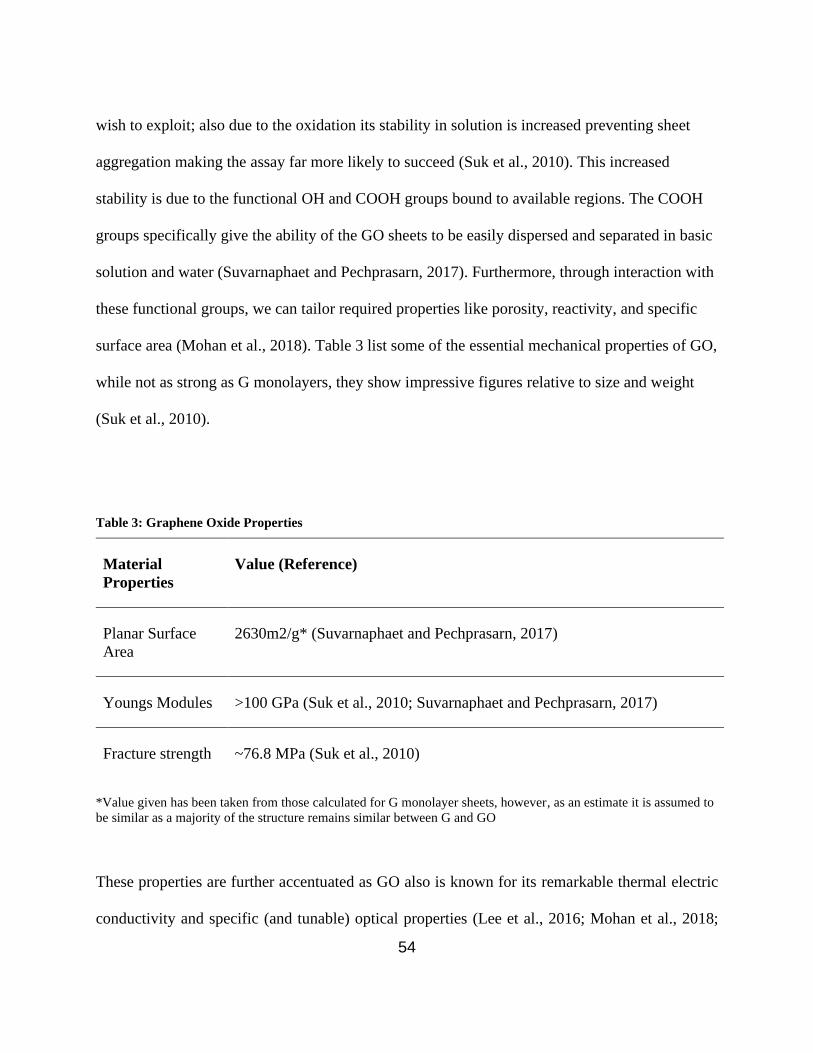
54
wish to exploit; also due to the oxidation its stability in solution is increased preventing sheet
aggregation making the assay far more likely to succeed (Suk et al., 2010). This increased
stability is due to the functional OH and COOH groups bound to available regions. The COOH
groups specifically give the ability of the GO sheets to be easily dispersed and separated in basic
solution and water (Suvarnaphaet and Pechprasarn, 2017). Furthermore, through interaction with
these functional groups, we can tailor required properties like porosity, reactivity, and specific
surface area (Mohan et al., 2018). Table 3 list some of the essential mechanical properties of GO,
while not as strong as G monolayers, they show impressive figures relative to size and weight
(Suk et al., 2010).
Table 3: Graphene Oxide Properties
Material
Properties
Value (Reference)
Planar Surface
Area
2630m2/g* (Suvarnaphaet and Pechprasarn, 2017)
Youngs Modules >100 GPa (Suk et al., 2010; Suvarnaphaet and Pechprasarn, 2017)
Fracture strength ~76.8 MPa (Suk et al., 2010)
*Value given has been taken from those calculated for G monolayer sheets, however, as an estimate it is assumed to
be similar as a majority of the structure remains similar between G and GO
These properties are further accentuated as GO also is known for its remarkable thermal electric
conductivity and specific (and tunable) optical properties (Lee et al., 2016; Mohan et al., 2018;

55
Suvarnaphaet and Pechprasarn, 2017). GO also has specific secondary properties like its affinity
to creating pi-pi bonds with carbon ring structures, allowing for unique and exploitable interactions
with DNA, proteins, and other biological molecules. It is biocompatible and easy to work with
thanks to the abundance of research, making it an ideal material for usage in biosensor assays (Lee
et al., 2016).
Biosensors have utilized GO as a basis for many different methods ranging from electron donor
and Foster Resonance Energy Transfer (FRET) as both a florescent quencher and original label.
This occurs due to the strong pi-pi stacking capabilities previous described allowing emitter to
enter a close enough proximity to allow for FRET. It is also used as the primary structure for
Surface-Enhanced Raman due to the fact it can absorb background fluorescence and that there can
be designed chemical enhancement using electron transfer (Lee et al., 2016; Suvarnaphaet and
Pechprasarn, 2017). Finally, the most common and researched use of GO has been in the
development of electrochemical based biosensors. The primary focus in its uptake in use has been
because of its highly characteristic electrical and thermal properties, making it an efficient base
for a variety of electrochemical sensing strategies. This, in combination with its easy of surface
modification and the string mechanical properties has made it a staple in the development of a
range of biosensors (Lee et al., 2016),.

56
4 Materials and Methods
The development of an onsite detection method for food allergens was based on two individuals
approaches due to material properties. The first researched methods utilized the fluorescent
properties of PnP in a competitive assay design with aptamers. Onsite POCT systems need to be
accurate, fast, and as cost-effective as possible. Utilizing MEH-PPV polymers to create small
fluorescent particles which act as the primary label is not only cost-effective; florescent based
approaches are highly sensitive, and the availability of cheap onsite detection instrumentation due
to research efforts has made it far more accessible (Sung et al., 2017). The second approach
considered was to further eliminate the need for any external systems, beyond the eye and a
standard smartphone, and create a purely colorimetric approach with the use of AuNP. AuNP is a
highly research field in the area of onsite detection, thanks to their excellent optical properties.
They are highly visible in solution and thanks to their high extinction coefficient straightforward
to utilize with basic absorbance-based spectroscopy methods. In this following section, the
principles, materials, and methods for each method have been documented.
4.1 General Equipment
TEM imaging (Tecnai G2 F20) was taken to obtain the micrographs. For the spectral scanning,
Cytation 5 (BioTek), and Cary 100 UV-Vis (Agilent) were used. The samples were centrifuged on
Sorvall ST 40 R (ThermoFisher Scientific). Boiling and heated in Precision Water Baths 280
(Thermo Fischer Scientific). Incubations took place in the Incushaker mini (Southwest Science).
Milli-Q water was used in all the experiments (0.055 μS/cm).

57
4.2 MEH-PPV (PnP) Florescent Based Method
Principles
Figure 11 is the first purposed methodologies suggested, utilizing the fluorescent properties of the
particle and its primary emission to determine the presence and concentration of allergen. It is
known that the PnP fluorescent signal is quenchable with the use of quenching materials such as
Graphene or Graphene Oxide (Ran et al., 2012). The central carbon ring backbone of the MEH
PPV polymer chain will in theory form Pi-Pi interaction with the Graphene-based materials,
enabling FRET-based energy transfer of the free electron to cause the fluorescent signal to be
quenched. Aptamer are used as a steric interferer preventing the PnP from coming close enough
allow FRET-based energy transfer. Furthermore, Aptamers when not in the presence of their
specific target are known to from significant Pi-PI interaction with 2D carbon-based materials like
Graphene and Graphene Oxide. Using currently available literature, we have theorized that there
is a far higher affinity between the Aptamer and 2D Carbon materials, leading to the estimated
steric interference, which prevents the quenching of the PnP fluorescent signal. The higher the loss
in the PnP fluorescent signal, the greater the concentration of the allergen in the sample in theory.

58
Figure 11: Schematic of principles of MEH-PPV polymer nanoparticle-based food allergen detection. Best
viewed in color.
Material
Phosphate buffer saline (1x PBS; 0.01 M phosphate buffer, 0.0027 M potassium chloride, 0.137
M sodium chloride, pH 7.4), graphene oxide, bovine serum albumin (BSA), sodium chloride
(NaCl), hydrochloric (HCl), sodium hydroxide (NaOH), poly[2-methoxy-5-(2′-ethylhexyloxy)-p-
1,4-phenylenevinylene] (MEH PPV) and tetrahydrofuran (THF) were all purchased from Sigma-
Aldrich Canada.
Synthesis Protocols
4.2.3.1 Synthesis Protocol
Hydrophobic poly[2-methoxy-5-(2′-ethylhexyloxy)-p-1,4-phenylenevinylene] nanoparticles
(PnP) were synthesized in a single pot processing method. Particles are dispersed with the help of
shear forces generated from an ultrasonic probe to create uniform spherical nanoparticles (PnP)
(Xu et al., 2015). 10mg MEH-PPV polymers are first dissolved in nitrogen degassed THF for 10

59
Hrs under a nitrogen atmosphere. 0.5mL of this stock solution was then diluted in 5mL more of
degassed THF then quickly added at high pressure to 15mL of double distilled water that is under
ultrasonication. After the mixture is sonicated for 30 minutes at 10o C the excess THF is evaporated
with the use of a vacuumed water bath set to 78o C, bringing the final volume to 15mL(Xu et al.,
2015). THF is a robust organic solvent which is used in this case to untangle the polymer chains
of the MEH-PPV stock. MEH-PPV is hydrophobic, resulting in the constrained spherical
morphology. Ultrasonication is a required step within this process as the shear forces and long
dissolving time allow for polymer chains to untangle and separate before they are introduced to
water. Specifically, the addition of the ultrasonic vibration was found to decrease the size of the
average particle to ~100nm or less in size on average (Changfeng Wu et al., 2006). Once the
particles are formed and wholly removed from THF solvent by evaporation, leaving small pure
PnP.
Characterization
PnP were characterized using a standard method for analysis of morphology (size, shape) and
fluorescence Spectroscopy. Absorbance and fluorescence were taken and compared against
literature; it is expected that the absorbance peak will be found at 490nm and the expected
fluorescence is 595nm. Finally, TEM was utilized to image and observe the morphology of the
PnP. The expected size of the particles is within the ~100nm range (Xu et al., 2015).
Optimization
4.2.5.1 Mixing Time Optimization
The first optimization conducted is determining the time necessary to allow for fluorescent
quenching of the PnP to occur. 50uL of PnP were mixed with the equivalent to 1mg/mL

60
ultrasonicated Graphene Oxide (GO) and topped up to 200uL with DDH2O and allowed to mix on
an orbital shaker for up to 60 min at 120 RPM. The temperature of the mixture was maintained to
approximately 10o C and are completely covered from external light sources to prevent fluorescent
output loss of the particles over time (Ran et al., 2012). The emission results were collected with
the use of the Cytation 5 Multimodal plate reader and used to facilitate all future experiments for
characterization of the PnP performance concerning the theorized assay.
4.2.5.2 GO Quenching Optimization
Once mixing time was determined the quantity of GO required to quench a majority of the PnP
fluorescent signal was optimized. Using standard 96 well plates, 50uL of PnP solution and
equivalent concentration from 0.025mg/mL to 1.5mg/mL of GO were mixed and placed on the
orbital shaker at 10oC for 10 minutes. After the mixing time was complete, they were quickly
transferred to the Cytation 5 multimodal plate reader and excited, and the emission spectra was
recorded.
4.2.5.3 PH Optimization of GO – PnP interaction
Finally, as the bases of the targeted detection utilized Aptamers to identify the target protein. To
maximize the potential assay capabilities, it is crucial to determine what effect PH may play in the
PnP-GO system. This is experimentally determined by setting up an optimized reaction of the PnP-
GO in differing PH adjusted solution from PH 4 to PH 10. After 10 mins of incubation, the samples
were quickly loaded into the Cytation 5 multimodal plate reader, and the fluorescent emission was
recorded.

61
4.3 Gold Nanoparticle (AuNP) Optical / Colorimetric Based Method
Principles
AuNP are non-fluorescent but have a high extinction coefficient which causes significant visible
pigmentation of the solution they are in. AuNP allows the use of a purely colorimetric approach
for detection of allergenic proteins, while not as sensitive as a fluorescence-based approach it is
far simpler to implement into a working onsite methodology. The optimization of the AuNP
particle for detection is based on the assay approach seen in Figure 12. In comparison to PnP
particles, AuNP will be modified with the aptamers using the intermediate biological tagging
molecule Streptavidin (SA) and its target Biotin. With the Aptamers on the surface of the
molecules, we will once again utilize the known affinity of interaction between free Aptamers and
2D Carbon materials to cause aggregation related to the concentration of the allergen in the sample.
In the absence of allergenic material, when GO is added, we will see an aggregation of the free-
floating AuNP into clusters. Oppositely, the more allergen in solution, the less aggregation was
seen. Therefore, we are explicitly using the change in color of the solution as a representation in
the amount of allergen present.
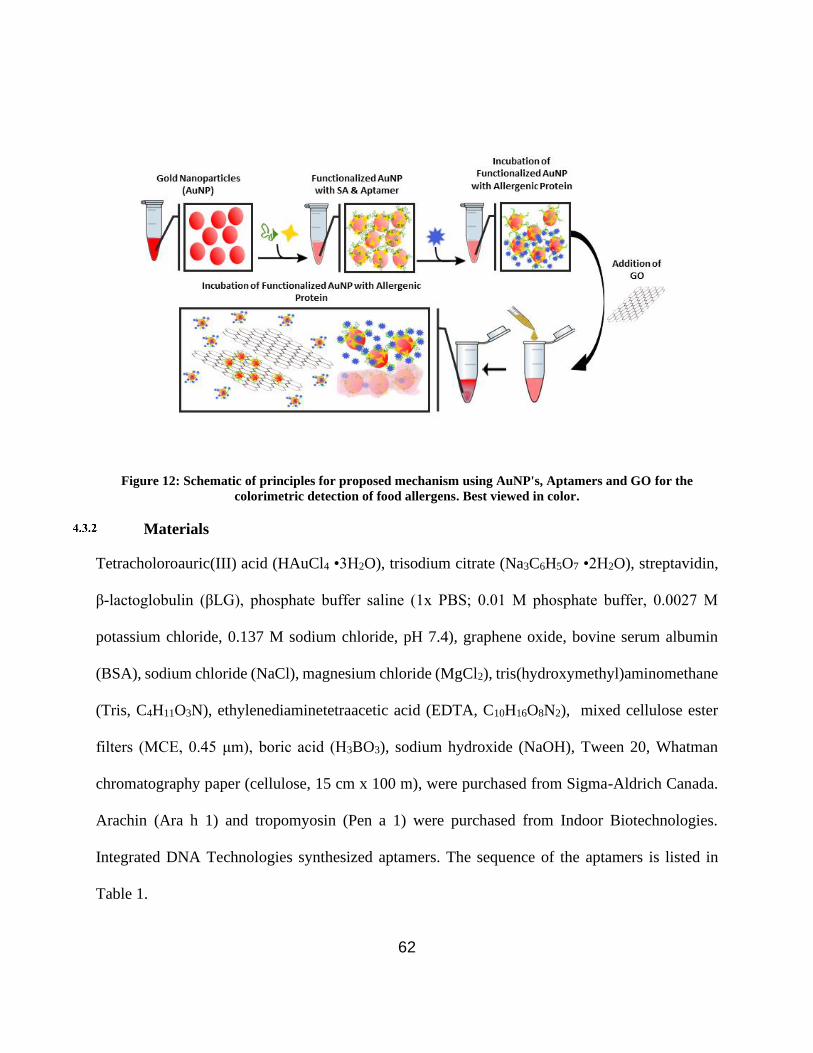
62
Figure 12: Schematic of principles for proposed mechanism using AuNP's, Aptamers and GO for the
colorimetric detection of food allergens. Best viewed in color.
Materials
Tetracholoroauric(III) acid (HAuCl4 •3H2O), trisodium citrate (Na3C6H5O7 •2H2O), streptavidin,
β-lactoglobulin (βLG), phosphate buffer saline (1x PBS; 0.01 M phosphate buffer, 0.0027 M
potassium chloride, 0.137 M sodium chloride, pH 7.4), graphene oxide, bovine serum albumin
(BSA), sodium chloride (NaCl), magnesium chloride (MgCl2), tris(hydroxymethyl)aminomethane
(Tris, C4H11O3N), ethylenediaminetetraacetic acid (EDTA, C10H16O8N2), mixed cellulose ester
filters (MCE, 0.45 μm), boric acid (H3BO3), sodium hydroxide (NaOH), Tween 20, Whatman
chromatography paper (cellulose, 15 cm x 100 m), were purchased from Sigma-Aldrich Canada.
Arachin (Ara h 1) and tropomyosin (Pen a 1) were purchased from Indoor Biotechnologies.
Integrated DNA Technologies synthesized aptamers. The sequence of the aptamers is listed in
Table 1.

63
Table 1 Aptamer Sequence for detection of each specific allergen
Allergen Sequence Bases
(nt)
Tm
(°C)
GC
%
β-
lactoglobulin
ATA CCA GCT TAT TCA ATT CGA CGA TCG
GAC CGC AGT ACC CAC CCA CCA GCC CCA
ACA TCA TGC CCA TCC GTG TGT GAG ATA
GTA AGT GCA ATC T
94 72.9 51.1
Arachin TCG CAC ATT CCG CTT CTA CCG GGG GGG
TCG AGC GAG TGA GCG AAT CTG TGG GTG
GGC CGT AAG TCC GTG TGT GCG AA
77 75.8 62.3
Tropomyosin TAC TAA CGG TAC AAG CTA CCA GGC CGC
CAA CGT TGA CCT AGA AGC ACT GCC AGA
CCC GAA CGT TGA CCT AGA AGC
75 72.8 54.7

64
AuNP+SA+Apt + GO Production Protocols
4.3.3.1 AuNP Synthesis
Gold nanoparticles were prepared using Turkevitch’s method (Turkevich et al., 1951). A 100 mL
of HAuCl4 •3H2O 1 mM were boiled while stirring in a hot plate with a magnetic bar. Then 10 mL
of Na3C6H5O7 •2H2O 38.8 mM were added. The reaction was left to boil for 10 minutes until the
color changed from yellow to black to deep red wine. AuNPs were left to cool at room temperature
before filtration with MCE membranes. It was required for the nanoparticles to be covered from
light and kept at 4°C to ensure their stability. The nanoparticles have an SPR peak at 521 nm, and
this SPR corresponds to a 15-nm diameter size, which was in correspondence with literature
(Wolfgang Haiss, *,† et al., 2007). Theoretical calculation state that the synthesized particles are
expected to be dispersed as a 1.1 nM concentration, which was calculated with an estimated
extinction coefficient of 2.18E+08 (Wolfgang Haiss, *,† et al., 2007).
4.3.3.2 Streptavidin Conjugation (AuNP-SA)
Thawed 1 mg/mL streptavidin was diluted to 50 μg/mL in 400 μL of borate buffer (0.1 M, pH 7.4).
Conjugation with 600 μL of AuNPs was performed at 4°C in moderate shaking for 30 minutes. To
remove unbound streptavidin, AuNP-SA were centrifuged for 40 minutes at 4500 rpm and 4°C.
The supernatant was discarded, and the pellet as resuspended in 1x PBS. A second wash was
performed in the same conditions. The final resuspension was made in 100 μL of PBS (Lim et al.,
2012).
4.3.3.3 Aptamer functionalization and conjugation (AuNP-SA-M/P/S)
Lyophilized aptamers were centrifuged for a pulse and then resuspended in TE buffer (10 mM
Tris, 0.1 mM EDTA, pH 7.5) per the protocols provided by Integrated DNA Technologies to 100

65
μM. The aptamers were incubated at room temperature for 30 minutes and vortexed. Afterward,
the aptamers were pulsed at 10,000 g for 2 seconds and aliquoted to be preserved a -20°C. Prior to
be used, aptamers were diluted to 50 nM in 100 μL of folding buffer (1 mM MgCl2, 1x PBS) and
denatured at 90°C for 5 minutes. They were let to cool down at room temperature for 15 minutes.
Streptavidin-coated gold nanoparticles were mixed with aptamers at room temperature for 30
minutes under gentle mixing. Excess aptamers were removed by centrifugation for 15 minutes at
6000 rpm and 4°C. The pellet was resuspended in 1x PBS, repeating the washes thrice (Weng and
Neethirajan, 2016). Conjugated AuNP-SA-M/P/S is left for 16 hours to age at 4°C.
4.3.3.4 Graphene oxide quenching (AuNP-SA-M/P/S + GO)
In order to make the sensing mechanism to function based on color, fully functionalized AuNPs
are quenched in GO nanosheets. 100 μL of nanoparticles were mixed with 0.01 mg/mL graphene
oxide of which is extensively sonicated for 30 minutes before its usage. BSA, 0.5%, was added to
the graphene oxide after AuNP quenching to block any possible additional space on the GO to
limit unwanted affinity interactions.
Characterization
The physical diameter of the nanoparticles was determined by analyzing TEM micrographs with
ImageJ (Schneider et al., 2012). 20 μL of diluted samples were placed on copper grids and let sit
overnight to be absorbed before taking them to the electron microscope. The analysis of the images
included applying an FFT Bandpass Filter, making large structures down to 20 pixels and small
structures up to 5 pixels. Then the image was adjusted using the threshold tool, and the particles’
area was analyzed with a circularity above 0.3.

66
Dynamic Light Scattering (DLS) measurement was taken by adding 200 μL of filtered samples in
deionized water in the cuvettes and diluting as the count rate reach an approximate value of 400
kcps.
Absorbance was measured using Cytation 5 or Cary 100 using a 96-well plate or cuvettes. A 10×
dilution factor was used for all scans unless otherwise noted; all necessary graphs will show the
dilution corrected values. Every step of the conjugation was verified with data obtained in Cytation
5, and data were further processed as necessary.
Optimization
4.3.5.1 AuNP Size Optimization
The proposed mechanism has several critical steps that can be changed to improve the reliability,
reproducibility and maximize the signal that is produced. The first study was different
nanoparticles synthesis methods to create various mean diameters. Turkevitch’s method (J.
Kimling et al., 2006) and Martin’s method (Low A, 2010) were compared, and a process which
allowed for the most stable production of nanoparticles was selected.
4.3.5.2 AuNP Modification Buffer Selection
Choosing the correct working buffer became an essential condition when conjugating our
functionalized AuNPs, PBS was only used after ensuring AuNPs had the critical concentration of
SA thus making the first conjugation in borate buffer non-saline mandatory (Geneviève et al.,
2007). This was because borate buffer 0.1 M pH 7.4, 0.01 M pH 7.4 and 0.1 M pH 6.4 did not
have any adverse effect on AuNPs; however, PBS 1X pH 7.4 and SC (sodium citrate) 1X pH 7.0

67
cause instability and eventual flocculation of the nanoparticles. This prevented any interference
from occurring when the first functionalization with SA occurred.
4.3.5.3 AuNP-SA Optimization
The critical concentration of SA was determined with the use of a salting flocculation test
(Geneviève et al., 2007) and the stability verified by the SPR peak shift (Lim et al., 2012). To
optimize the aptamer concentration, we first theoretically calculated the minimum amount required
for a total coverage of the SA cover AuNPs. This estimation uses the spectral shift caused by the
conjugation of SA on the surface of the gold nanoparticles to calculate the amount of SA found on
the surface of the AuNP (Pollitt et al., 2015). The estimation assumes spherical gold particles
covered with a monolayer of protein. Utilizing the spectral shift, we can calculate the monolayer
thickness utilizing Equation 1.
𝑔 = (1 + 𝛼𝑠)(𝜆𝑝
2(𝜀𝑠 − 𝜀𝑚)
Δ𝜆 ∙ 𝜆𝑚𝑎𝑥,0+ 2𝛼𝑠)−1
Equation 1: Calculation of fraction of the particle that is shell, g, utilizing spectral shift caused by conjugation
of the SA
The terms of this equation are all known or can be measured: Δ𝜆 is the spectral shift due to the
conjugation of the protein; 𝜆𝑝 is the free electron oscillation wavelength, which for bulk gold can
be measured at 131 nm (Pollitt et al., 2015); 𝜀 is the relative permittivity and the subscripts S and
M are the values for the shell and surrounding medium respectively; g is the fraction of the total
particle this is a shell; 𝜆𝑚𝑎𝑥,0 is the wavelength of max adoptions for uncoated AuNPs (521 nm)
and 𝛼𝑠 = (𝜀𝑠 − 𝜀𝑚)/(𝜀𝑠 + 2𝜀𝑚). 𝜀𝑠 and 𝜀𝑚 are related to the square of the refractive index of the
shell and surrounding medium. Therefore 1.334 for the medium (water) and a refractive index of

68
1.47 for SA can be used to calculate these terms (D’Agata et al., 2017; Sechi et al., 2013). Using
Equation 1, the value of the shell fraction thickness provided from above can then be used with
Equation 2 below to calculate the thickness of the shell layer.
𝑠 = 𝑑
2[(1 − 𝑔)(−
13
) − 1]
Equation 2: Calculation of shell thickness using core diameter and the previously calculated shell fraction g
With this value, we can further calculate the coverage of the SA (mass of SA per unit area) on the
AuNPs, which is defined as Γ.
Γ = s𝑛𝑆𝐴 − 𝑛𝑤𝑎𝑡𝑒𝑟
𝑑𝑛𝑑𝑐
Equation 3: Equation to calculate the final coverage (𝚪) of SA on the surface of the AuNP
Using the refractive index described above for water and SA and the value of 0.212 cm3g-1 for the
refractive index increment (dn/dc) (D’Agata et al., 2017), a SA coverage of 3.57 mg m-2 is
obtained. From the SA coverage value an estimated 23 molecules of SA are available on each
AuNP. With a theoretical estimate developed, we will now conduct the physical optimization of
the SA layer using a modified method designed by Geneviève et al., 2007. As stated, we want to
produce a monolayer that has assembled on the surface of the particle. In theory, once we have
produced a monolayer of SA, the nanoparticles should see an increase in their stability when in
salt environments. Briefly, when pure citrate caped AuNP are in solution, they retain stability due
to the negative charge differentials between particles, which is verified by the collected zeta
analysis data. However, when electrolytes from salts like NaCl are added, they cause a shielding
like an effect which decreases the repulsion seen between particles causing flocculation of the

69
AuNP. Using theoretically optimized values as a starting basis, we will test the coverage capability
of different concentration of SA to thoroughly coat the surface of the AuNP increasing their
stability and causing immunity to electric charge shielding by NaCl addition (Geneviève et al.,
2007).
4.3.5.4 AuNP-SA-Apt Optimization
From the SA coverage value, an estimated 23 molecules of SA are available on each AuNP, which
correlates to approximately 46 available biotin-binding sites for biotinylated aptamers. With our
known initial concentration of AuNP, an estimate of 38 nM solution of biotinylated aptamers is
the need for total coverage. Spectral scanning post conjugation is conducted to capture SPR shift
and determine what minimum concentration of aptamer is required to functionalize the system
entirely. This theoretical calculation will be confirmed and further optimized using spectral shift
testing. As stated, when the local SPR is affected through conjugation onto the surface of the
particles, we expected a specific spectral shift to occur. With SA optimized various concentration
from 10nM to 100nM of aptamer will be added, and the minimum concentration of added aptamer,
which causes a stable shift will be used as an optimized setting.
4.3.5.5 AuNP-SA-Apt+GO Optimization
For the mechanism to accurately detect their target allergen, GO concentration was also optimized
by varying the concentration from 10 μg/mL to 90 μg/mL and getting the spectral scan from the
supernatant after a 45-minute wait and pulse centrifugation at 6000 rpm for 10 seconds. This
optimization was conducted to minimizing the amount of GO needed as it is also capable of
interacting with SA, which could cause a similar reduction of fully functionalized nanoparticles
(with aptamers) found in the supernatant if given enough time (Li et al., 2012). Therefore, to limit
70
the loss of the colorimetric signal we optimized to use as little GO as needed. This was done
because ssDNA such as aptamers, when unstructured, are much more sensitive and capable of
creating the necessary pi-pi interaction required in comparison to structured proteins like SA (Li
et al., 2014, 2012). However, it is possible, so the decision to minimize the amount of GO used for
both decreasing the cost and increasing visibility of the output was prioritized.
Allergen Detection Studies
In solution verification of the modified AuNP-GO system was conducted using buffer samples
spiked with specific allergen concentration. Spiked samples from 25nM to 1000nM were prepared
using the standard method of protein mass conversion to molar concentration.
𝑃𝑟𝑜𝑡𝑒𝑖𝑛 𝐶𝑜𝑛𝑐𝑒𝑛𝑡𝑟𝑎𝑡𝑖𝑜𝑛 (𝑛𝑀) =
𝑛𝑔𝑚𝐿
𝑀𝑜𝑙𝑒𝑐𝑢𝑙𝑎𝑟 𝑊𝑒𝑖𝑔ℎ𝑡 (𝑘𝐷)
Equation 4: Conversion of protein mass to concentration (NovaTeinBio, 2016)
As specified in Scheme 2, the spiked allergen samples are mixed with the modified AuNP and GO
and allowed to incubate at optimized settings. At the end of the incubation period, the samples are
quickly spun at 5000 RPM for 30 sec, and the supernatant is carefully pipetted, and absorbance
scanned using the Cytation 5 multimodal plate reader.
Specificity and Cross-Reactivity Studies
1000 nM spiked allergen solutions were used to test the cross-reactivity of the modified AuNP
assay. Each aptamer modified AuNP system was tested against the other allergens to determine if
there is a possibility of false-positive detection in a multiplexed system. Peanut aptamer modified
AuNP were tested against milk and shrimp protein, milk aptamer modified AuNP against peanut

71
and shrimp and shrimp aptamer modified AuNP against peanut and milk proteins at 1000nM
concentration.
Paper-Based Device
For this device, paper tests were made on Whatman chromatography paper with designs from
Inkscape (0.92, The Inkscape Project, open-source program) using Colorqube wax printer. The
paper coated with the device was heated in the hot plate at 170°C for 2 minutes to create the
hydrophobic channels using a glass slide to cover the paper system (Lee and Gomez, 2017). The
paper was cooled down before loading of the supernatant of the quenched sensing mechanism. The
folded paper system is now ready to direct and channel small volumes of the supernatant to filter
and display the testing results.

72
5 Results and Discussion
5.1 Results of PnP Florescent Based Method
PnP Synthesis Results
Using a shear-based manufacturing method, it was essential to prove that the nanoparticle exhibit
the fluorescent properties expected. TEM studies conducted show that the particles are
approximately 95nm ± 12.7 nm in size on average and show spherical morphology, as see in Figure
13 below.
Figure 13: TEM micrographs of MEH-PPV Polymer Nanoparticles with Histogram of size distribution top
left.

73
Next, the absorbance and emission of the particle was measured in the standard setting of double-
distilled H2O PH balanced to 7. As seen in Figure 14, the resultant absorbance peak was found to
be between 506-509nm, and the primary emission peak was 590-595nm. When these values were
compared against current published of 508nm peak absorbance and 585nm peak emission, the
resultant synthesis can be considered successful as both the morphology and characteristic optical
match (Xu et al., 2015). A possible explanation for the difference between these collected results
and those in literature could be equipment differences as the Cytation 5 used in this study is a
multi-modal reading system which will have a wider bandpass range during emission than a
purpose-built emission and absorbance spectroscopy devices. Another possible cause could be
related to the effect of size of the nanoparticle on MEH-PPV backbone. Using a shear based
synthesis method requires consistency of the ultrasonic system to produce shear forces during the
formation process of the nanoparticles (Szymanski et al., 2005). This means that size of the
particles can be changed by the intensity of ultrasonic vibration in theory during the formation
process when the dissolved solution is added quickly to water (Xu et al., 2015). The comparable
particles developed in literature are far smaller than those developed in the lab due to their possibly
higher ultrasonic input. The expected theory states that smaller particles will be blue-shifted due
to the decrease in conjugation, and possible kinking of the backbone in formation. These larger
particles have a far greater diameter, which will significantly increase conjugation length, causing
less backbone kinking causing the emission shift. While the cause of variability between results
and those published cannot easily be explained, a comparison of the full spectra shows significant
similarity (Szymanski et al., 2005).

74
Figure 14: Normalized absorbance and fluorescent emission spectra for PnP using citation 5 multimodal plate
reader. Initial absorbance and emission peaks found at 506-509nm and 590-595nm, respectively. Best viewed
in color.
PnP Method Optimization Results
Based on the assay design found in Scheme 1, the first critical step needed was to determine if it
is possible to quench MEH-PPV PnP controllably. Using the synthesized PnP, varying
concentrations of GO sheets were added to the solution, and the fluorescent response of the
particles was measured. The expected result is a decrease in the fluorescent signal due to near field
interactions between the graphene-based materials and the florescent PnP (Ran et al., 2012).
However, it is also to be noted that Figure 15 is the resultant florescent out of the mixed PnP and
GO after 1-hour incubation and mixing. Based on these result two significant conclusions can be
made; first it can be observed that there has been an interaction between the PnP and the GO where
the increasing concentration of the GO results in decreasing fluorescent signal. An optimized value

75
for needed GO concentration for quenching was also determined. Using approximately 1mg/mL
of added graphene material would cause an 80% reduction in the florescent signal. Higher
concentration showed saturation as a further addition of graphene material did not cause any
significant loss.
Figure 15: MEH PPV with increasing GO concentration, showing quenching the of fluorescence signal after
1hrs incubation.
The next tests conducted were done so to optimize the setting of the interaction, tests for the effect
of PH and mixing time were conducted. The results seen in Figure 16 allow us to optimize further
and control the interaction between PnP and the GO. The test was conducted by taking 50uL of
PnP and adding the optimized concentration of 1mg/mL of graphene oxide. As a note, it is essential
to list that the Aptamers utilized as the primary recognition molecules have been tested and
optimized in neutral to slightly acidic PH (6-7PH) (Eissa and Zourob, 2017; Tran et al., 2013;
Zhang et al., 2017). Based on the results seen in Figure 16 there seems to be a very minor effect

76
on the interaction and subsequent quenching of the florescent output at the tested pH levels. While
it seems that neutral pH is the worst overall, allowing the environment to be optimized for the
aptamers is far more critical as they control the sensitivity and capability of the detector. Next it
was decided to study the kinetics of the florescent quenching mechanism. Based on literature
originally reviewed it is expected that a majority of the interaction is related to Foster Resonance
Energy Transfer (FRET), which is a near field effect requiring between approximately 10
angstroms of space to occur (Ran et al., 2012). However, during our studies, it was found that it
was not possible to scan our samples fast enough to record the data, even attempts which were
conducted directly after mixing as seen in Figure 17. This is interesting as it is expected that there
should be time for the interaction between PnP and the GO sheets. Furthermore, specific research
was then found which states that new methodologies have been utilized and another process of
photoinduced electron transfer may be occurring between the PnP and GO which causes rapid
quenching (Ran et al., 2012). Photoinduced electron transfer is the conversion of florescent photon
acceptor (GO) to a radical anion, resulting in quenching of the fluorescent signal of both the donor
and acceptor. By comparison, FRET requires spectral overlap and also quenches, however the
acceptor may still exhibit emission (Williams, 1996). Visualizing the kinetic interactions requires
transient absorption spectroscopy at femtosecond scales to observe. Regardless, it was found that
mixing times were mostly irrelevant as quenching occurred exceptionally rapidly.

77
Figure 16: Results of pH optimization on MEH-PPV PnP - GO interaction from pH 4 – 10.
Figure 17: Results of mixing time optimization for MEH-PPV PnP – GO.
Co
ntr
ol

78
Methodology Failure
While having reductions in assay times is a benefit, this study showed that quenching might occur
at rate and range far more expansive than initially theorized. A study of interaction was conducted
where the low concentration of GO was first blocked with a surface agent, then an introduction of
PnP was added. This is, in theory, used to simulate the effect of having a steric interference
between the PnP and the graphene oxide quencher. With the optimized parameters, a test to
determine if the proposed methodology was possible was developed. To do this, Bovine Serum
Albumin (BSA) protein as it is a known binder to GO with a size greater on average than the
expected distance needed to allow FRET-based fluorescence quenching. As previously stated,
FRET-based energy transfer requires no more than approximately 10 Angstroms of space between
the emitter and quencher to function (Ran et al., 2012). The average size of BSA particles os
complicated to accurately determine as PH induced aggregation can occur a single protein unit,
however, is approximately 140x40x40 Angstrom units in size on average with aggregation
possible of reaching 100 nm in size (Jun et al., 2011; Wright and Thompson, 1975). BSA has
proven affinity to GO causing strong absorption-based binding to its surface due to hydrophobic
interaction (Nan et al., 2019). Various concentration of BSA in 7 PH corrected PBS buffer was
added to the optimized concentration of 1mg/mL GO and allowed to incubate for 1Hrs as per stated
procedure (Nan et al., 2019). After this incubation period is over 50uL of stock PnP are added and
allowed to further mix for 10 minutes before they are loaded into the Cytaion 5 spectrometer, and
the fluorescent signal is scanned. While perfect coverage cannot be concluded, the BSA is added
in significant excess as the sigma purchased GO are estimated to be 22uM in diameter. The average
hydrodynamic diameter of a single BSA molecule is 140 nM, meaning only 24675 BSA units are
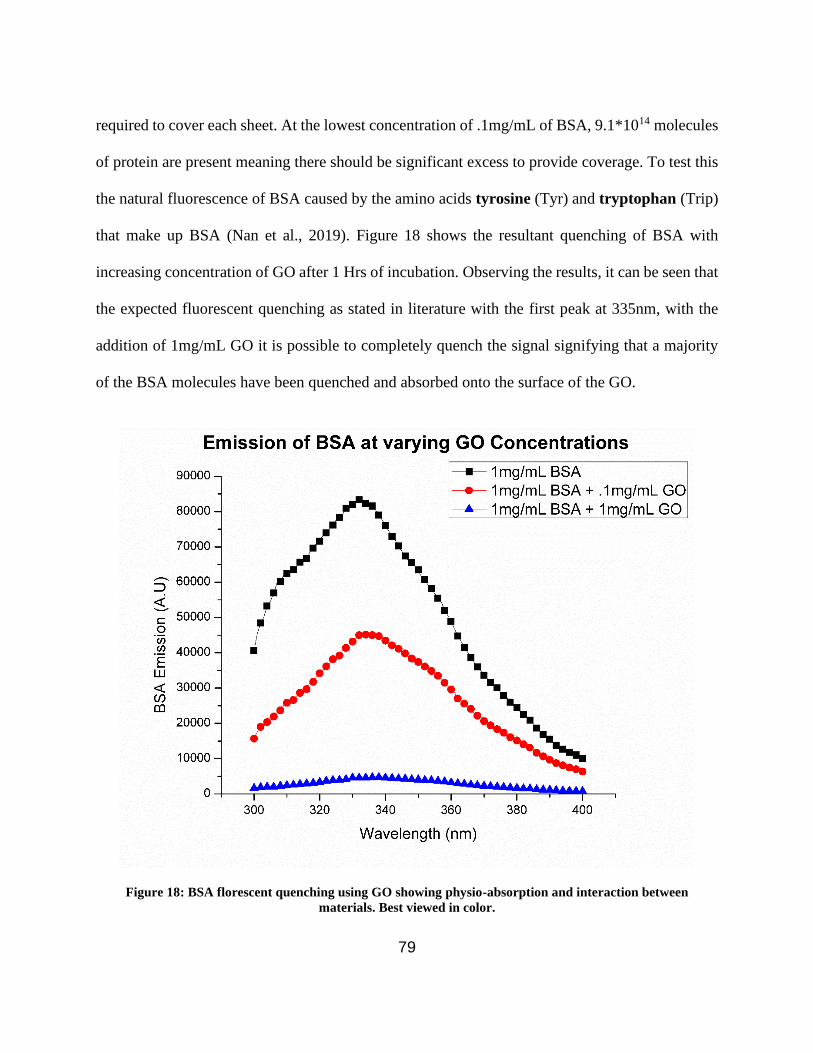
79
required to cover each sheet. At the lowest concentration of .1mg/mL of BSA, 9.1*1014 molecules
of protein are present meaning there should be significant excess to provide coverage. To test this
the natural fluorescence of BSA caused by the amino acids tyrosine (Tyr) and tryptophan (Trip)
that make up BSA (Nan et al., 2019). Figure 18 shows the resultant quenching of BSA with
increasing concentration of GO after 1 Hrs of incubation. Observing the results, it can be seen that
the expected fluorescent quenching as stated in literature with the first peak at 335nm, with the
addition of 1mg/mL GO it is possible to completely quench the signal signifying that a majority
of the BSA molecules have been quenched and absorbed onto the surface of the GO.
Figure 18: BSA florescent quenching using GO showing physio-absorption and interaction between
materials. Best viewed in color.

80
With these factors verified it was conducted the final proof of concept in which GO incubated
with BSA was introduced to PnP. The expected results predict that the BSA should act as steric
interference between the GO and the MEH preventing the quenching of their fluorescence.
However, as Figure 19 shows, this was not the case.
Figure 19: Test to verify if quenching prevention is possible with BSA as a large steric blocker on the surface
of GO. PnP emission at 585 nm is utilized.
This was an unexpected result as based on all preliminary research, the interference of a steric
molecule should be capable of preventing some of the quenching interaction. Using the normal
emission at 585 nm of PnP, we expect to see prevention of the surface interaction between GO and

81
PnP due to the incubated BSA. However, what is seen here is that even at an extreme concentration
of BSA was not able to prevent the interaction expectedly. Previously a conducted experiment
showed a far faster rate of quenching then what was expected, conducting further extended
research showed us that there is a possibility that FRET is not the only mechanism at play as studies
such as Ran et al., 2012 have theorized. More extended range mechanisms may allow longer-range
fluorescent quenching meaning it is far more challenging to create steric interference, therefore
making the development of this method impossible without a significant rework of the assay
design and materials. While unfortunate, our experimentation with an AuNP based assay had
shown significant promise, and a higher concentration of effort was now employed.
5.2 Results of AuNP Optical/Colorimetric Based Method
AuNP Synthesis Results
To demonstrate the biomolecules were being attached to AuNPs, TEM images and DLS
measurements were acquired. For characterization of the mechanism, the data represented below
is with the conjugation of Beta-Lacto Globulin specific aptamer. Each conjugation step was
expected to occur on the surface of the AuNPs without causing seeding effects nor a change in
morphology. In Figure 20A, 20B and 20C, the micrograph from TEM show that nanoparticles
preserved their spherical morphology and the average diameter (~14 nm) from AuNP upon
conjugation with SA and biotinylated aptamers, respectively. The hydrodynamic radii were
obtained with the use of DLS, giving values of 24.2 nm, 45.7 nm, and 58.4 nm for AuNP, AuNP-
SA, and AuNP-SA-M respectively. Unlike the TEM, which is unable to image the conjugated
proteins and ssDNA visually, the DLS analysis shows an increase in the hydrodynamic radii from
each functionalization. Zeta analysis values were also obtained, giving values of -72.41, -38.74
82
and -46.54 for AuNP, AuNP-SA, and AuNP-SA-M/P/S, respectively. The increase in absolute
potential seen when AuNP -SA are further functionalized with the aptamer shows a change in the
surface morphology with a more negative molecule, which can be used to further attribute to
binding of the aptamer (D’Agata et al., 2017; Weng and Neethirajan, 2016). From Figure 20F,
spectral scanning show SPR peaks of conjugated 14 nm AuNP from 520 nm to 531 nm when
covered with SA and to 536 nm when aged aptamers are absorbed onto SA. The adsorption of
protein on to the surface causes a change in the surface morphology and therefore effects the
scattering of the particles. The well known optical characteristics, which were first systematically
explained by Mie (Mie, 1908), describe how the localize environment affect these properties. As
gold has a strong surface plasmon resonance the shift of the peak can be directly correlated to a
change in the localized refractive index. Therefore, a shift in the spectral peak of gold can be a
correspondence to a new molecule which interferes with the natural gold surface plasmon
resonance peak. The introduction of the protein SA and its electrostatic adoption onto the surface
causes this change in the local refractive index, which in turn causes the shift of the spectral
absorbance (Pollitt et al., 2015). The second shift is caused by the introduction of the biotinylated
aptamers, which directly bind to the SA, leading to a change in the SA localized refractive index
(D’Agata et al., 2017; Pollitt et al., 2015). Inserts on Figure 20A, 19B & 19C demonstrates the
diameter distribution of the functionalized AuNPs from the processed micrographs to ensure that
the peak shift to 536 nm does not correspond to flocculation and instead to surface biomolecule
addition. Using a combination of DLS analysis, spectral scanning and TEM studies, a
determination that surface modification of the nanoparticles due to the conjugation of the

83
biomolecules (SA and aptamers) has been successful, creating stable and fully functional
nanoparticles for the detection of allergens.
Figure 20D and 19G show and explain the effect of nanoparticles being bound to sheets of
graphene oxide, creating bridges between sheets, resulting in the complexes seen in Figure 20D.
As explained previously the pi-pi stacking interaction between the different layers of graphene
oxide due to the functionalized AuNPs only readily occurs when the aptamers are unstructured
(Park et al., 2014; Wang et al., 2011; Wu et al., 2011). As no allergenic proteins are present, most
nanoparticles have been removed from solution, as seen from the spectrographs of the supernatant
in Figure 20G. The background layer of graphene oxide and the implanted nanoparticles in Figure
20D further support this assessment of interaction between the nanoparticles.

84
Figure 20: TEM micrographs of A) AuNPs, B) AuNP-SA, C) AuNP-SA-Milk Apt, and D) AuNP-SA-Milk Apt
+GO nanosheets with histogram of average diameter found to right. E) Image of AuNP, AuNP-SA-ssDNA,
AuNP-SA-ssDNA + GO + 1000 nM allergen spiked sample in solution and AuNP-SA-ssDNA + GO with no
allergen spike F) Spectral shift caused by the conjugation of SA and sptamer compared to bare nanoparticles.
G) Spectra of functionalized AuNPs before and after quenching. Best viewed in color.

85
AuNP Optimization Results
The proposed mechanism has several critical steps that can be changed to improve the reliability,
reproducibility and maximize the signal that is produced. The first study was different
nanoparticles synthesis methods to create various mean diameters. Turkevitch’s method (Kimling
et al., 2006) was chosen due to yielding consistent sizes and bigger particles than Martin’s method
(Low and Bansal, 2010) thus proving to have enough surface area to chemisorb SA. Based on
previous studies of SA, it was estimated that between 20 nm2 ~ 40 nm2 of the surface area is
required for electrostatic adsorption of SA (Bayer et al., 1990). As stated above the consistent and
straightforward Turkevitch method provided a nanoparticle of consistent size with ample surface
area of adsorption of SA molecules. Based on TEM, there was an estimated average available
surface area of approximately 620 nm2. Next, choosing the correct working buffer became an
essential condition when conjugating our functionalized AuNPs, PBS was only used after ensuring
AuNPs had the critical concentration of SA thus making the first conjugation in borate buffer non-
saline mandatory (Geneviève et al., 2007). This was because borate buffer (0.1 M pH 7.4, 0.01 M
pH 7.4 and 0.1 M pH 6.4) did not have any adverse effect on AuNPs; however, PB 1× pH 7.4 and
SC (sodium citrate) 1× pH 7.0 cause instability and eventual flocculation of the nanoparticles. This
prevented any interference from occurring when the first functionalization with SA occurred. The
critical concentration of SA was determined with the use of a salting flocculation test (Geneviève
et al., 2007) and the stability verified by the SPR peak shift (Lim et al., 2012). The monolayer
production test and optimization data can be seen in Figure 21A and 21B, resulting in the optimum
concentration to provide a monolayer of SA for AuNPs to be 50 μg/mL of SA. To optimize the
aptamer concentration, a theoretically calculation of the minimum amount of SA required for total

86
coverage on AuNPs was conducted using the method introduced in Sections 4.3.4 (Pollitt et al.,
2015; D’Agata et al., 2017; Sechi et al., 2013).
From these studies, an estimated 23 molecules of SA are available on each AuNP, which correlates
to approximately 46 available biotin-binding sites for biotinylated aptamers. With our known
initial concentration estimation of AuNP, an estimate of 38 nM solution of biotinylated aptamers
is needed for total coverage. To prove this estimation a similar procedure to the SA optimization
was used to determine the optimum concentration of aptamers (Lim et al., 2012), and as seen in
Figure 21C, 50 nM of biotinylated aptamers yielded to a stable shift in the spectra of 536 nm.
Although not an exact estimation of the minimum possible values of aptamer needed is between
38 nM and 50 nM for complete and stable functionalization.
For the mechanism to properly detect their target allergen, GO concentration was also optimized
by varying the concentration from 10 μg/mL to 90 μg/mL and getting the spectral scan from the
supernatant after a 45-minute wait and pulse centrifugation at 6000 rpm for 10 seconds. This
optimization was done per minimizing the amount of GO needed as it is also capable of interacting
with SA, which could cause a similar reduction of fully functionalized nanoparticles (with
aptamers) found in the supernatant if given enough time (Li et al., 2012). Therefore, to limit the
loss of the colorimetric signal it was optimized to use as little GO as needed. This was done because
ssDNA such as aptamers, when unstructured, are much more sensitive and capable of creating the
necessary pi-pi interaction required in comparison to structured proteins like SA (Li et al., 2014,
2012). However, SA interaction with GO is possible, so the decision to minimize the amount of
GO used for both decreasing the cost and increasing specificity of the output was prioritized. Using
the data collected and displayed in Figure 21D the minimum concentration that allows the

87
mechanism to quench within the 45-min reaction time fully is 20 μg/mL of previously extensively
sonicated GO (30 minutes of prior sonication).
Figure 21:A) SA conjugation from right to left from 10 μg/mL to 90 μg/mL after NaCl addition. B) Spectra
shift after SA conjugation. C) Spectral shift after aptamer conjugation using different concentrations. D) GO
optimization conjugation using the peak absorbance. Best viewed in color.
Biosensor Validation, Selectivity, and Sensitivity
To verify that the mechanism works as expected in solution, trials were first conducted to verify
that a consistent response to given concentrations of an allergen would occur. For these tests, a

88
spiked sample of protein allergen was introduced to the fully functionalized AuNPs at different
concentrations. Then GO was added at the previously optimized amount to all tubes and 45 minutes
of time was given to allow the formation of the aggregates with the GO and AuNPs. When the
aptamer interacts with its specified protein, its structure changes from one which can interact with
GO and create pi-pi sticking to a rigid structure which weakly produces these bonds (Li et al.,
2014). Through this mechanism of interaction and the ability to prevent interaction, the assay can
selectively remove functionalized AuNPs which have not had sufficient reaction with there
specific allergenic protein from the solution with GO. This will create a colorimetric signal which
is proportional to the amount of allergenic protein found in solution. This hypothesis was proven,
as shown in Figure 22b1, 22b2, and 22b3 where a standard curve for each aptamer is shown.

89
Figure 22:A) Functionalized AuNP reacted with (from left to right) 25nM, 50nM, 100nM, 500nM and
1000nM of allergenic protein and pulse centrifuged. B1,2&3) Spectral signal of from supernatant due to
reaction and GO quenching from various allergen concentrations of B1) Peanut, B2) Milk and B3) Shrimp,
bottom to top 25nM, 50nM, 100nM, 500nM and 1000nM. C) Selectivity study of the functionalized AuNP
system to the other allergenic proteins. Best viewed in color.

90
5.2.3.1 Peanut Allergen Testing
Spike allergen samples concentrations from 25nM to 1000nM were added to the system to
determine the standard response of the assay. The first allergen tested was the peanut allergen, Ara
h1, which is a trimer protein. As previously mentioned peanuts are found to be the primary cause
of allergenic response in 25.5% individuals in the United States. Ara h1 was however specifically
chosen over other peanut proteins as it is known to have 23 independent IgE binding epitopes. The
result of having such a structure makes it far more likely to be the cause of an allergenic response
in comparison to other peanut protein within the family (Tran et al., 2013). Based on standards
developed by the FDA for food safety, cross-contamination levels cannot exceed more than
.25mg/kg in foodstuff (Center for Food Safety and Applied Nutrition, 2016). However, it is to be
noted that this is not perfect as an individual’s sensitivity can vary from requiring ingestion to
merely touching a surface contaminated with the food allergens. Furthermore, any work on
determining a possible lower limit of sensitivity for individuals with food allergies was not found
with authors in many works only discussing how varied said response are found to be in sample
population. The assay results shown in Figure 22b1 for peanut allergen show a logarithmic
response where 1000nM of allergen concentration virtually saturated the possible output of the
assay. Furthermore, a calculated lower limit of detection (LoD) for the allergen detection system
was calculated with a 3σ ratio, calculated to be 7.8nM for peanut allergen (Thomsen et al., 2003).
The lower tested limit of 25nM is therefore statistically significant as it is unlikely that noise or
baseline error would contribute to a false reading at the lower level of allergen concentration by a
significant margin.

91
5.2.3.2 Milk Allergen Testing
The next allergen tested using the above setting was milk-based products because 21.1% of the
allergenic child population are known to be sensitive in the US (World Allergy Organization,
2011). However, it is not possible to directly detect milk because it is a slurry of several
components; therefore a marker must be chosen a which will best represent its presence in food
materials. Beta Lactoglobulin, which is a dimeric protein in structure, is the component of milk
selected for this study. Its choice was more complicated as many of the proteins in milk have also
been found to have allergenic properties, making a specific selection of an allergen for milk
difficult. Therefore, the choice of using Beta Lactoglobulin was made through an analysis of the
composition of milk and their allergenic potential. Based on available studies, Beta Lactoglobulin
is a protein which in terms of percentage makes up a significant component of milk, but as of yet
has had no real function identified. In whey isolation of globular proteins from milk, it is estimated
to be 65% of the fractional composition, meaning it is highly abundant in natural milk products
(Natale et al., 2004). Another possible component in the selection of a marker for milk was the
other highly allergenic protein called casein. While casein is known to be the most likely to cause
an allergenic response from sensitive individuals, in comparison to Beta Lactoglobulin it makes
up a tiny percentage of milk (Natale et al., 2004). Therefore, Beta Lactoglobulin was selected as
an indicator of milk in food products based on its abundance as a component of milk. This will
allow in theory for the assay to be more robust as Beta Lactoglobulin will be more abundant in
comparison to other allergenic components of milk. The AuNP assay was modified with aptamers
with affinity to Beta Lactoglobulin and spiked allergen samples were added in a process identical
to what was conducted for Ara h1 testing. The resultant developed standard curves in Figure 22b2

92
show similarities to that of the peanut allergen testing and can easily differentiate between the
varying concentration of added allergen. Furthermore, based on FDA guidelines, 0.36mg/kg of
Beta Lactoblobulin are allowed in cases of possible food cross-contamination, this assay has
significant more sensitivity than this limit (Center for Food Safety and Applied Nutrition, 2016).
Furthermore, a LOD was calculated to be 12.6nM, meaning that there is a significant margin
between the lowest tested allergen concentration and baseline fluctuation of the assay. Which will
limit the possibility of false detection due to baseline fluctuation.
5.2.3.3 Shrimp Allergen Testing
Seafood is the third most common sensitivity for individuals with food-related allergies;
approximately 17.2% of sensitive individuals in the US are allergic to some seafood-based product.
With such a broad group of allergenic proteins due to the variety of seafood, the selection of any
specific protein will not adequately protect all seafood sensitive individuals. However, based on
available studies Tropomyosin, an allergenic protein found in kinds of seafood like shrimp and
other shellfish is considered to be one of the most frequent causes of allergenic response for
sensitive individuals. Secondary to its selection is that individuals with arthropods sensitive can
also use a developed device for detection as they share this protein as an allergenic cause (Pascal
et al., 2015). This will be more relevant for individuals in locations in which food production may
not be at as high of a standard to developed countries or in the case of accidental contamination.
Finally, based on a review of available literature the developed aptamer for this allergenic protein
was found to have significant affinity for the target analyte, this would increase the possibility of
successfully developed of a platform for testing food products for incident allergens (Zhang et al.,
2017). Once again, the assay was modified with the specific Tropomyosin attracted aptamers, and

93
the standard curve seen in Figure 22b3 was developed using spiked allergen samples. The resultant
curves show properties like those found in tests for peanut and milk allergens. Like the other
allergenic proteins as well the sensor is capable of meeting the required FDA detection standard
of 0.13mg/kg of cross contaminated product. A LOD was calculated to be 6.2nM, significantly
below the lowest tested concentration and the inverse logarithmic response shows us the expected
saturation.
5.2.3.4 Biosensor Cross-Reactivity & Performance Conclusions
The developed system can detect concentrations well under this required limit. This is a significant
benefit as sensitive individuals may have different levels of sensitivities to these allergens. So even
if under these limits, an adverse reaction may occur, which could cause the death or otherwise
unneeded suffering. Although for the lower limit a spectrometer is required, for industrial
application in the food industry it provides a fast-quantitative alternative for some current
conventional methods like ELISA; which also require bench-top devices and significantly more
reagents and steps. Most ELISA kits offered by major suppliers like NEOGEN or r-Biopharms
require benchtop equipment like plate readers, a significant number of reagents and take 30
minutes or longer (NEOGEN, 2017a, 2017b, 2017c; r-Biopharm, 2017a, 2017b, 2017c). These
kits are considered the gold standard for industry; however, most are only able to detect within the
microgram range in comparison to these mechanisms ability to function at nanogram levels.
Furthermore, the assay time is very comparable to these kits, as some of the fastest currently
available assay takes a minimum of 30 minutes to complete. Another significant benefit of this
system is the simple processes required to obtain a measurement, in comparison to the multiple
reagents ELISA tests that these systems utilize for detection of allergenic material, the proposed

94
mechanism only requires operators to add GO after the sample has been incubated with the pre-
functionalized AuNP. The specific affinity for their target proteins is seen in Figure 22C, where a
selectivity study shows the output of the system, which is spiked with 1000 nM of each protein.
Although more comprehensive cross-reactivity studies are necessary, there is limited cross-
reactivity between these aptamers. They will only produce a signal when in the presence of a
designed target that is similar to their designated proteins. This makes them ideal for their
application as an onsite biosensor as they are both highly sensitive and selective, with results that
directly correspond to the amount of allergen present.
Paper-Based Microfluidics Analytical Device
Paper-based microfluidics, as mentioned previously, offers a variety of benefits which can be
utilized to make the proposed mechanism much more available outside the laboratory
environment. The main goal of the proposed bio-sensing system is to increase the options a
sensitive individual or food manufacturer have to quickly and efficiently detect these proteins. To
accomplish this simple cellulose-based paper was utilized with the above mechanism to both help
separate the created complexes from solution and increase the readability of the result. Using paper
to filter is one of its oldest known usage in science (Yetisen et al., 2013), and here it can be used
for this specific purpose. Whatman 1 cellulose based paper is selected as it does not degrade over
time, its availability and low cost (GE Healthcare Life Sciences, 2017; Mahato et al., 2017). To
first verify if it is possible to filter the developed complexes with Whatman paper (pore diameter
of 11µm) test samples which have been first incubated with varying quantities of allergenic protein
and “quenched” with GO were filtered through the paper. The supernatant derived from this test
can be seen in Figure 23A, and shows the ability of the paper to remove the developed complexes

95
from solution while allowing a passageway for the un- “quenched” AuNPs. As Whatman 1 filter
paper can selectively remove the complexes from solution, it was the basis of a design for a paper
device which utilizes a simple 3-fold design, as seen in Figure 23B. By adding the hydrophobic
barriers to this paper using a Xerox Colorcube, it allows us to direct and control the flow in the
paper device to propagate and use the assay (Lee and Gomez, 2017; Lisowski and Zarzycki, 2013).
In this case, it is possible to help push the liquid through the filter layer and to limit the loss of the
sample through adsorption into each layer.
The main advantage of paper-based technology is the limited requirement for volume for testing.
For our design, it was possible to utilize less than 30µL of the GO reacted systems to view a
measurable result. A scaled-up model with a higher number of testing zones was used to test many
allergen concentrations simultaneously and peanut aptamer functionalized AuNPs. Various peanut
allergen concentration samples and incubated 20 µL of the functionalized AuNPs and then added
GO. After 30 minutes the 20 µL of a solution, which contained both the floating complexes and
unbound AuNPs that have developed, were dispersed on a layer of paper with designated zone
made by printed hydrophobic wax. This layer is where the sample is first dispersed and acts as the
filtering layer for the complexes, identical to the function of the middle layer in Figure 23B. This
layer was then placed on top of another layer, of identical design, with hydrophobic barrier defined
zones. The backside of this bottom layer was covered with tape to prevent any further fluid transfer.
As in Figure 23B, this bottom layer is designed to function as the output or color presentation
layer. The last top cover layer, which was simply a sheet of parafilm wax was placed on top. This
acts similarly to the top layer in Figure 23B and is used to help push the sample through the filter
layer onto the color output layer. A large sheet of glass placed on top to help provide even pressure

96
to all testing areas are pushed by hand. After 1 minute, the layers were disassembled and the output
layer, as seen in Figure 23C, shows the resultant dying by the free AuNP. Visibly this has made
direct observation much more straightforward and can help the user quickly identify the possible
level of contamination. Further quantify the results using straightforward processing procedures,
as conducted by (Jokerst et al., 2012). Requiring only an image of the testing zone to measure
average mean grey intensity. Using ImageJ resulted collected on the mean grey average of each
zone after testing. Figure 23D is the collection of this data, showing us a similar output to that of
the in-solution verification (Figure 23B). The system is able to quantify lower levels of allergen
concentration with significant reliability, though the requirement of a camera is necessary.
Although this is the case, the availability and accessibility of smart devices with a camera in
comparison to a bench top spectra device is easily seen. The simple processing steps to acquire the
mean grey average from the output zone in an image is far simpler and more accessible. Using the
method described by Thomsen et al (2003) the lowest possible detectible concentration with a 3σ
signal to noise ratio for the paper device was calculated and found to be 27 nM. Although it can
detect down to 25 nM using the spectra, the paper devices showed reproducible identification for
values at or above 50 nM with the peanut aptamer functionalized AuNPs. Below this amount it
became difficult to see or measure any color dying caused by un-“quenched” AuNPs in the paper
based device.

97
Figure 23:A) Image of the supernatant produced after simple filtration with Whatman 1 filter paper of
samples with varying quantities of allergenic protein and the addition of GO, from left to right: 0nM, 25nM,
50nM, 100nM, 500nM and 1000nM of allergenic protein. B) Image of simple 3-fold paper-based device for
assistance in detection of allergens in food. The Top: Lid Layer, Middle: Filter Layer, Bottom: Output Layer.
C) Image of the output layer after filtering samples with varying amounts of allergenic proteins, from left to
right: 0nM, 25nM, 50nM, 100nM, 500nM and 1000nM of allergenic protein. D) Graph of the measured mean
grey value of ROI from image C. Best viewed in color.
98
6 Conclusion
6.1 Functioning Allergen Detection Assay
For individuals living with allergen sensitivity, there is a significant lack of pro-active measures
to help protect their health and well being. There is a necessity for a bio-sensor system that can
directly benefit both government and manufacturers, that is accurate, specific, cheap and requires
limited usage of laboratory instrumentation to detect allergen contamination in food. By utilizing
the power of golds strong optical properties, with the selectivity and sensitivity of aptamer and the
power of paper-based microfluidics the proposed device can meet these needs. With the proposed
mechanism, it was possible to accurately measure allergens from 25 nM – 1000 nM with LoD of
7.8 nM, 12.4 nM and 6.2 nM for peanut, milk and shrimp allergens respectively in solution. A 50
nM – 1000 nM range with a LoD of 27 nM when integrated with the microfluidic paper device
when utilized with a smart device with a camera. Furthermore, the system only requires the need
for two reagents, functionalized AuNPs and GO, and a simple and cheap paper-based device.
Further optimization and investigation is however required to both fully understand the capabilities
of the mechanism and to create a better experience for the end user. Overall, the proposed device
is highly comparable in time to other quantitative methods, such as ELISA, with even greater
sensitivity and less complexity. This combination allows it to be a strong tool for those living with
allergen sensitivities and giving manufactures a cheap and efficient method to control cross-
contamination and mitigate associated economic losses.
6.2 Future PnP Research
While it was expected that a far more reliable and sensitive method could be designed with
florescent PnP, unexpected interaction between GO and PnP florescent quenching have made it

99
far more difficult to solve. Graphene based materials can be modified to alter properties, finding
methods to possibly decrease affinity or cause charge-based separation may be a path towards a
functioning assay. Other consideration like modification of the polymer structure with specific
doping agents to allow for shielding of unwanted interaction may also be of benefit to study. The
ability of a cheap florescent based detection method with limited materials and assay steps is
needed. Also, while not meeting the World Health Organizations ASSURED methodologies for
onsite detectors, the sensitivity, extreme low cost and reliability of a florescent based method
would be of greater value in industry. Having a highly accurate and low-cost mythology has been
shown to encourage testing and may help to further bring down the risk for those affected.
6.3 Further Point of Care Development
In this work a simple and effective paper-based device was demonstrated as a method to remove
the need of a centrifuge and make detection possible with the naked eye. This system has not fully
utilized paper in a method which could make detection far more sensitive or reliable. Further
research in to designs, construction methodologies and new modification may increase the
capabilities of the assay beyond just the removal of complexity and infrastructure. While
encapsulated AuNP and PnP are very stable the proteins and aptamer based biorecognition (much
less so than protein based biorecognitions methods like antibodies) elements are very susceptible
to environmental conditions which could affect the capabilities of the system. Utilizing different
structures and designs that combined function and packaging to create optimal conditions until use
would further increase the usability of the system in a far greater range of environments. Other
new methods like time delayed bridges could also allow for self timing and electrostatic buffer
100
localization may make it possible to have a small device which requires zero operator control and
training without the need for any complex technologies.
Furthermore, for a functioning onsite detector a control system and color identification method
would need to be implemented into the primary design. Using scale of color, we can create an
easily identifiable legend for users to compare against in each testing strip. The more important
step needed to be taken would be for a method to confirm that the assay has functioned as expected,
so the development of a control like those found to prove function of pregnancy tests would need
to be added. This is an important feature which would need to be developed and integrated into
the system so that the results can be used with confidence by the affected consumer.
6.4 Smartphone Enabled Detection
Thanks to the simplicity of the output it would be possible to utilize smartphones as a method for
far more accurate reading. In the work above a simple algorithm to convert an RBG image to a
mean grey value resulted in an output like that was seen in solution-based testing. Furthermore,
with the use of a smartphone image normalization for lighting and distortion can take place which
would allow for even possible greater detectability of the color output by the assay. The color scale
after normalization could also be programed in meaning even less skill is required by an operator.
The paper-based devices could also be far simpler in design as no scale would need to be included
as this would all be done though application on a smart device. An example of the entire assay
with the use of a smart device has been demonstrated in Figure 24.

101
Figure 24: Assay with the utilization of a smart device for the detection of allergenic materials in food

102
REFERENCES
aafa, 2017. Allergy Facts and Figures [WWW Document]. URL http://www.aafa.org/page/allergy-facts.aspx
(accessed 7.12.17).
Abbas, A., Brimer, A., Slocik, J.M., Tian, L., Naik, R.R., Singamaneni, S., 2013. Multifunctional Analytical
Platform on a Paper Strip: Separation, Preconcentration, and Subattomolar Detection. Anal. Chem. 85, 3977–
3983. doi:10.1021/ac303567g
Adkins, J.A., Boehle, K., Friend, C., Chamberlain, B., Bisha, B., Henry, C.S., 2017. Colorimetric and
Electrochemical Bacteria Detection Using Printed Paper- and Transparency-Based Analytic Devices. Anal.
Chem. 89, 3613–3621. doi:10.1021/acs.analchem.6b05009
Alves, R.C., Barroso, M.F., González-García, M.B., Oliveira, M.B.P.P., Delerue-Matos, C., 2016. New Trends in
Food Allergens Detection: Toward Biosensing Strategies. Crit. Rev. Food Sci. Nutr. 56, 2304–2319.
doi:10.1080/10408398.2013.831026
Alves, R.C., Pimentel, F.B., Nouws, H.P.A., Marques, R.C.B., González-García, M.B., Oliveira, M.B.P.P., Delerue-
Matos, C., 2015. Detection of Ara h 1 (a major peanut allergen) in food using an electrochemical gold
nanoparticle-coated screen-printed immunosensor. Biosens. Bioelectron. 64, 19–24.
doi:10.1016/j.bios.2014.08.026
Ambrosi, A., Morrin, A., Smyth, M.R., Killard, A.J., 2008. The application of conducting polymer nanoparticle
electrodes to the sensing of ascorbic acid. Anal. Chim. Acta 609, 37–43. doi:10.1016/J.ACA.2007.12.017
Anderson, C.E., Shah, K.G., Yager, P., 2017. Sensitive Protein Detection and Quantification in Paper-Based
Microfluidics for the Point of Care. Methods Enzymol. 589, 383–411. doi:10.1016/bs.mie.2017.01.018
Aydin, S., 2015. A short history, principles, and types of ELISA, and our laboratory experience with peptide/protein
analyses using ELISA. Peptides 72, 4–15. doi:10.1016/J.PEPTIDES.2015.04.012
Balint, R., Cassidy, N.J., Cartmell, S.H., 2014. Conductive polymers: Towards a smart biomaterial for tissue
engineering. Acta Biomater. 10, 2341–2353. doi:10.1016/J.ACTBIO.2014.02.015
BasePair Biotechnologies, 2017. Aptamers vs. Antibodies [WWW Document]. BasePair. URL
http://linkinghub.elsevier.com/retrieve/pii/S2162253116303213 (accessed 8.22.17).
Bayer, E.A., Ben-Hur, H., Wilchek, M., 1990. [8] Isolation and properties of streptavidin. pp. 80–89.
doi:10.1016/0076-6879(90)84262-F
Bülbül, G., Hayat, A., Andreescu, S., 2015. Portable Nanoparticle-Based Sensors for Food Safety Assessment.
Sensors 15, 30736–30758. doi:10.3390/s151229826
Burnham, S., Hu, J., Anany, H., Brovko, L., Deiss, F., Derda, R., Griffiths, M.W., 2014. Towards rapid on-site
phage-mediated detection of generic Escherichia coli in water using luminescent and visual readout. Anal.
Bioanal. Chem. 406, 5685–5693. doi:10.1007/s00216-014-7985-3
Busa, L., Mohammadi, S., Maeki, M., Ishida, A., Tani, H., Tokeshi, M., 2016. Advances in Microfluidic Paper-
Based Analytical Devices for Food and Water Analysis. Micromachines 7, 86. doi:10.3390/mi7050086
Carrilho, E., Martinez, A.W., Whitesides, G.M., 2009. Understanding Wax Printing: A Simple Micropatterning
Process for Paper-Based Microfluidics. Anal. Chem. 81, 7091–7095. doi:10.1021/ac901071p

103
Cate, D.M., Adkins, J.A., Mettakoonpitak, J., Henry, C.S., 2015. Recent Developments in Paper-Based Microfluidic
Devices. Anal. Chem. 87, 19–41. doi:10.1021/ac503968p
Center for Food Safety and Applied Nutrition, 2017. Consumers - Food Allergies: What You Need to Know [WWW
Document]. FDA. URL https://www.fda.gov/food/resourcesforyou/consumers/ucm079311.htm (accessed
8.13.17).
Center for Food Safety and Applied Nutrition, O. of R.A., 2016. Allergens - Approaches to Establish Thresholds for
Major Food Allergens and for Gluten in Food. Appendices. FDA.
Changfeng Wu, Craig Szymanski, and, McNeill*, J., 2006. Preparation and Encapsulation of Highly Fluorescent
Conjugated Polymer Nanoparticles. doi:10.1021/LA060188L
Cheng, C.-M., Martinez, A.W., Gong, J., Mace, C.R., Phillips, S.T., Carrilho, E., Mirica, K.A., Whitesides, G.M.,
2010. Paper-Based ELISA. Angew. Chemie Int. Ed. 49, 4771–4774. doi:10.1002/anie.201001005
Cheng, S., Yang, Y., Ni, X., Peng, J., Lai, W., 2017. Fluorescent microspheres lateral flow assay for sensitive
detection of the milk allergen casein. Food Agric. Immunol. 1–12. doi:10.1080/09540105.2017.1325841
Costa, M.N., Veigas, B., Jacob, J.M., Santos, D.S., Gomes, J., Baptista, P. V, Martins, R., Inácio, J., Fortunato, E.,
2014. A low cost, safe, disposable, rapid and self-sustainable paper-based platform for diagnostic testing: lab-
on-paper. Nanotechnology 25, 094006. doi:10.1088/0957-4484/25/9/094006
Cunningham, J.C., DeGregory, P.R., Crooks, R.M., 2016. New Functionalities for Paper-Based Sensors Lead to
Simplified User Operation, Lower Limits of Detection, and New Applications. Annu. Rev. Anal. Chem. 9,
183–202. doi:10.1146/annurev-anchem-071015-041605
D’Agata, R., Palladino, P., Spoto, G., 2017. Streptavidin-coated gold nanoparticles: critical role of oligonucleotides
on stability and fractal aggregation. Beilstein J. Nanotechnol. 8, 1–11. doi:10.3762/bjnano.8.1
Duan, N., Wu, S., Dai, S., Miao, T., Chen, J., Wang, Z., 2015. Simultaneous detection of pathogenic bacteria using
an aptamer based biosensor and dual fluorescence resonance energy transfer from quantum dots to carbon
nanoparticles. Microchim. Acta 182, 917–923. doi:10.1007/s00604-014-1406-3
Dungchai, W., Chailapakul, O., Henry, C.S., 2010. Use of multiple colorimetric indicators for paper-based
microfluidic devices. Anal. Chim. Acta 674, 227–233. doi:10.1016/j.aca.2010.06.019
Dzantiev, B.B., Byzova, N.A., Urusov, A.E., Zherdev, A. V., 2014. Immunochromatographic methods in food
analysis. TrAC Trends Anal. Chem. 55, 81–93. doi:10.1016/j.trac.2013.11.007
Eissa, S., Zourob, M., 2017. In vitro selection of DNA aptamers targeting β-lactoglobulin and their integration in
graphene-based biosensor for the detection of milk allergen. Biosens. Bioelectron. 91, 169–174.
doi:10.1016/j.bios.2016.12.020
Fang, X.-X., Li, H.-Y., Fang, P., Pan, J.-Z., Fang, Q., 2016. A handheld laser-induced fluorescence detector for
multiple applications. Talanta 150, 135–141. doi:10.1016/J.TALANTA.2015.12.018
Fardim, P., Ferreira, M.M.C., Durán, N., 2005. Determination of Mechanical and Optical Properties of Eucalyptus
Kraft Pulp by NIR Spectrometry and Multivariate Calibration. J. Wood Chem. Technol. 25, 267–279.
doi:10.1080/02773810500366748
FARE, 2017a. Food Allergens - Food Allergy Research and Education [WWW Document]. FARE. URL
https://www.foodallergy.org/allergens (accessed 5.29.17).

104
FARE, 2017b. Facts and Statistics - Food Allergy Research & Education [WWW Document]. URL
https://www.foodallergy.org/facts-and-stats (accessed 8.17.17).
FARE, 2016. Allergic reactions to food -- a range of symptoms | Allercom Allergy Consulting, Inc. [WWW
Document]. URL http://allercom.com/allergic-reactions-to-food-a-range-of-symptoms/ (accessed 8.16.17).
Food and Agriculture Organization of the United Nations, 2017. USDA ERS - Cost Estimates of Foodborne
Illnesses [WWW Document]. USDA. URL https://www.ers.usda.gov/data-products/cost-estimates-of-
foodborne-illnesses/ (accessed 6.8.17).
Gámiz-Gracia, L., Garcı́a-Campaña, A.M., Soto-Chinchilla, J.J., Huertas-Pérez, J.F., González-Casado, A., 2005.
Analysis of pesticides by chemiluminescence detection in the liquid phase. TrAC Trends Anal. Chem. 24,
927–942. doi:10.1016/j.trac.2005.05.009
Gates, K.W., 2015. Food Allergen Testing: Molecular, Immunochemical, and Chromatographic Techniques , by
George Siragakis and Dimosthenis Kizis. J. Aquat. Food Prod. Technol. 24, 632–635.
doi:10.1080/10498850.2015.1058733
GE Healthcare Life Sciences, 2017. Whatman Filters & Sample Collection [WWW Document]. gelifesciences.
URL
http://www.gelifesciences.com/webapp/wcs/stores/servlet/CategoryDisplay?categoryId=3333983&catalogId=
132131&productId=&top=Y&storeId=11756&langId=-1 (accessed 9.4.17).
Geneviève, M., Vieu, C., Carles, R., Zwick, A., Brière, G., Salomé, L., Trévisiol, E., 2007. Biofunctionalization of
gold nanoparticles and their spectral properties. doi:10.1016/j.mee.2007.01.247
Ghaderinezhad, F., Amin, R., Temirel, M., Yenilmez, B., Wentworth, A., Tasoglu, S., 2017. High-throughput rapid-
prototyping of low-cost paper-based microfluidics. Sci. Rep. 7, 3553. doi:10.1038/s41598-017-02931-6
Ghosh, A., Jana, Bikash, Chakraborty, S., Maiti, S., Jana, Biman, Ghosh, H.N., Patra, A., 2017. Exciton Dynamics
and Formation Mechanism of MEH-PPV Polymer-Based Nanostructures. J. Phys. Chem. C 121, 21062–
21072. doi:10.1021/acs.jpcc.7b08336
He, M., Liu, Z., 2013. Paper-Based Microfluidic Device with Upconversion Fluorescence Assay. Anal. Chem. 85,
11691–11694. doi:10.1021/ac403693g
He, Q., Ma, C., Hu, X., Chen, H., 2013. Method for Fabrication of Paper-Based Microfluidic Devices by Alkylsilane
Self-Assembling and UV/O 3 -Patterning. Anal. Chem. 85, 1327–1331. doi:10.1021/ac303138x
Hossain, S.M.Z., Luckham, R.E., McFadden, M.J., Brennan, J.D., 2009a. Reagentless Bidirectional Lateral Flow
Bioactive Paper Sensors for Detection of Pesticides in Beverage and Food Samples. Anal. Chem. 81, 9055–
9064. doi:10.1021/ac901714h
Hossain, S.M.Z., Luckham, R.E., Smith, A.M., Lebert, J.M., Davies, L.M., Pelton, R.H., Filipe, C.D.M., Brennan,
J.D., 2009b. Development of a Bioactive Paper Sensor for Detection of Neurotoxins Using Piezoelectric Inkjet
Printing of Sol−Gel-Derived Bioinks. Anal. Chem. 81, 5474–5483. doi:10.1021/ac900660p
Hossain, S.M.Z., Ozimok, C., Sicard, C., Aguirre, S.D., Ali, M.M., Li, Y., Brennan, J.D., 2012. Multiplexed paper
test strip for quantitative bacterial detection. Anal. Bioanal. Chem. 403, 1567–1576. doi:10.1007/s00216-012-
5975-x
Huang, X., El-Sayed, M.A., 2010. Gold nanoparticles: Optical properties and implementations in cancer diagnosis
and photothermal therapy. J. Adv. Res. 1, 13–28. doi:10.1016/j.jare.2010.02.002
105
Huang, X., Yin, Z., Wu, S., Qi, X., He, Q., Zhang, Q., Yan, Q., Boey, F., Zhang, H., 2011. Graphene-Based
Materials: Synthesis, Characterization, Properties, and Applications. Small 7, 1876–1902.
doi:10.1002/smll.201002009
Hussain, M., Dawson, C., 2013. Economic Impact of Food Safety Outbreaks on Food Businesses. Foods 2, 585–
589. doi:10.3390/foods2040585
J. Kimling, M. Maier, B. Okenve, V. Kotaidis, H. Ballot, and, Plech*, A., 2006. Turkevich Method for Gold
Nanoparticle Synthesis Revisited. doi:10.1021/JP061667W
Jahanshahi-Anbuhi, S., Henry, A., Leung, V., Sicard, C., Pennings, K., Pelton, R., Brennan, J.D., Filipe, C.D.M.,
2014. Paper-based microfluidics with an erodible polymeric bridge giving controlled release and timed flow
shutoff. Lab Chip 14. doi:10.1039/C3LC50762A
Jokerst, J.C., Adkins, J.A., Bisha, B., Mentele, M.M., Goodridge, L.D., Henry, C.S., 2012. Development of a Paper-
Based Analytical Device for Colorimetric Detection of Select Foodborne Pathogens. Anal. Chem. 84, 2900–
2907. doi:10.1021/ac203466y
Jun, J.Y., Nguyen, H.H., Paik, S.-Y.-R., Chun, H.S., Kang, B.-C., Ko, S., 2011. Preparation of size-controlled
bovine serum albumin (BSA) nanoparticles by a modified desolvation method. Food Chem. 127, 1892–1898.
doi:10.1016/j.foodchem.2011.02.040
Kallós, P., Waksman, B.., de Weck, A.., 1978. Quantitative Immunoelectrophoretic Methods as a Tool for the
Analysis and Isolation of Allergens. Chem. Immunol. Allergy 25, 1–62. doi:10.1159/000401700
Kantiani, L., Llorca, M., Sanch?s, J., Farr?, M., Barcel?, D., 2010. Emerging food contaminants: a review. Anal.
Bioanal. Chem. 398, 2413–2427. doi:10.1007/s00216-010-3944-9
Keefe, A.D., Pai, S., Ellington, A., 2010. Aptamers as therapeutics. Nat. Rev. Drug Discov. 9, 537–550.
doi:10.1038/nrd3141
Kim, Y.S., Gu, M.B., 2013. Advances in Aptamer Screening and Small Molecule Aptasensors, in: Advances in
Biochemical Engineering/Biotechnology. pp. 29–67. doi:10.1007/10_2013_225
Koczula, K.M., Gallotta, A., 2016. Lateral flow assays. Essays Biochem. 60, 111–20. doi:10.1042/EBC20150012
Lakhin, A. V, Tarantul, V.Z., Gening, L. V, 2013. Aptamers: problems, solutions and prospects. Acta Naturae 5, 34–
43.
Lakowicz, J., 2006. Quenching of Fluorescence, in: Principles of Fluorescence Spectroscopy. Springer US, Boston,
MA, pp. 277–330. doi:10.1007/978-0-387-46312-4_8
Lam, T., Devadhasan, J.P., Howse, R., Kim, J., 2017. A Chemically Patterned Microfluidic Paper-based Analytical
Device (C-µPAD) for Point-of-Care Diagnostics. Sci. Rep. 7, 1188. doi:10.1038/s41598-017-01343-w
Lee, J., Kim, J., Kim, S., Min, D.-H., 2016. Biosensors based on graphene oxide and its biomedical application.
Adv. Drug Deliv. Rev. 105, 275–287. doi:10.1016/j.addr.2016.06.001
Lee, W., Gomez, F., 2017. Experimental Analysis of Fabrication Parameters in the Development of Microfluidic
Paper-Based Analytical Devices (µPADs). Micromachines 8, 99. doi:10.3390/mi8040099
Li, B., Li, Q., Mo, J., Dai, H., 2017. Drug-Loaded Polymeric Nanoparticles for Cancer Stem Cell Targeting. Front.
Pharmacol. 8, 51. doi:10.3389/fphar.2017.00051

106
Li, C., Yang, Y., Zhang, B., Chen, G., Wang, Z., Li, G., 2014. Conjugation of Graphene Oxide with DNA-Modified
Gold Nanoparticles to Develop a Novel Colorimetric Sensing Platform. Part. Part. Syst. Charact. 31, 201–208.
doi:10.1002/ppsc.201300200
Li, H., Liu, C., Wang, D., Zhang, C., 2018. Programmable fluid transport on photolithographically micropatterned
cloth devices: Towards the development of facile, multifunctional colorimetric diagnostic platforms. Sensors
Actuators B Chem. 255, 2416–2430. doi:10.1016/j.snb.2017.08.215
Li, S., Aphale, A.N., Macwan, I.G., Patra, P.K., Gonzalez, W.G., Miksovska, J., Leblanc, R.M., 2012. Graphene
Oxide as a Quencher for Fluorescent Assay of Amino Acids, Peptides, and Proteins. ACS Appl. Mater.
Interfaces 4, 7069–7075. doi:10.1021/am302704a
Lim, S., Koo, O.K., You, Y.S., Lee, Y.E., Kim, M.-S., Chang, P.-S., Kang, D.H., Yu, J.-H., Choi, Y.J.,
Gunasekaran, S., 2012. Enhancing Nanoparticle-Based Visible Detection by Controlling the Extent of
Aggregation. Sci. Rep. 2, 456. doi:10.1038/srep00456
Lisowski, P., Zarzycki, P.K., 2013. Microfluidic Paper-Based Analytical Devices (μPADs) and Micro Total
Analysis Systems (μTAS): Development, Applications and Future Trends. Chromatographia 76, 1201–1214.
doi:10.1007/s10337-013-2413-y
Liu, W., Kou, J., Xing, H., Li, B., 2014. Paper-based chromatographic chemiluminescence chip for the detection of
dichlorvos in vegetables. Biosens. Bioelectron. 52, 76–81. doi:10.1016/j.bios.2013.08.024
Low, A., Bansal, V., 2010. A visual tutorial on the synthesis of gold nanoparticles. Biomed. Imaging Interv. J. 6, e9.
doi:10.2349/biij.6.1.e9
Lu, Z., Chen, X., Wang, Y., Zheng, X., Li, C.M., 2015. Aptamer based fluorescence recovery assay for aflatoxin B1
using a quencher system composed of quantum dots and graphene oxide. Microchim. Acta 182, 571–578.
doi:10.1007/s00604-014-1360-0
Luckham, R.E., Brennan, John D., Ghaffarinejad, A., Sindi, H., Whitesides, G.M., Mayer, S., Brook, M.A.,
Brennan, J. D., 2010. Bioactive paper dipstick sensors for acetylcholinesterase inhibitors based on sol–
gel/enzyme/gold nanoparticle composites. Analyst 135, 2028. doi:10.1039/c0an00283f
Määttänen, A., Vanamo, U., Ihalainen, P., Pulkkinen, P., Tenhu, H., Bobacka, J., Peltonen, J., 2013. A low-cost
paper-based inkjet-printed platform for electrochemical analyses. Sensors Actuators B Chem. 177, 153–162.
doi:10.1016/j.snb.2012.10.113
Mahato, K., Srivastava, A., Chandra, P., 2017. Paper based diagnostics for personalized health care: Emerging
technologies and commercial aspects. Biosens. Bioelectron. 96, 246–259. doi:10.1016/j.bios.2017.05.001
Marques, A.C., Santos, L., Costa, M.N., Dantas, J.M., Duarte, P., Gonçalves, A., Martins, R., Salgueiro, C.A.,
Fortunato, E., 2015. Office paper platform for bioelectrochromic detection of electrochemically active bacteria
using tungsten trioxide nanoprobes. Sci. Rep. 5, 9910. doi:10.1038/srep09910
Martinez, A.W., Phillips, S.T., Butte, M.J., Whitesides, G.M., 2007. Patterned Paper as a Platform for Inexpensive,
Low-Volume, Portable Bioassays. Angew. Chemie Int. Ed. 46, 1318–1320. doi:10.1002/anie.200603817
Martinez, A.W., Phillips, S.T., Whitesides, G.M., Carrilho, E., 2010. Diagnostics for the Developing World:
Microfluidic Paper-Based Analytical Devices. Anal. Chem. 82, 3–10. doi:10.1021/ac9013989
McNerney, R., 2015. Diagnostics for Developing Countries. Diagnostics (Basel, Switzerland) 5, 200–9.
doi:10.3390/diagnostics5020200
107
Mettakoonpitak, J., Boehle, K., Nantaphol, S., Teengam, P., Adkins, J.A., Srisa-Art, M., Henry, C.S., 2016.
Electrochemistry on Paper-based Analytical Devices: A Review. Electroanalysis 28, 1420–1436.
doi:10.1002/elan.201501143
Mie, G., 1908. Beiträge zur Optik trüber Medien, speziell kolloidaler Metallösungen. Ann. Phys. 330, 377–445.
doi:10.1002/andp.19083300302
Mohammadi, S., Maeki, M., Mohamadi, R.M., Ishida, A., Tani, H., Tokeshi, M., Zeng, F., Yager, P., 2015. An
instrument-free, screen-printed paper microfluidic device that enables bio and chemical sensing. Analyst 140,
6493–6499. doi:10.1039/C5AN00909J
Mohammed, M.I., Haswell, S., Gibson, I., 2015. Lab-on-a-chip or Chip-in-a-lab: Challenges of Commercialization
Lost in Translation. Procedia Technol. 20, 54–59. doi:10.1016/j.protcy.2015.07.010
Mohan, V.B., Lau, K., Hui, D., Bhattacharyya, D., 2018. Graphene-based materials and their composites: A review
on production, applications and product limitations. Compos. Part B Eng. 142, 200–220.
doi:10.1016/j.compositesb.2018.01.013
Murdock, R.C., Shen, L., Griffin, D.K., Kelley-Loughnane, N., Papautsky, I., Hagen, J.A., 2013. Optimization of a
Paper-Based ELISA for a Human Performance Biomarker. Anal. Chem. 85, 11634–11642.
doi:10.1021/ac403040a
Nambiar, S., Yeow, J.T.W., 2011. Conductive polymer-based sensors for biomedical applications. Biosens.
Bioelectron. 26, 1825–1832. doi:10.1016/J.BIOS.2010.09.046
Nan, Z., Hao, C., Ye, X., Feng, Y., Sun, R., 2019. Interaction of graphene oxide with bovine serum albumin: A
fluorescence quenching study. Spectrochim. Acta Part A Mol. Biomol. Spectrosc. 210, 348–354.
doi:10.1016/j.saa.2018.11.028
Natale, M., Bisson, C., Monti, G., Peltran, A., Perono Garoffo, L., Valentini, S., Fabris, C., Bertino, E., Coscia, A.,
Conti, A., 2004. Cow’s milk allergens identification by two-dimensional immunoblotting and mass
spectrometry. Mol. Nutr. Food Res. 48, 363–369. doi:10.1002/mnfr.200400011
NEOGEN, 2017a. BioKits Peanut Assay Kit [WWW Document]. NEOGEN. URL
http://foodsafety.neogen.com/en/biokits-peanut-assay-kit (accessed 9.4.17).
NEOGEN, 2017b. BioKits BLG Assay Kit [WWW Document]. NEGOEN. URL
http://foodsafety.neogen.com/en/biokits-blg-assay-kit (accessed 9.4.17).
NEOGEN, 2017c. Veratox® for Crustacea [WWW Document]. NEOGEN. URL
http://foodsafety.neogen.com/en/veratox-crustacea#documents (accessed 9.4.17).
Nie, Z., Deiss, F., Liu, X., Akbulut, O., Whitesides, G.M., 2010a. Integration of paper-based microfluidic devices
with commercial electrochemical readers. Lab Chip 10, 3163. doi:10.1039/c0lc00237b
Nie, Z., Nijhuis, C.A., Gong, J., Chen, X., Kumachev, A., Martinez, A.W., Narovlyansky, M., Whitesides, G.M.,
2010b. Electrochemical sensing in paper-based microfluidic devices. Lab Chip 10, 477–483.
doi:10.1039/B917150A
Noh, H., Phillips, S.T., 2010. Metering the Capillary-Driven Flow of Fluids in Paper-Based Microfluidic Devices.
Anal. Chem. 82, 4181–4187. doi:10.1021/ac100431y
Olkkonen, J., Lehtinen, K., Erho, T., 2010. Flexographically Printed Fluidic Structures in Paper. Anal. Chem. 82,

108
10246–10250. doi:10.1021/ac1027066
Pai, N.P., Vadnais, C., Denkinger, C., Engel, N., Pai, M., 2012. Point-of-Care Testing for Infectious Diseases:
Diversity, Complexity, and Barriers in Low- And Middle-Income Countries. PLoS Med. 9, e1001306.
doi:10.1371/journal.pmed.1001306
Park, J.S., Goo, N.-I., Kim, D.-E., 2014. Mechanism of DNA Adsorption and Desorption on Graphene Oxide.
Langmuir 30, 12587–12595. doi:10.1021/la503401d
Pascal, M., Grishina, G., Yang, A.C., Sánchez-García, S., Lin, J., Towle, D., Ibañez, M.D., Sastre, J., Sampson,
H.A., Ayuso, R., 2015. Molecular Diagnosis of Shrimp Allergy: Efficiency of Several Allergens to Predict
Clinical Reactivity. J. Allergy Clin. Immunol. Pract. 3, 521-529.e10. doi:10.1016/j.jaip.2015.02.001
Pelton, R., 2009. Bioactive paper provides a low-cost platform for diagnostics. TrAC Trends Anal. Chem. 28, 925–
942. doi:10.1016/j.trac.2009.05.005
Pollitt, M.J., Buckton, G., Piper, R., Brocchini, S., Athwal, D., Walters, C., Burton, D.R., Harding, S.E.,
Engelborghs, Y., Borghs, G., 2015. Measuring antibody coatings on gold nanoparticles by optical
spectroscopy. RSC Adv. 5, 24521–24527. doi:10.1039/C4RA15661G
Prescott, S.L., Pawankar, R., Allen, K.J., Campbell, D.E., Sinn, J.K., Fiocchi, A., Ebisawa, M., Sampson, H.A.,
Beyer, K., Lee, B.-W., 2013. A global survey of changing patterns of food allergy burden in children.
Qi, J., Li, B., Wang, X., Zhang, Z., Wang, Z., Han, J., Chen, L., 2017. Three-dimensional paper-based microfluidic
chip device for multiplexed fluorescence detection of Cu 2+ and Hg 2+ ions based on ion imprinting
technology. Sensors Actuators B Chem. 251, 224–233. doi:10.1016/j.snb.2017.05.052
r-Biopharm, 2017a. RIDASCREEN®FAST Peanut - R-Biopharm AG [WWW Document]. r-Biopharm. URL
http://www.r-biopharm.com/products/food-feed-analysis/allergens/nuts/item/ridascreenfast-peanut (accessed
9.4.17).
r-Biopharm, 2017b. RIDASCREEN®FAST Crustacean - R-Biopharm AG [WWW Document]. r-Biopharm. URL
http://www.r-biopharm.com/products/food-feed-analysis/allergens/crustaceans/item/ridascreenfast-crustacean
(accessed 9.4.17).
r-Biopharm, n.d. RIDASCREEN® β-Lactoglobulin - R-Biopharm AG [WWW Document]. r-Biopharm. URL
http://www.r-biopharm.com/products/food-feed-analysis/allergens/milk/item/ridascreen-beta-lactoglobulin
(accessed 9.4.17).
Ran, C., Wang, M., Gao, W., Ding, J., Shi, Y., Song, X., Chen, H., Ren, Z., 2012. Study on Photoluminescence
Quenching and Photostability Enhancement of MEH-PPV by Reduced Graphene Oxide. J. Phys. Chem. C
116, 23053–23060. doi:10.1021/jp306631y
Roberts, J.C., 1996. The Chemistry of Paper, RSC Paperbacks. Royal Society of Chemistry, Cambridge.
doi:10.1039/9781847552068
Santhiago, M., Nery, E.W., Santos, G.P., Kubota, L.T., 2014. Microfluidic paper-based devices for bioanalytical
applications. Bioanalysis 6, 89–106. doi:10.4155/bio.13.296
Scallan, E., Hoekstra, R.M., Angulo, F.J., Tauxe, R. V, Widdowson, M.-A., Roy, S.L., Jones, J.L., Griffin, P.M.,
2011. Foodborne Illness Acquired in the United States—Major Pathogens. Emerg. Infect. Dis. 17, 7–15.
doi:10.3201/eid1701.P11101

109
Schneider, C.A., Rasband, W.S., Eliceiri, K.W., 2012. NIH Image to ImageJ: 25 years of image analysis. Nat Meth
9, 671–675.
Scida, K., Li, B., Ellington, A.D., Crooks, R.M., 2013. DNA Detection Using Origami Paper Analytical Devices.
Anal. Chem. 85, 9713–9720. doi:10.1021/ac402118a
Sechi, D., Greer, B., Johnson, J., Hashemi, N., 2013. Three-Dimensional Paper-Based Microfluidic Device for
Assays of Protein and Glucose in Urine. Anal. Chem. 85, 10733–10737. doi:10.1021/ac4014868
Seok, Y., Joung, H.-A., Byun, J.-Y., Jeon, H.-S., Shin, S.J., Kim, S., Shin, Y.-B., Han, H.S., Kim, M.-G., 2017. A
Paper-Based Device for Performing Loop-Mediated Isothermal Amplification with Real-Time Simultaneous
Detection of Multiple DNA Targets. Theranostics 7, 2220–2230. doi:10.7150/thno.18675
Sharma, S., Zapatero-Rodríguez, J., Estrela, P., O’Kennedy, R., 2015. Point-of-Care Diagnostics in Low Resource
Settings: Present Status and Future Role of Microfluidics. Biosensors 5, 577–601. doi:10.3390/bios5030577
Shin, Y.-H.H., Barnett, J.Z., Song, E., Gutierrez-Wing, M.T., Rusch, K.A., Choi, J.-W.W., 2015. A portable
fluorescent sensor for on-site detection of microalgae. Microelectron. Eng. 144, 6–11.
doi:10.1016/j.mee.2015.01.005
Silveira, C., Monteiro, T., Almeida, M., 2016. Biosensing with Paper-Based Miniaturized Printed Electrodes–A
Modern Trend. Biosensors 6, 51. doi:10.3390/bios6040051
Sinha, R., Ganesana, M., Andreescu, S., Stanciu, L., 2010. AChE biosensor based on zinc oxide sol–gel for the
detection of pesticides. Anal. Chim. Acta 661, 195–199. doi:10.1016/j.aca.2009.12.020
Smith, W., 2013. Adverse drug reactions – Allergy? Side-effect? Intolerance? Aust. Fam. Physician 42, 12–16.
Su, W., Cook, B.S., Fang, Y., Tentzeris, M.M., 2016. Fully inkjet-printed microfluidics: a solution to low-cost rapid
three-dimensional microfluidics fabrication with numerous electrical and sensing applications. Sci. Rep. 6,
35111. doi:10.1038/srep35111
Su, Y., Ma, S., Jiang, K., Han, X., 2015. CdTe-paper-based Visual Sensor for Detecting Methyl Viologen. Chinese
J. Chem. 33, 446–450. doi:10.1002/cjoc.201400715
Suk, J.W., Piner, R.D., An, J., Ruoff, R.S., 2010. Mechanical Properties of Monolayer Graphene Oxide. ACS Nano
4, 6557–6564. doi:10.1021/nn101781v
Sung, Y., Campa, F., Shih, W.-C., 2017. Open-source do-it-yourself multi-color fluorescence smartphone
microscopy. Biomed. Opt. Express 8, 5075. doi:10.1364/BOE.8.005075
Suvarnaphaet, P., Pechprasarn, S., 2017. Graphene-Based Materials for Biosensors: A Review. Sensors 17, 2161.
doi:10.3390/s17102161
Szymanski, C., Wu, C., Hooper, J., Salazar, M.A., Perdomo, A., Dukes, A., McNeill, J., 2005. Single Molecule
Nanoparticles of the Conjugated Polymer MEH−PPV, Preparation and Characterization by Near-Field
Scanning Optical Microscopy. J. Phys. Chem. B 109, 8543–8546. doi:10.1021/jp051062k
Taylor, A.D., Ladd, J., Yu, Q., Chen, S., Homola, J., Jiang, S., 2006. Quantitative and simultaneous detection of four
foodborne bacterial pathogens with a multi-channel SPR sensor. Biosens. Bioelectron. 22, 752–758.
doi:10.1016/j.bios.2006.03.012
Tenda, K., Ota, R., Yamada, K., Henares, T., Suzuki, K., Citterio, D., 2016. High-Resolution Microfluidic Paper-

110
Based Analytical Devices for Sub-Microliter Sample Analysis. Micromachines 7, 80. doi:10.3390/mi7050080
Thomsen, V., Schatzlein, D., Mercuro, D., 2003. Limits of Detection in Spectroscopy. Spectroscopy 18, 112–114.
Tran, D.T., Knez, K., Janssen, K.P., Pollet, J., Spasic, D., Lammertyn, J., 2013. Selection of aptamers against Ara h
1 protein for FO-SPR biosensing of peanut allergens in food matrices. Biosens. Bioelectron. 43, 245–251.
doi:10.1016/J.BIOS.2012.12.022
Turkevich, J., Stevenson, P.C., Hillier, J., 1951. A study of the nucleation and growth processes in the synthesis of
colloidal gold. Discuss. Faraday Soc. 11, 55. doi:10.1039/df9511100055
U.S Department of Health and Human Services, National Center for Health Statistics, 2015. Summary Health
Statistics: National Health Interview Survey, CDC. Atlanta.
United Nations, 1948. Universal Declaration of Human Rights | United Nations. United Nations, Paris.
United Nations Department of Economic and Social Affairs, 2015. World population projected to reach 9.7 billion
by 2050 | UN DESA | United Nations Department of Economic and Social Affairs [WWW Document]. United
Nations. URL http://www.un.org/en/development/desa/news/population/2015-report.html (accessed 6.27.17).
United Nations Department of Economic and Social Affairs, 2014. World Urbanization Prospects: The 2014
Revision. New York.
Valeur, B., Berberan-Santos, M.N., 2013. Molecular Fluorescence : principles and applications. Wiley-VCH.
van Hengel, A.J., 2007. Food allergen detection methods and the challenge to protect food-allergic consumers. Anal.
Bioanal. Chem. 389, 111–118. doi:10.1007/s00216-007-1353-5
Vasilescu, A., Nunes, G., Hayat, A., Latif, U., Marty, J.-L., 2016. Electrochemical Affinity Biosensors Based on
Disposable Screen-Printed Electrodes for Detection of Food Allergens. Sensors 16, 1863.
doi:10.3390/s16111863
Wang, D., Chen, J., Nugen, S.R., 2017. Electrochemical Detection of Escherichia coli from Aqueous Samples Using
Engineered Phages. Anal. Chem. 89, 1650–1657. doi:10.1021/acs.analchem.6b03752
Wang, Y., Duncan, T. V, 2017. Nanoscale sensors for assuring the safety of food products. Curr. Opin. Biotechnol.
44, 74–86. doi:10.1016/j.copbio.2016.10.005
Wang, Y., Li, Z., Wang, J., Li, J., Lin, Y., 2011. Graphene and graphene oxide: biofunctionalization and
applications in biotechnology. Trends Biotechnol. 29, 205–212. doi:10.1016/j.tibtech.2011.01.008
Weng, X., Neethirajan, S., 2017a. Paper based microfluidic aptasensor for food safety. doi:10.1101/162438
Weng, X., Neethirajan, S., 2017b. Paper-based microfluidic aptasensor for food safety. J. Food Saf. e12412.
doi:10.1111/jfs.12412
Weng, X., Neethirajan, S., 2016. A microfluidic biosensor using graphene oxide and aptamer-functionalized
quantum dots for peanut allergen detection. Biosens. Bioelectron. 85, 649–656.
doi:10.1016/j.bios.2016.05.072
Williams, R.M., 1996. Introduction to Electron Transfer Electron Transfer. Quantum 5–6.
doi:10.13140/RG.2.2.16547.30244

111
Wolfgang Haiss, *,†, ‡, Nguyen T. K. Thanh, †, ‡, Jenny Aveyard, † and, Fernig‡, D.G., 2007. Determination of
Size and Concentration of Gold Nanoparticles from UV−Vis Spectra. Anal. Chem. 79, 4215–4221.
doi:10.1021/AC0702084
Wong, R.C., Tse, H.Y., 2009. Lateral Flow Immunoassay. Humana Press, Totowa, NJ. doi:10.1007/978-1-59745-
240-3
World Allergy Organization, 2011. WAO White Book on Allergy. Milwaukee.
World Heath Organization (WHO), 2015. WHO ESTIMATES OF THE GLOBAL BURDEN OF FOODBORNE
DISEASES. Geneva.
Wright, A.K., Thompson, M.R., 1975. Hydrodynamic structure of bovine serum albumin determined by transient
electric birefringence. Biophys. J. 15, 137–141. doi:10.1016/S0006-3495(75)85797-3
Wu, M., Kempaiah, R., Huang, P.-J.J., Maheshwari, V., Liu, J., 2011. Adsorption and Desorption of DNA on
Graphene Oxide Studied by Fluorescently Labeled Oligonucleotides. Langmuir 27, 2731–2738.
doi:10.1021/la1037926
Xia, Y., Si, J., Li, Z., 2016. Fabrication techniques for microfluidic paper-based analytical devices and their
applications for biological testing: A review. Biosens. Bioelectron. 77, 774–789.
doi:10.1016/j.bios.2015.10.032
Xu, H., Chen, J., Birrenkott, J., Zhao, J.X., Takalkar, S., Baryeh, K., Liu, G., 2014. Gold-Nanoparticle-Decorated
Silica Nanorods for Sensitive Visual Detection of Proteins. Anal. Chem. 86, 7351–7359.
doi:10.1021/ac502249f
Xu, H., Duan, C.-F., Lai, C.-Z., Lian, M., Zhang, Z.-F., Liu, L.-J., Cui, H., 2006. Inhibition and enhancement by
organic compounds of luminol–KIO4–H2O2 chemiluminescence. Luminescence 21, 195–201.
doi:10.1002/bio.905
Xu, J., Zhou, Y., Cheng, G., Liu, S., Dong, M., Huang, C., 2015. ‘Imperfect’ conjugated polymer nanoparticles from
MEH-PPV for bioimaging and Fe(III) sensing. Luminescence 30, 451–456. doi:10.1002/bio.2759
Xu, Y., Enomae, T., Fan, X.Q., Jiang, X.P., Liu, S., Garnier, G., Shen, W., 2014. Paper substrate modification for
rapid capillary flow in microfluidic paper-based analytical devices. RSC Adv. 4, 12867–12872.
doi:10.1039/C4RA00434E
Yamada, K., Henares, T.G., Suzuki, K., Citterio, D., 2015. Paper-Based Inkjet-Printed Microfluidic Analytical
Devices. Angew. Chemie Int. Ed. 54, 5294–5310. doi:10.1002/anie.201411508
Yetisen, A.K., Akram, M.S., Lowe, C.R., 2013. Paper-based microfluidic point-of-care diagnostic devices. Lab Chip
13, 2210. doi:10.1039/c3lc50169h
Yu, J., Ge, L., Huang, J., Wang, S., Ge, S., Striehl, P., Jain, N., Prentiss, M., Whitesides, G.M., Mazzali, M., 2011.
Microfluidic paper-based chemiluminescence biosensor for simultaneous determination of glucose and uric
acid. Lab Chip 11, 1286. doi:10.1039/c0lc00524j
Zhang, Y., Wu, Q., Wei, X., Zhang, J., Mo, S., 2017. DNA aptamer for use in a fluorescent assay for the shrimp
allergen tropomyosin. Microchim. Acta 184, 633–639. doi:10.1007/s00604-016-2042-x
Zhong, Z.W., Wang, Z.P., Huang, G.X.D., 2012. Investigation of wax and paper materials for the fabrication of
paper-based microfluidic devices. Microsyst. Technol. 18, 649–659. doi:10.1007/s00542-012-1469-1

112
Zhou, J., Rossi, J., 2016. Aptamers as targeted therapeutics: current potential and challenges. Nat. Rev. Drug
Discov. 16, 181–202. doi:10.1038/nrd.2016.199
Zhu, X., Xiong, S., Zhang, J., Zhang, X., Tong, X., Kong, S., 2018. Improving paper-based ELISA performance
through covalent immobilization of antibodies. Sensors Actuators B Chem. 255, 598–604.
doi:10.1016/j.snb.2017.08.090